-
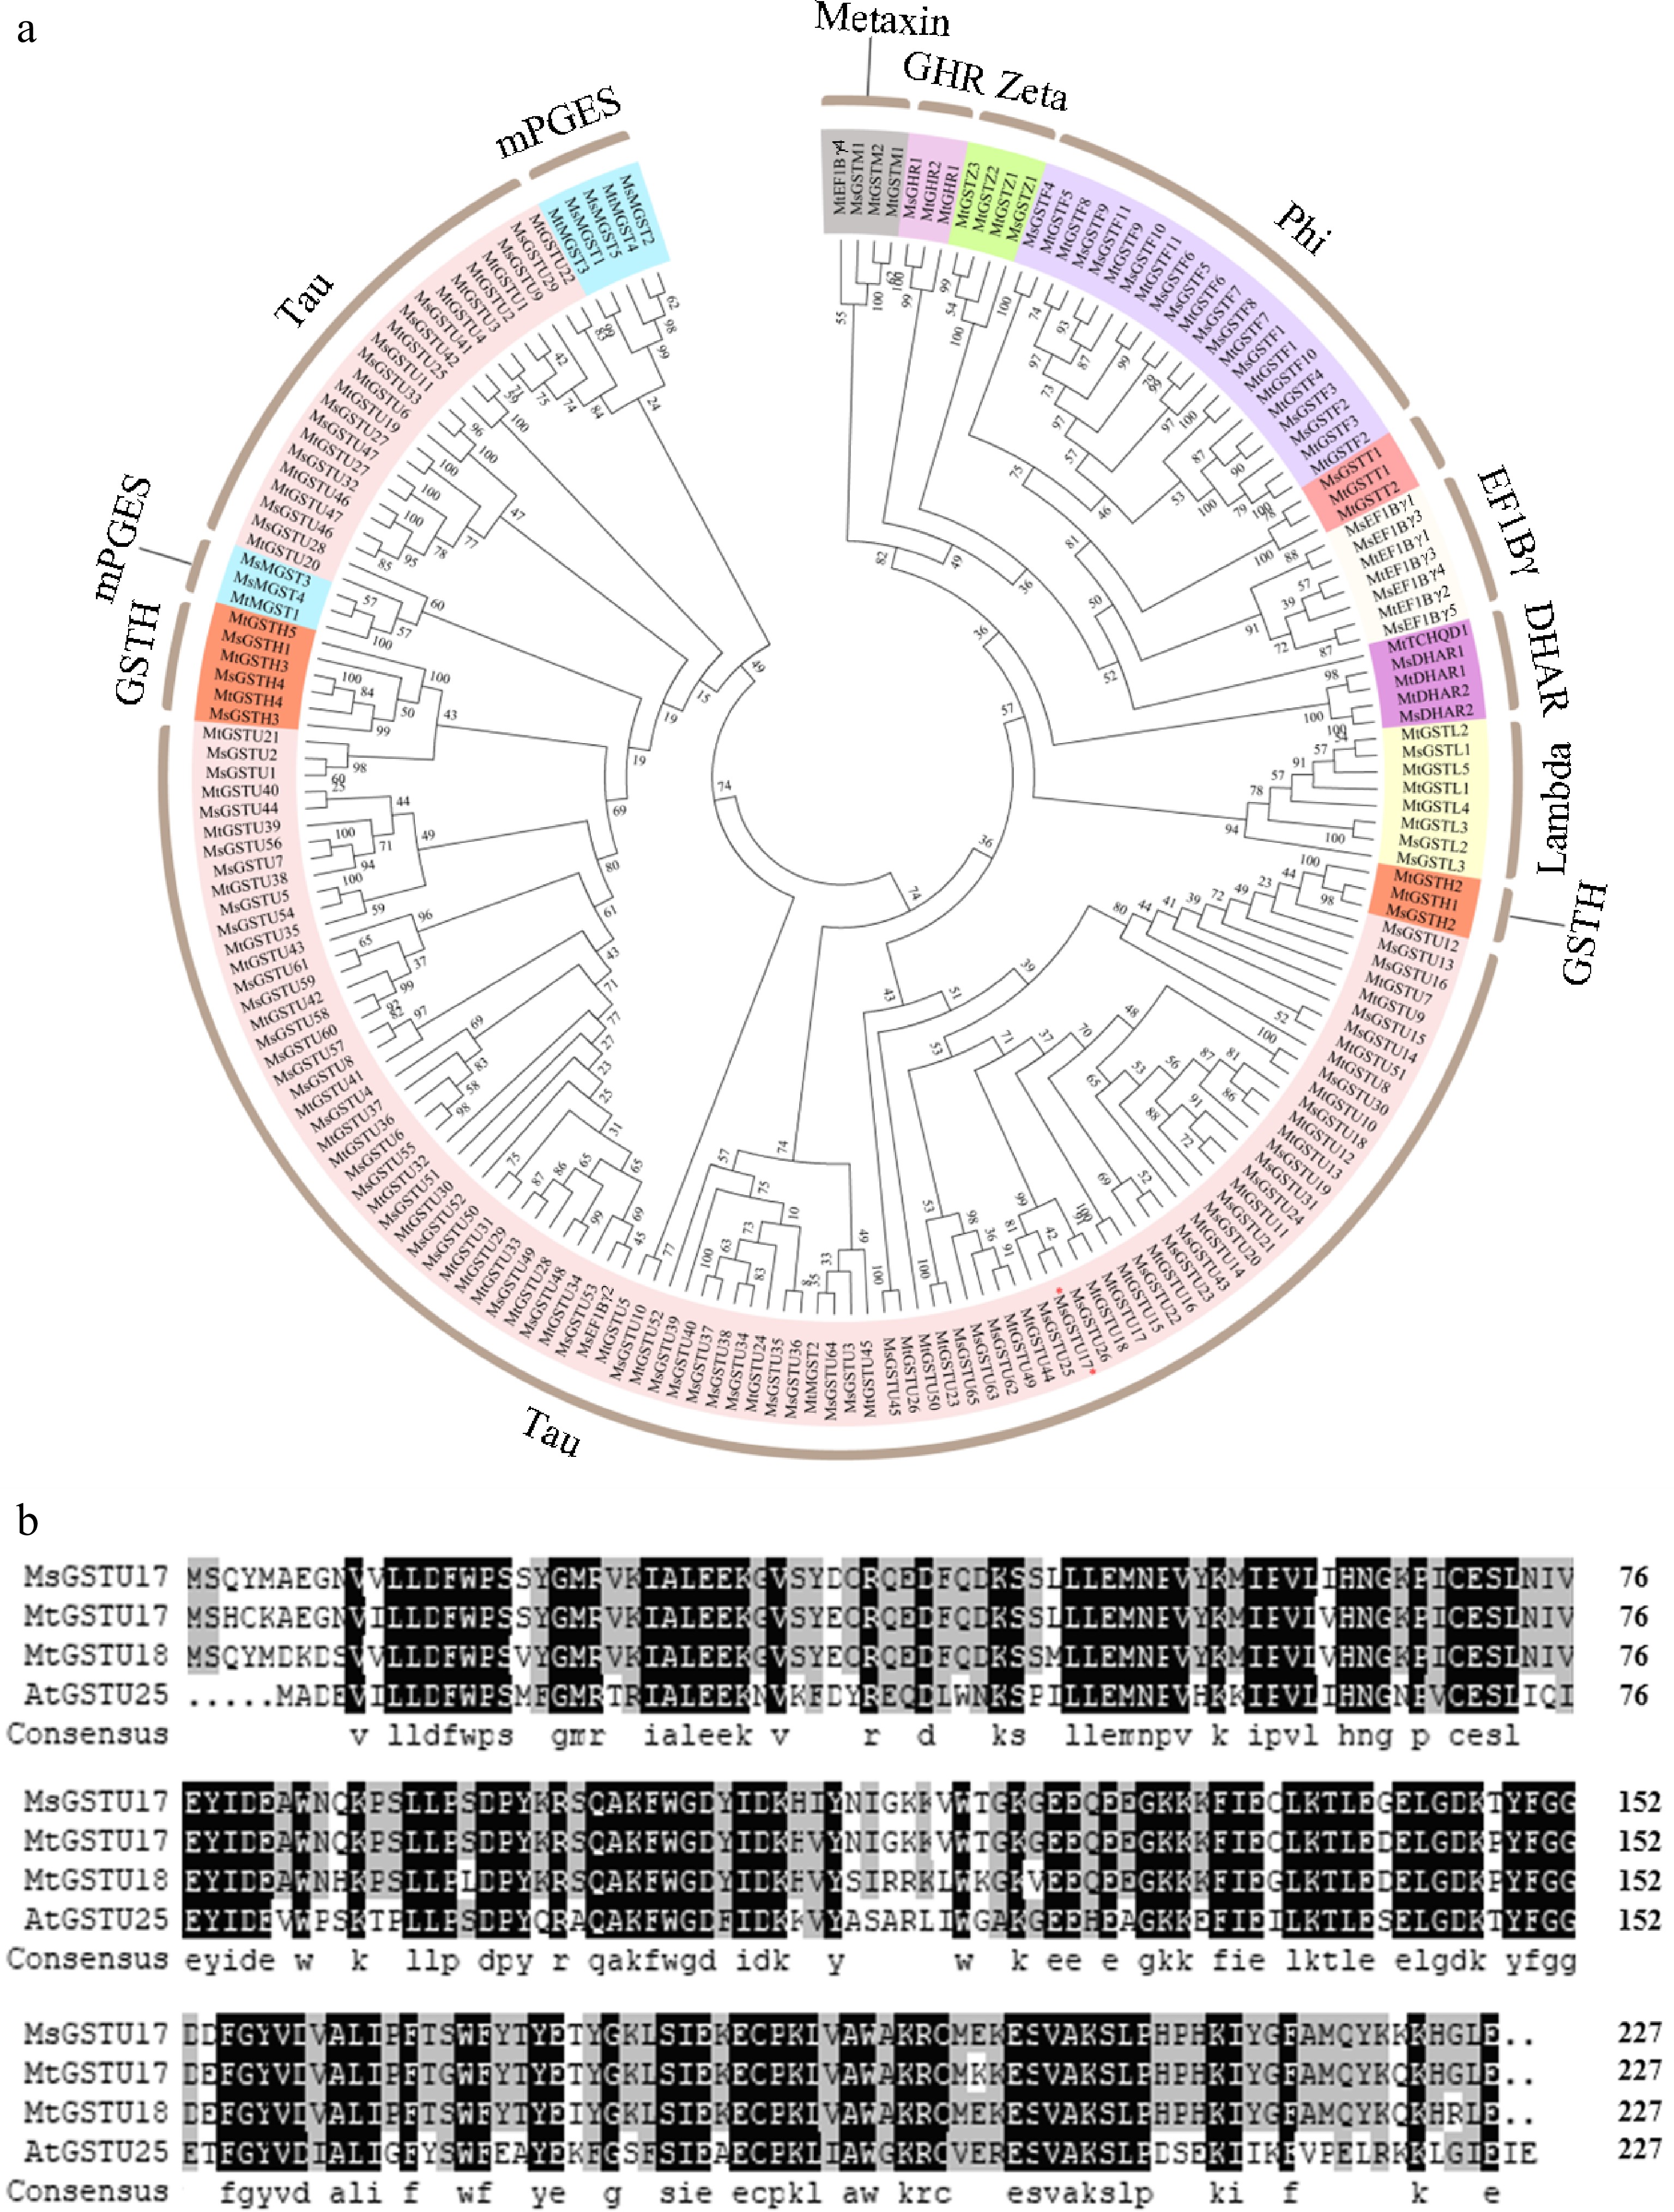
Figure 1.
Phylogenetic evaluations and alignments of multiple GST sequences from various plant species were performed. (a) Phylogenetic tree of GSTs constructed based on Medicago truncatula and alfalfa. (b) Multiple sequence alignment of MsGSTU17, MtGSTU17, MtGSTU18, and AtGSTU25 was performed. Those amino acids which were the same are distinguished by a black background, while those with a similarity of ≥ 75% are represented in gray.
-
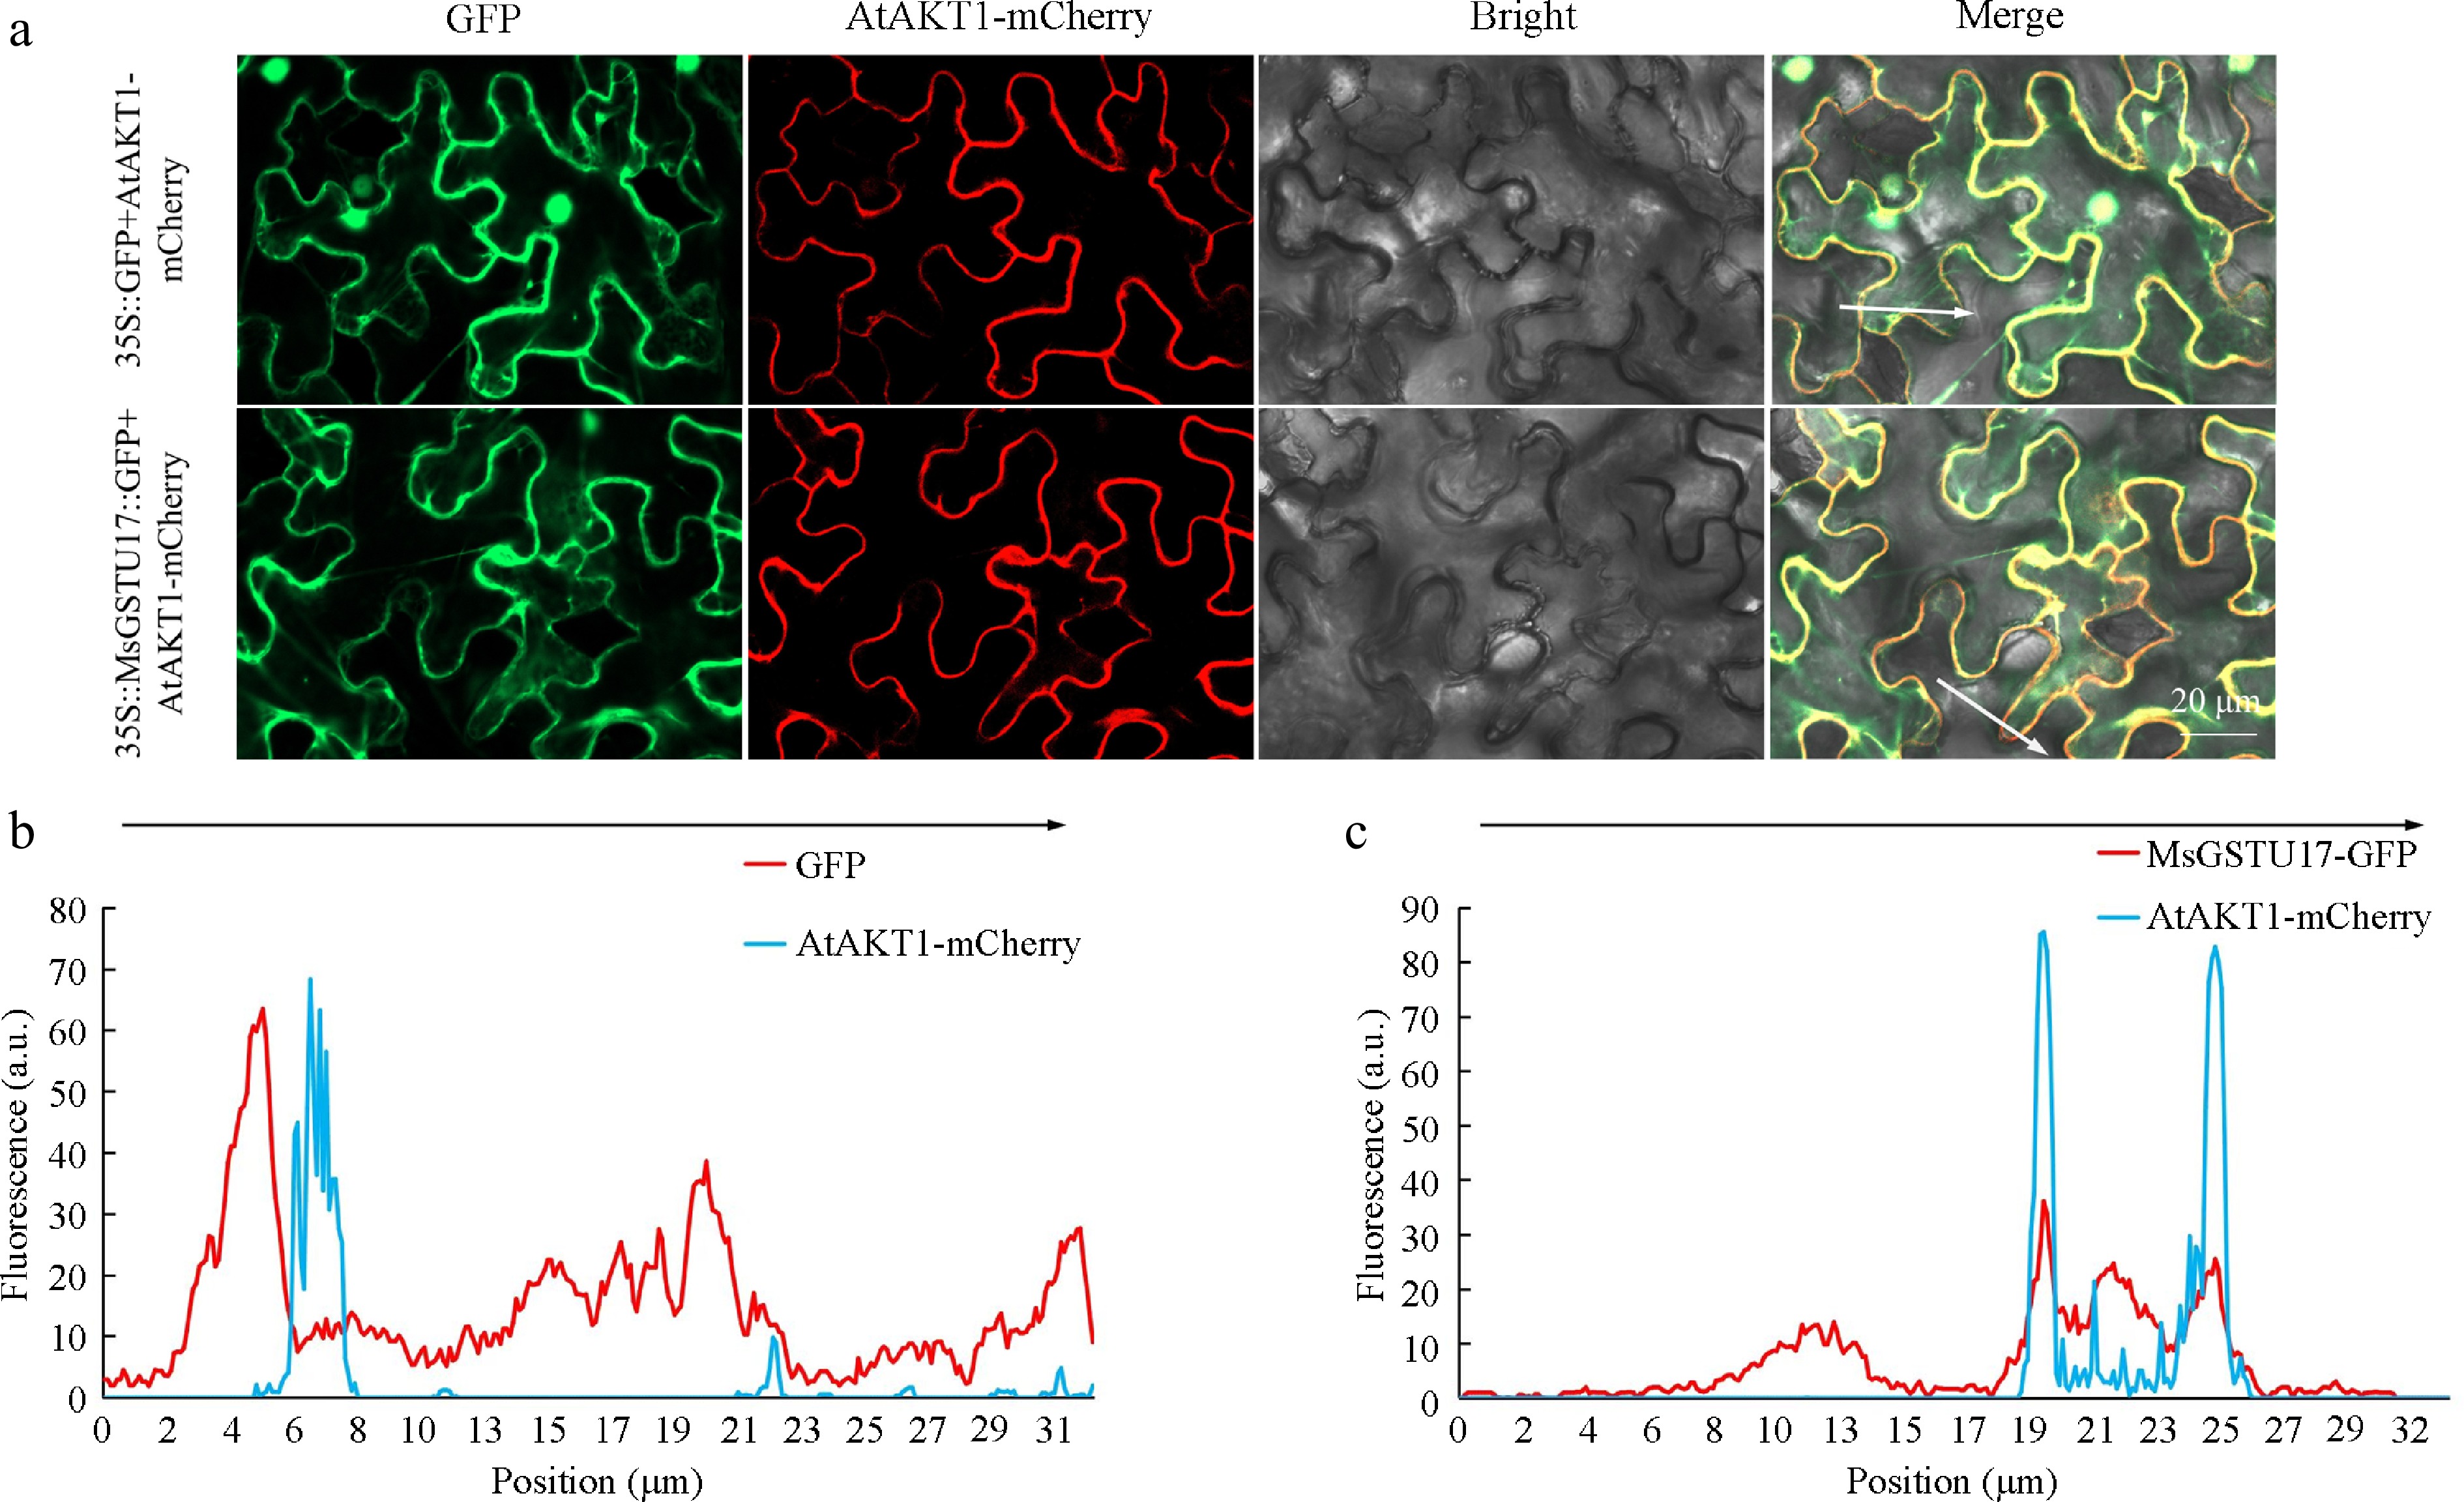
Figure 2.
Subcellular localization analysis of MsGSTU17. (a) The study evaluated the colocalization of MsGSTU17-GFP and AtAKT1-mCherry in the context of tobacco leaf tissue. Presented are representative laser-scanning photographs illustrating the fluorescence of GFP, the fluorescence of mCherry, the bright field, and an overlay combining all three. The fluorescence intensities (in arbitrary units) that crossed the tobacco leaf cell (indicated by the white line) along the arrow in (b) 35S::GFP, and (c) MsGSTU17-GFP were analyzed using ImageJ software. Scale bars = 20 μm.
-
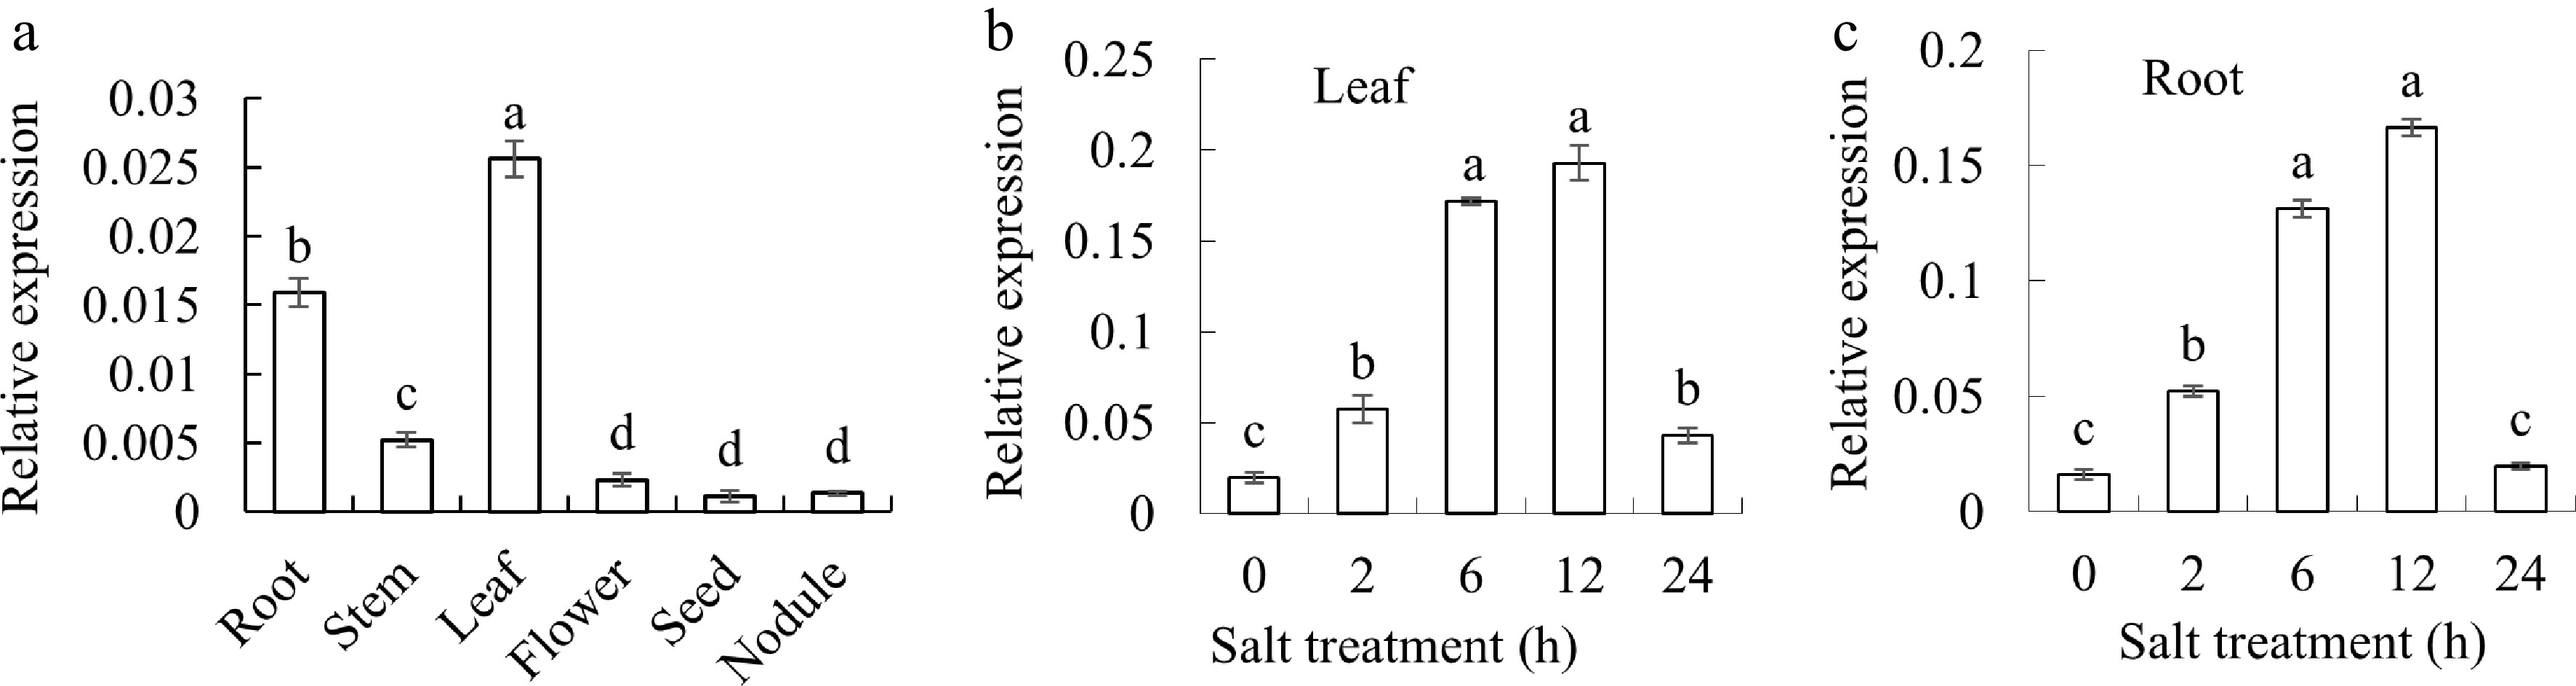
Figure 3.
Analyzing the expression profile of MsGSTU17 gene. (a) Investigating the expression patterns of MsGSTU17 across diverse tissues of Arabidopsis, encompassing roots, stems, leaves, flowers, seeds, and nodules. Under conditions of salt stress, a quantitative assessment of MsGSTU17 expression was conducted in both (b) leaves, and (c) roots. The mean values with their standard deviations are depicted in the bar charts (n = 3), at the significance level of p < 0.05, bars on the chart that bear the same letter indicate no statistically differences.
-
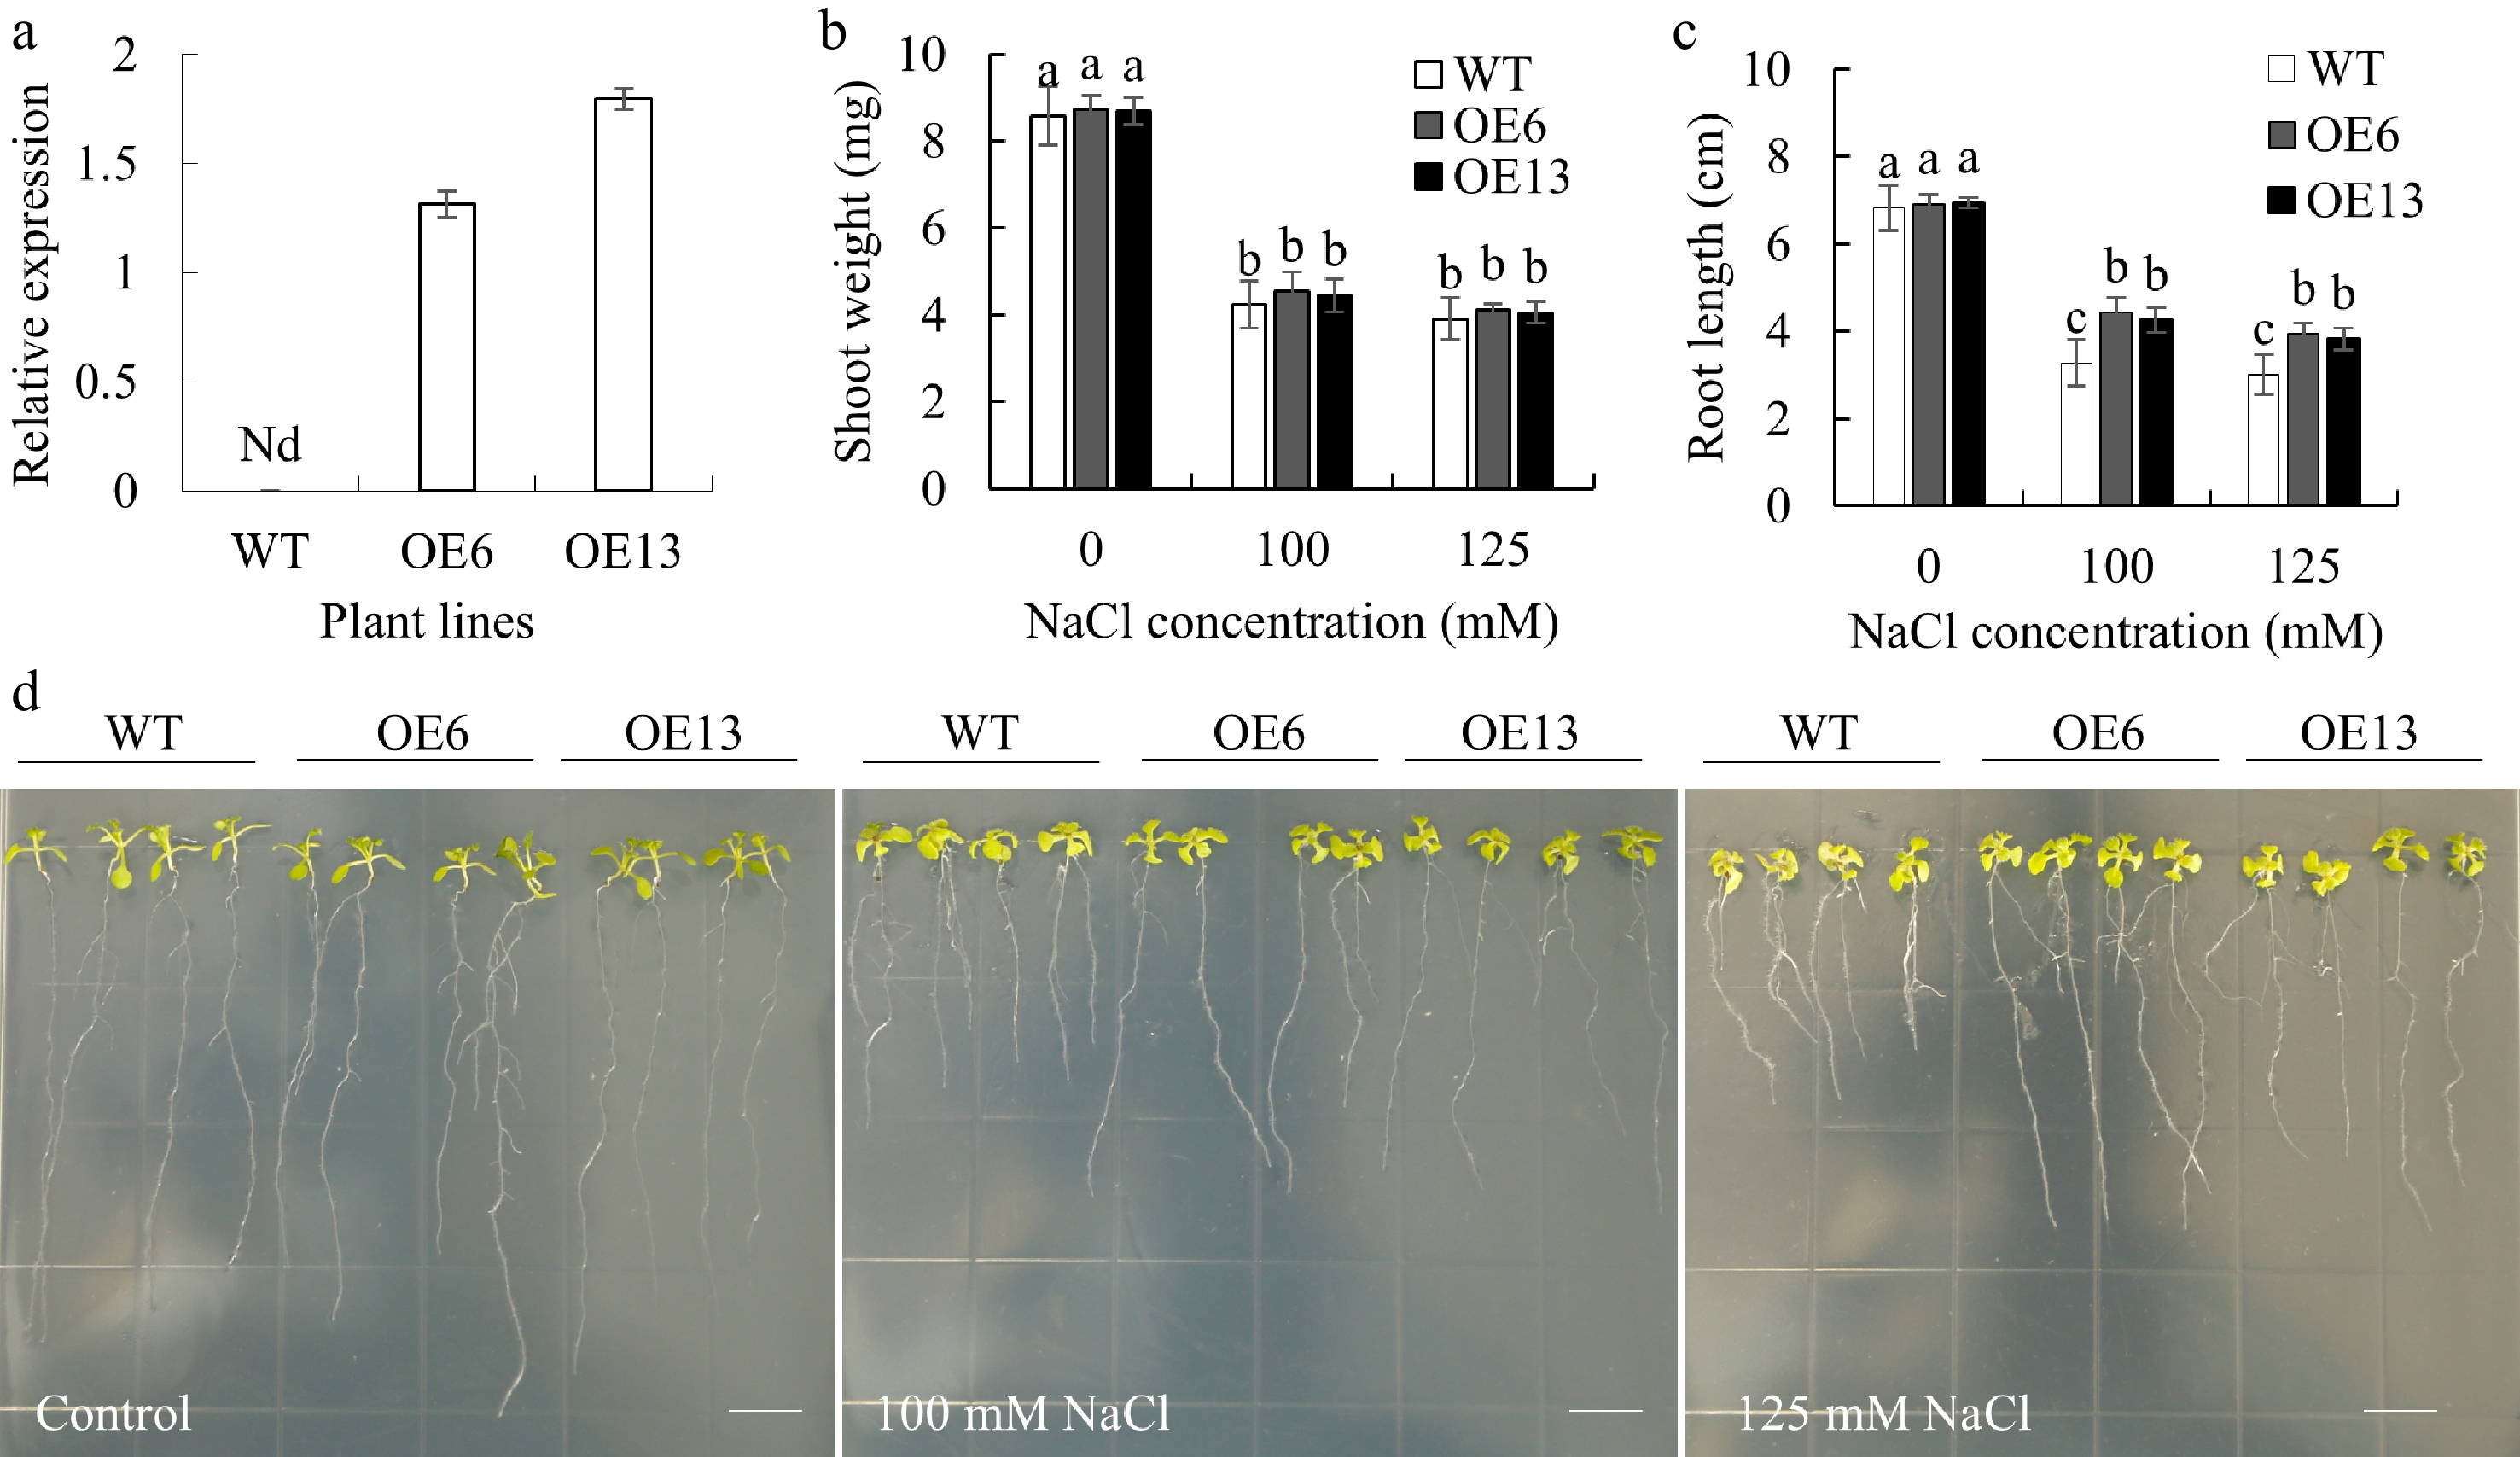
Figure 4.
The root length and shoot fresh weight of transgenic Arabidopsis plants overexpressing MsGSTU17 after salt stress treatment. WT (Col-0) and MsGSTU17 overexpressing seedlings (OE6 and OE13) were included in the treatment. (a) qRT-PCR analysis of MsGSTU17 transcription levels in plants. The (b) fresh shoot weight, and (c) root length of each group of seedlings after 12 d of growth in 1/2 MS medium containing different NaCl concentrations. The same letters above the bar indicate no significant difference in the corresponding items (p < 0.05). The sample size of seedlings in each experiment is greater than 30. (d) Phenotype of each group of seedlings grown on 1/2 MS medium with different NaCl concentrations for 12 d. Bar = 10 mm.
-
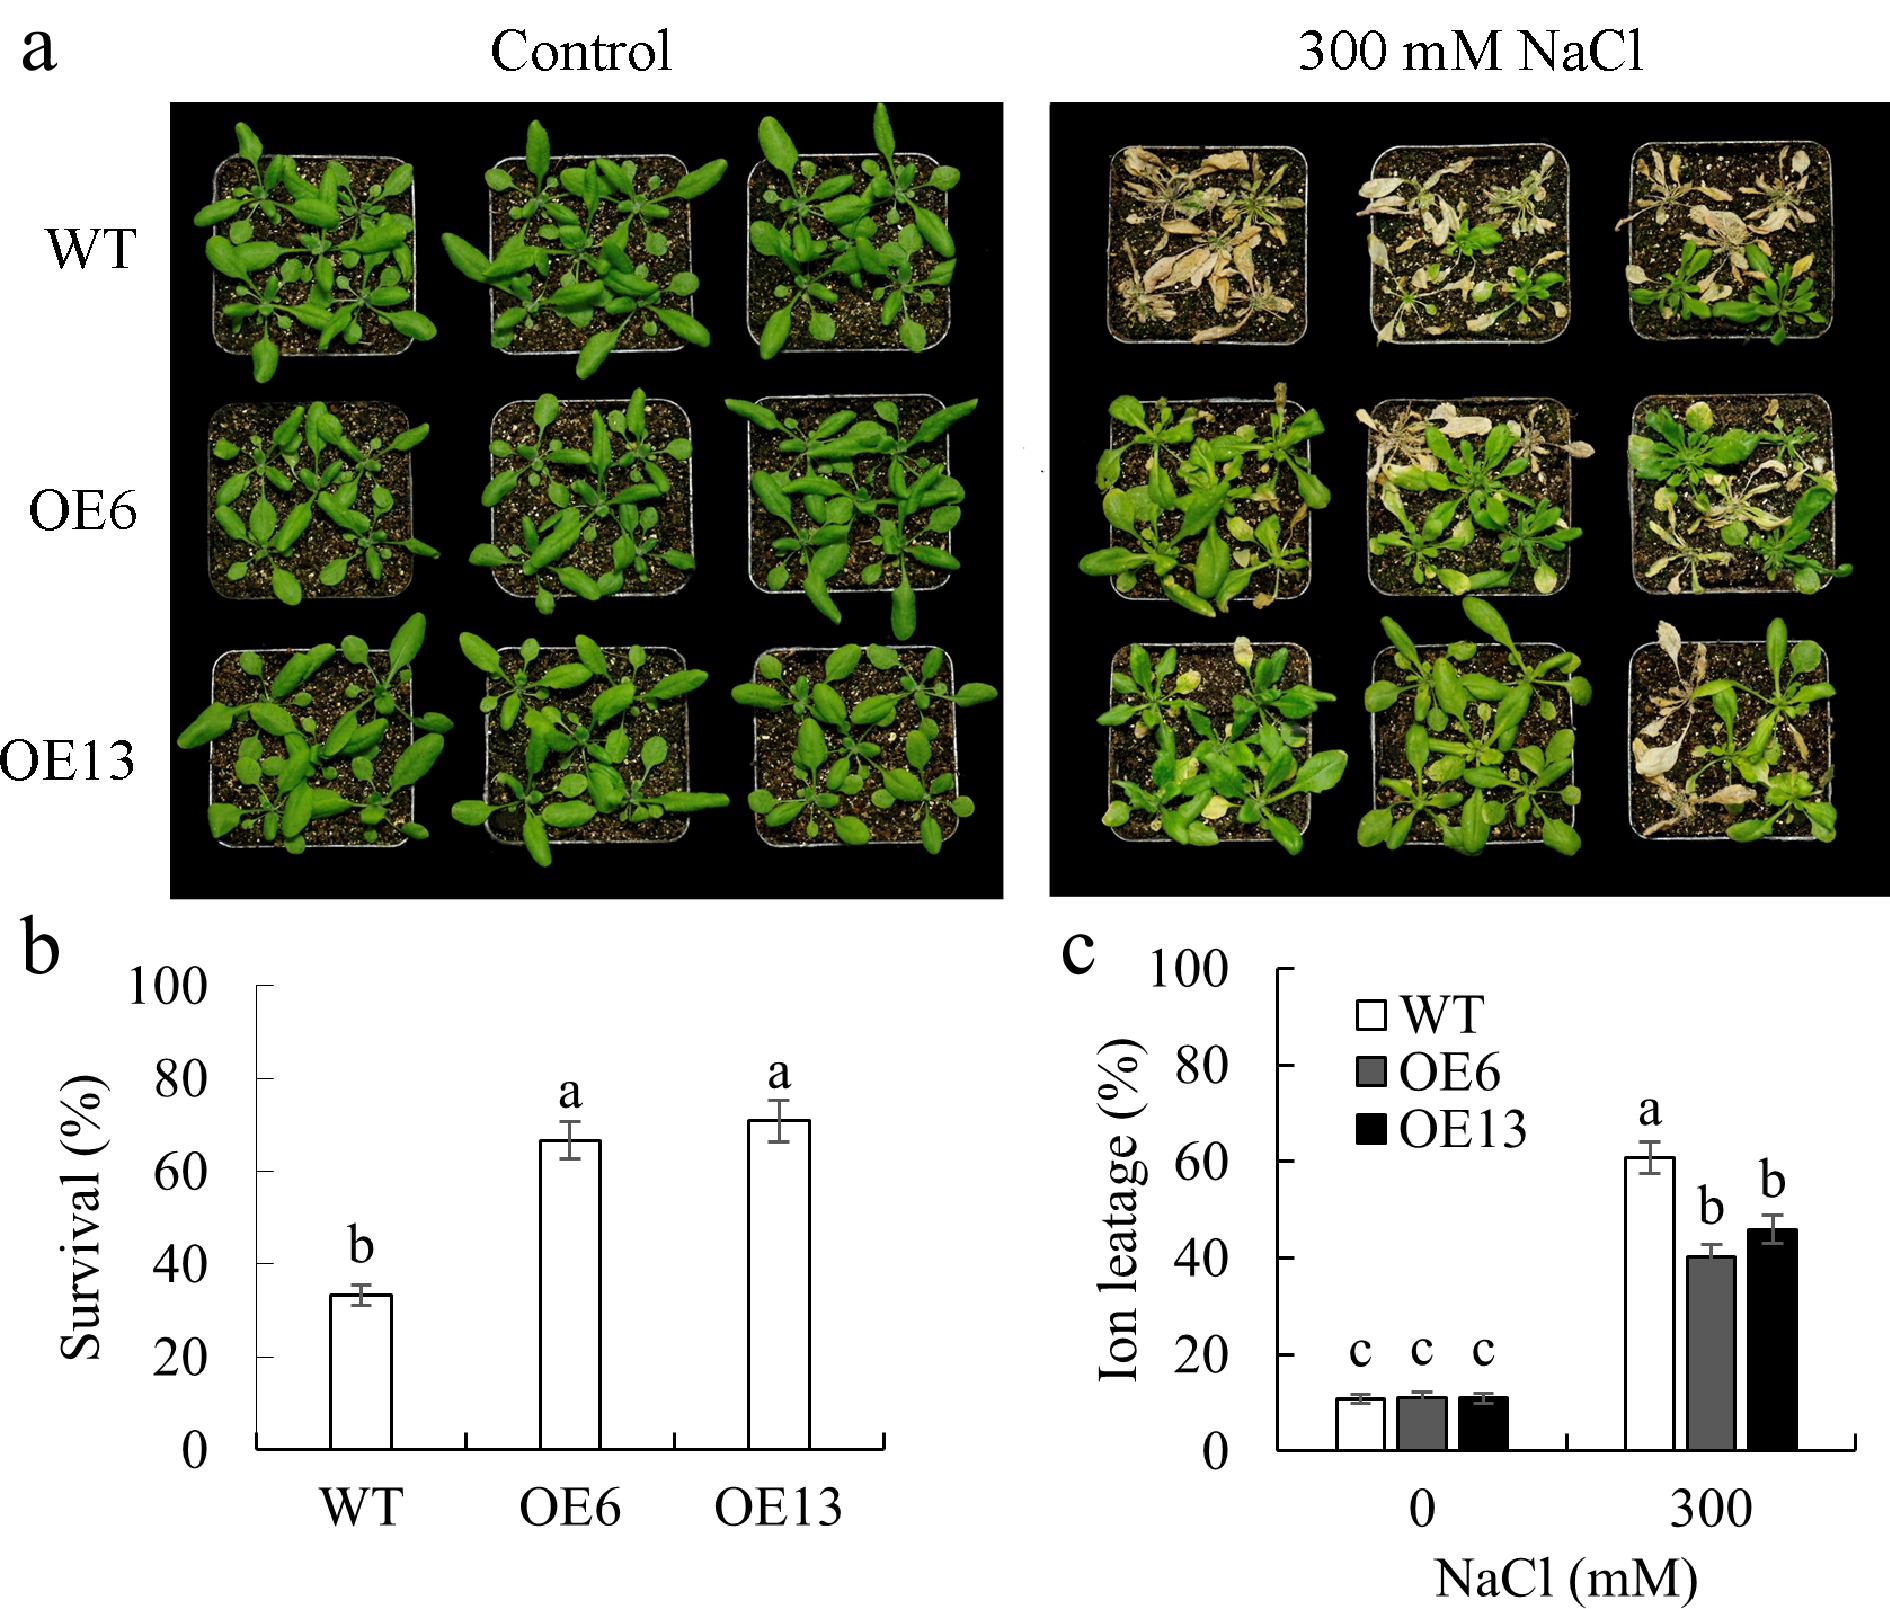
Figure 5.
The survival performance of transgenic Arabidopsis plants overexpressing MsGSTU17 in a salt stress environment was investigated. WT (Col-0) and MsGSTU17 overexpressing seedlings (three weeks old) were treated with 200, 250, and 300 mM NaCl for 3, 3, and 6 d, respectively. (a) The photos depicting the growth status of seedlings. (b) The survival rate. (c) The degree of ion leakage in the leaves is represented as the mean ± standard deviation (n = 3 replicates, four plants/replicate). The same letters above the bar chart signified that there was no significant difference in the corresponding items (p < 0.05).
-
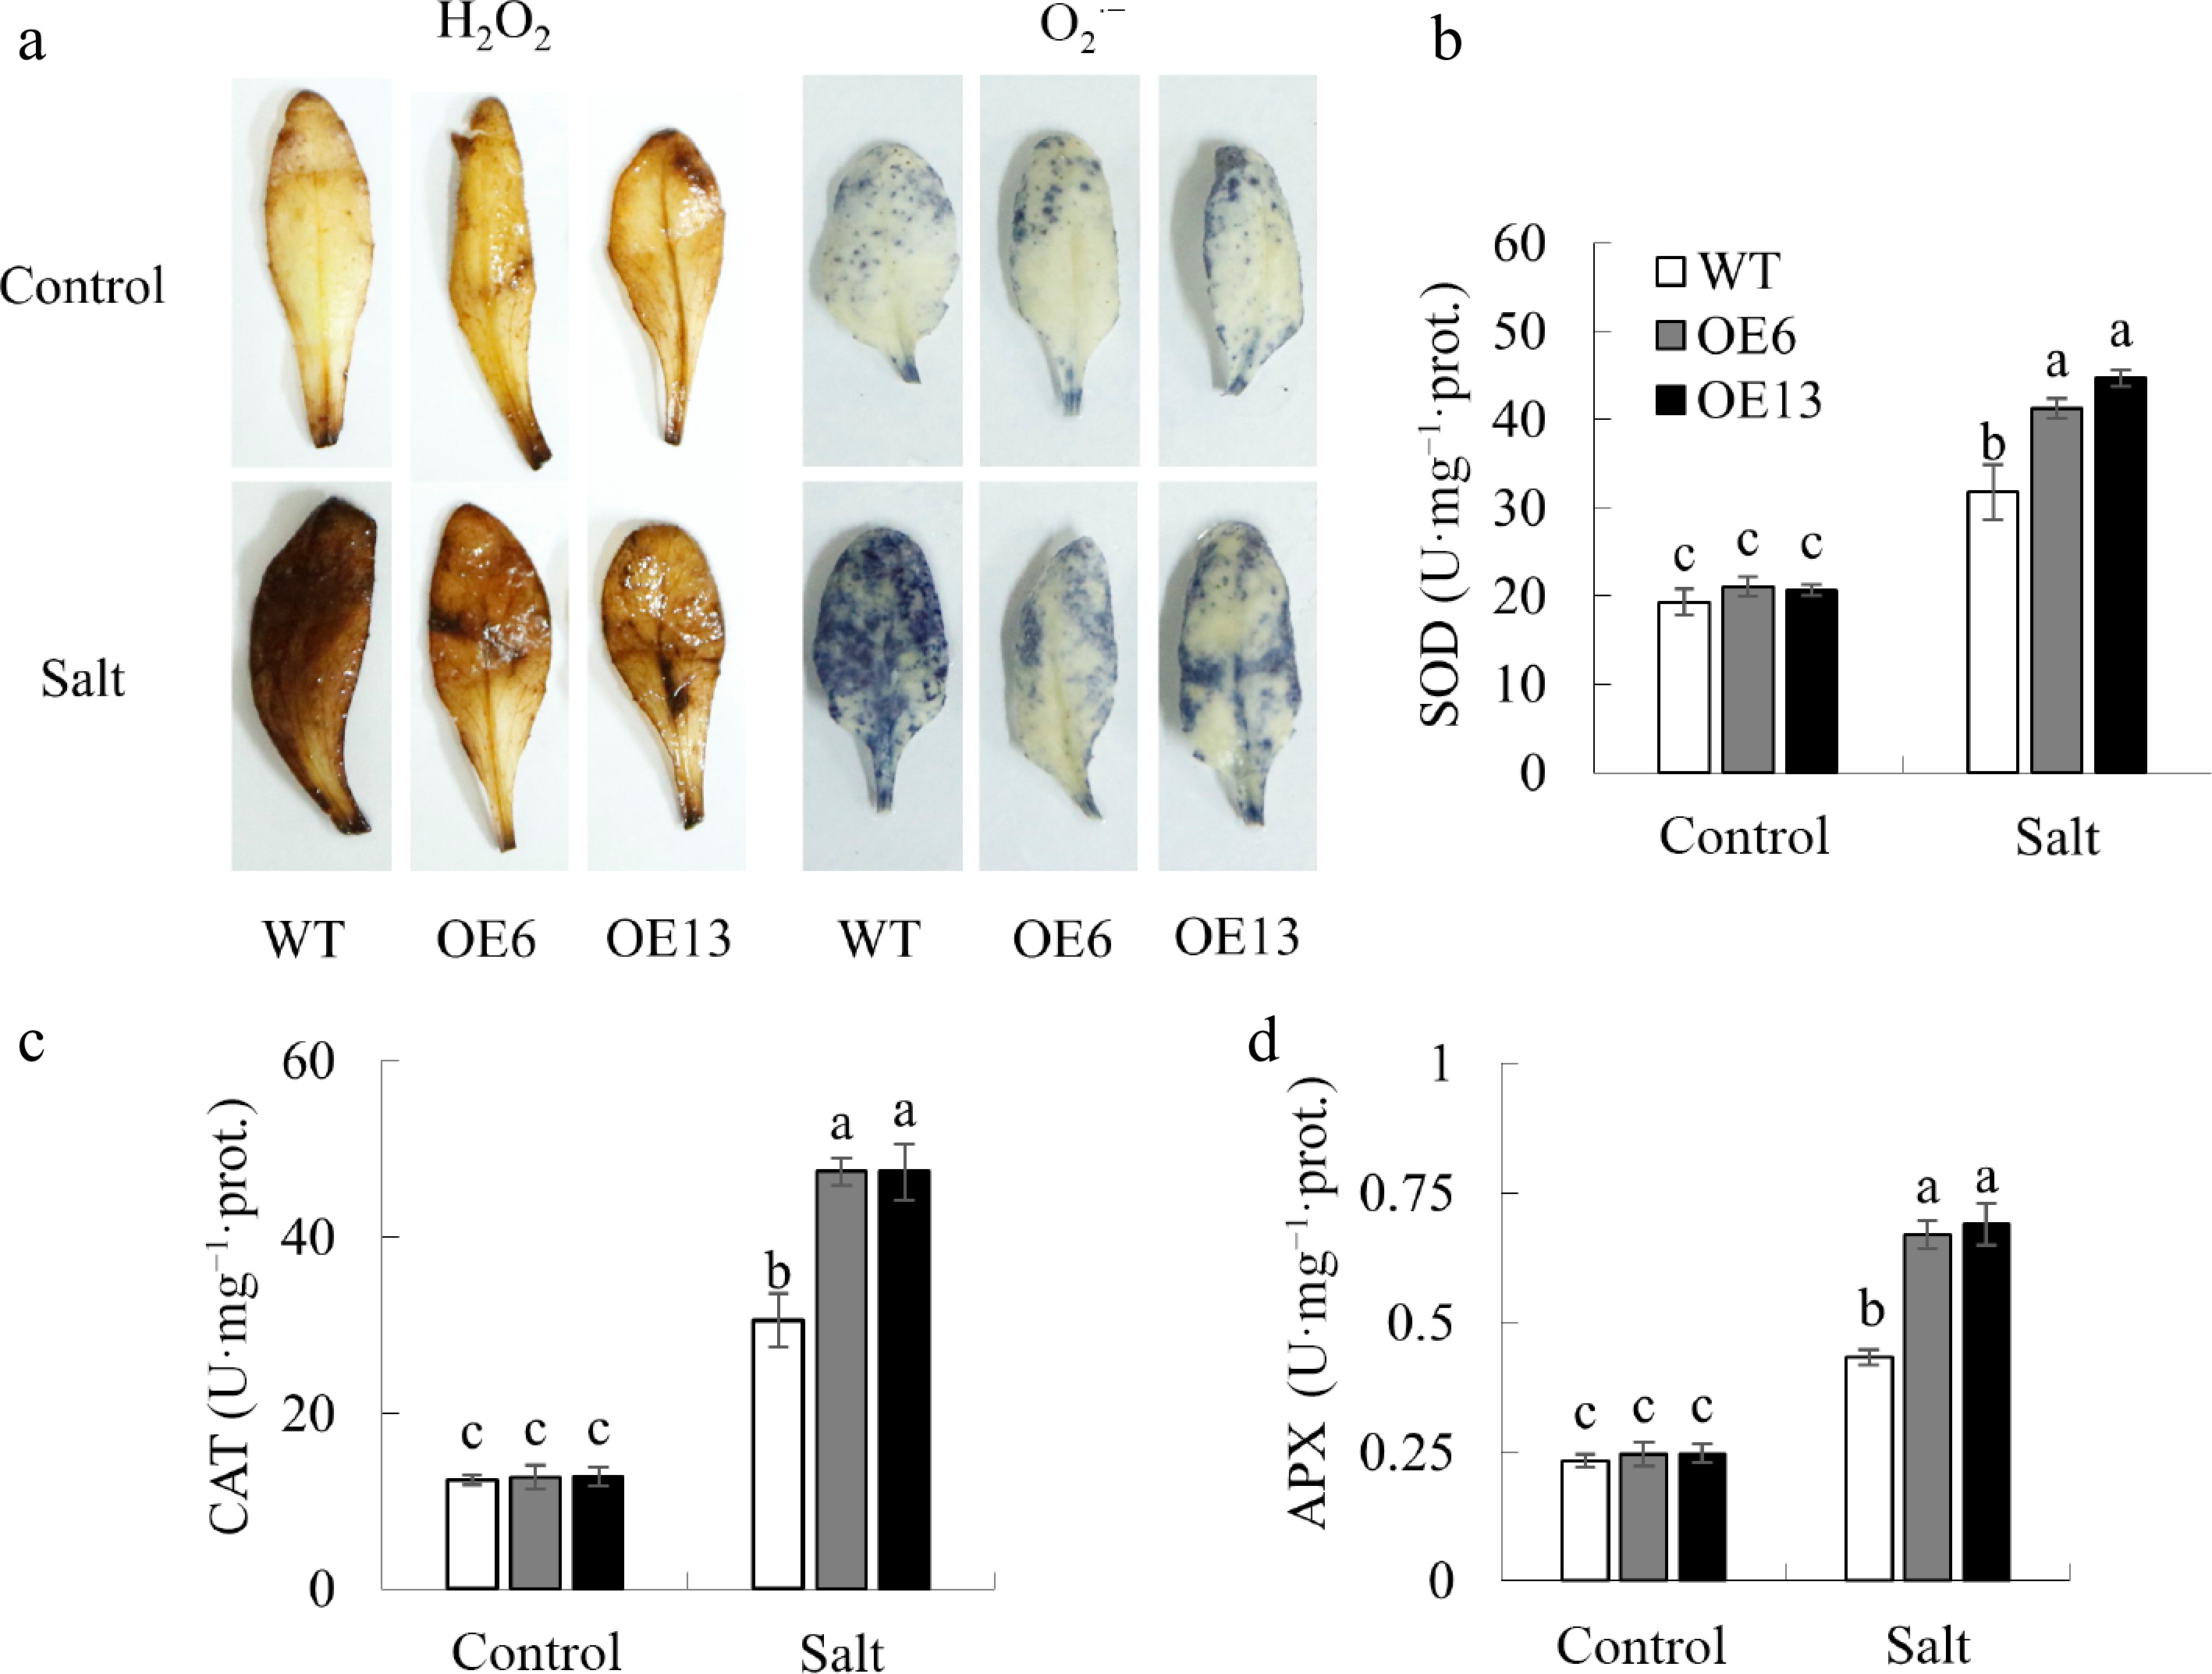
Figure 6.
The impact of MsGSTU17 overexpression on the activity of antioxidant enzymes and accumulation of ROS. (a) Reactive oxygen species, including O2·− and H2O2, were detected in leaves. The enzymatic activities of (b) SOD, (c) CAT, and (d) APX were quantified. The data are presented as mean ± SD based on three independent replicates. The same letter above the bars indicates that there is no significant difference between the groups (p < 0.05).
-
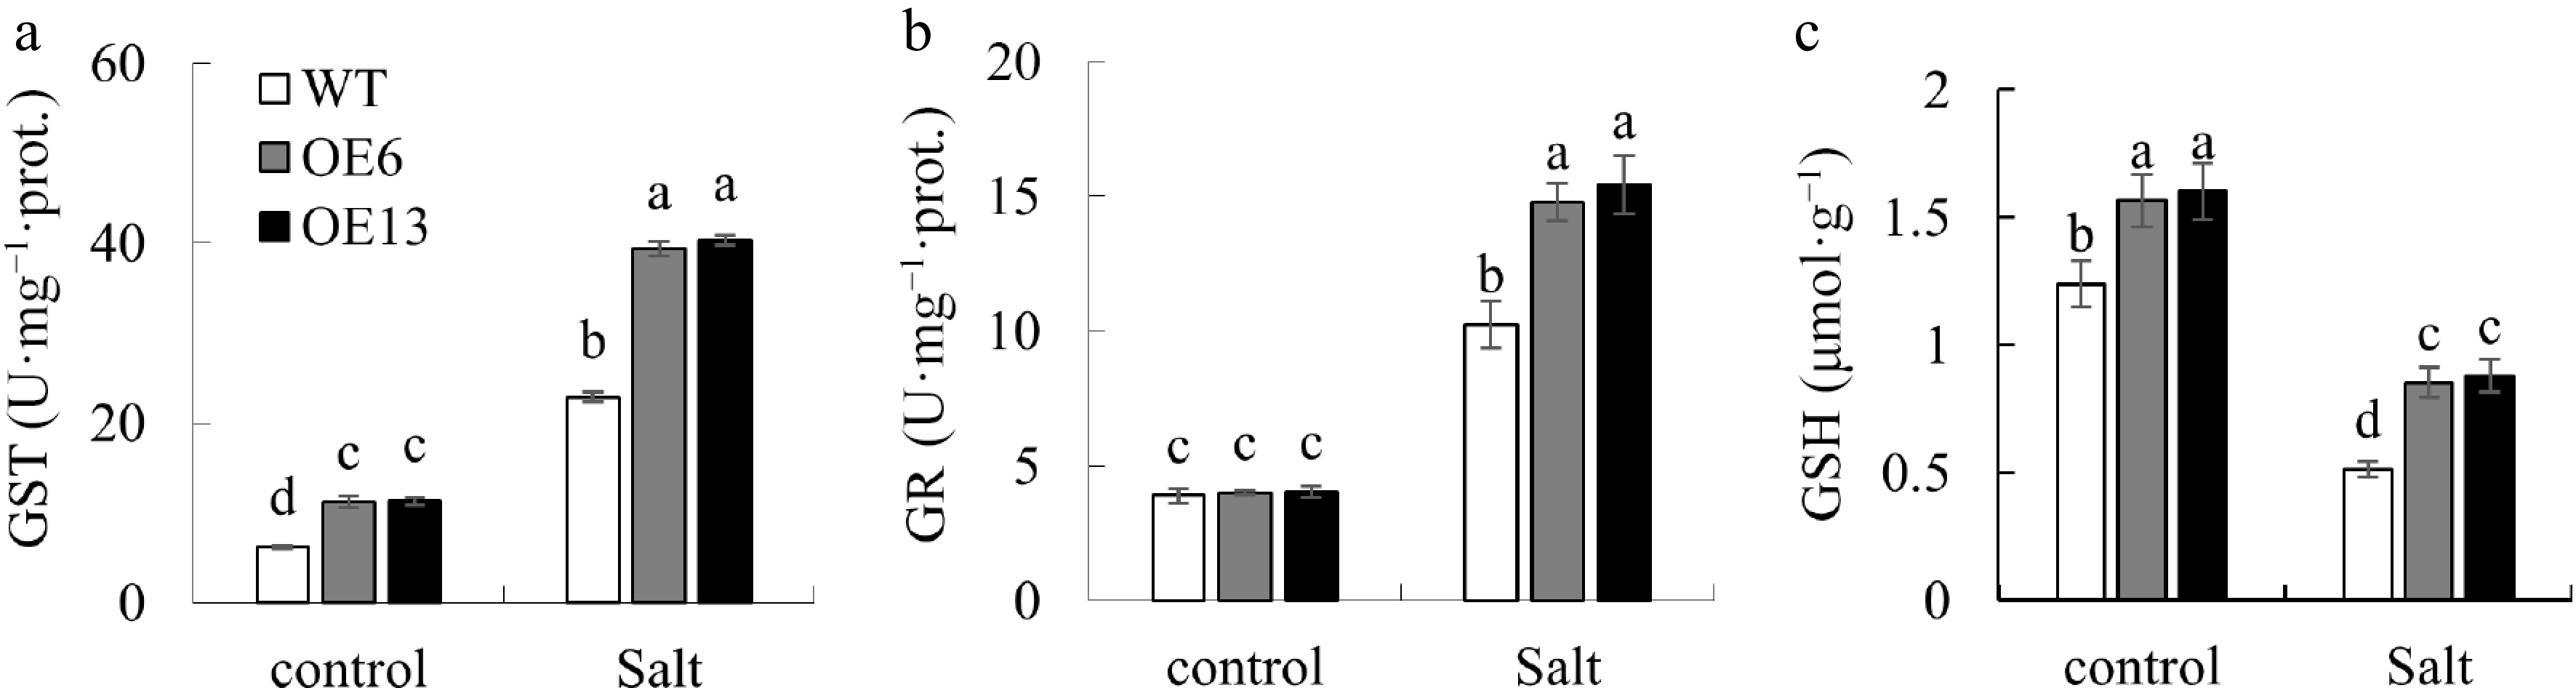
Figure 7.
Changes of GSH content and related enzymes. Variations in (a) GST, and (b) GR activities, along with (c) GSH levels, were observed in 15-day-old wild-type and transgenic Arabidopsis plants following a 20-d exposure to 0 or 200 mM NaCl. Distinctive letters above the bars signify statistically significant disparities among the treatments at the p < 0.05 level.
-
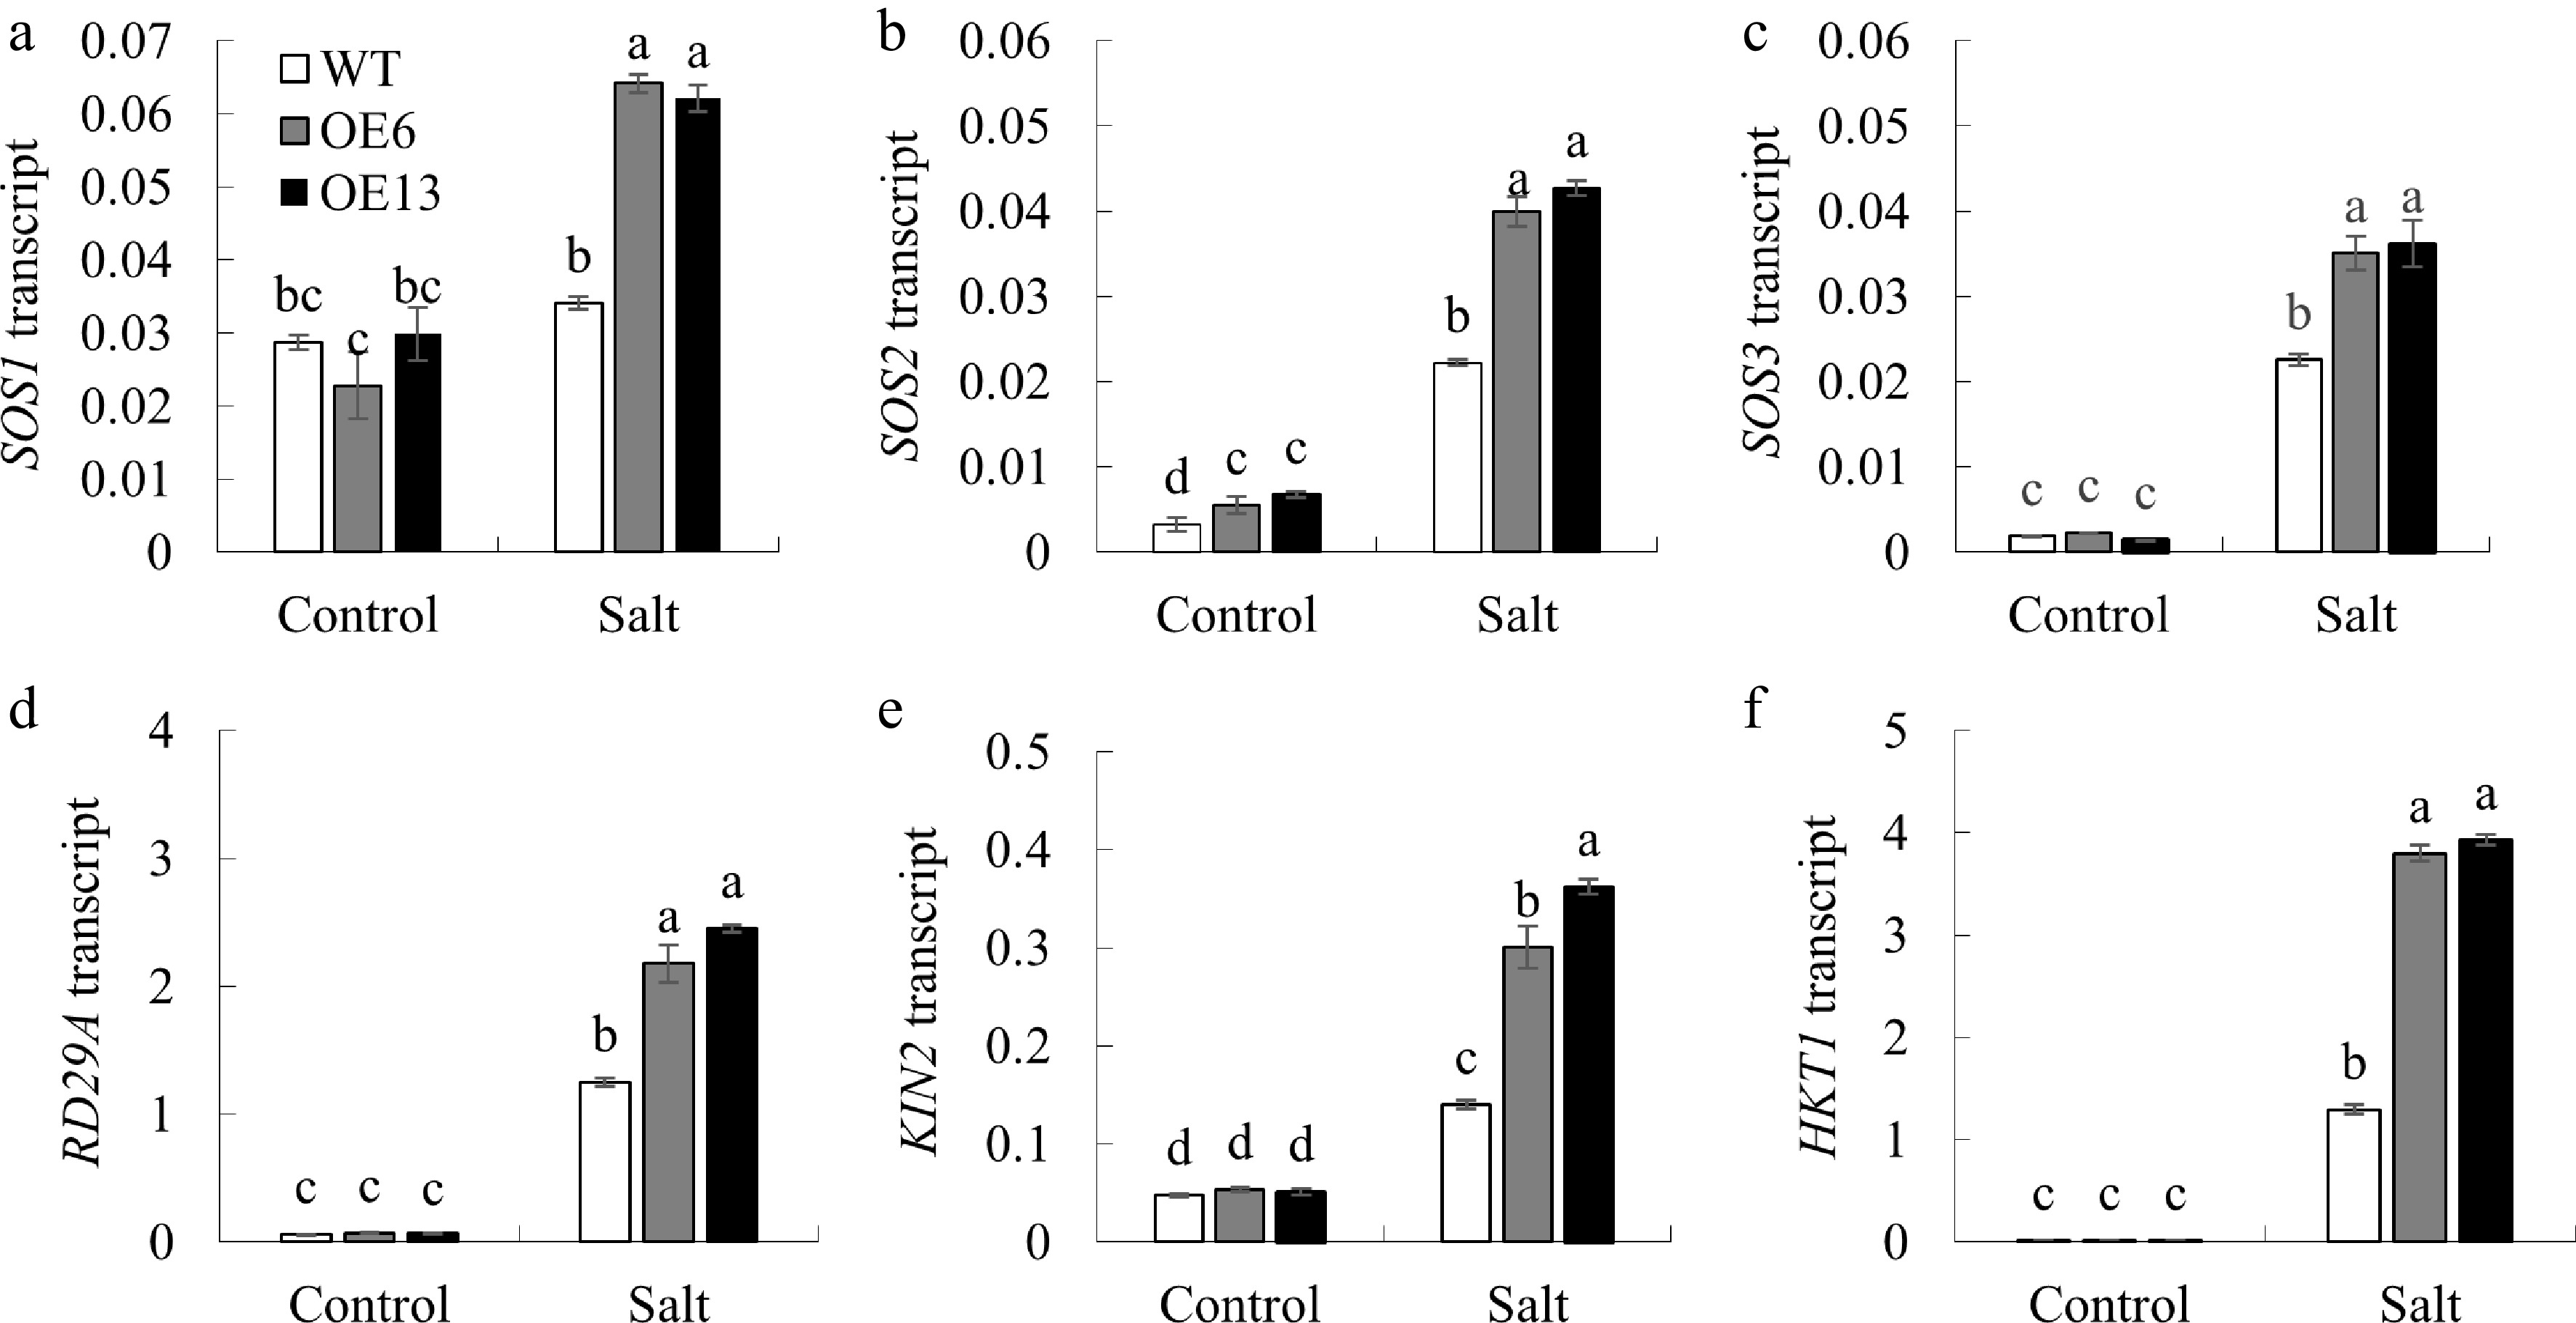
Figure 8.
The impact of salt stress on the expression of genes involved in ion homeostasis and stress response in Arabidopsis. After treating 7-day-old Arabidopsis seedlings with 125 mM NaCl for 6 h, the expression of (a) SOS1, (b) SOS2, (c) SOS3, (d) RD29A, (e) KIN2, and (f) HKT1 was assessed. Values are presented as mean ± SD (n = 3 replicates). Data are shown as the mean ± standard deviation (n = 3 replicates). Groups with the same letter above the bars are not significantly different at the p < 0.05 level.
Figures
(8)
Tables
(0)