-
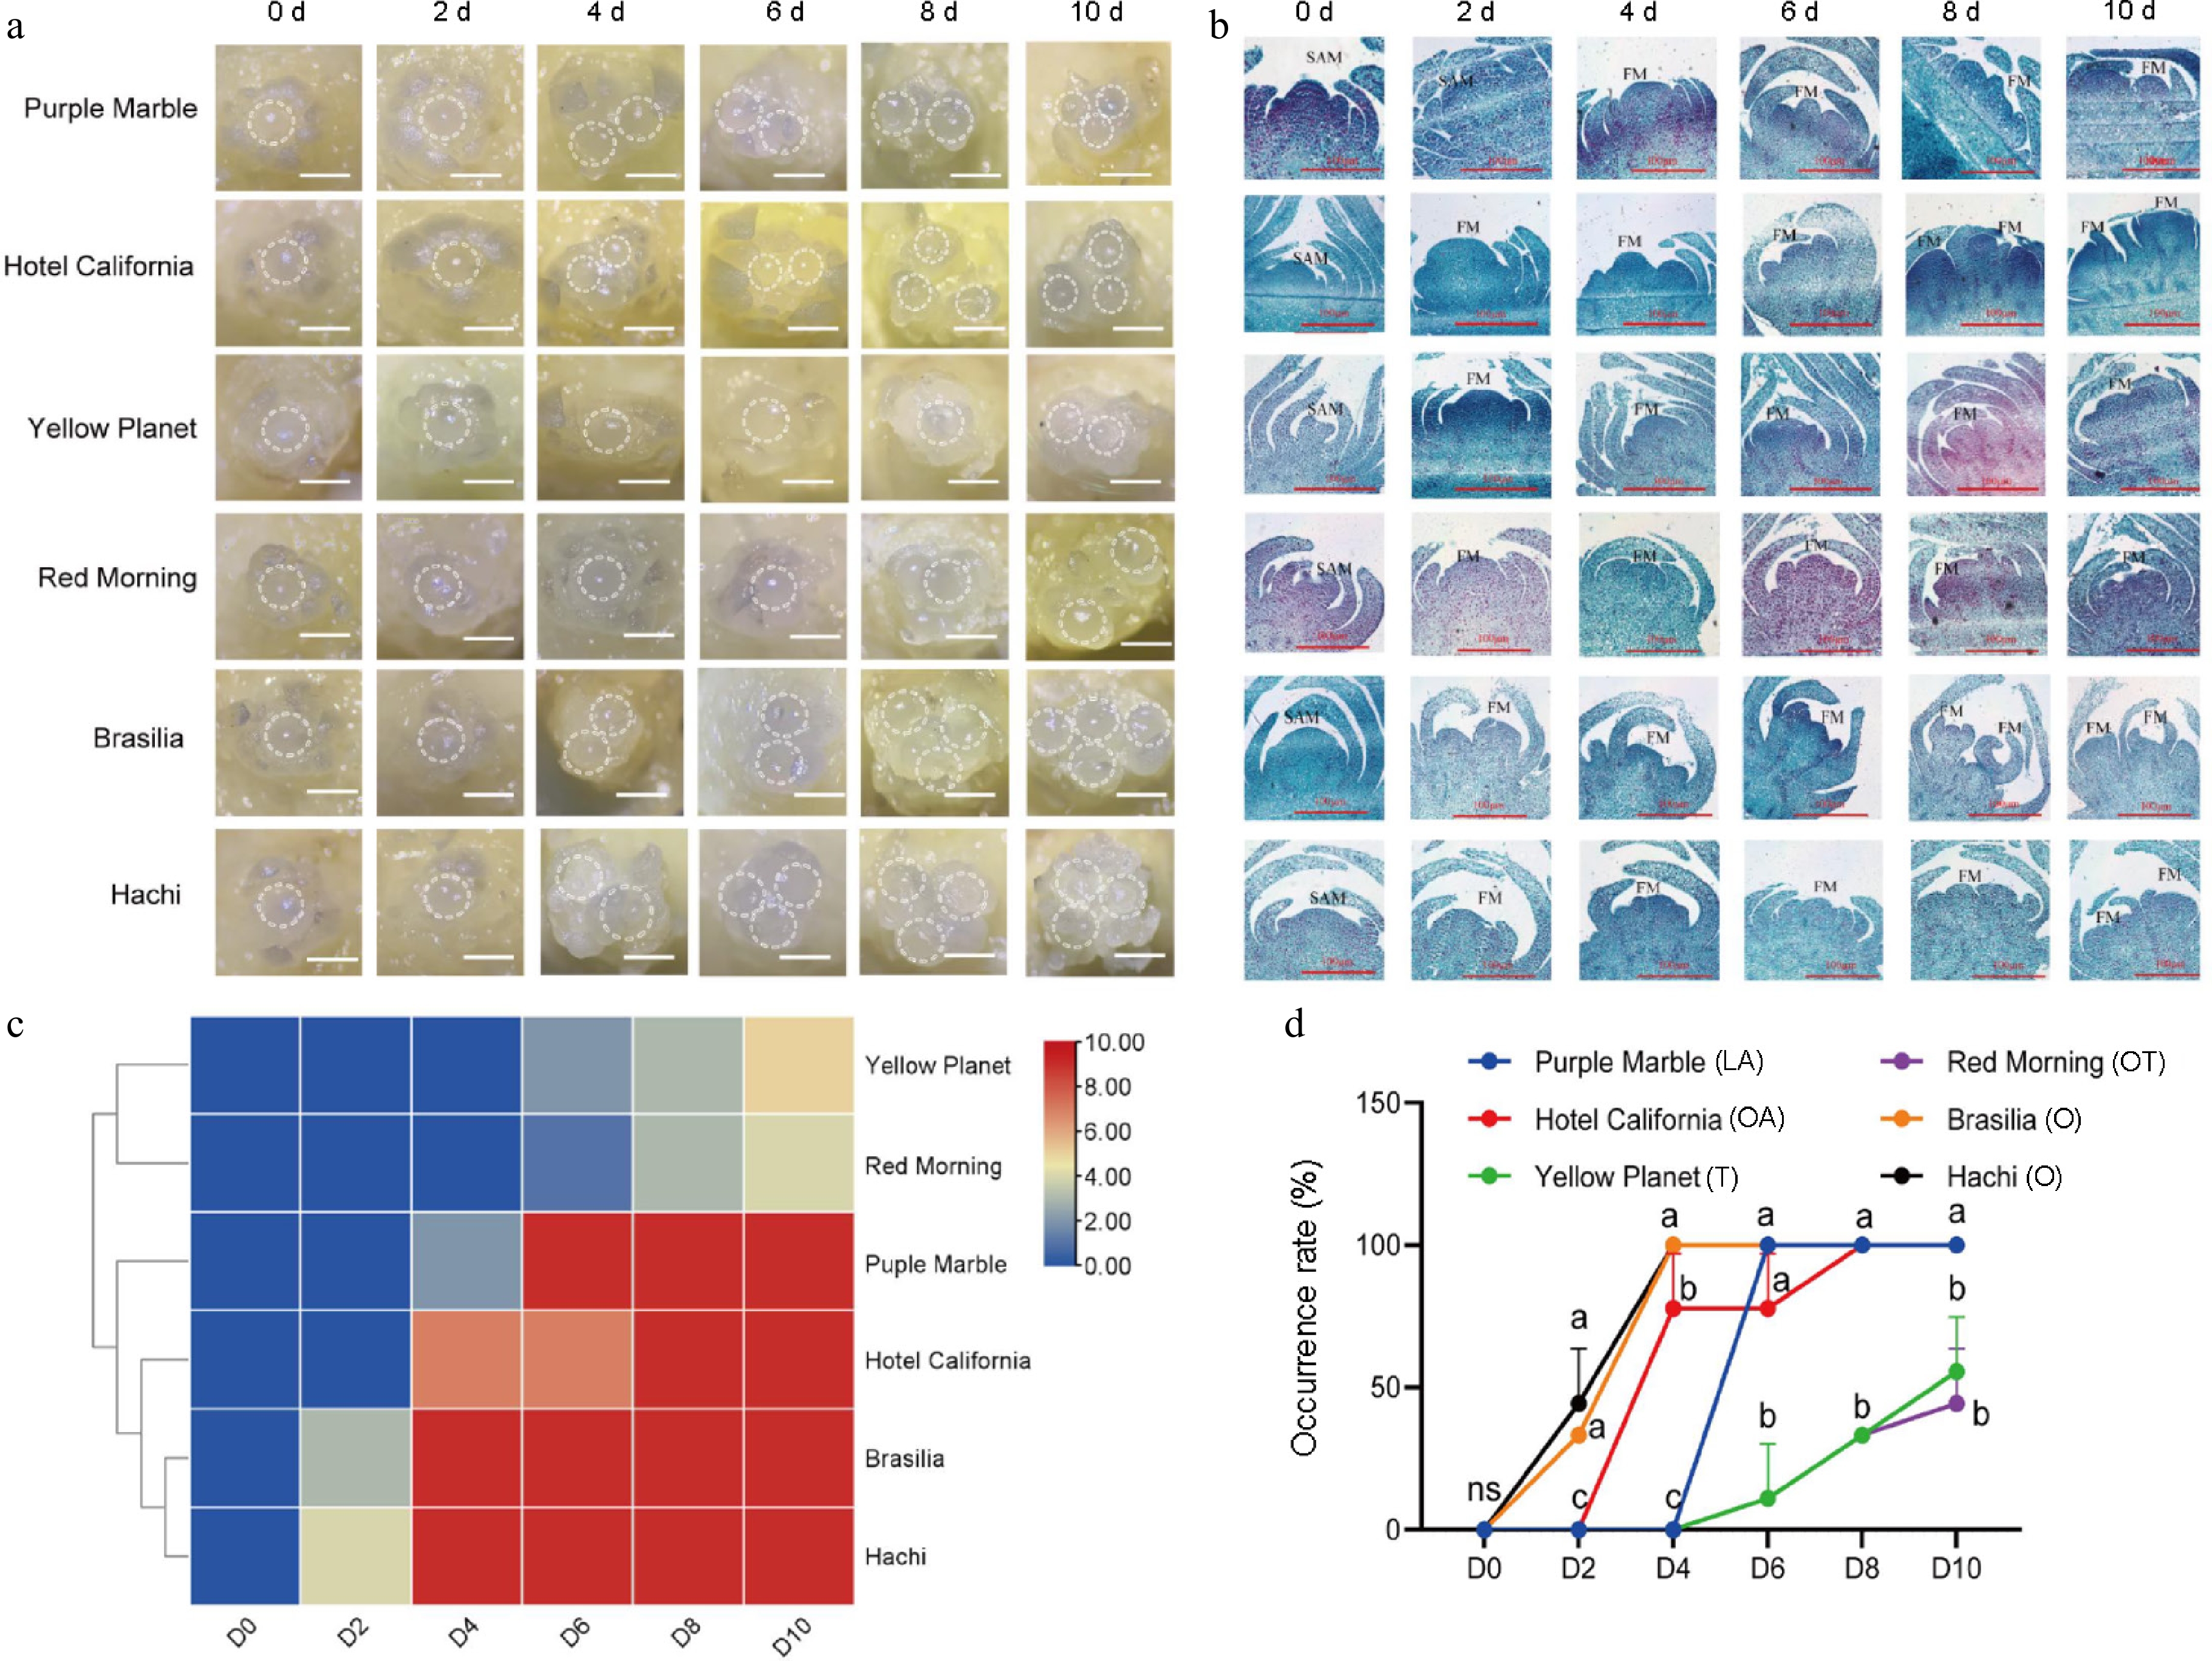
Figure 1.
Morphological characteristics and differentiation rate of different lily cultivars during flower transition. (a) External morphology of buds at different development stages. (b) Flower bud initiation process of different series of lily flower buds under paraffin sections. SAM: shoot apical meristem; FM: floral meristem. The scale bars represent 100 μm. (c) Flower bud initiation rate of different varieties of lily at different time periods. The horizontal coordinates 0−10 d indicate the division of sampling time. A color scale from blue to red indicates a much higher incidence. (d) The incidence of flower buds of different varieties in different periods. ns: not significant; different letters represent significant differences, with three flower buds taken from each time point and repeated in triplicate.
-
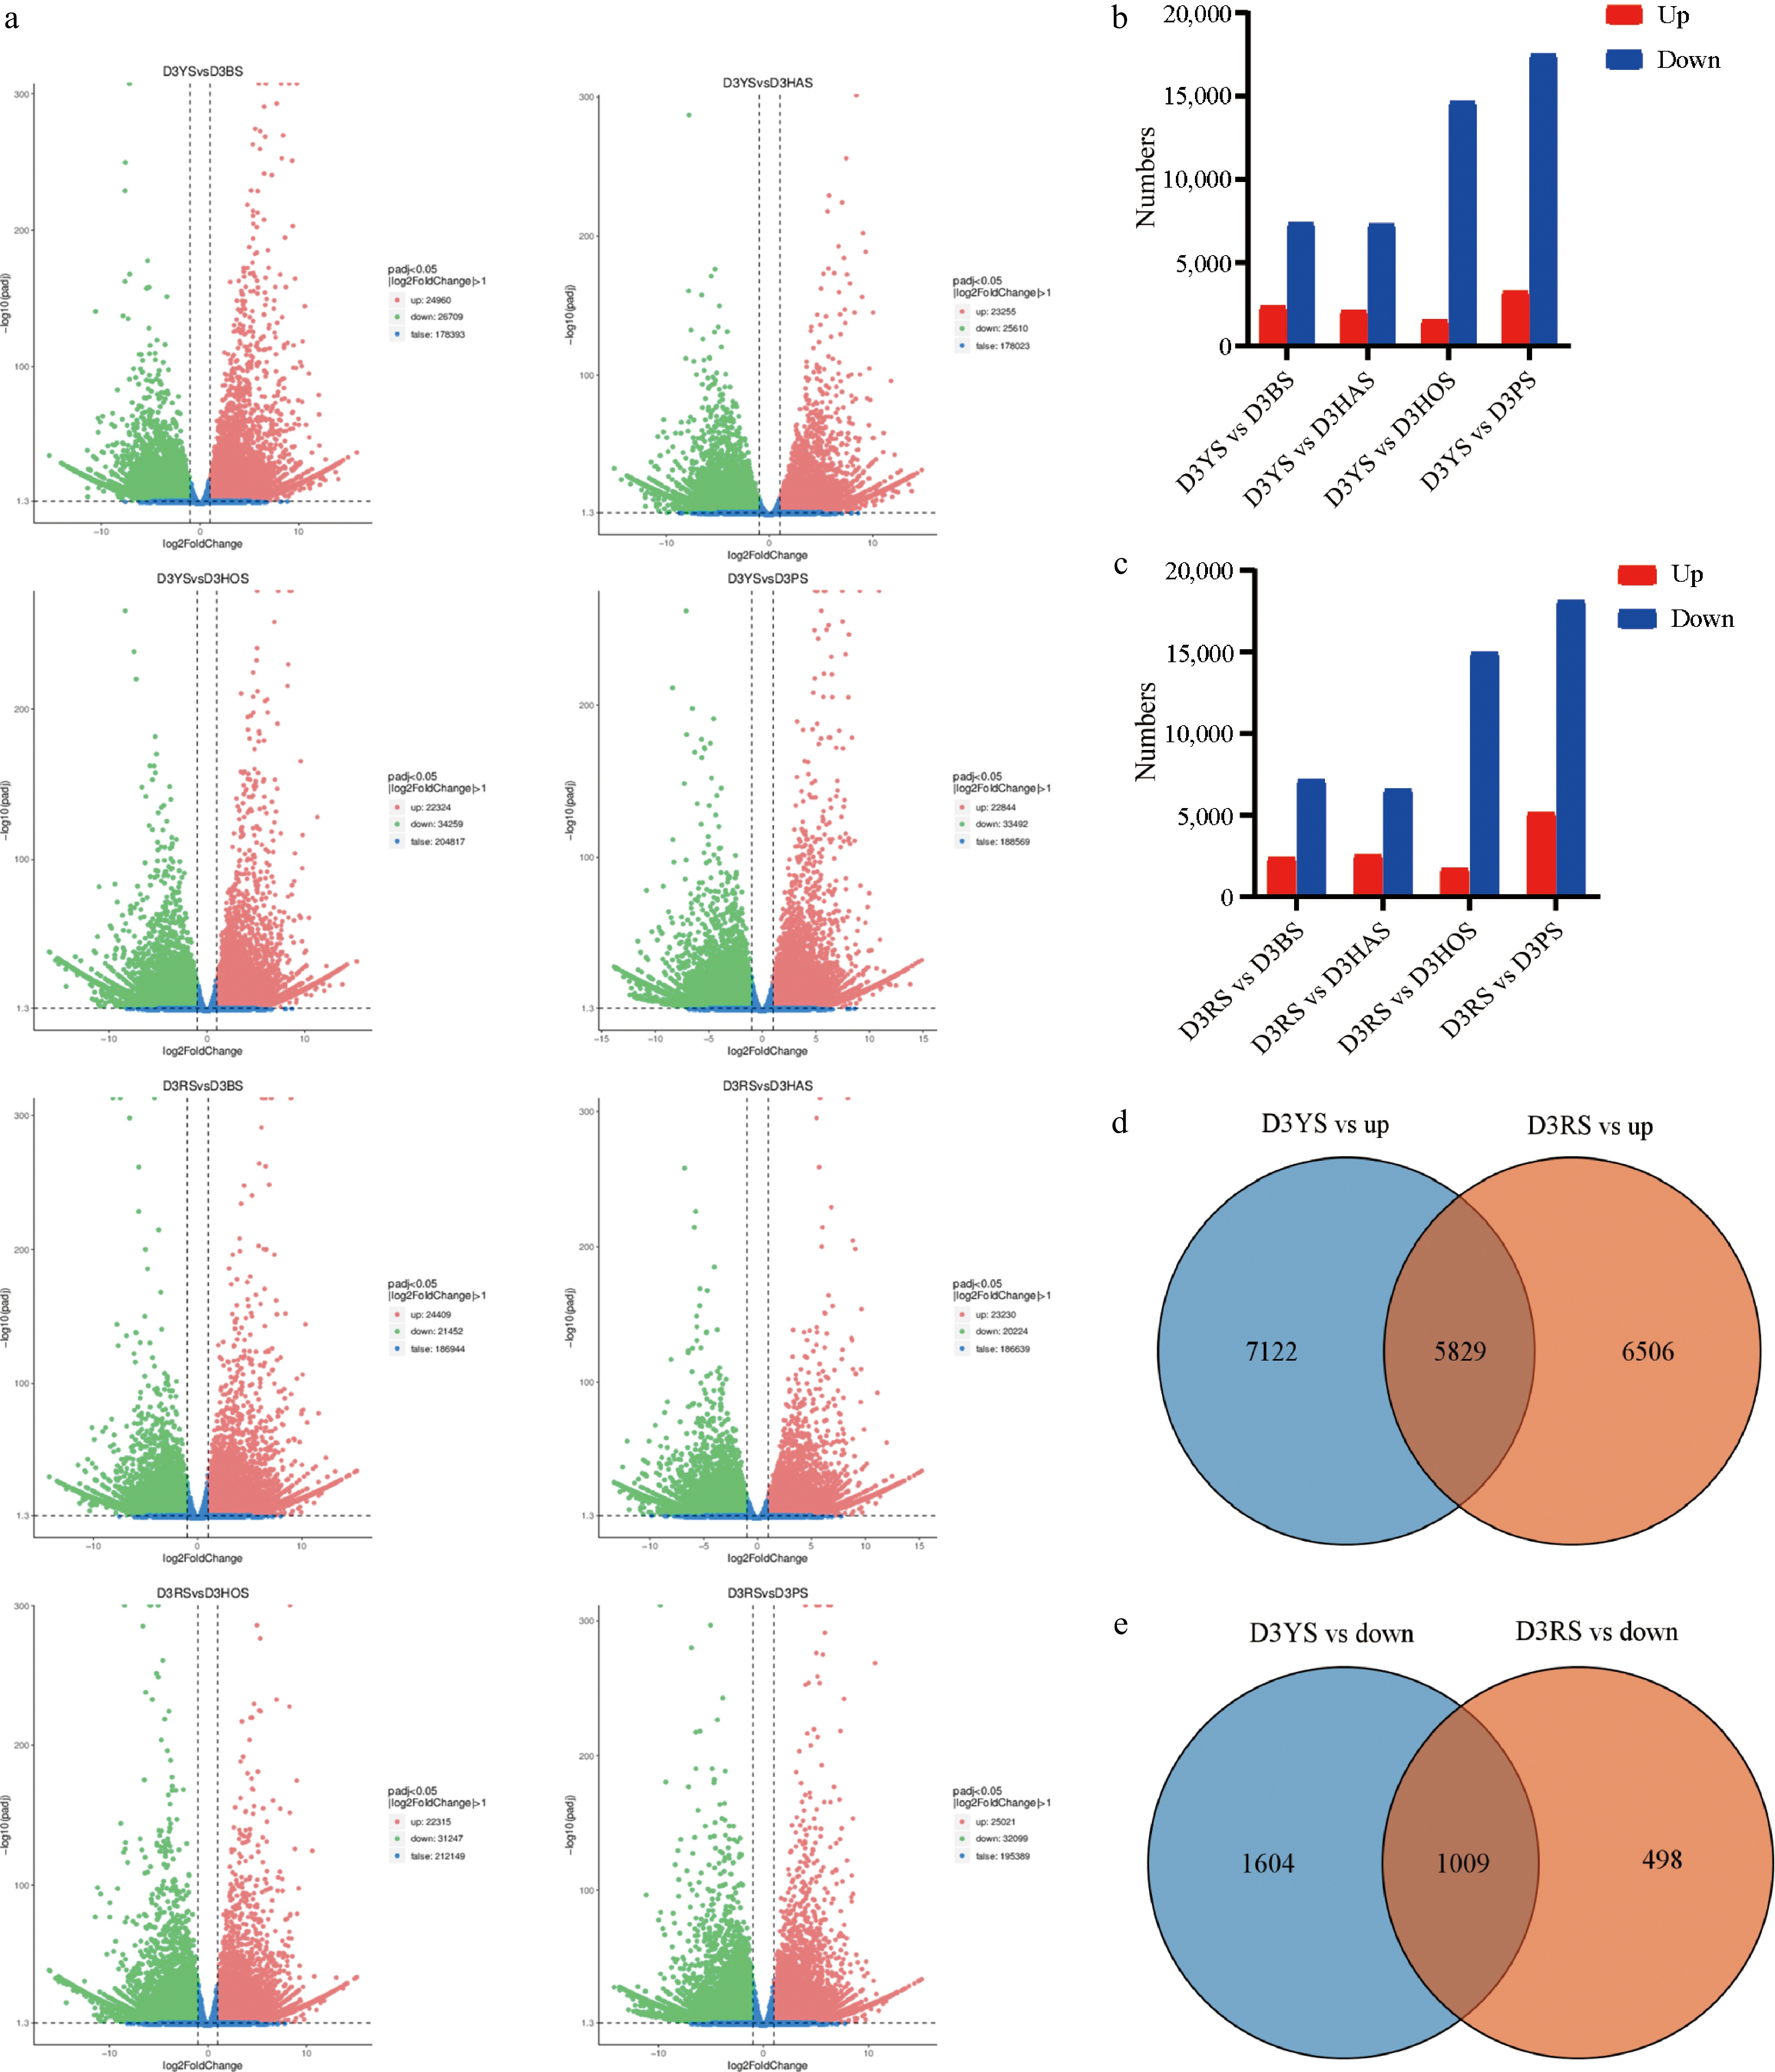
Figure 2.
RNA-seq analyses of the different varieties. (a) Volcano plot of DEGs between pairwise comparisons. The x-axis represents the fold change in gene expression across different samples (log2FoldChange), while the y-axis represents the significance level of differential expression (−log10padj). (b), (c) The number of upregulated and downregulated genes between pairwise comparisons. (d), (e) Venn diagram comparing D3YS and D3RS with other varieties illustrating the overlap and uniquely expressed genes identified in the samples. D3RS: On the fourth day, 'Red Morning' shoots apical meristems.
-
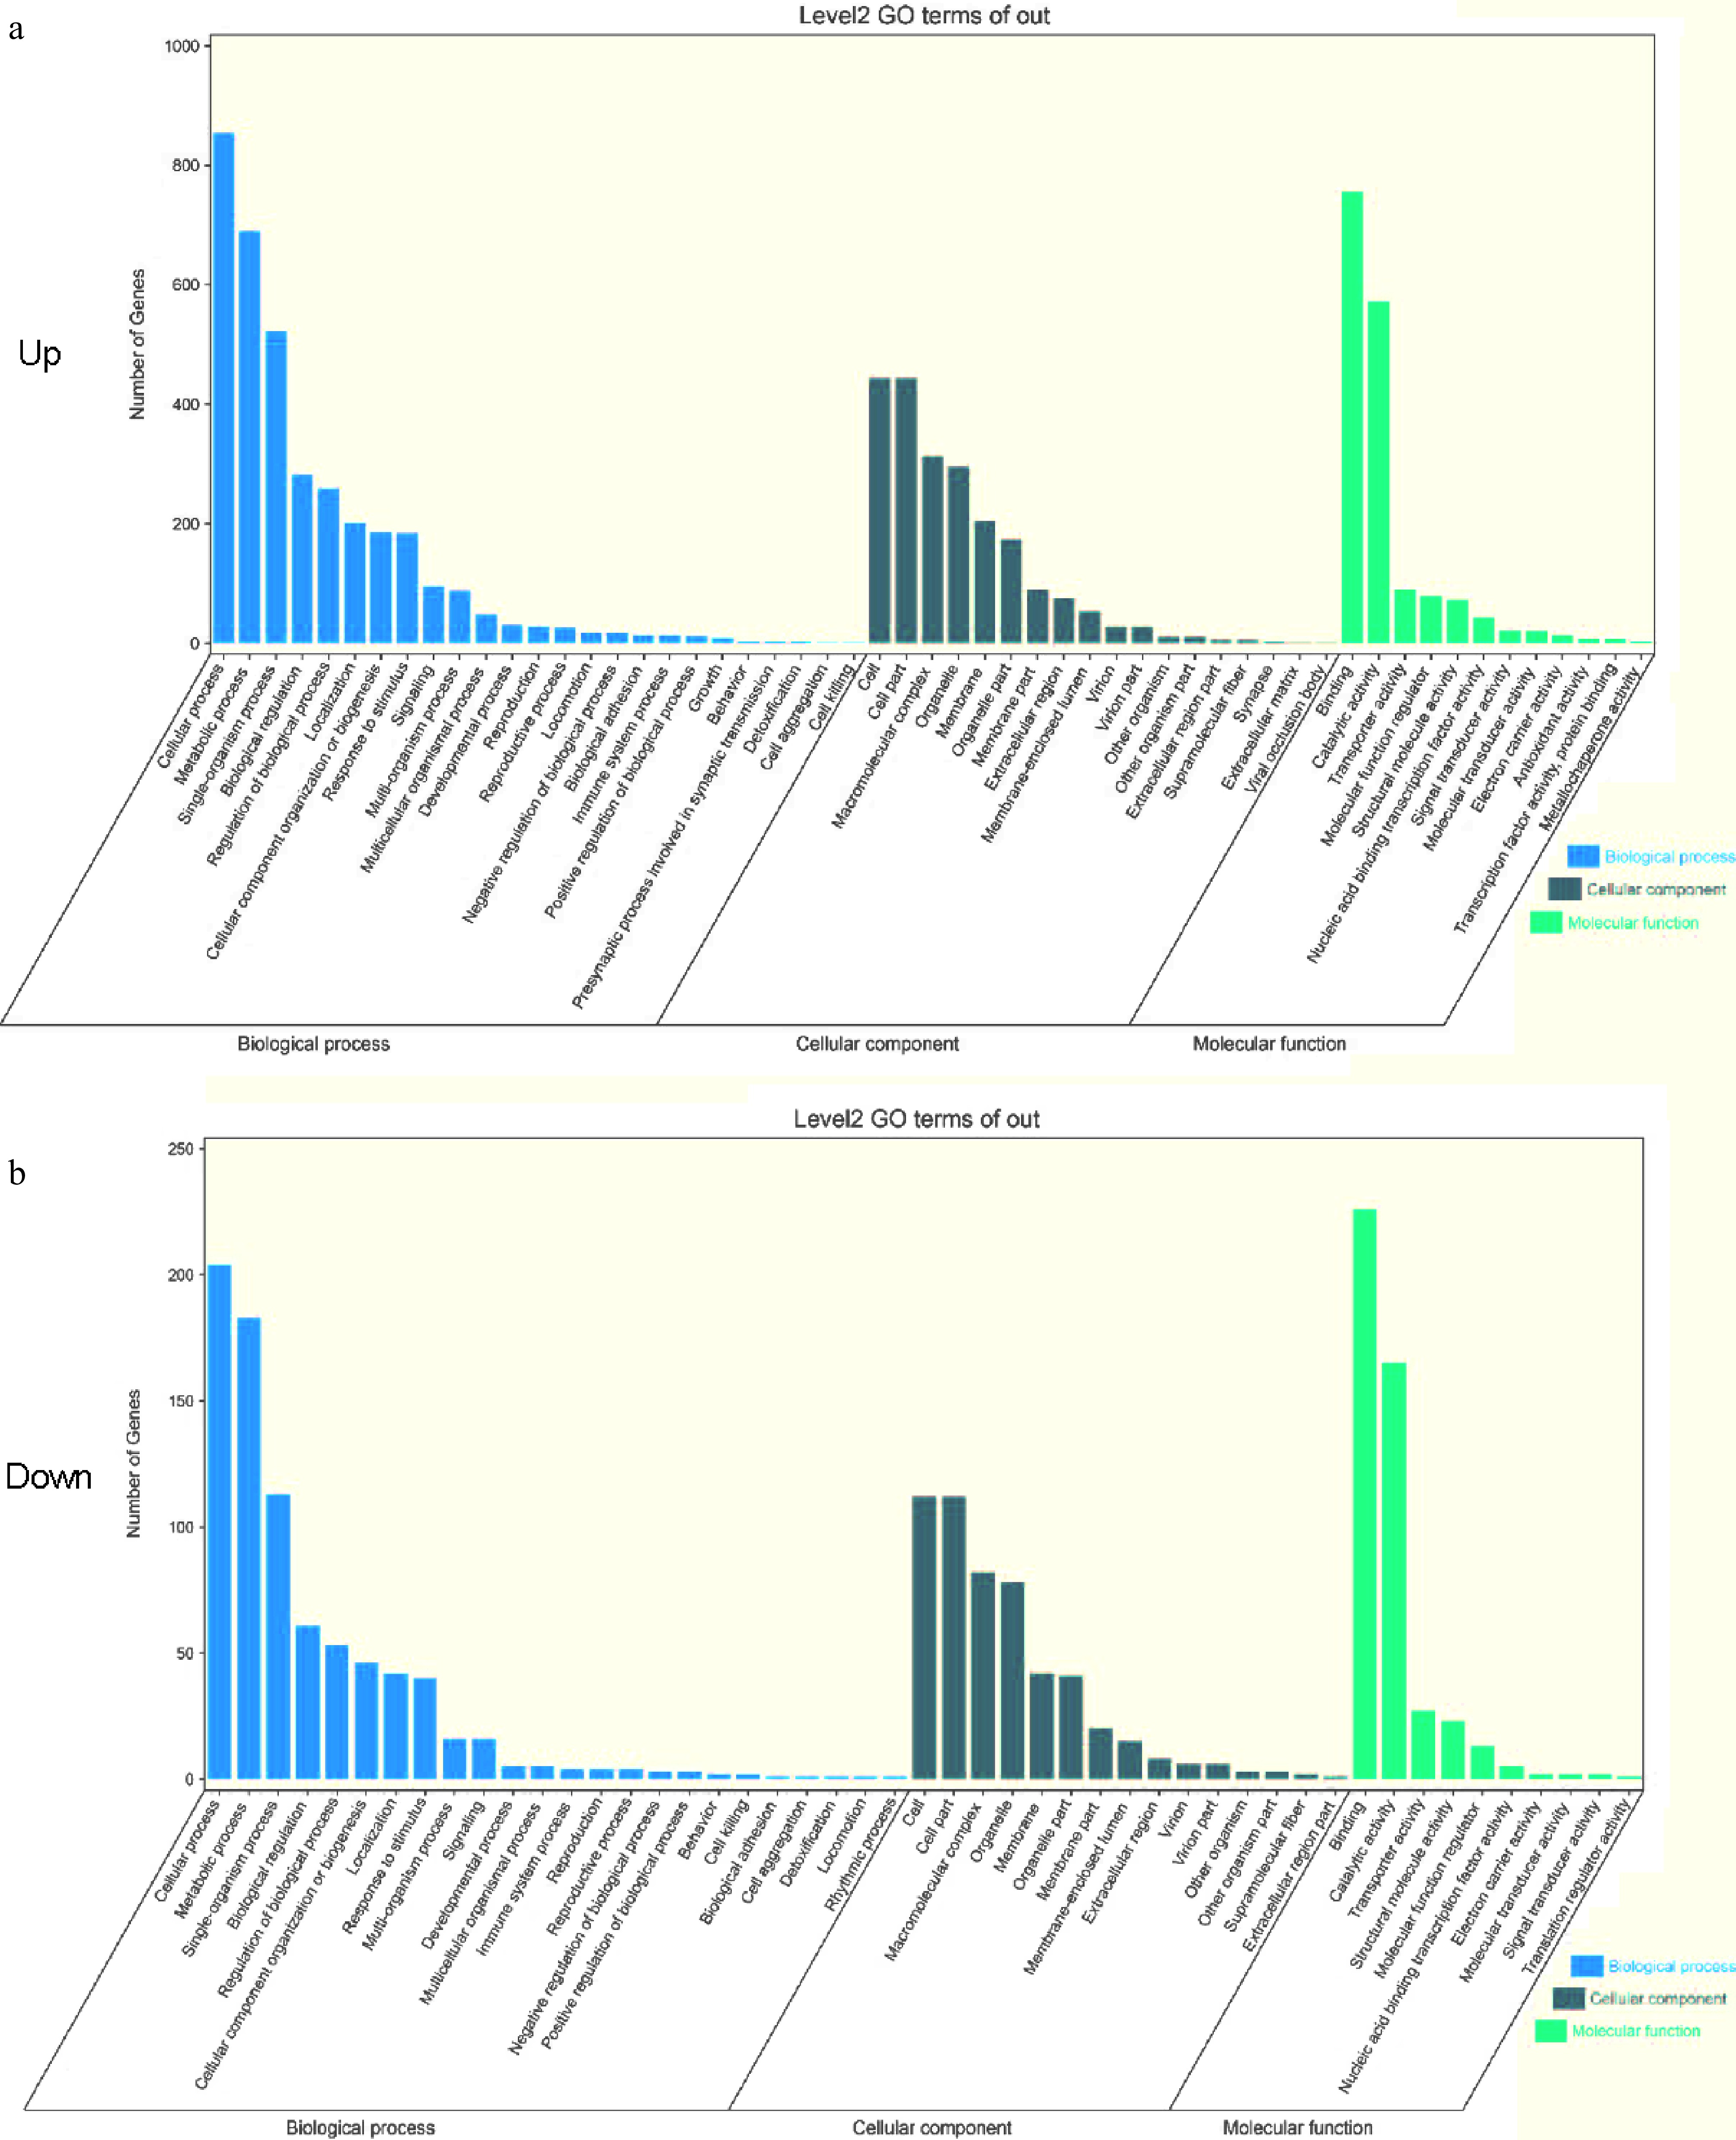
Figure 3.
GO enrichment analysis. (a), (b) GO functional enrichment of DEGs comparing D3YS and D3RS with other varieties in pairwise comparisons. BP biological process; MF, molecular function; CC, cellular components. D3YS: On the fourth day, 'Yellow Planet' shoots apical meristems.
-
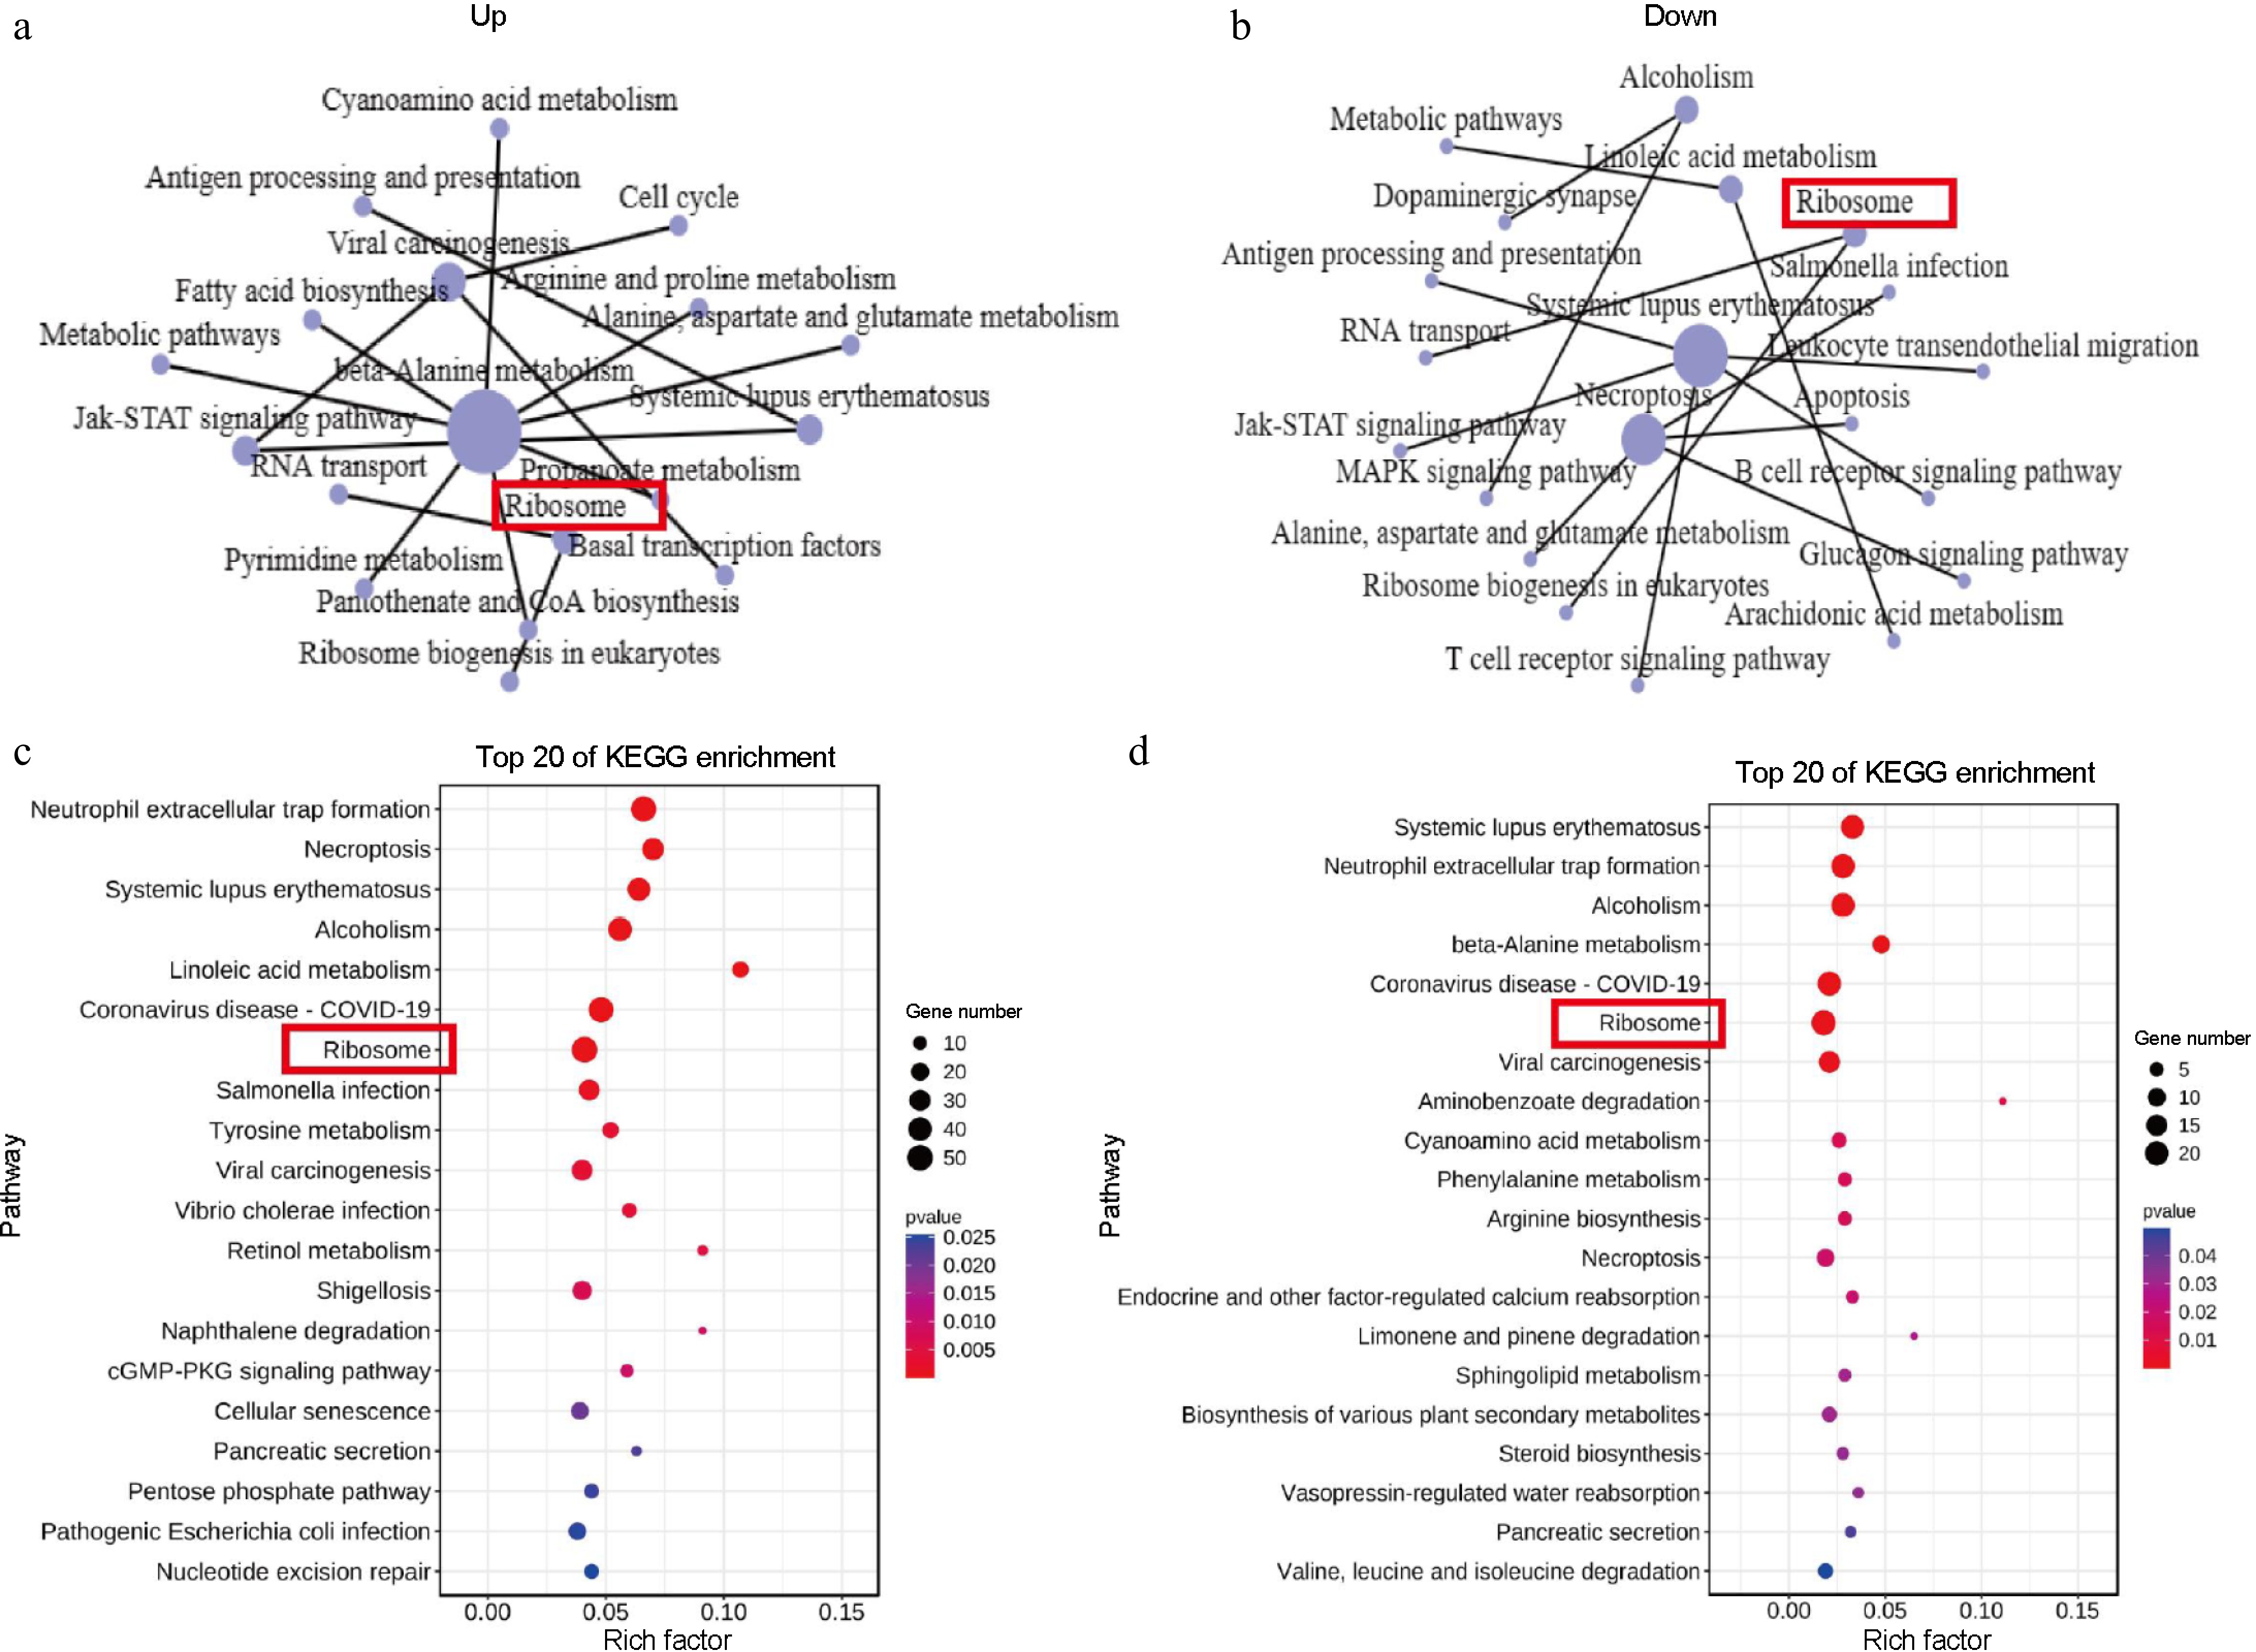
Figure 4.
KEGG enrichment analysis. (a), (b) KEGG network diagram of the 15 core pathway relationships. (c), (d) Top 20 enriched KEGG pathways among the DEGs. The y-axis presents the different KEGG pathways and the x-axis presents the rich factor. A rich factor is the ratio of the number of DEGs annotated with a pathway term relative to the total number of genes annotated with this pathway term. The larger the rich factor, the greater the enrichment of this KEGG pathway; D3YS: On the fourth day 'Yellow Planet' shoots apical meristems; D3RS: On the fourth day 'Red Morning' shoots apical meristems.
-
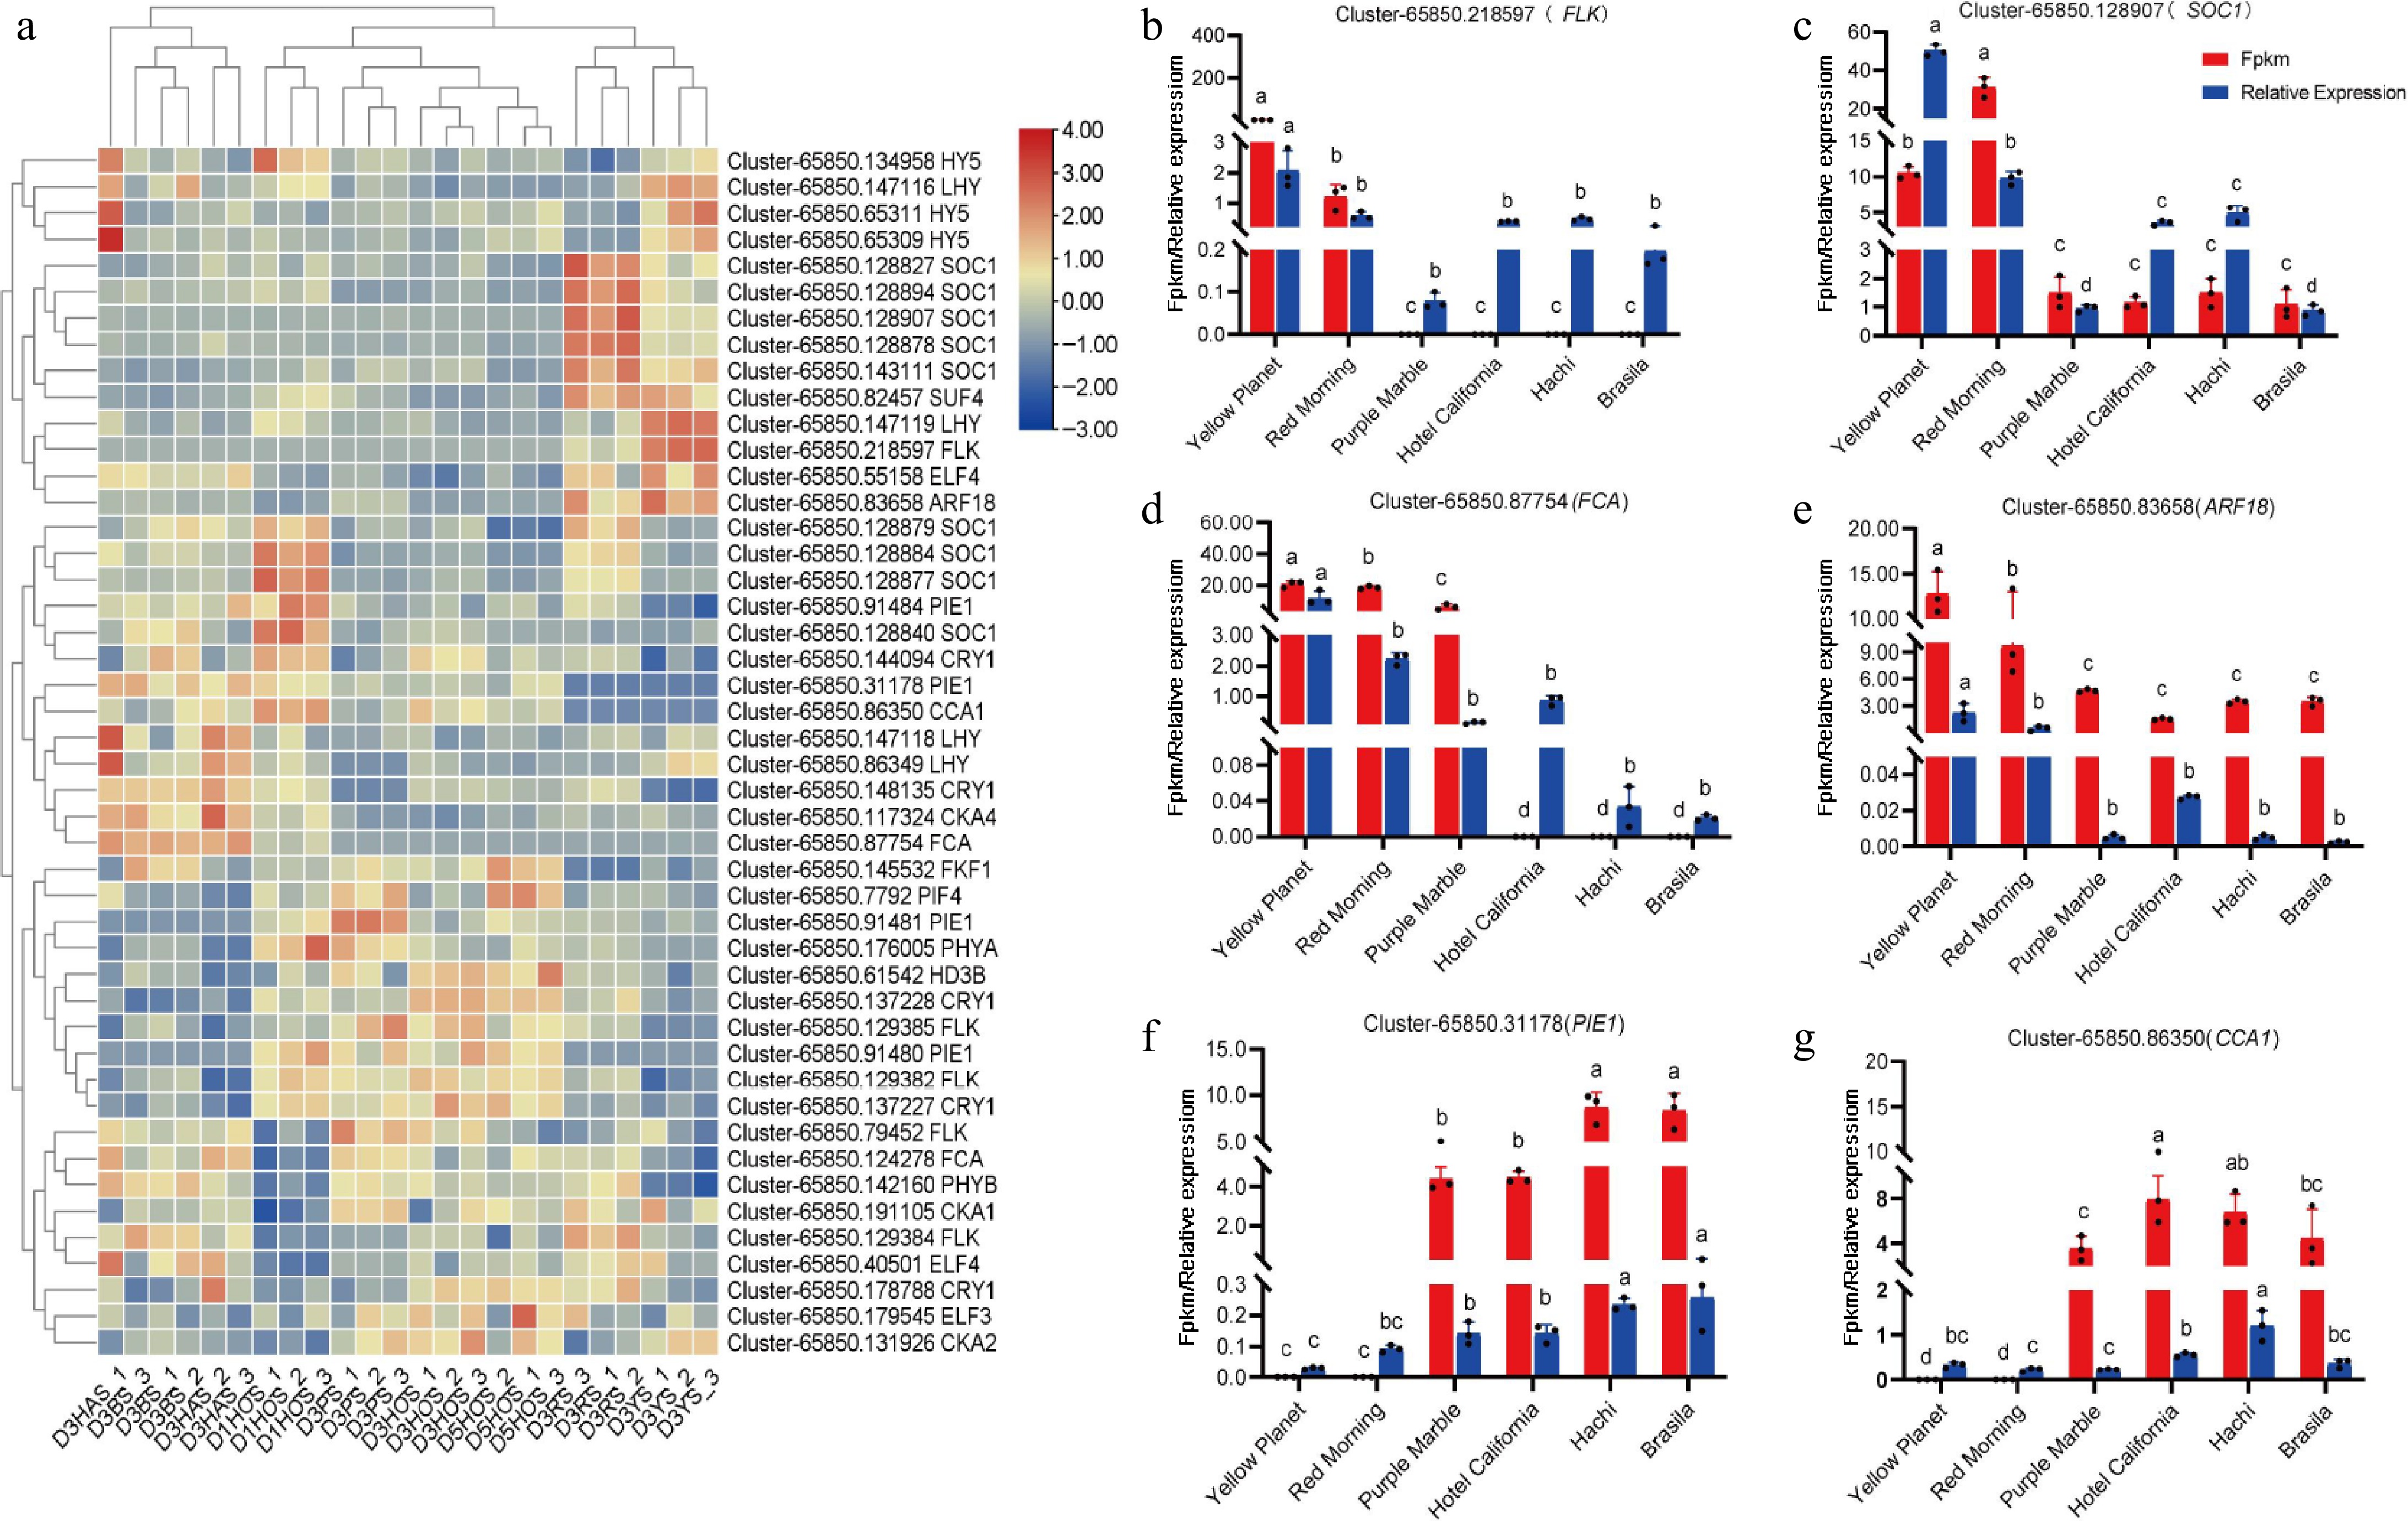
Figure 5.
Expression of key genes involved in photoperiodic pathways during flower bud initiation. (a) DEGS associated with lily bud initiation in the photoperiodic pathway, where red and blue indicate up-regulated and down-regulated DEGs. (b) Cluster-65850.218597(FLK). (c) Cluster-65850.128970 (SOC1). (d) Cluster-65850.87754 (FCA). (e) Cluster-65850.83658 (ARF18). (f) Cluster-65850.31178 (PIE1). (g) Cluster-65850.86350 (CCA1). Red represents the results from transcriptome data, while blue indicates the results from the qRT-PCR analysis. The same letter means the difference is not significant (p > 0.05), and different letters indicate the difference is significant (p < 0.05).
-
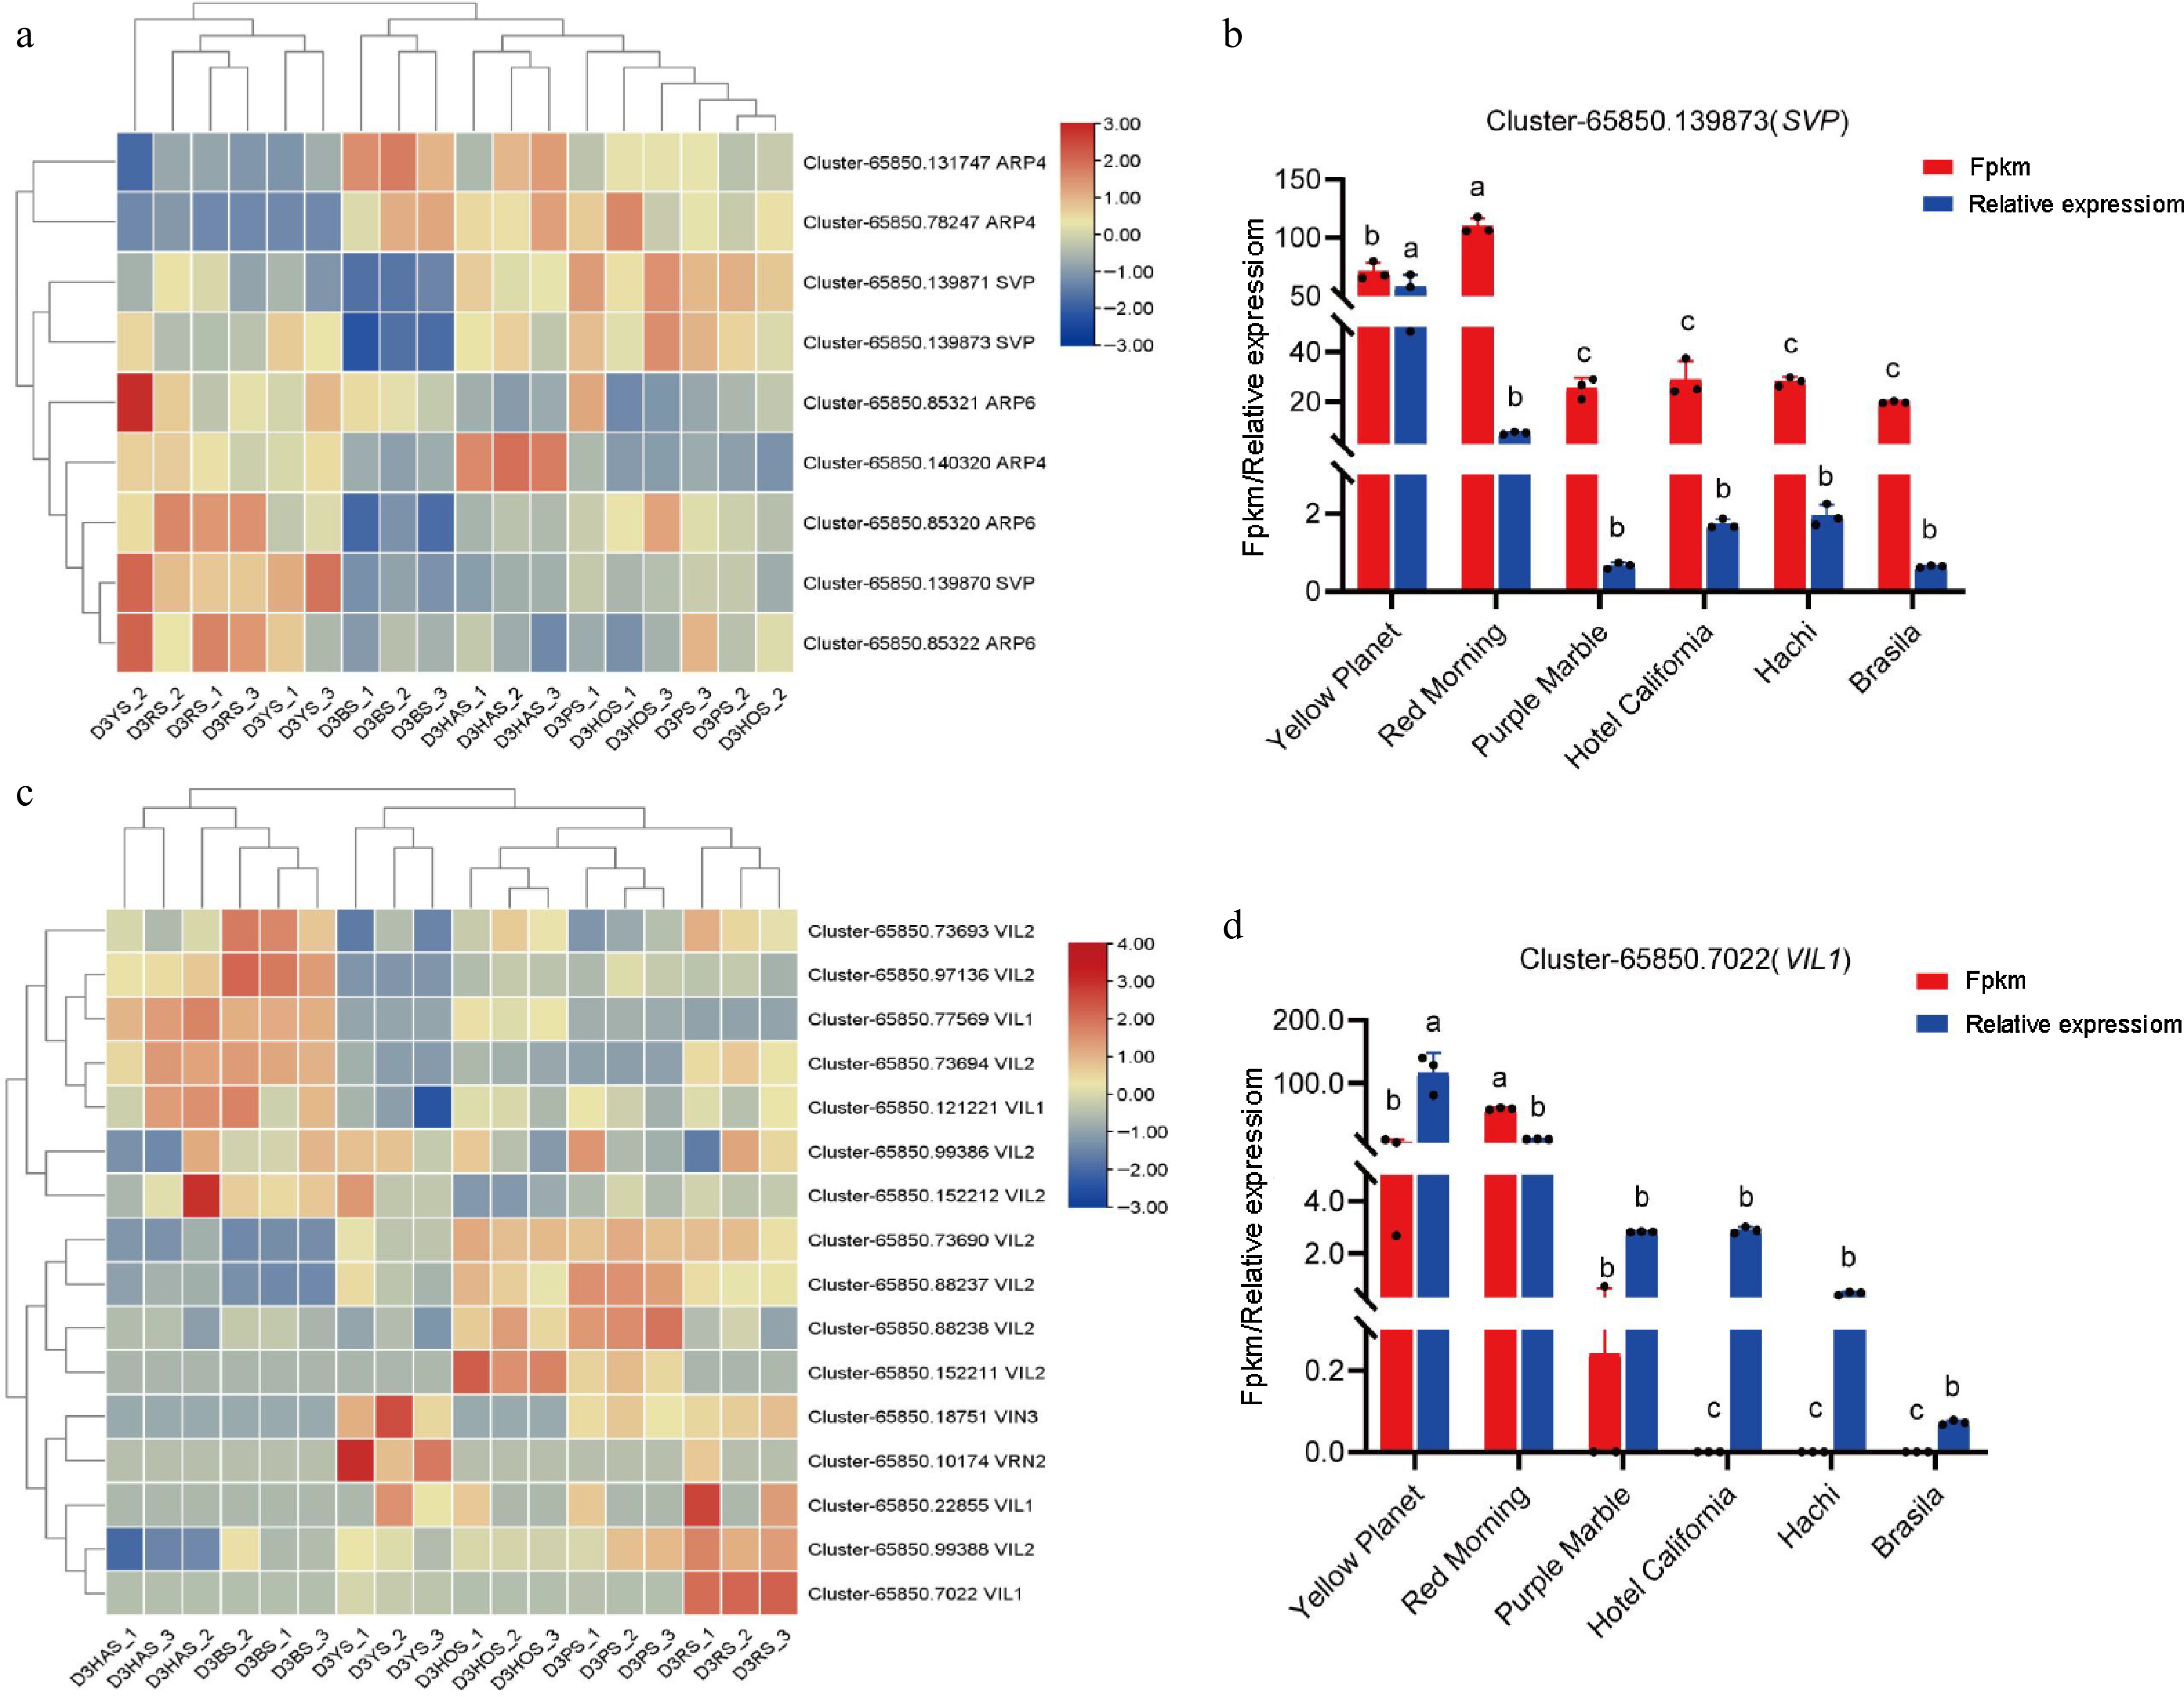
Figure 6.
Expression of key genes during flower bud initiation. (a) DEGs associated with lily bud initiation under the temperature pathway, where red and blue indicate up-regulated and down-regulated DEG. (b) 'Yellow Planet' and 'Red Morning' serve as controls (CK), showing up-regulation compared with the other four series. (c) DEGs associated with lily bud initiation under the vernalization pathway. Red and blue indicate up-regulated and down-regulated DEGs. (d) 'Yellow Planet' and 'Red Morning' serve as controls (CK) and show up-regulation compared with the other four series. Red indicates results from transcriptome data, while blue indicates results from qRT-PCR. The relative expression levels were measured using qRT-PCR (y-axis), with data representing the average of three biological replicates and three technical replicates. The same letter indicates no significant difference (p > 0.05), whereas different letters indicate a significant difference (p < 0.05).
-
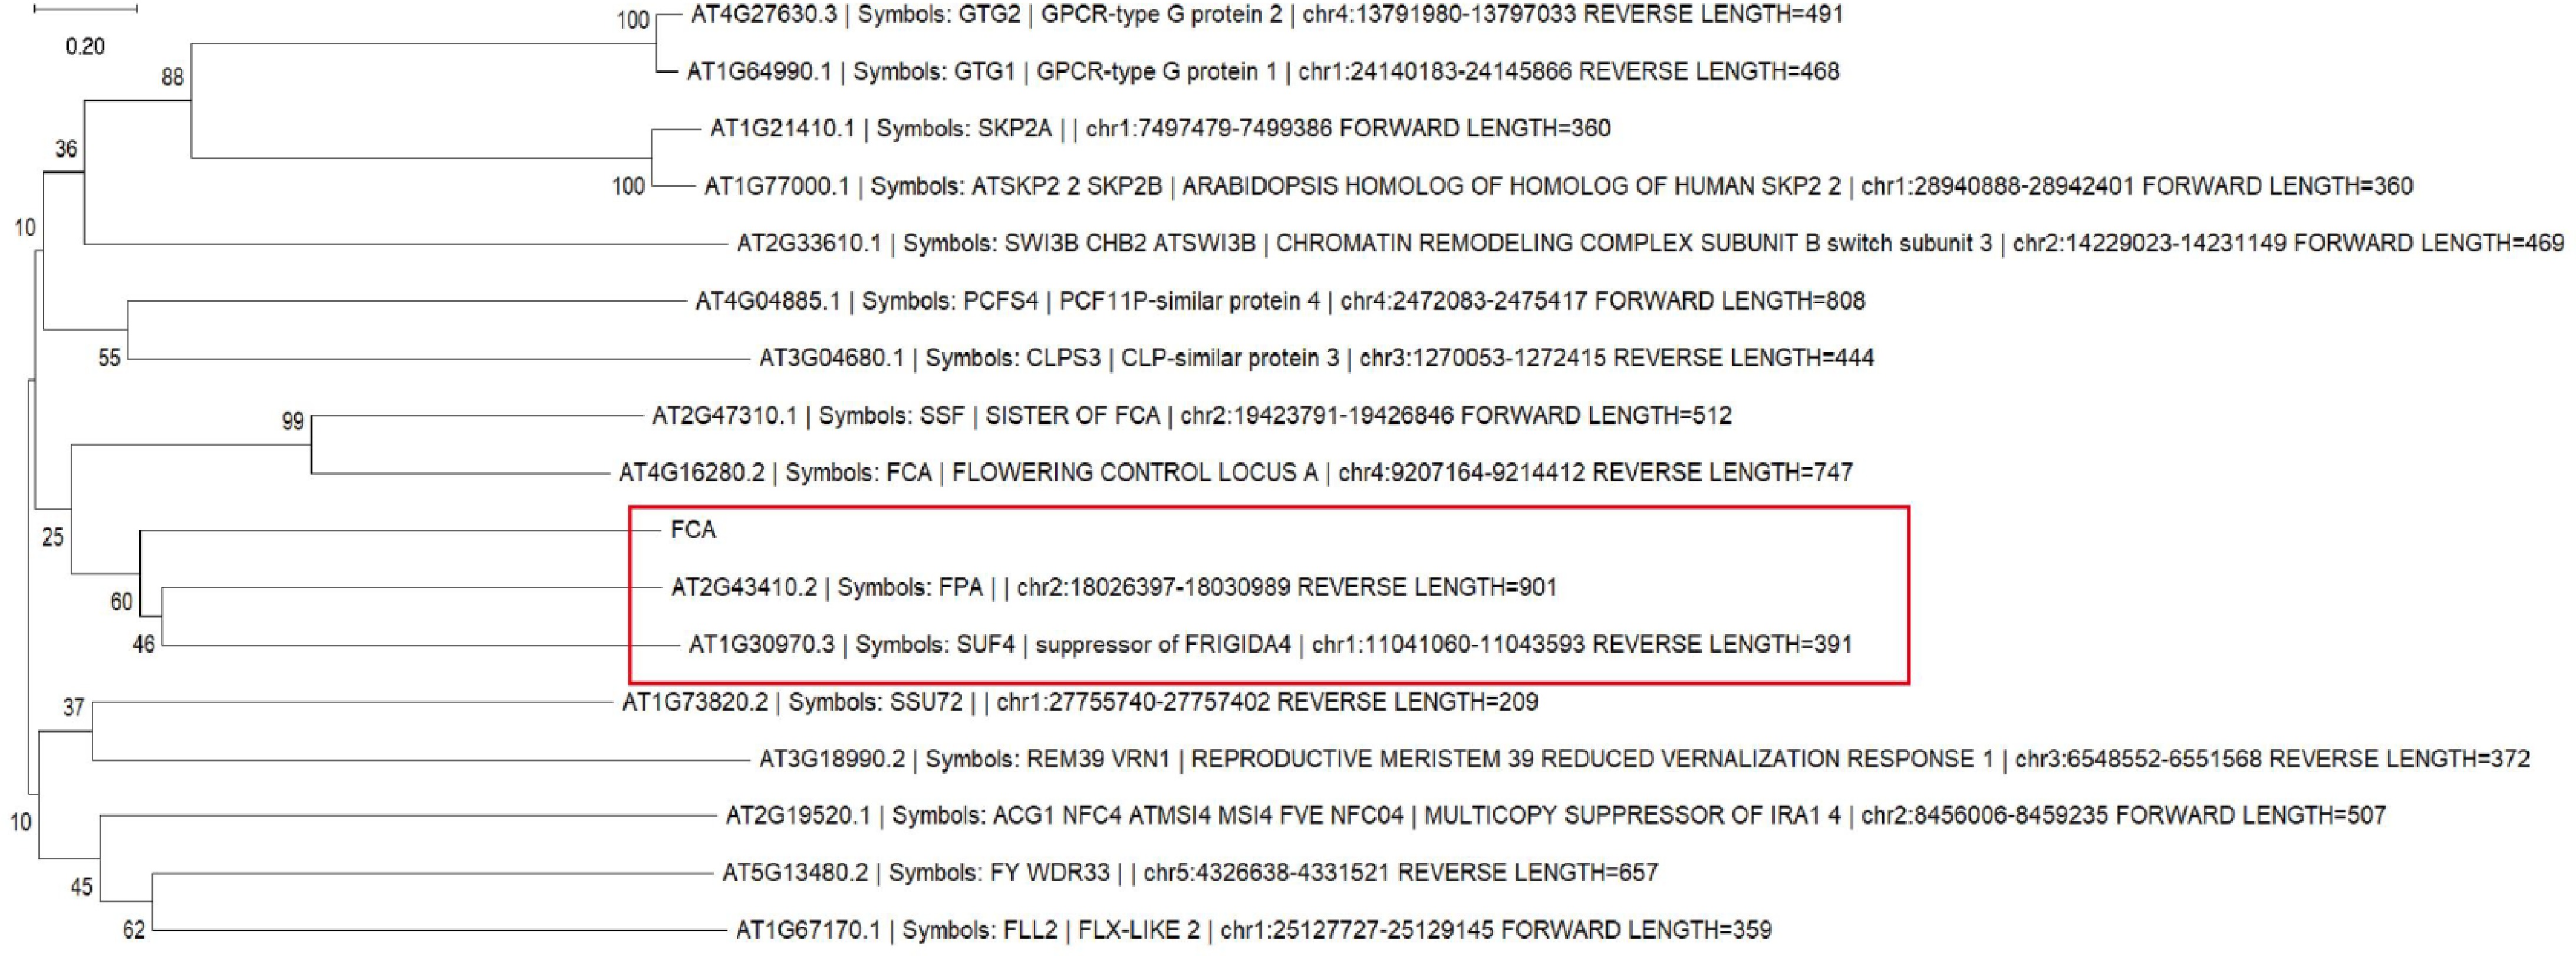
Figure 7.
Phylogenetic tree of homologous genes in FCA of Arabidopsis and Cluster-65850, 87754 (FCA).
-
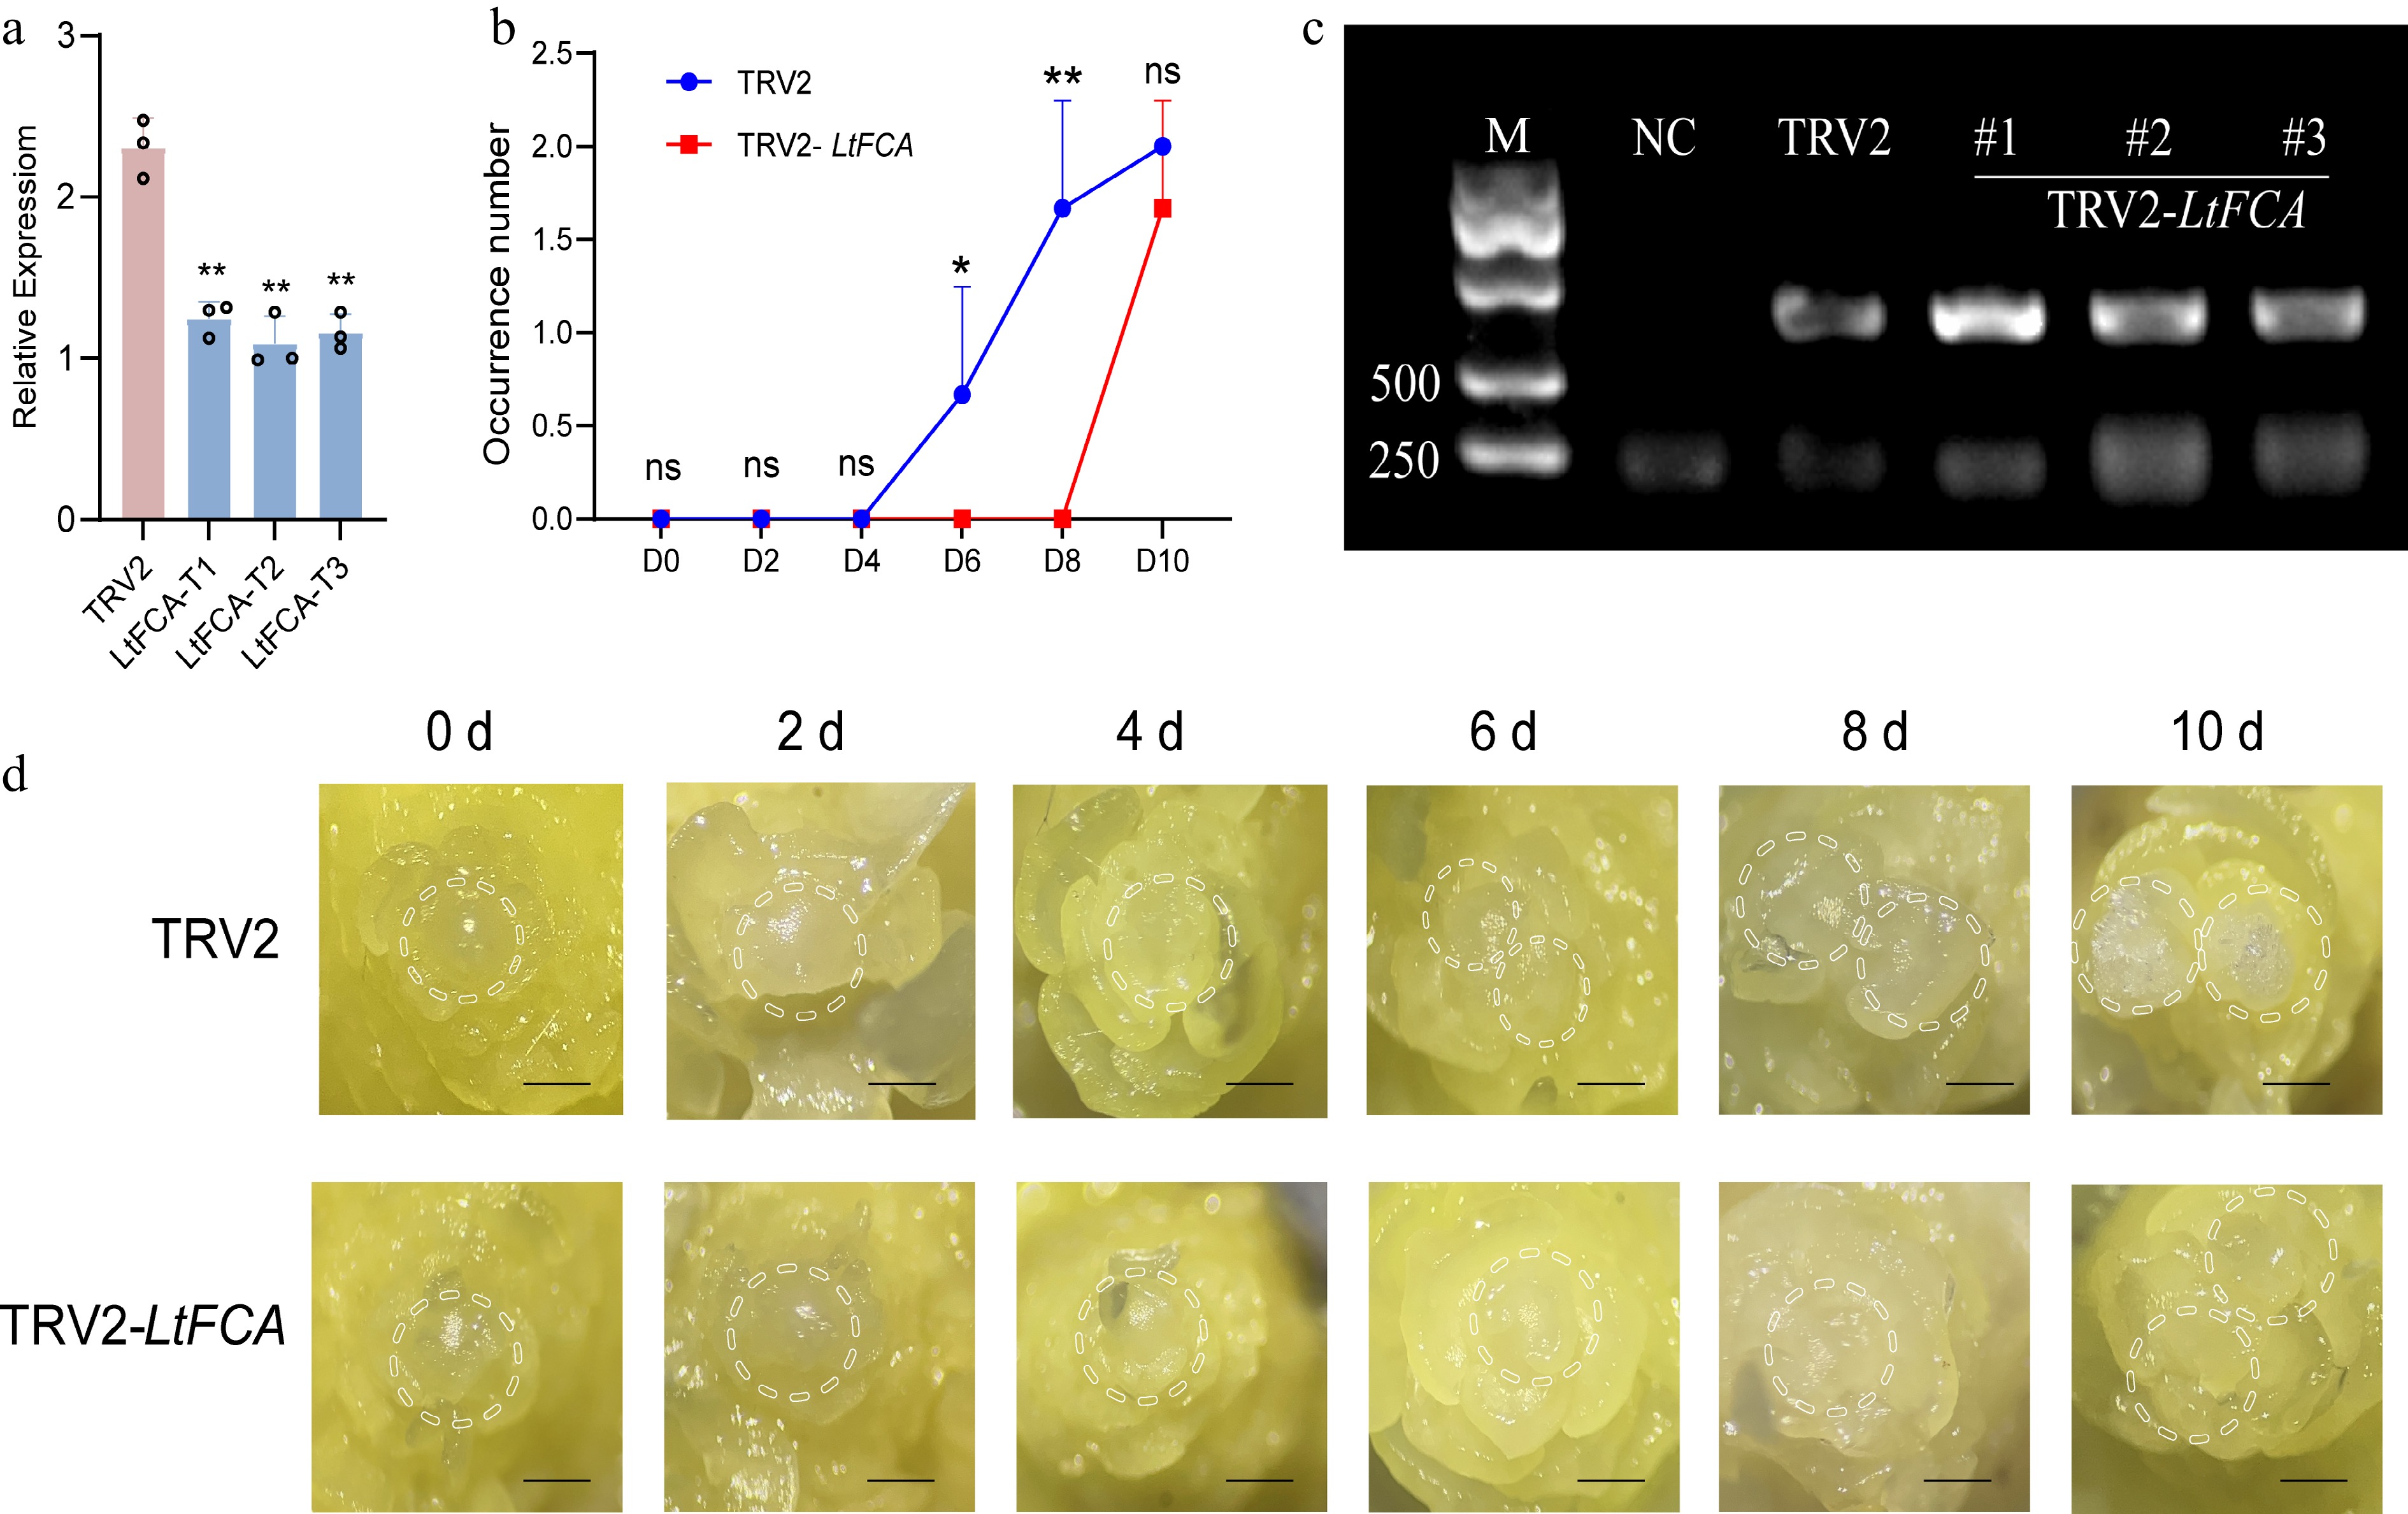
Figure 8.
Gene expression levels and phenotypic changes in lily flowering transition following LtFCA silencing. (a) After gene silencing, LtFCA expression was significantly decreased compared with TRV2, with triplicate samples (T1, T2, and T3) analyzed. qRT-PCR values were calculated using the 2−ΔΔCᴛ method (* p < 0.05; ** p < 0.01). (b) The flower bud occurrence number of TRV2 and TRV2-LtFCA after gene silencing, with three flower buds taken from each time point and repeated in triplicate. (c) CP protein virus detection; M: marker; NC: water. (d) After VIGS, phenotypic changes in the flowering transition process of lilies were observed in TRV2 and TRV2-LtFCA silenced plants. The scale bars represent 100 μm. (*p < 0.05; **p < 0.01).
-
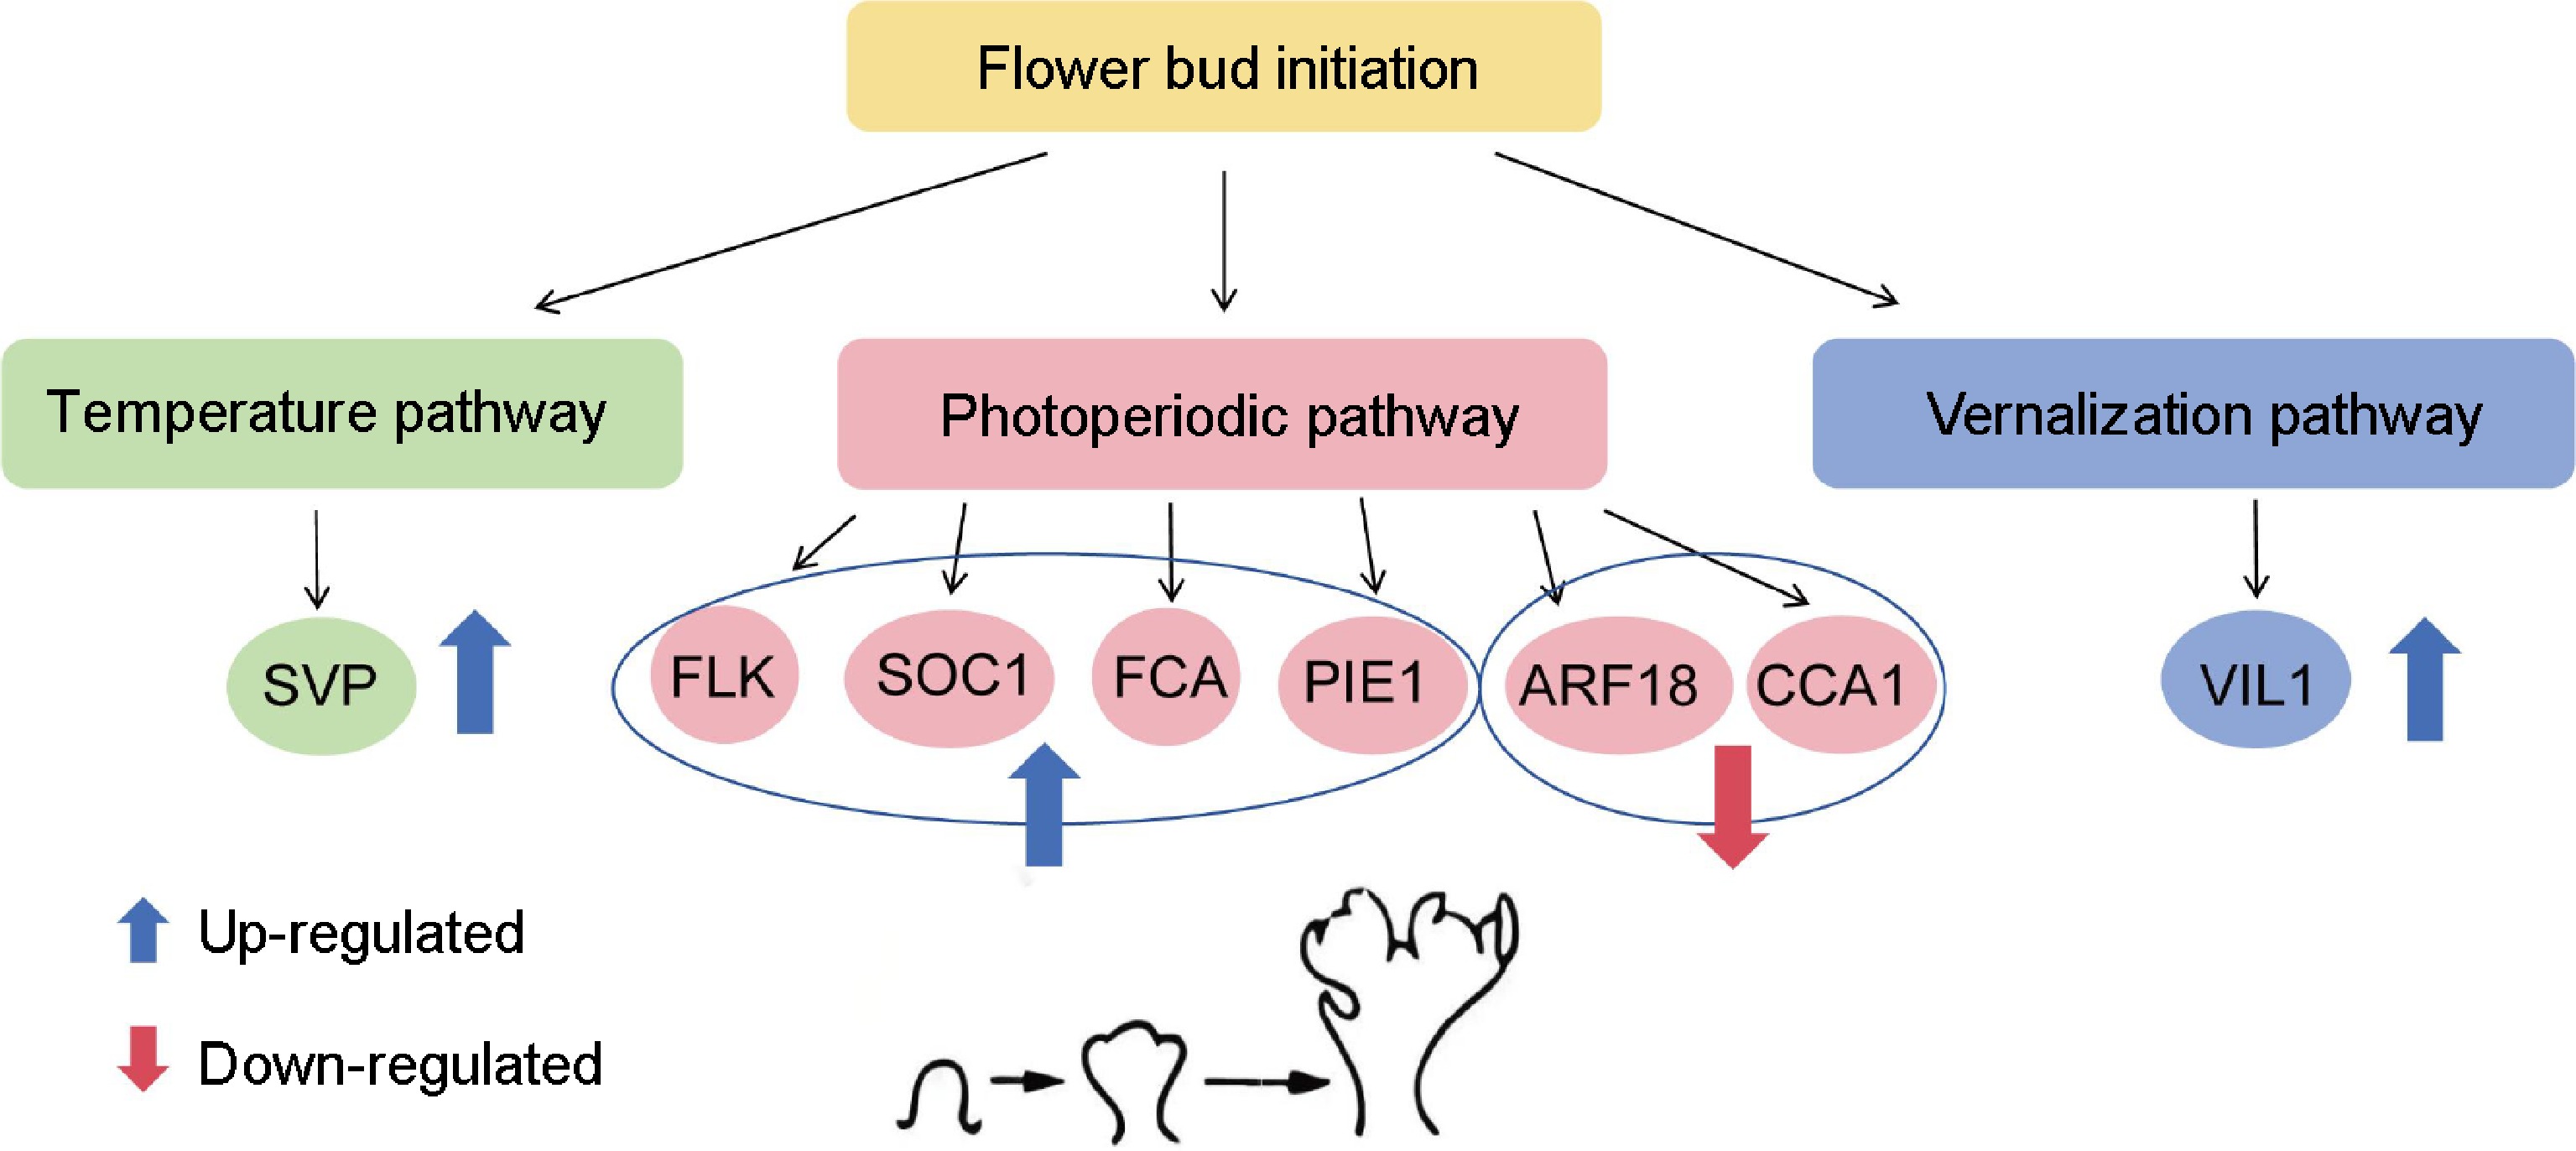
Figure 9.
Schematic model of temperature, photoperiod, and vernalization pathways involved in the flower transition of lilies. The blue circle represents gene expression involved in the photoperiodic pathway. The blue indicates upregulation, and red indicates downregulation.
Figures
(9)
Tables
(0)