


-
Lily (Lilium spp.) are perennial bulb flowers in the lily family and can be subdivided as Asiatic lily, Martagon lily, Longiflorum lily, Oriental lily, Trumpet lily, Candidum lily, American lily, LO hybrid lily, OT hybrid lily, LA hybrid lily, Lily species, and other hybrids, and play an important role in the international flower market. The transition from vegetative to reproductive growth begins with flower bud initiation at the shoot apical meristems (SAMs)[1]. Flower bud initiation is the process in which the shoot apical meristem changes to become competent to develop flowers, phenotypically the formation of a flowering bud can be observed. The timing of lily flowering affects market availability and the quality of cut flowers, with significant variations among different series and varieties; therefore, investigating the regulatory mechanisms of lily bud initiation is crucial for improving efficiency in the lily industry and laying an important foundation for timing the supply of lilies to the market.
Flower bud initiation is a complex process influenced by internal and external factors, including the external environment, carbohydrate metabolism, and endogenous hormones[2]. The regulation of flowering primarily involves the photoperiod pathway, vernalization pathway, autonomous pathway, and gibberellin (GA) pathway[3,4]; however, with advancement in research, new flowering regulatory pathways have emerged, including the age pathway, cytokinin pathway, temperature pathway, and glucose metabolism[5−11].
Temperature and light are the most extensively studied factors influencing flower bud initiation, followed by nutrient availability and water content. Cold exposure induces sprouting and bud development following the release from bulb dormancy and floral transition (vernalization) in lilies[12]. Preliminary studies have disclosed that flower bud initiation in Asian lilies is initiated approximately 45 d after cold storage and is mostly accomplished within 30 d after planting[13,14].
Carbohydrates, as important energy substances in plants, are closely related to the induction of plant flower transition[15]. Carbohydrate accumulation can promote flower bud initiation, accelerate the process, and improve differentiation quality[16]. The sucrose content gradually increases as the flower buds develop during flower bud initiation[17]. Different hormones regulate flower formation at various stages of flower bud initiation. Studies on lily flower bud initiation mainly focus on the effects of abscisic acid and GA[18].
Furthermore, the expression of different genes can also influence the timing of the flowering transition. In lilies, LiLFY1 has been shown to participate in flower bud initiation, mainly expressed in young flower buds and the apical meristem of lilies[19]. CONSTANS (CO) and FLOWERING LOCUS T (FT) are key genes in the photoperiodic pathway and have been confirmed to be involved in regulating flowering time in lilies[20]; LfCOL9 and LfFT1 promoted flower transformation in Lilium longiflorum[21]. FLC mediates the vernalization and autonomous pathways, whereas CO mediates the photoperiodic pathway[22]. The MADS-box family genes VRN2, FLC, SOC1, as well as LFY, MIKC, and ARF, are transcription factors included in lily floral induction and DNA methylation correlated to lily vernalization under low temperatures[23]; however, few reports exist on lily bud initiation, and further research on the gene regulation mechanisms and transgenic functions is needed to explore the molecular mechanisms underlying lily bud initiation.
To explore the differences in floral transition among various Lilium series, histological analyses were performed using paraffin sections of lily flower buds. The results revealed that the floral transition in the T and OT-series occurred later compared with the other series. Additionally, RNA-seq was conducted to analyze the expression patterns of differentially expressed genes (DEGs) involved in the photoperiod, vernalization, and temperature response pathways. Ultimately, several candidate genes potentially involved in regulating lily flower bud initiation were identified, validating the accuracy of these RNA-seq data. This study provides theoretical guidance on the floral transition of various lily series and offers insights into the market timing of cut lilies.
-
The lilies used in this study were stored at the Beijing Academy of Agriculture and Forestry Sciences, maintained at temperatures between −2 °C and 0 °C. Lily bulbs are all dormant and flower buds are undifferentiated. Lily in a dormant state means that the central flower bud is in a static state, and it takes a certain time to release dormancy, about 8−12 weeks. Healthy, single-bulb lilies (12−13 cm in diameter) were selected and planted in a greenhouse at 22 °C, with 60%−70% relative humidity and a 16-h light/8-h dark cycle. Samples were collected every 2 d at six time points (0, 2, 4, 6, 8, and 10 d). The varieties included the O-series 'Brasilia,' 'Hachi,' the T-series 'Yellow Planet,' the OT-series 'Red Morning', the LA-series 'Purple Marble', and the OA-series 'Hotel California'.
Section observation and record
-
Materials were taken every 2 d, and an electron microscope (LEICA DMi1) was used to observe the lily bud state and take photos. For each period, eight lily bulbs were selected, scales were removed, and the flower bud differentiation status was observed under a microscope to calculate the differentiation rate.
Paraffin sectioning
-
SAMs were collected at 0, 2, 4, 6, 8, and 10 d and immediately fixed overnight in Formalin Aceto-Alcohol (FAA) buffer. The paraffin section method requires dehydrating the fixed flower bud step-by-step with ethanol of different concentrations and then slicing, spreading, and baking them with a slicer after they are transparent, waxed, and embedded. After sitting overnight, the flowers are dyed with Safranine O and Fast Green FCF and sealed with neutral gum. Finally, the tissue cell structure was observed under an optical microscope (LEICA Optical biological microscope DM750)[24].
RNA extraction and quantitative qRT-PCR
-
'Yellow Planet' flower buds were harvested for quantitative real-time polymerase chain reaction (qRT-PCR) analysis in parallel with the RNA sequencing (RNA-seq) sampling. Total RNA was extracted using an RNA extraction kit (RC401, Vazyme, Nanjing, China), and subsequently converted into complementary DNA (cDNA) using a reverse transcription kit (R333, Vazyme, Nanjing, China). The qRT-PCR was carried out with TB Green® Premix Ex Taq™ II (RR820A, Dalian, China) on a Bio-Rad CFX96TM Real-Time System (California, USA). The relative expression levels of the target genes were calculated using the 2−ΔΔCᴛ method, with the F-box family protein (FP) gene as the internal reference for normalization[25]. Each qRT-PCR experiment was replicated with three independent biological samples. The gene-specific primers are presented in Supplementary Table S1 (* p < 0.05; ** p < 0.01).
Gene annotation, enrichment, and differential expression analysis
-
The unigenes were annotated by aligning them with the Protein family (Pfam), Swiss-Prot, Karyotin Ortholog Groups (KOG), and Gene Ontology (GO) databases. GO term enrichment and Kyoto Encyclopedia of Genes and Genomes (KEGG) pathway analyses were performed to identify key genes and pathways associated with lily bud initiation[26]. Differentially expressed genes (DEGs) underwent GO and KEGG pathway enrichment analyses using Omicshare tools[27]. P-values from the enrichment analyses were adjusted for multiple hypothesis testing using PerlScript[28], with statistical significance set at p < 0.05. Furthermore, DEGs were annotated through BLAST searches against known flowering genes in Arabidopsis and examined for functional roles related to floral development[29].
Virus-induced gene silencing
-
To construct the VIGS vector for Tobacco Rattle Virus 2 (TRV2)-LtFCA, a 197-base pair (bp) gene-specific fragment targeting the gene of interest was designed. The Agrobacterium precipitates were collected and resuspended in a solution containing 10 mM MgCl2, 10 mM MES, and 200 μM AS (pH 5.8) to achieve a final OD600 of 1.0. The TRV1 bacterial suspension was mixed with the TRV2 and TRV2-LtFCA suspensions in a 1:1 ratio. The 'Yellow Planet' lily bulbs were immersed in the bacterial mixture under 0.8 MPa for 3 min, repeated twice. Then, the bulbs were planted in a greenhouse at 22 °C, with 60%–70% relative humidity and a 16-h light/8-h dark cycle. Samples were collected every 2 d at six time points (0, 2, 4, 6, 8, and 10 d), 0 d means that after soaking the bulbs, the flower buds are directly frozen with liquid nitrogen, and the rest of the bulbs are planted in the greenhouse, with three flower buds taken from each time point and 6 d were taken to verify gene expression.
-
Microscopic observations were conducted to investigate the structural characteristics of the apical meristem in different lily cultivars. At 4 d, 'Brasilia', 'Hachi', 'Purple Marble', and 'Hotel California' developed two rounded meristems, with a third meristem appearing between 6 and 10 d. Interestingly, the comparison cultivars, 'Yellow Planet' and 'Red Morning' only showed two rounded meristems by 10 d, with no significant changes observed during the first 8 d (Fig. 1a).
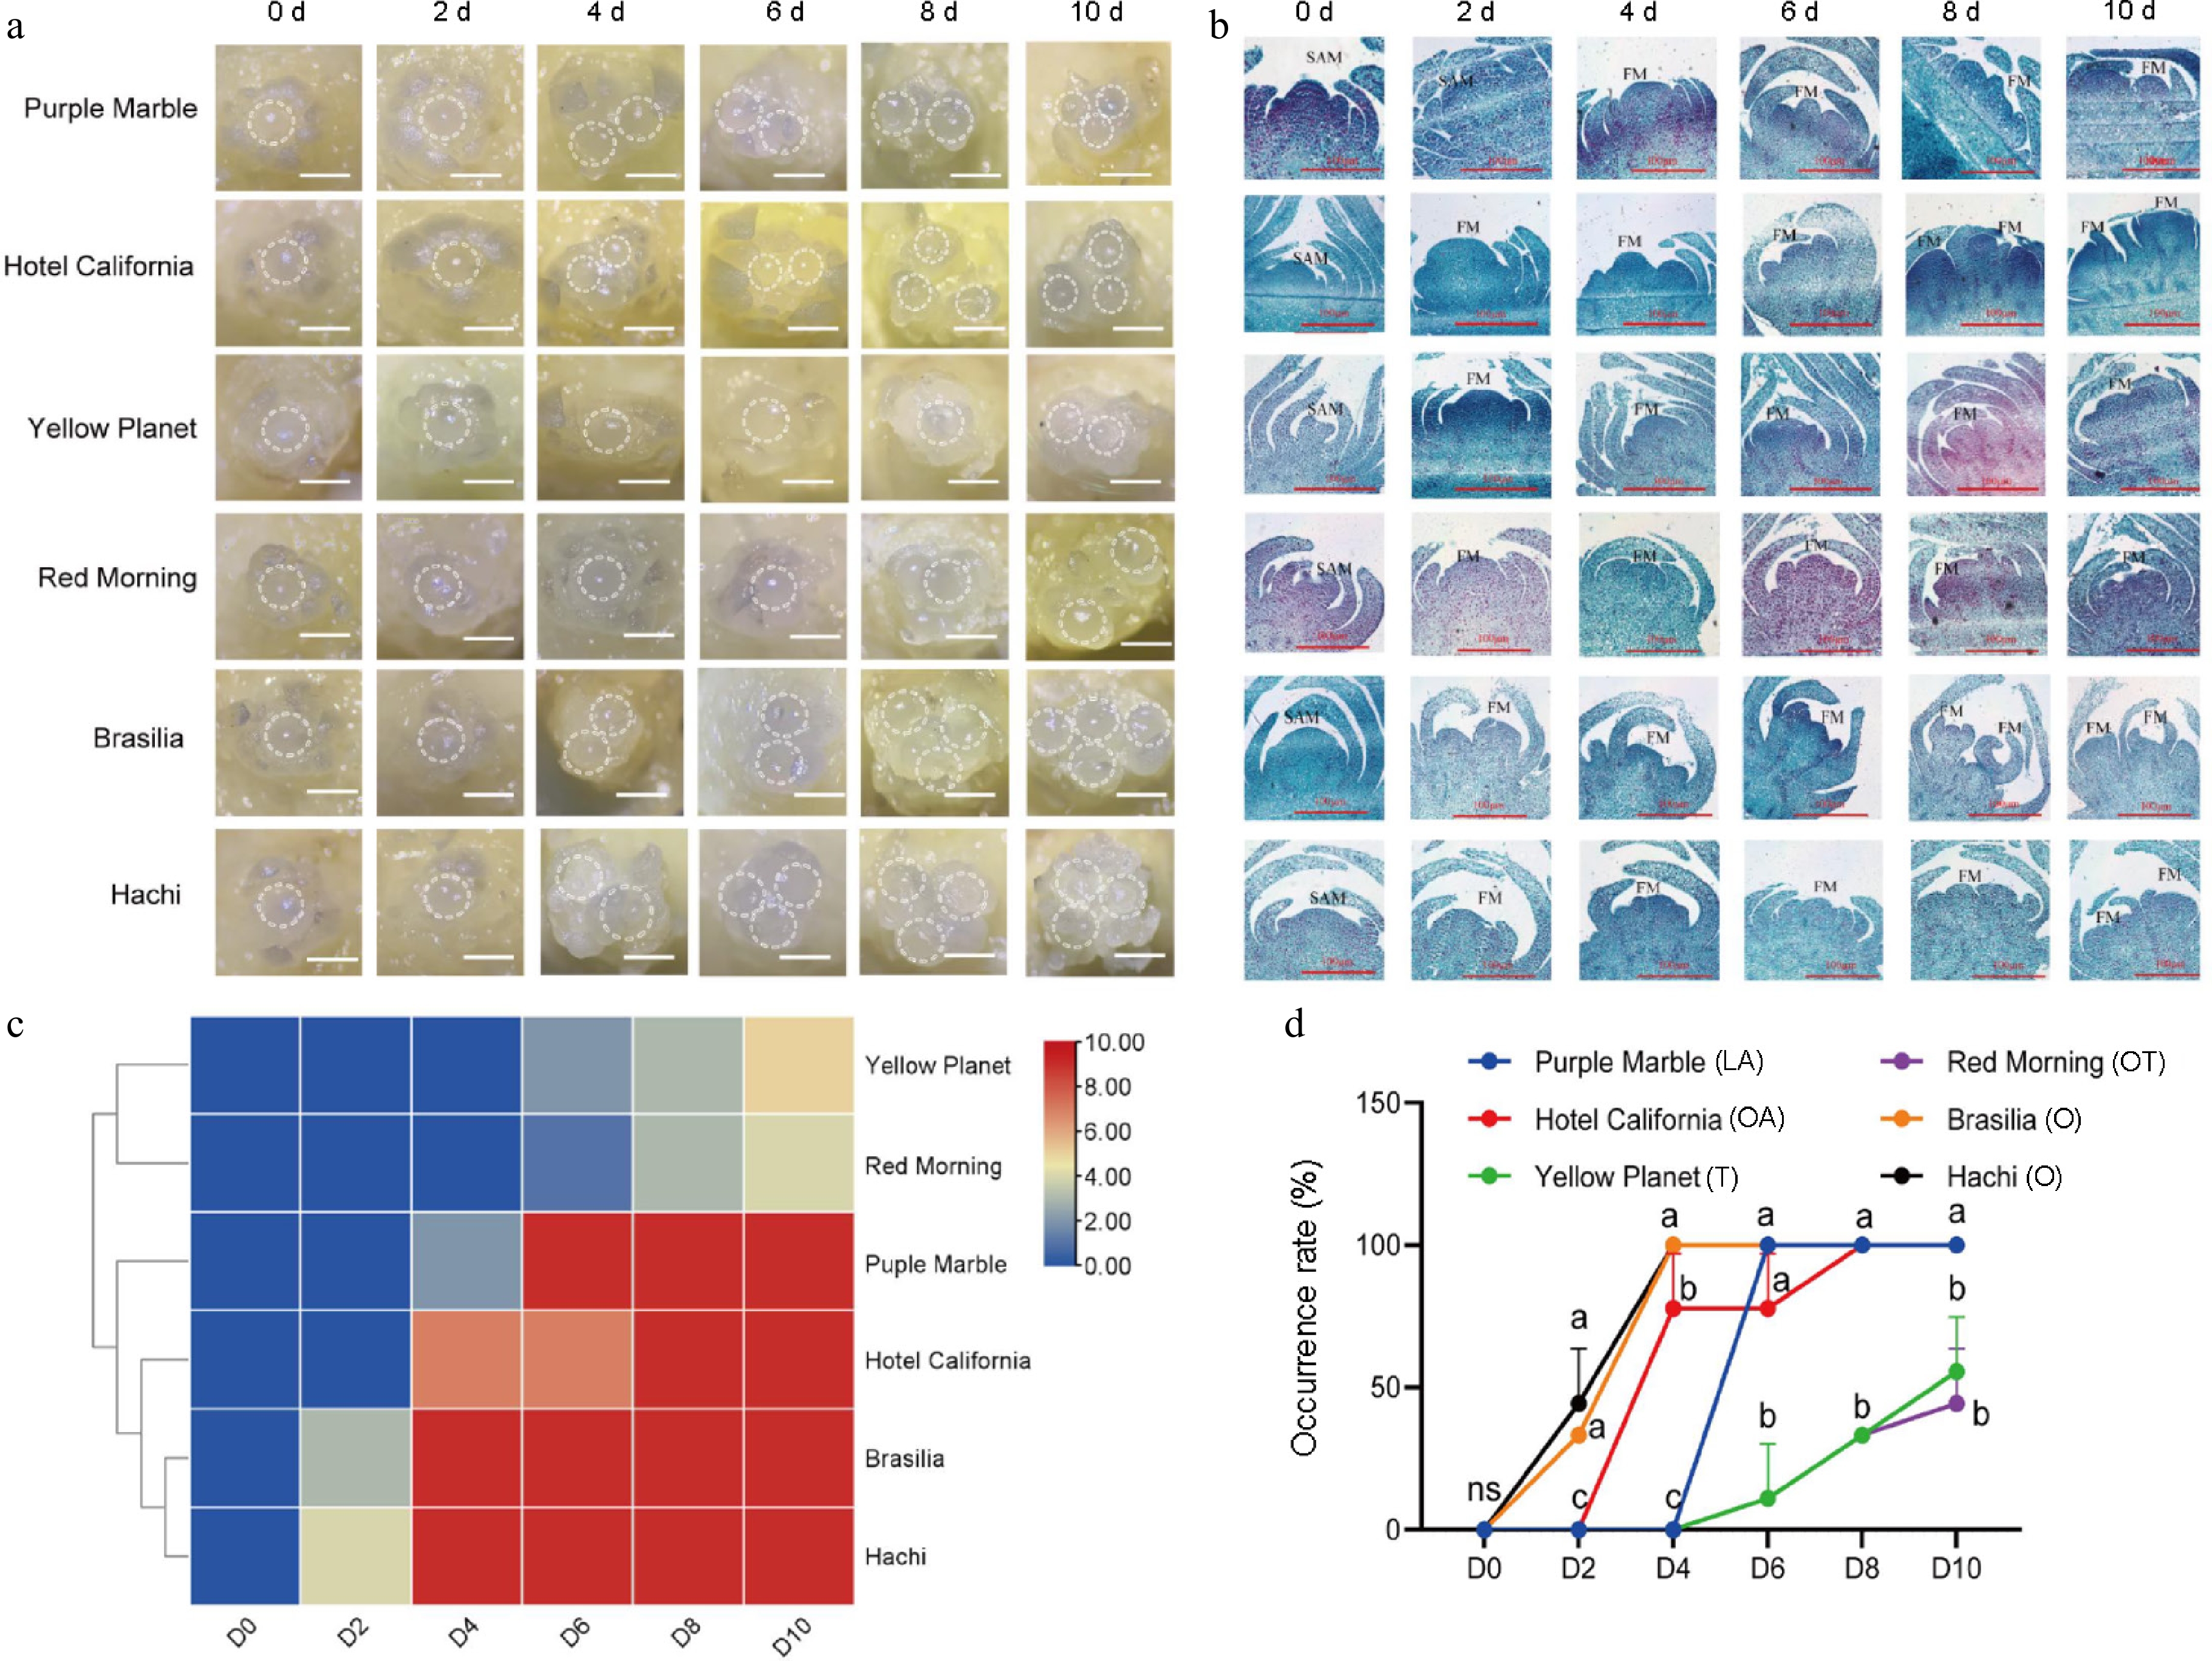
Figure 1.
Morphological characteristics and differentiation rate of different lily cultivars during flower transition. (a) External morphology of buds at different development stages. (b) Flower bud initiation process of different series of lily flower buds under paraffin sections. SAM: shoot apical meristem; FM: floral meristem. The scale bars represent 100 μm. (c) Flower bud initiation rate of different varieties of lily at different time periods. The horizontal coordinates 0−10 d indicate the division of sampling time. A color scale from blue to red indicates a much higher incidence. (d) The incidence of flower buds of different varieties in different periods. ns: not significant; different letters represent significant differences, with three flower buds taken from each time point and repeated in triplicate.
The paraffin sectioning results indicated that all six lily varieties were in the undifferentiated phase, with smooth flower bud surfaces tightly adhering to the adjacent scales. At 2 d, 'Purple Marble', 'Hotel California', 'Brasilia', and 'Hachi' entered the early differentiation stage, with the bases of their flower buds beginning to expand. At 6 d, while the cells of these varieties remained tightly arranged, the floral primordia enlarged, causing the flower buds to bulge and deform. The apex of the floral meristem showed fluctuating changes, indicating the onset of petal primordium differentiation. At 8 d, two distinct small flower buds were visible in 'Brasilia' and 'Hachi' confirming the differentiation of floral organs. At 10 d, the external scales of 'Purple Marble', 'Hotel California,' 'Brasilia', and 'Hachi' became sparse, while their internal structures developed into flower bud forms, confirming inflorescence formation. Notably, no significant changes were observed in 'Yellow Planet' and 'Red Morning', indicating that the T-series and OT-series exhibit late flowering phenomena (Fig. 1b).
This study found that the O-series 'Brasilia' and 'Hachi' exhibited flower bud initiation changes as early as 2 d, classifying them as early flowering types. The LA-series 'Purple Marble' and the OA-series 'Hotel California' showed changes a few days later. In contrast, the OT-series 'Red Morning' and the T-series 'Yellow Planet' were classified as late flowering types (Fig. 1c). The differentiation rates of various series and cultivars were recorded at different time points; the earliest differentiation rates were observed in the O-series 'Brasilia' and 'Hachi'. In contrast, the slowest rates were noted in the T-series 'Yellow Planet' and the OT-series 'Red Morning', indicating significant variability (Fig. 1d).
These morphological and cytological changes are external manifestations of flower bud transition and are bound to be affected by the regulation of internal gene expression. Therefore, we further analyzed the gene expression differences during flower bud transition by RNA-seq technology to reveal their intrinsic molecular regulatory mechanisms.
GO and KEGG enrichment analysis of DEGs
-
To identify genes potentially involved in flower bud initiation, the differences in gene expression between D3YS ('Yellow Planet' SAM at 4 d) vs D3PS ('Purple Marble' SAM at 4 d), and D3RS ('Red Morning' SAM at 4 d) vs D3PS in lily were analyzed. In the RNA-seq analysis, the fragments per kilobase of the exon model per million mapped fragments (FPKM) method was used to assess gene expression levels. Volcano plots show the numbers of upregulated and downregulated genes (Fig. 2a). Furthermore, this study examined the number of upregulated and downregulated genes based on pairwise comparisons between D3YS and other varieties (Fig. 2b), as well as between D3RS and other varieties (Fig. 2c). The RNA-seq analysis revealed a total of 374,374 genes, of which 5829 upstream unigenes (Fig. 2d) and 1009 downstream unigenes (Fig. 2e) were identified using D3YS + D3RS vs D3BS + D3HOS + D3HAS + D3PS.
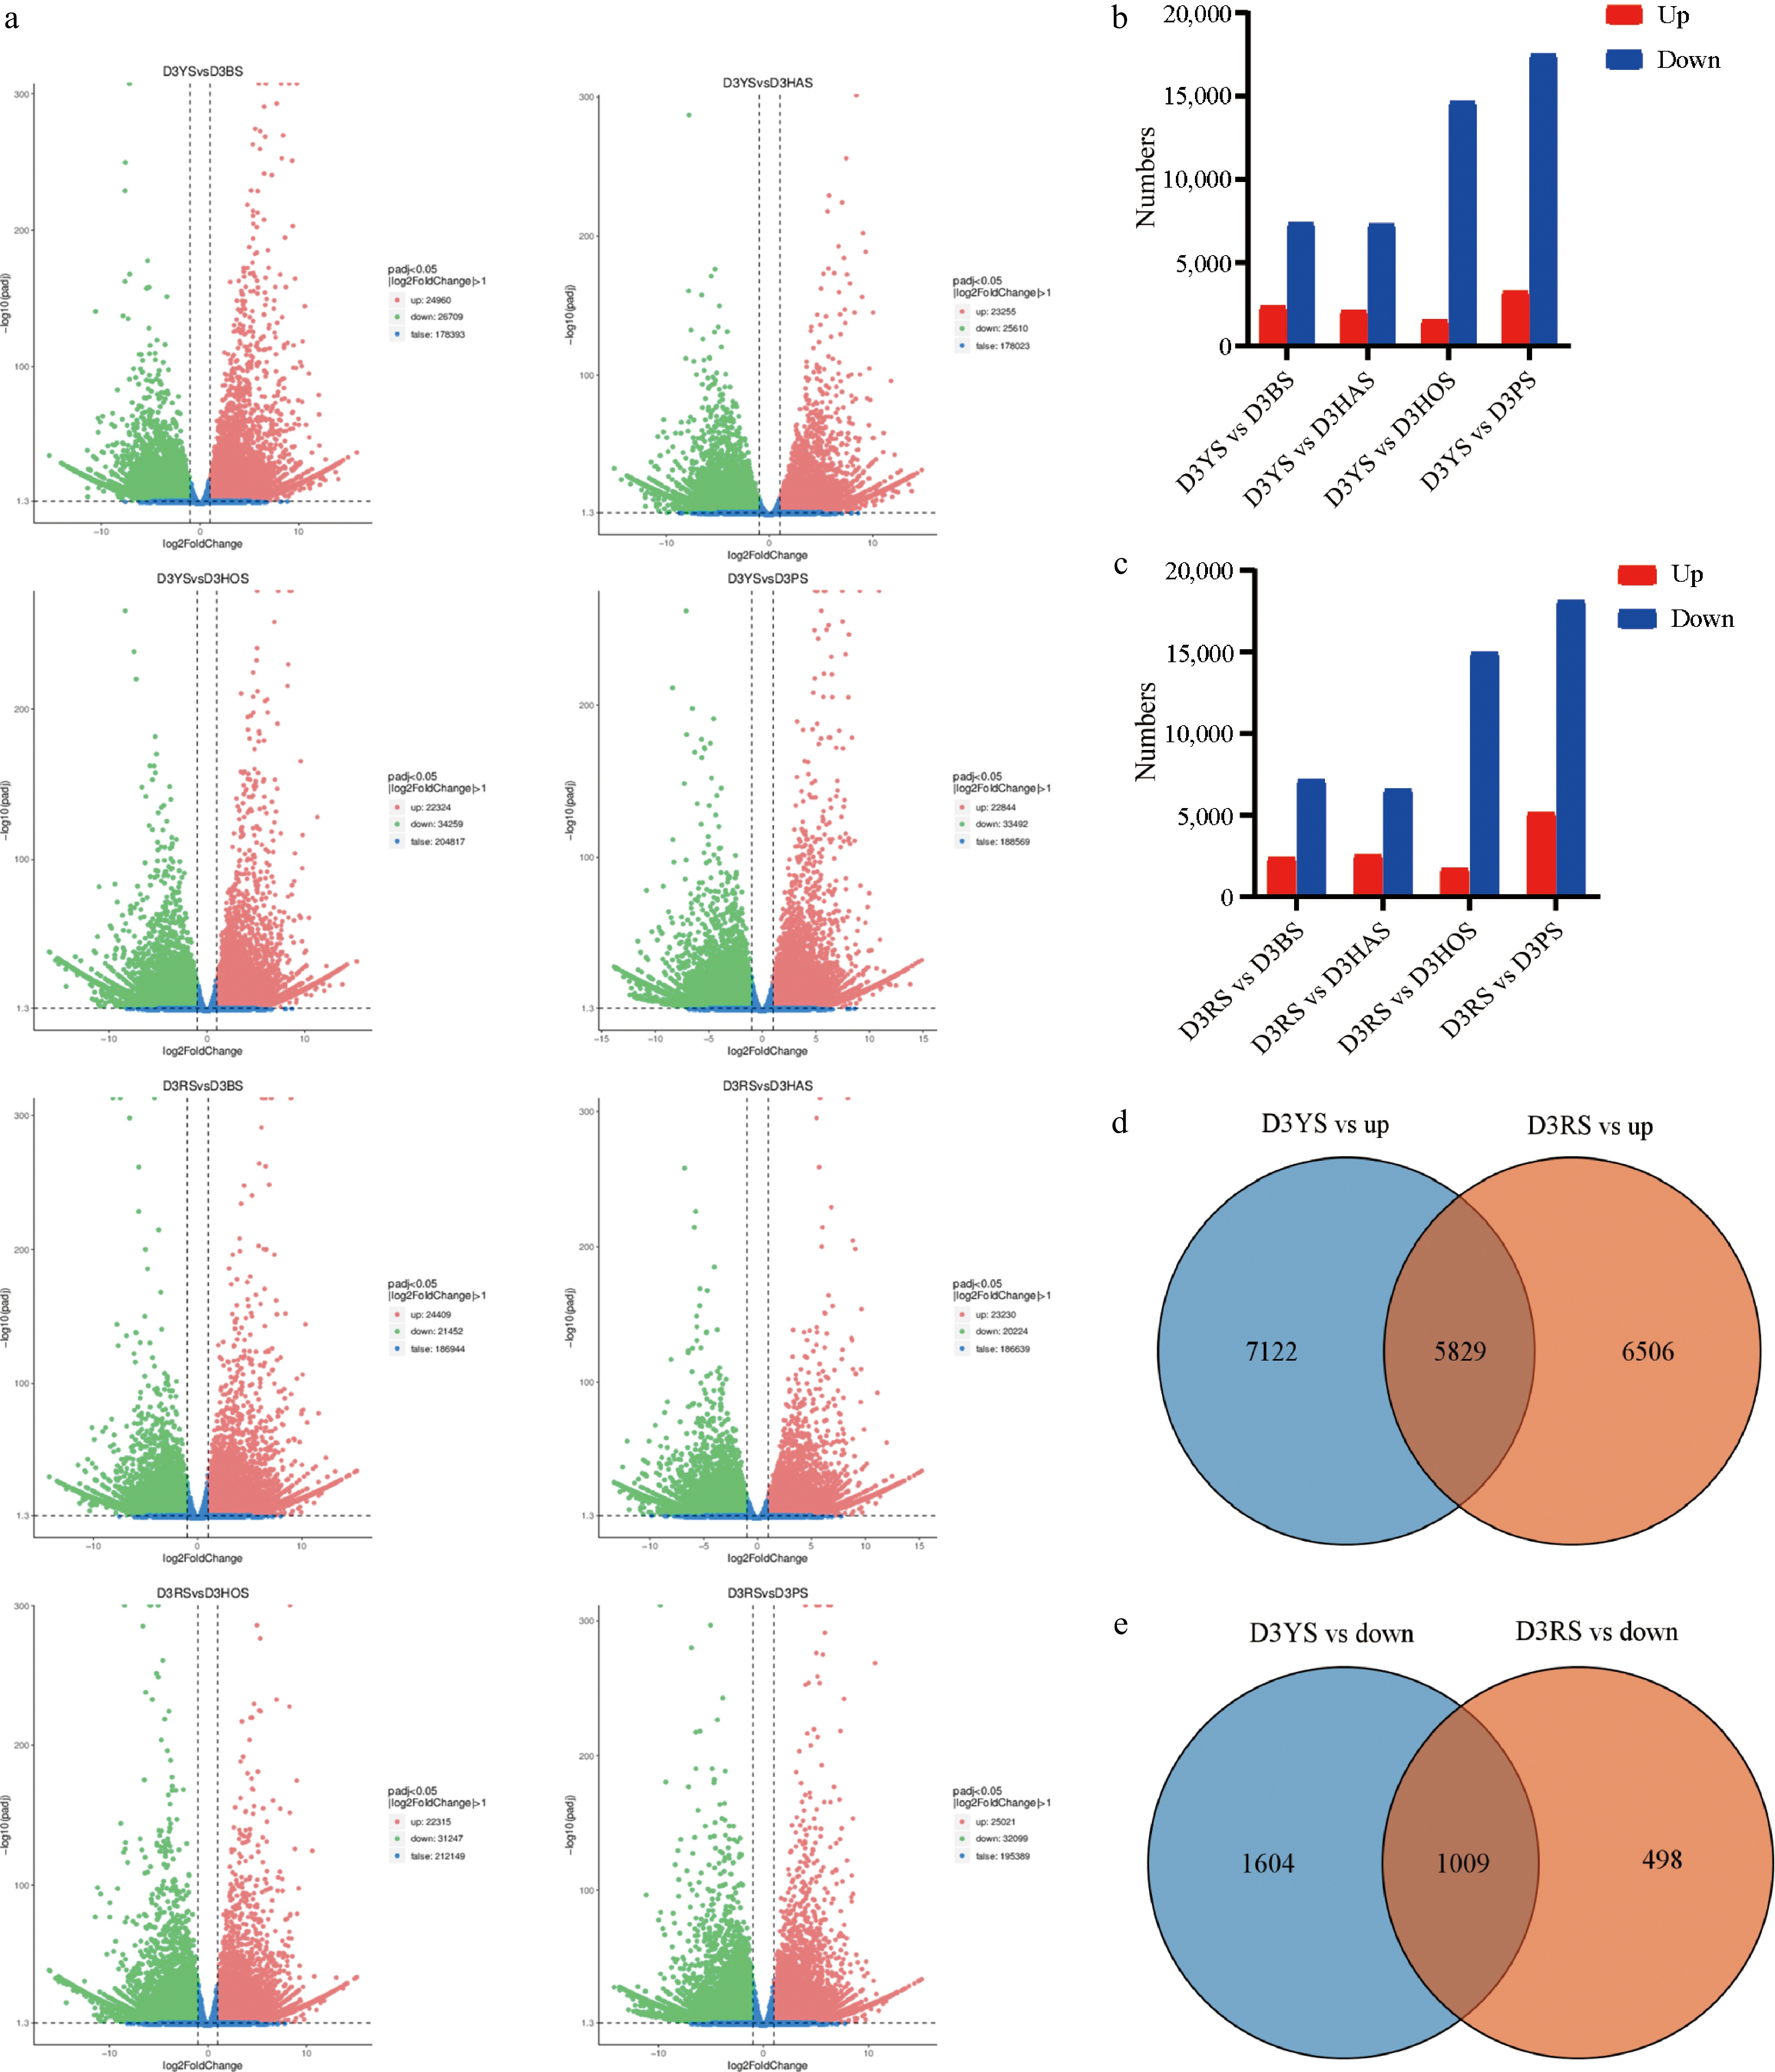
Figure 2.
RNA-seq analyses of the different varieties. (a) Volcano plot of DEGs between pairwise comparisons. The x-axis represents the fold change in gene expression across different samples (log2FoldChange), while the y-axis represents the significance level of differential expression (−log10padj). (b), (c) The number of upregulated and downregulated genes between pairwise comparisons. (d), (e) Venn diagram comparing D3YS and D3RS with other varieties illustrating the overlap and uniquely expressed genes identified in the samples. D3RS: On the fourth day, 'Red Morning' shoots apical meristems.
The GO database was divided into 'biological processes (BP)', 'cell components (CC)', and 'molecular functions (MF)'. The GO enrichment analysis indicated that many genes were primarily enriched in categories such as cellular process, binding, and cell. The GO enrichment analysis revealed the upregulated (Fig. 3a) and downregulated (Fig. 3b) pathways by comparing 'Yellow Planet' and 'Red Morning' with the other four varieties.
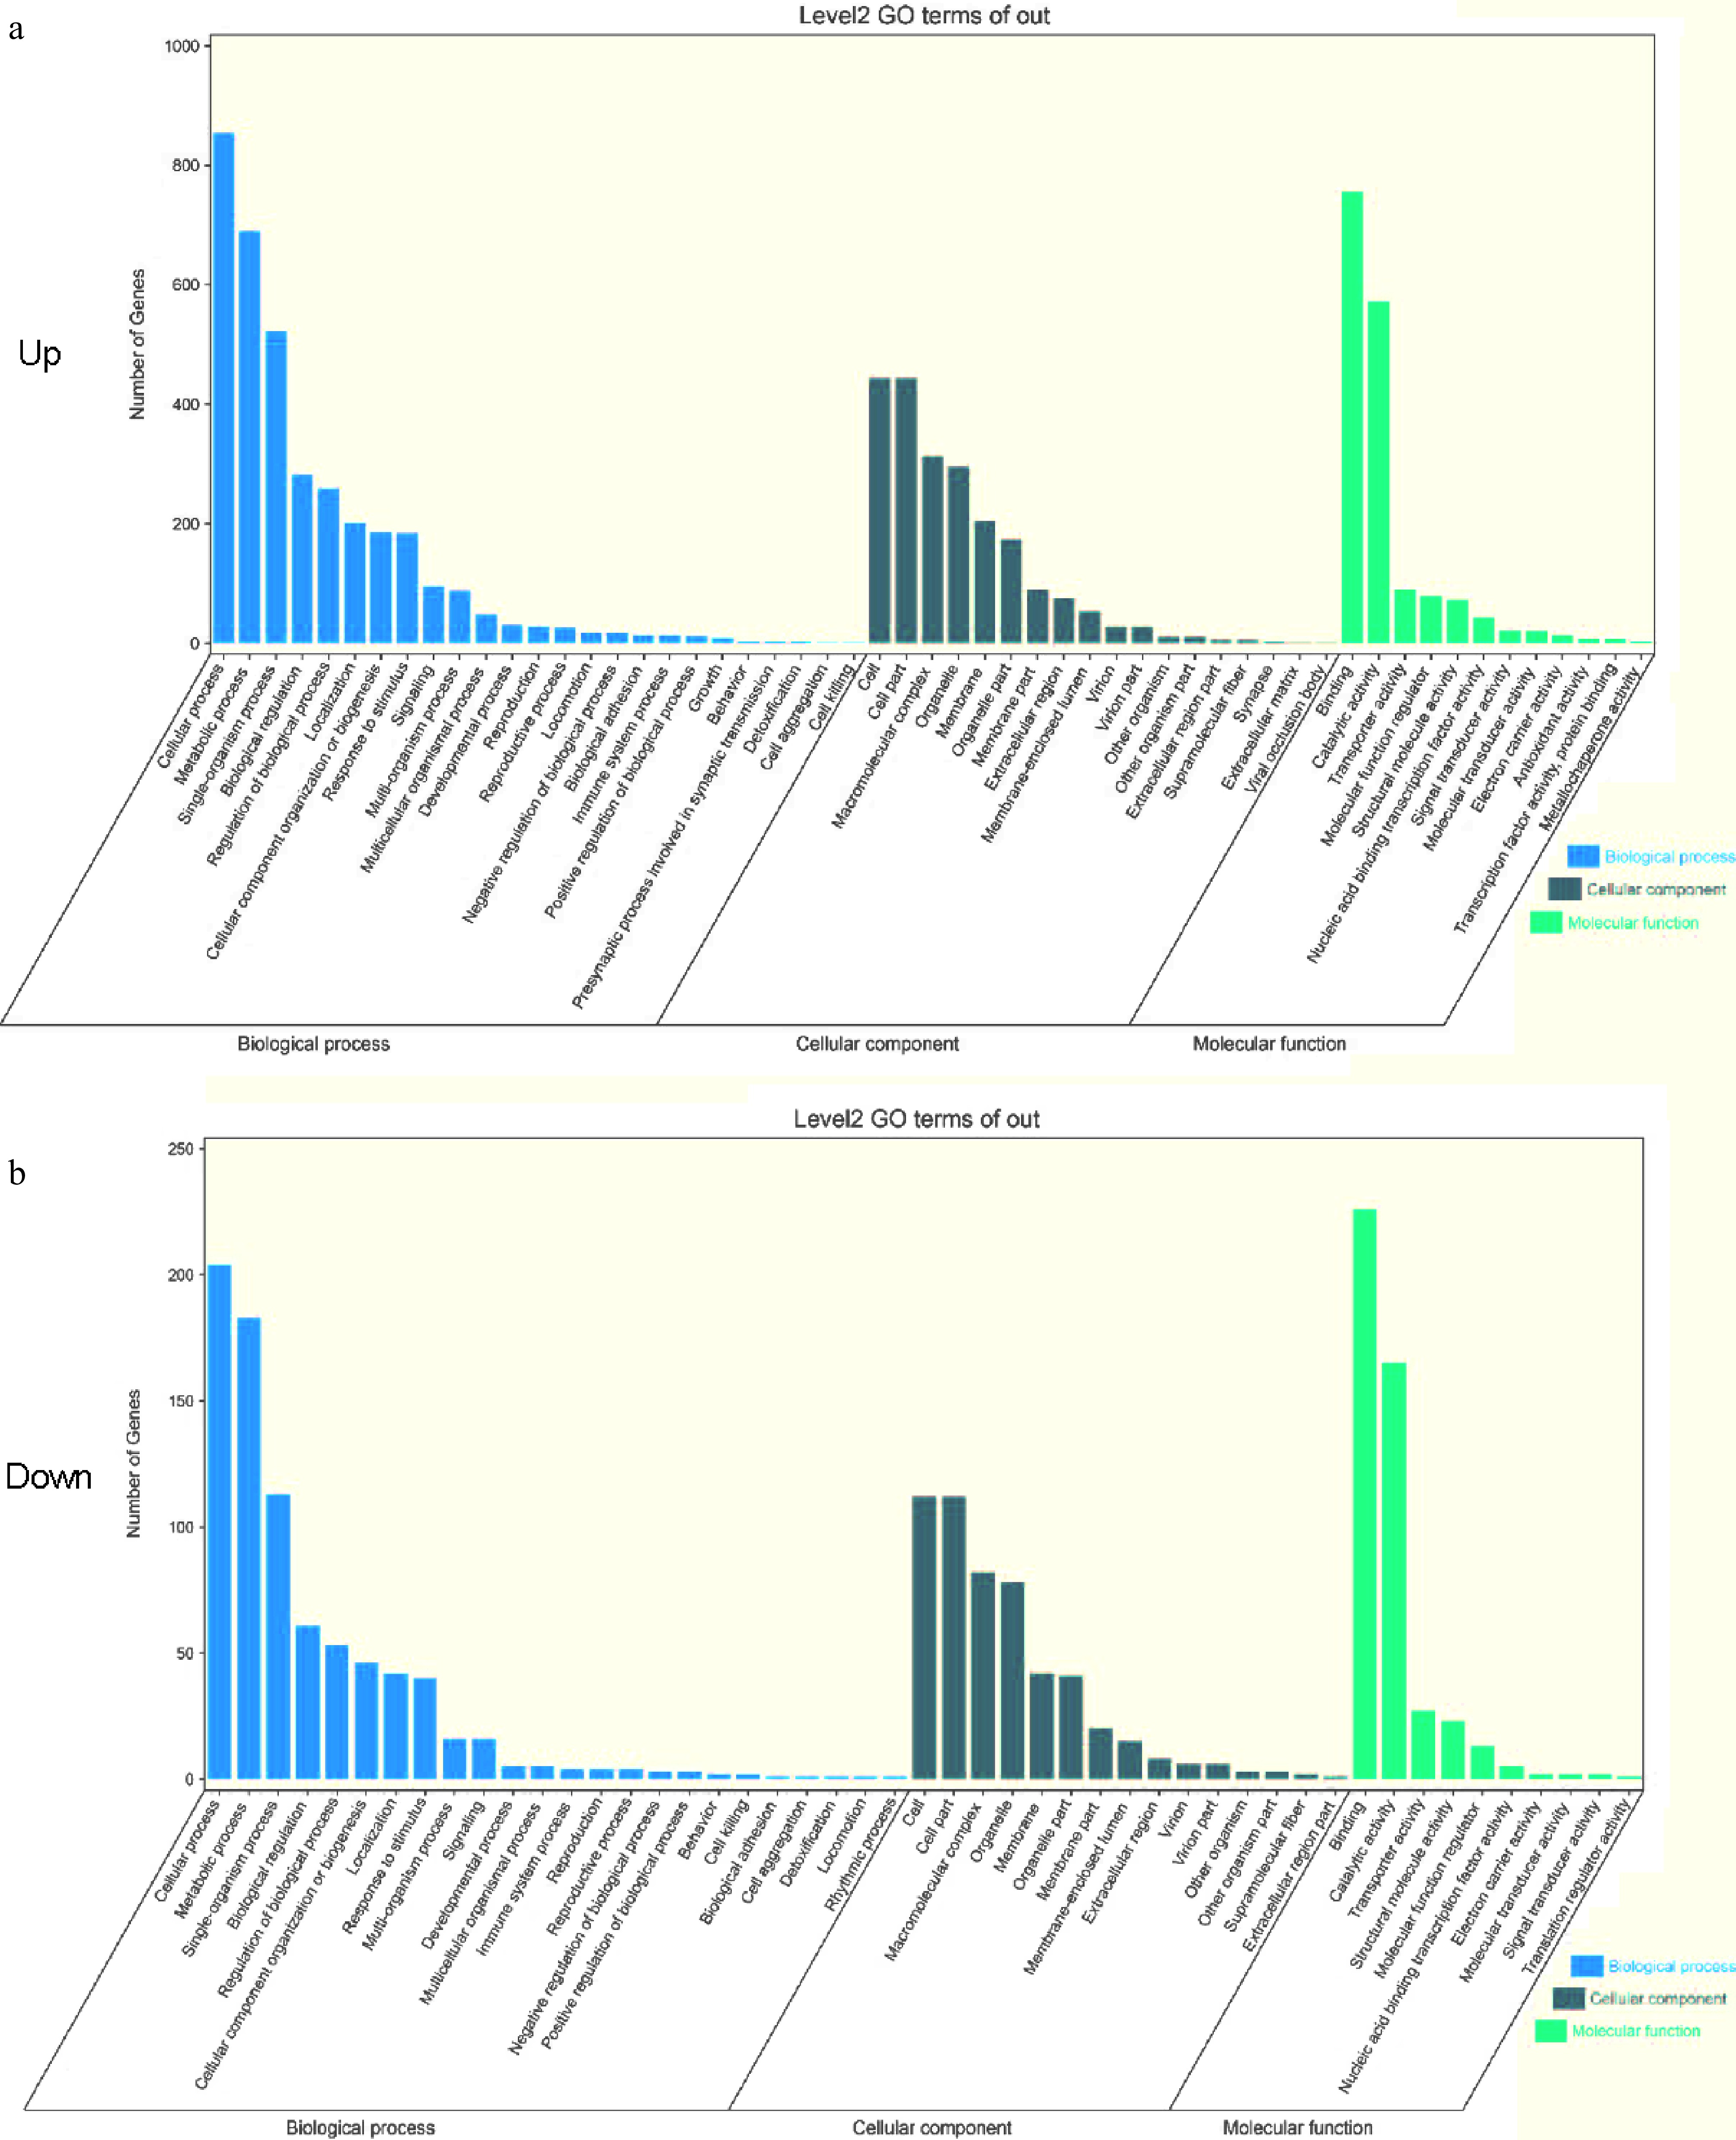
Figure 3.
GO enrichment analysis. (a), (b) GO functional enrichment of DEGs comparing D3YS and D3RS with other varieties in pairwise comparisons. BP biological process; MF, molecular function; CC, cellular components. D3YS: On the fourth day, 'Yellow Planet' shoots apical meristems.
The KEGG pathways were used to describe the metabolic pathways in cells for analyzing DEGs. The network diagram emphasizes the crucial role of the 'ribosome' in the upregulated (Fig. 4a) and downregulated (Fig. 4b) pathways. The top 20 KEGG pathways based on enrichment results were listed. These data showed that the 'ribosome' was most enriched in both comparisons, of which 50 DEGs were in upregulation (Fig. 4c) and 22 DEGs in downregulation (Fig. 4d). The KEGG analysis identified interrelationships among the top 15 pathways, highlighting several pathways that may be involved in the process of flower bud initiation[30,31]. These results indicate that genes associated with ribosome processes show significant differences during the flowering transition in lilies, potentially promoting flower bud initiation.
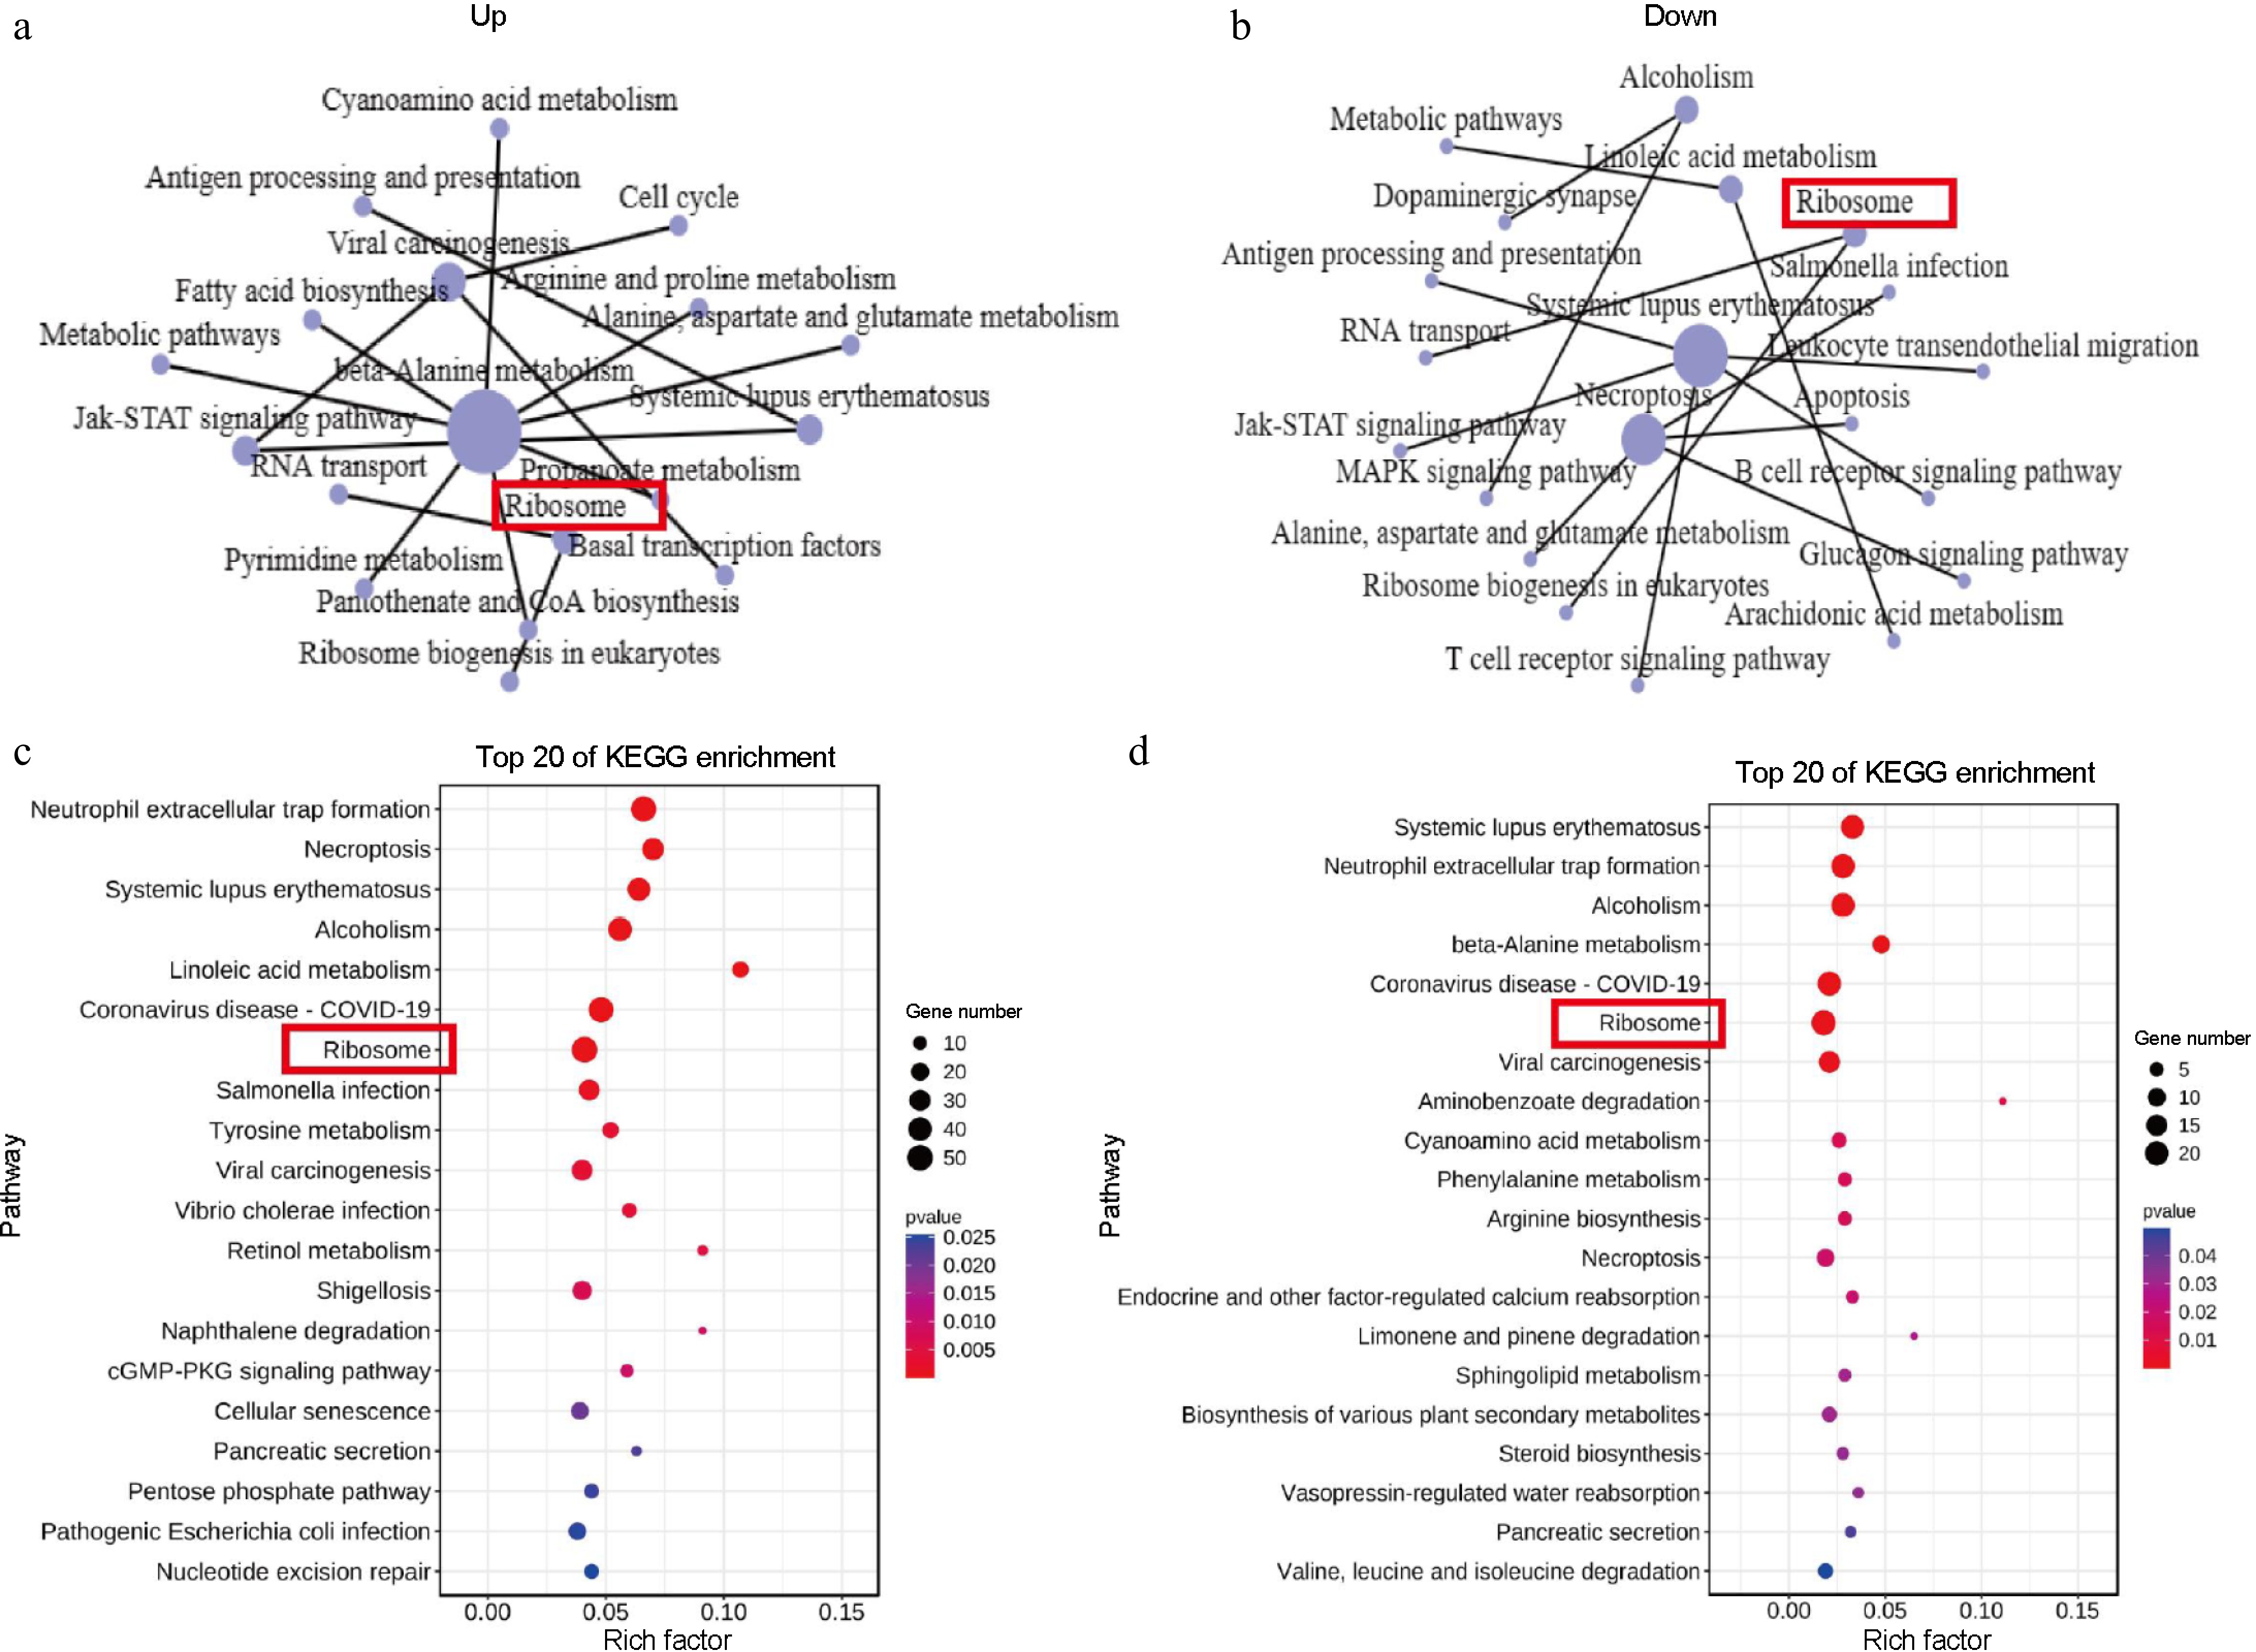
Figure 4.
KEGG enrichment analysis. (a), (b) KEGG network diagram of the 15 core pathway relationships. (c), (d) Top 20 enriched KEGG pathways among the DEGs. The y-axis presents the different KEGG pathways and the x-axis presents the rich factor. A rich factor is the ratio of the number of DEGs annotated with a pathway term relative to the total number of genes annotated with this pathway term. The larger the rich factor, the greater the enrichment of this KEGG pathway; D3YS: On the fourth day 'Yellow Planet' shoots apical meristems; D3RS: On the fourth day 'Red Morning' shoots apical meristems.
Validation of DEGs through qRT-PCR analysis
-
To identify the accuracy of transcriptome data, differences in the expression of lily-related genes were investigated. In the RNA-seq analysis, the FPKM method was used to estimate gene expression levels[32]. To verify the authenticity of the transcriptome data, qRT-PCR was employed to select some transcription factors from the transcriptome database for DEGs. Several genes from the transcriptome that may be involved in regulating the photoperiod pathway (Fig. 5a): FLOWERING LOCUS KH DOMAIN (FLK) (Fig. 5b), SUPPRESSOR OF OVEREXPRESSION OF CO 1 (SOC1) (Fig. 5c), FLOWERING CONTROL LOCUS A (FCA) (Fig. 5d), AUXIN RESPONSE FACTOR 18 (ARF18) (Fig. 5e), PHOTOPERIOD-INDEPENDENT EARLY FLOWERING 1 (PIE1) (Fig. 5f), CIRCADIAN CLOCK ASSOCIATED 1 (CCA1) (Fig. 5g) and temperature pathway (Fig. 6a): VIN3-LIKE 1 (VIL1) (Fig. 6b), vernalization pathway (Fig. 6c): (SHORT VEGETATIVE PHASE) SVP (Fig. 6d) and aging pathways (Supplementary Fig. S1), autonomic pathway (Supplementary Fig. S2), gibberellin pathway (Supplementary Fig. S3) for the flowering transition in plants were identified. Based on the heat map analysis, several of these genes were selected for validation. The results showed that FLK, SOC1, FCA, ARF18, SVP, and VIL1 were upregulated, while CCA1 and PIE1 were downregulated. These results are consistent with transcriptome data.
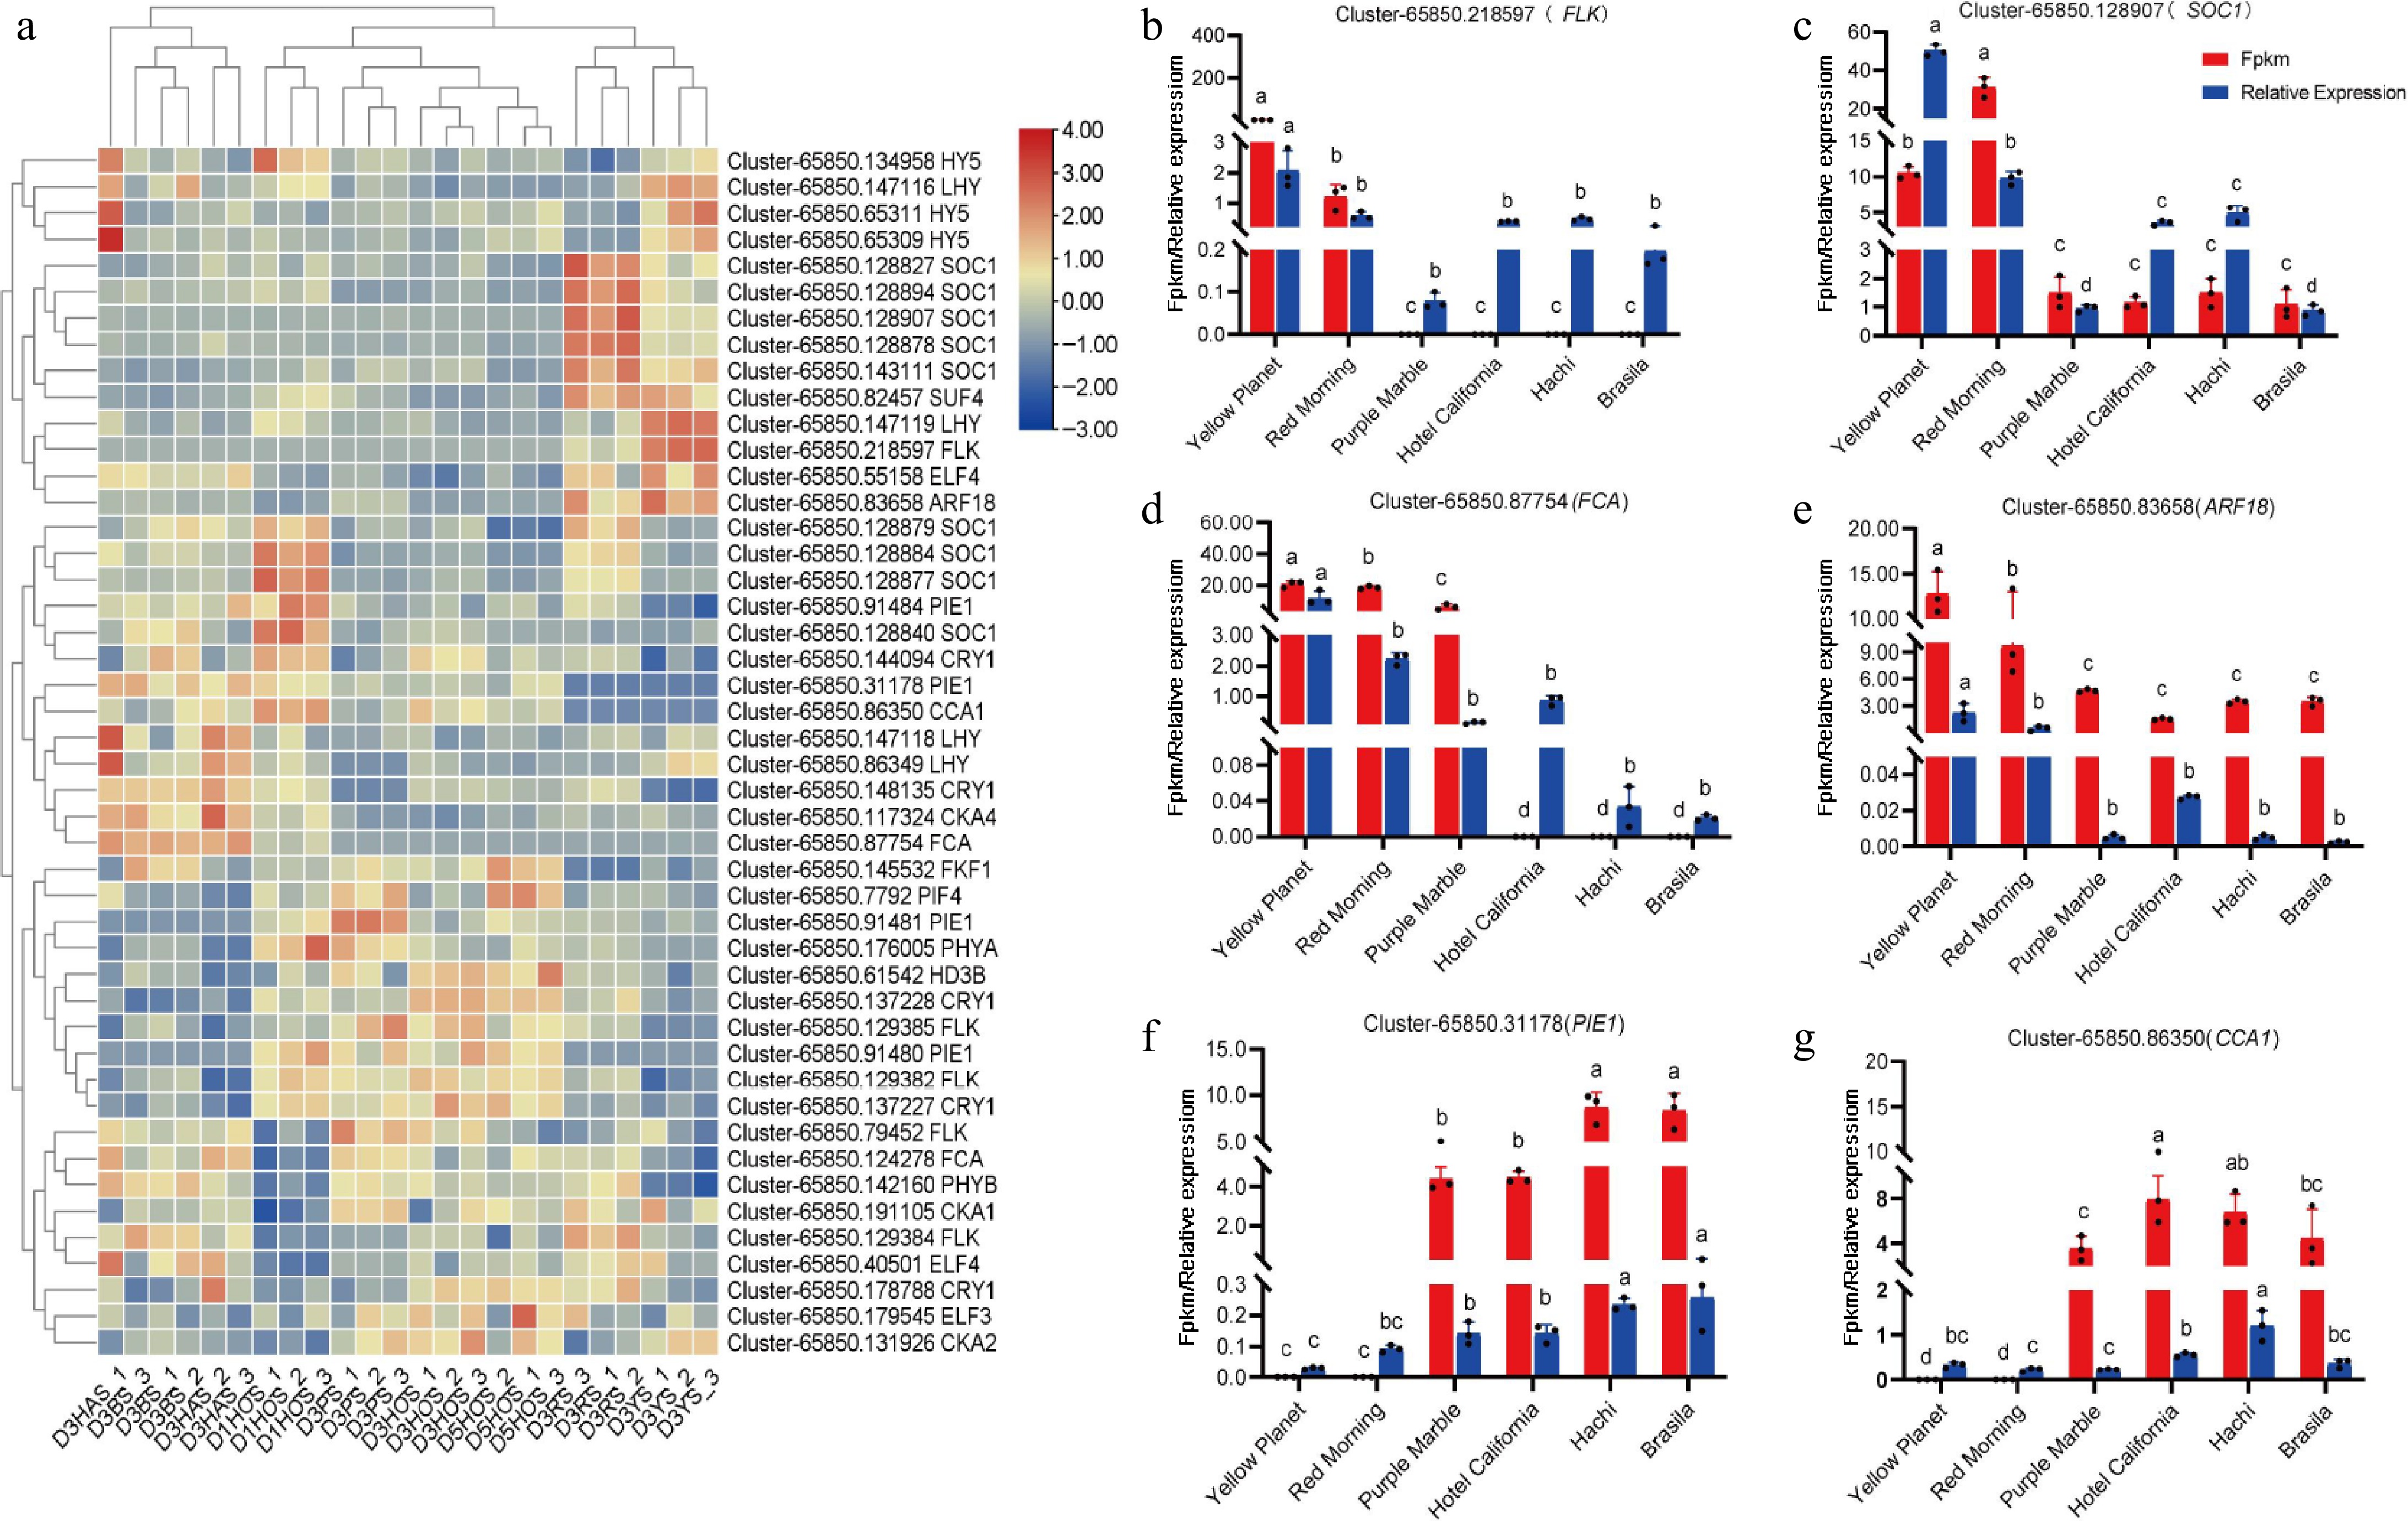
Figure 5.
Expression of key genes involved in photoperiodic pathways during flower bud initiation. (a) DEGS associated with lily bud initiation in the photoperiodic pathway, where red and blue indicate up-regulated and down-regulated DEGs. (b) Cluster-65850.218597(FLK). (c) Cluster-65850.128970 (SOC1). (d) Cluster-65850.87754 (FCA). (e) Cluster-65850.83658 (ARF18). (f) Cluster-65850.31178 (PIE1). (g) Cluster-65850.86350 (CCA1). Red represents the results from transcriptome data, while blue indicates the results from the qRT-PCR analysis. The same letter means the difference is not significant (p > 0.05), and different letters indicate the difference is significant (p < 0.05).
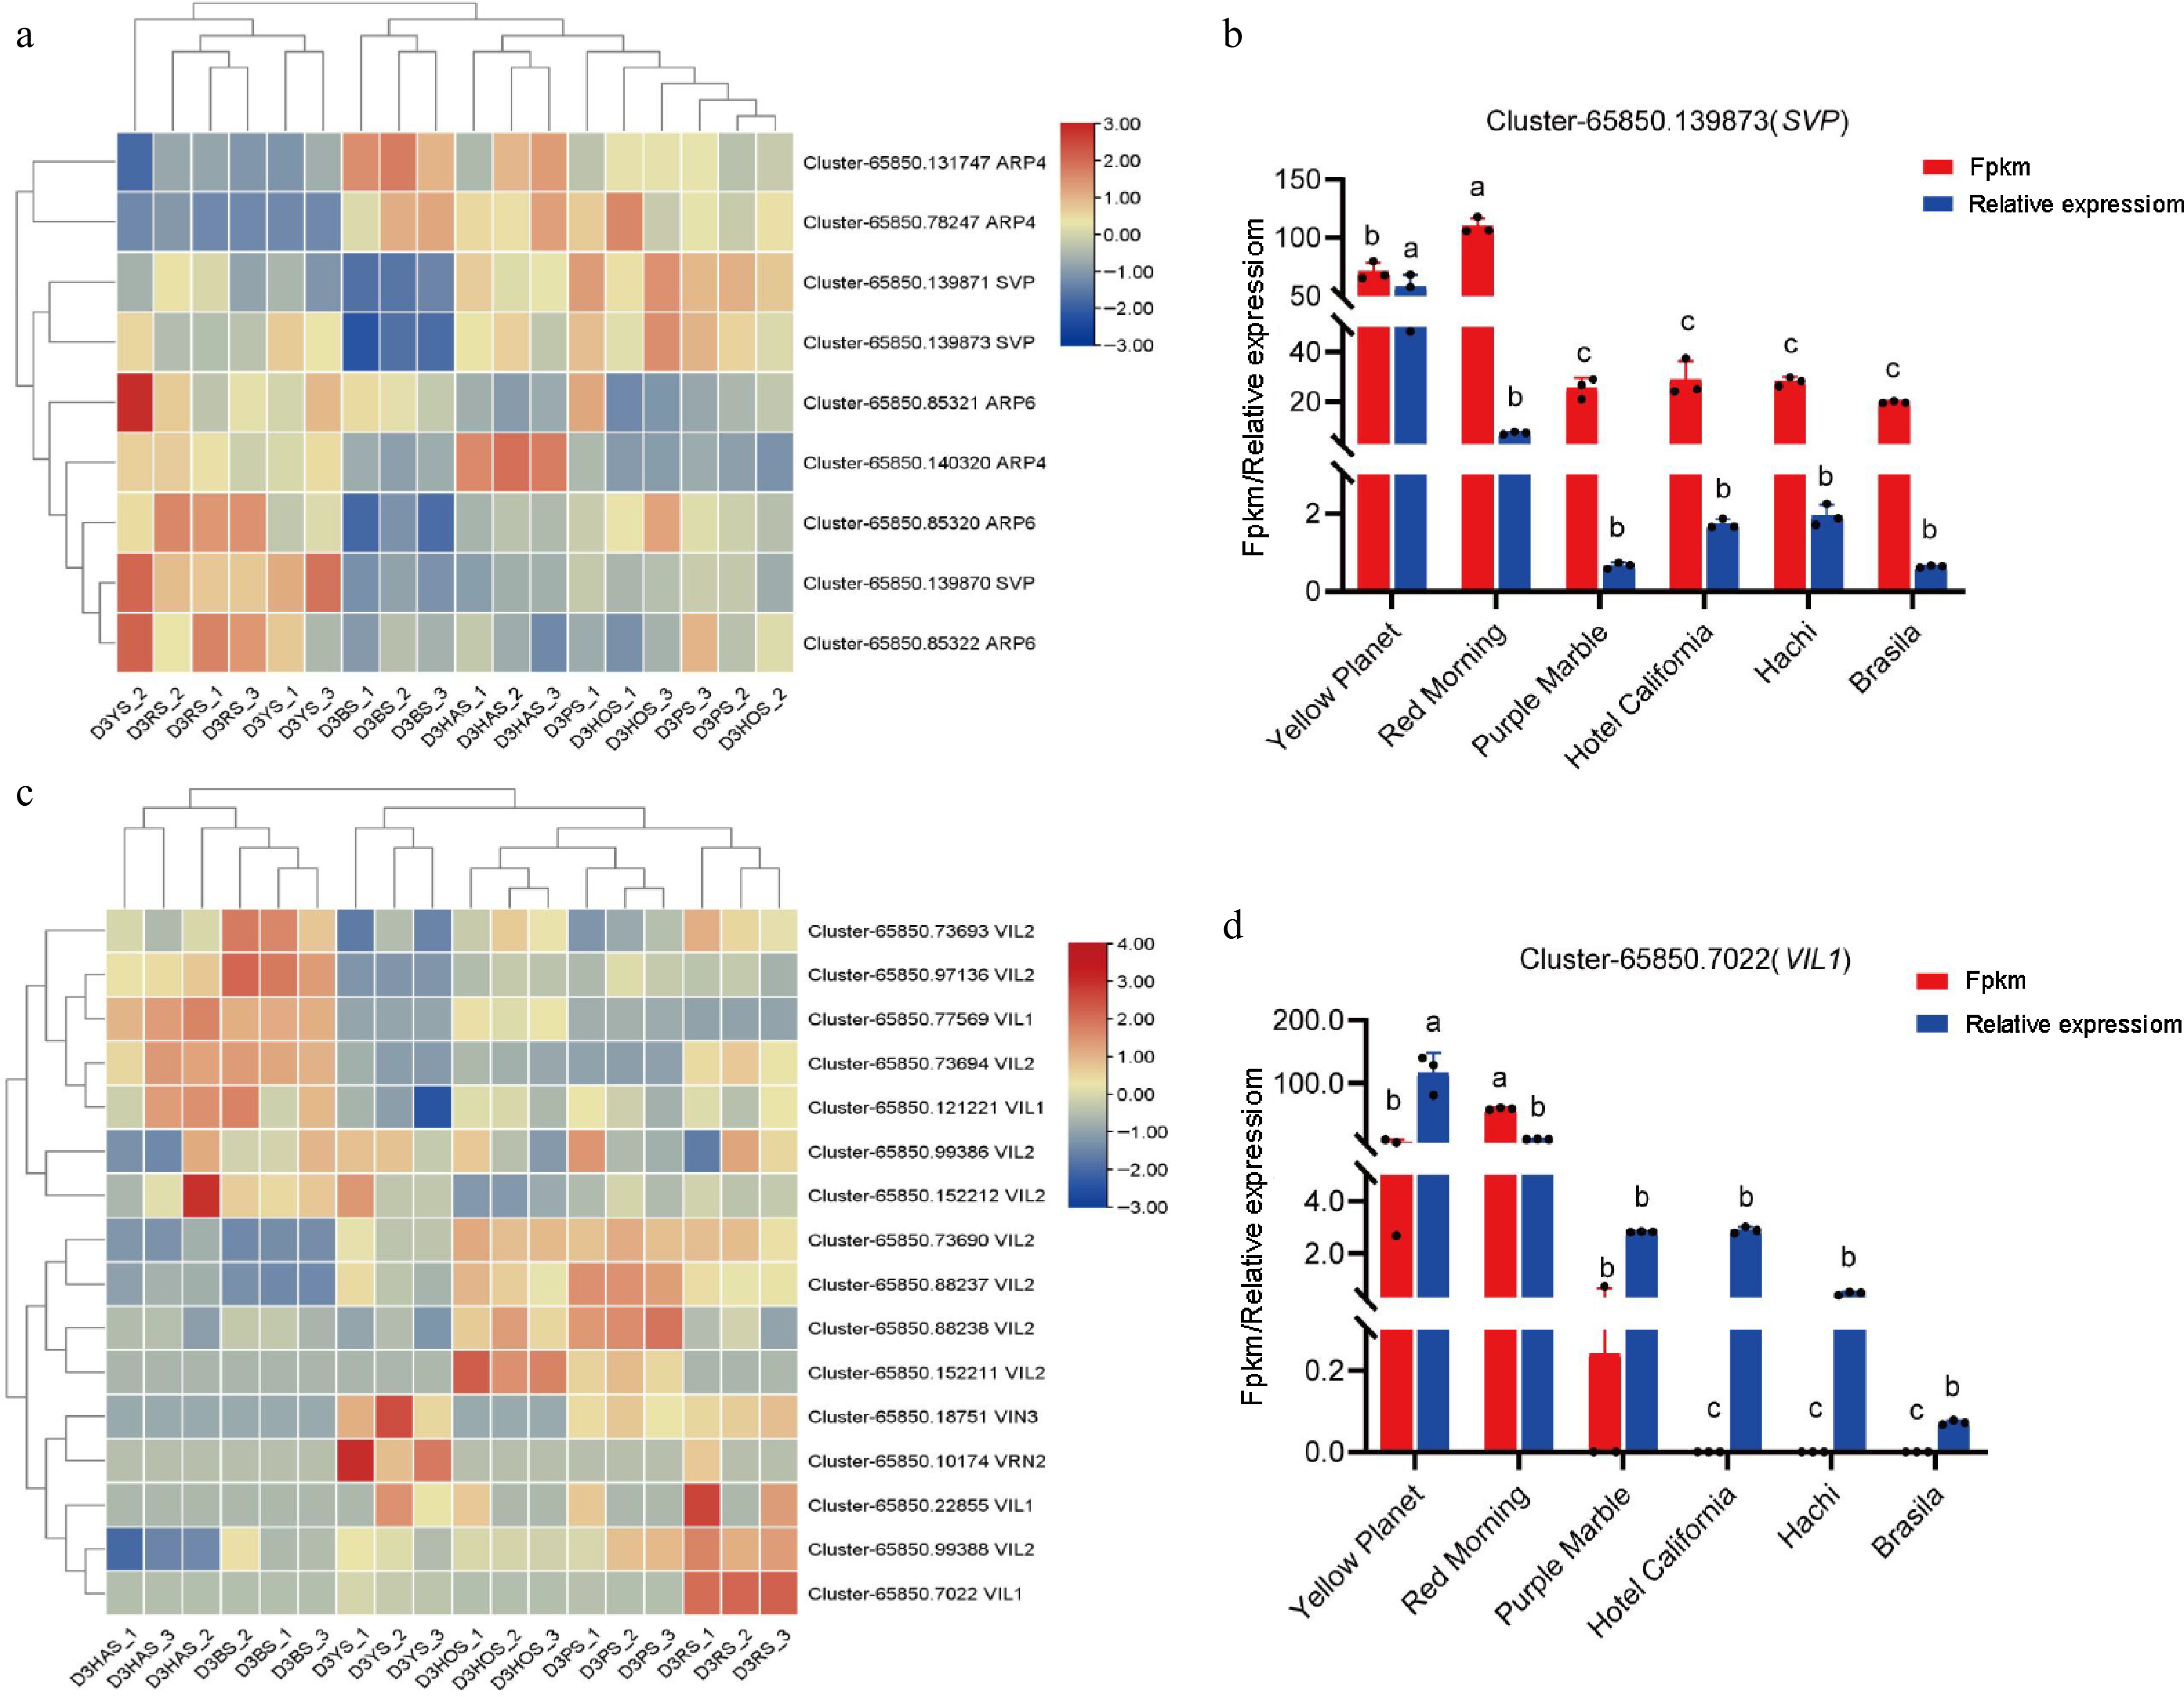
Figure 6.
Expression of key genes during flower bud initiation. (a) DEGs associated with lily bud initiation under the temperature pathway, where red and blue indicate up-regulated and down-regulated DEG. (b) 'Yellow Planet' and 'Red Morning' serve as controls (CK), showing up-regulation compared with the other four series. (c) DEGs associated with lily bud initiation under the vernalization pathway. Red and blue indicate up-regulated and down-regulated DEGs. (d) 'Yellow Planet' and 'Red Morning' serve as controls (CK) and show up-regulation compared with the other four series. Red indicates results from transcriptome data, while blue indicates results from qRT-PCR. The relative expression levels were measured using qRT-PCR (y-axis), with data representing the average of three biological replicates and three technical replicates. The same letter indicates no significant difference (p > 0.05), whereas different letters indicate a significant difference (p < 0.05).
Silencing LtFCA inhibits flower bud initiation in lilies
-
In addition to the candidate genes associated with lily flower bud initiation, we identified a gene that may play a role in lily floral buds, namely Cluster-65850,87754 (FCA) (Fig. 7).
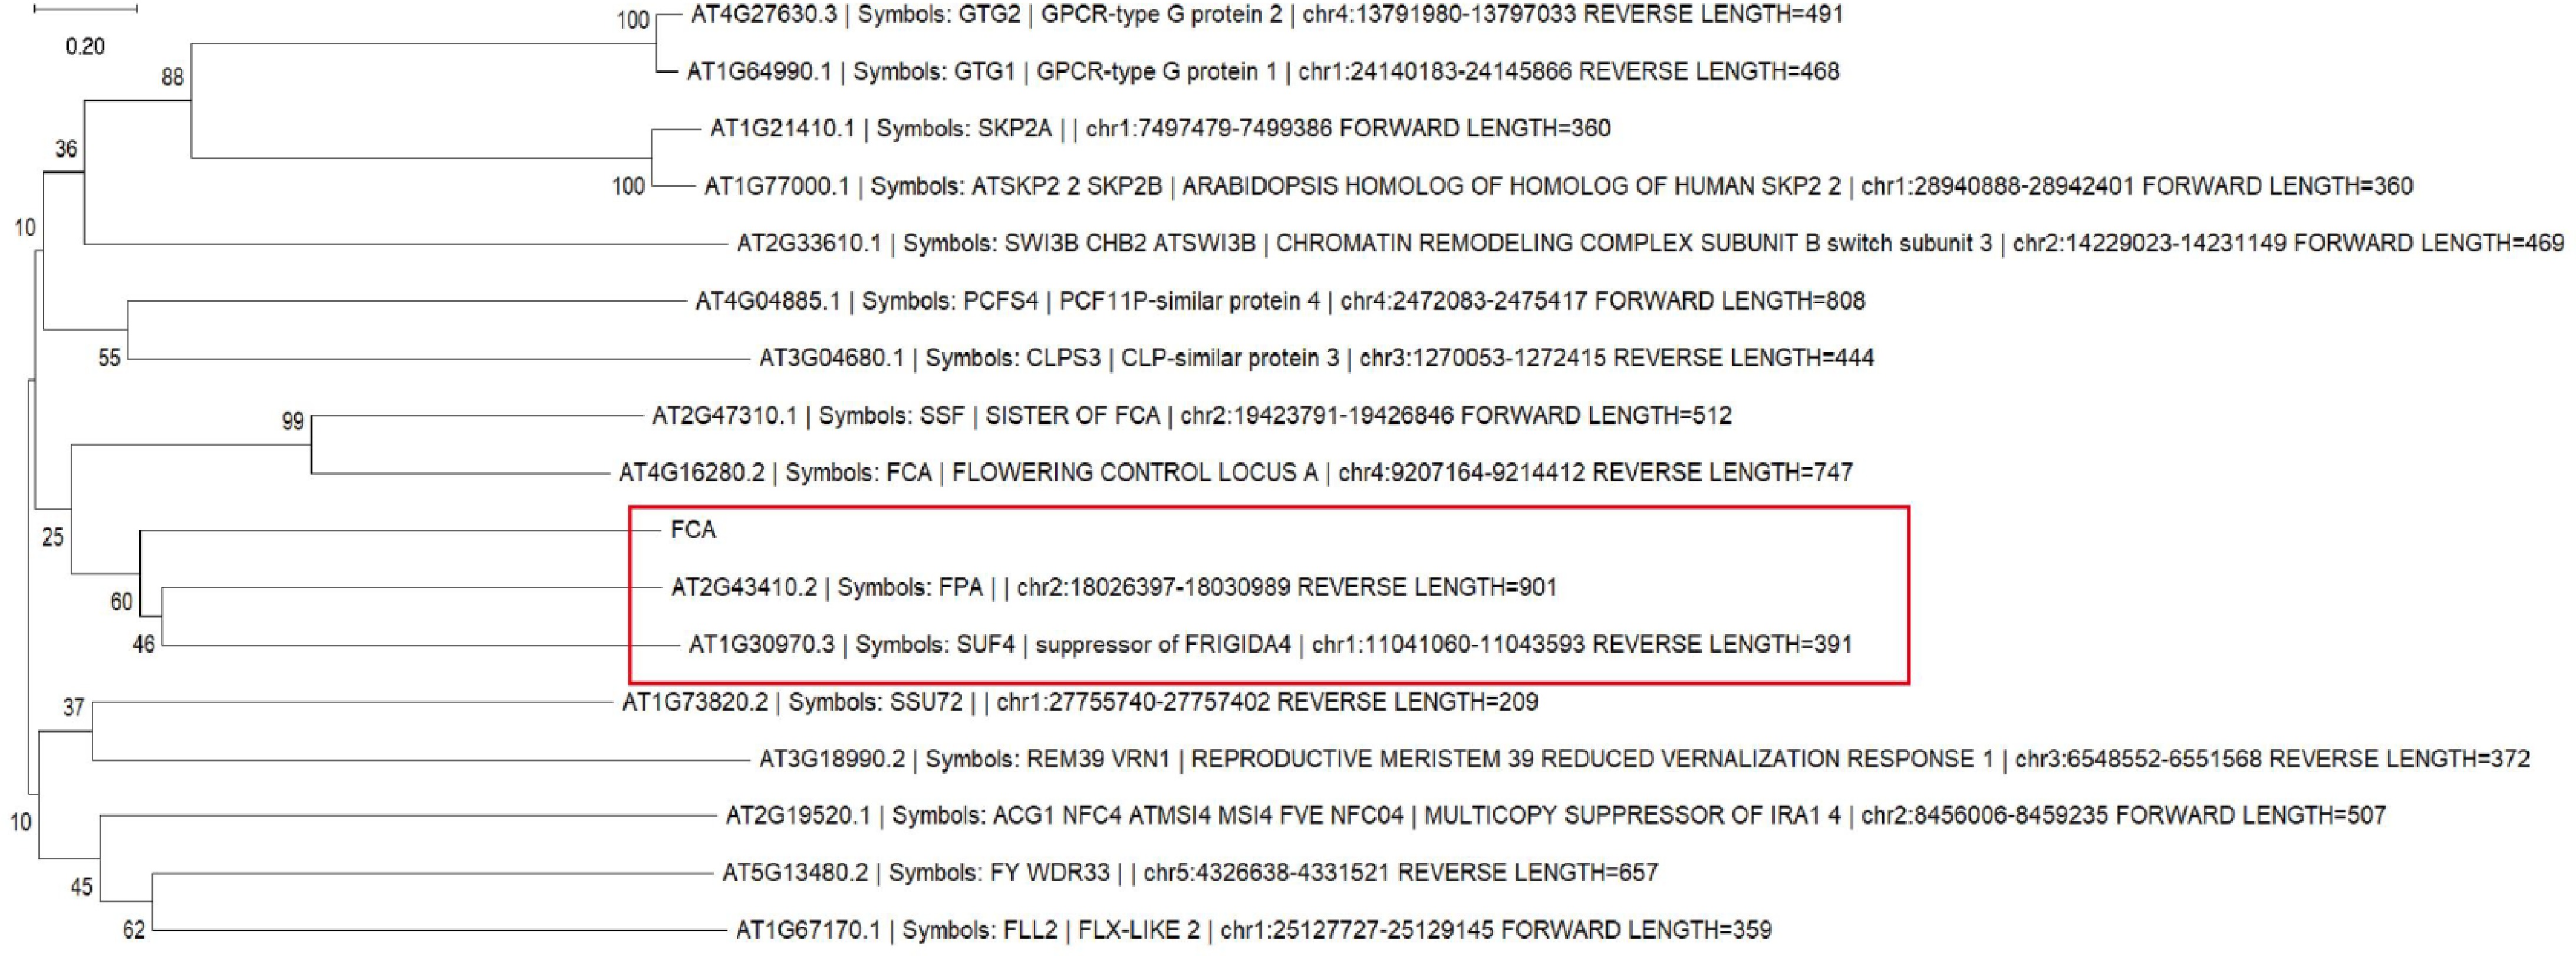
Figure 7.
Phylogenetic tree of homologous genes in FCA of Arabidopsis and Cluster-65850, 87754 (FCA).
To determine the function of LtFCA in the process of lily flower bud initiation, we established a VIGS system using the TRV2-LtFCA recombinant vector. The lily bulbs used for VIGS infection were uniform in size and remained in a dormant state. The qRT-PCR analysis revealed a substantial decrease in the expression level of LtFCA compared with the TRV2 control (Fig. 8a). Flower bud initiation in the TRV2-LtFCA group was significantly slower compared to the TRV2 control group (Fig. 8b). The CP protein detection results indicate successful introduction of the TRV vector (Fig. 8c). The phenotypic analysis revealed no significant changes in the first 4 d. The phenotypic analysis results show that in the flowering process of lilies infected with TRV2, flower buds began to change at 6 d, while TRV2-LtFCA showed changes starting at 10 d. This indicates that silencing LtFCA suppresses the flowering transition in lilies (Fig. 8d).
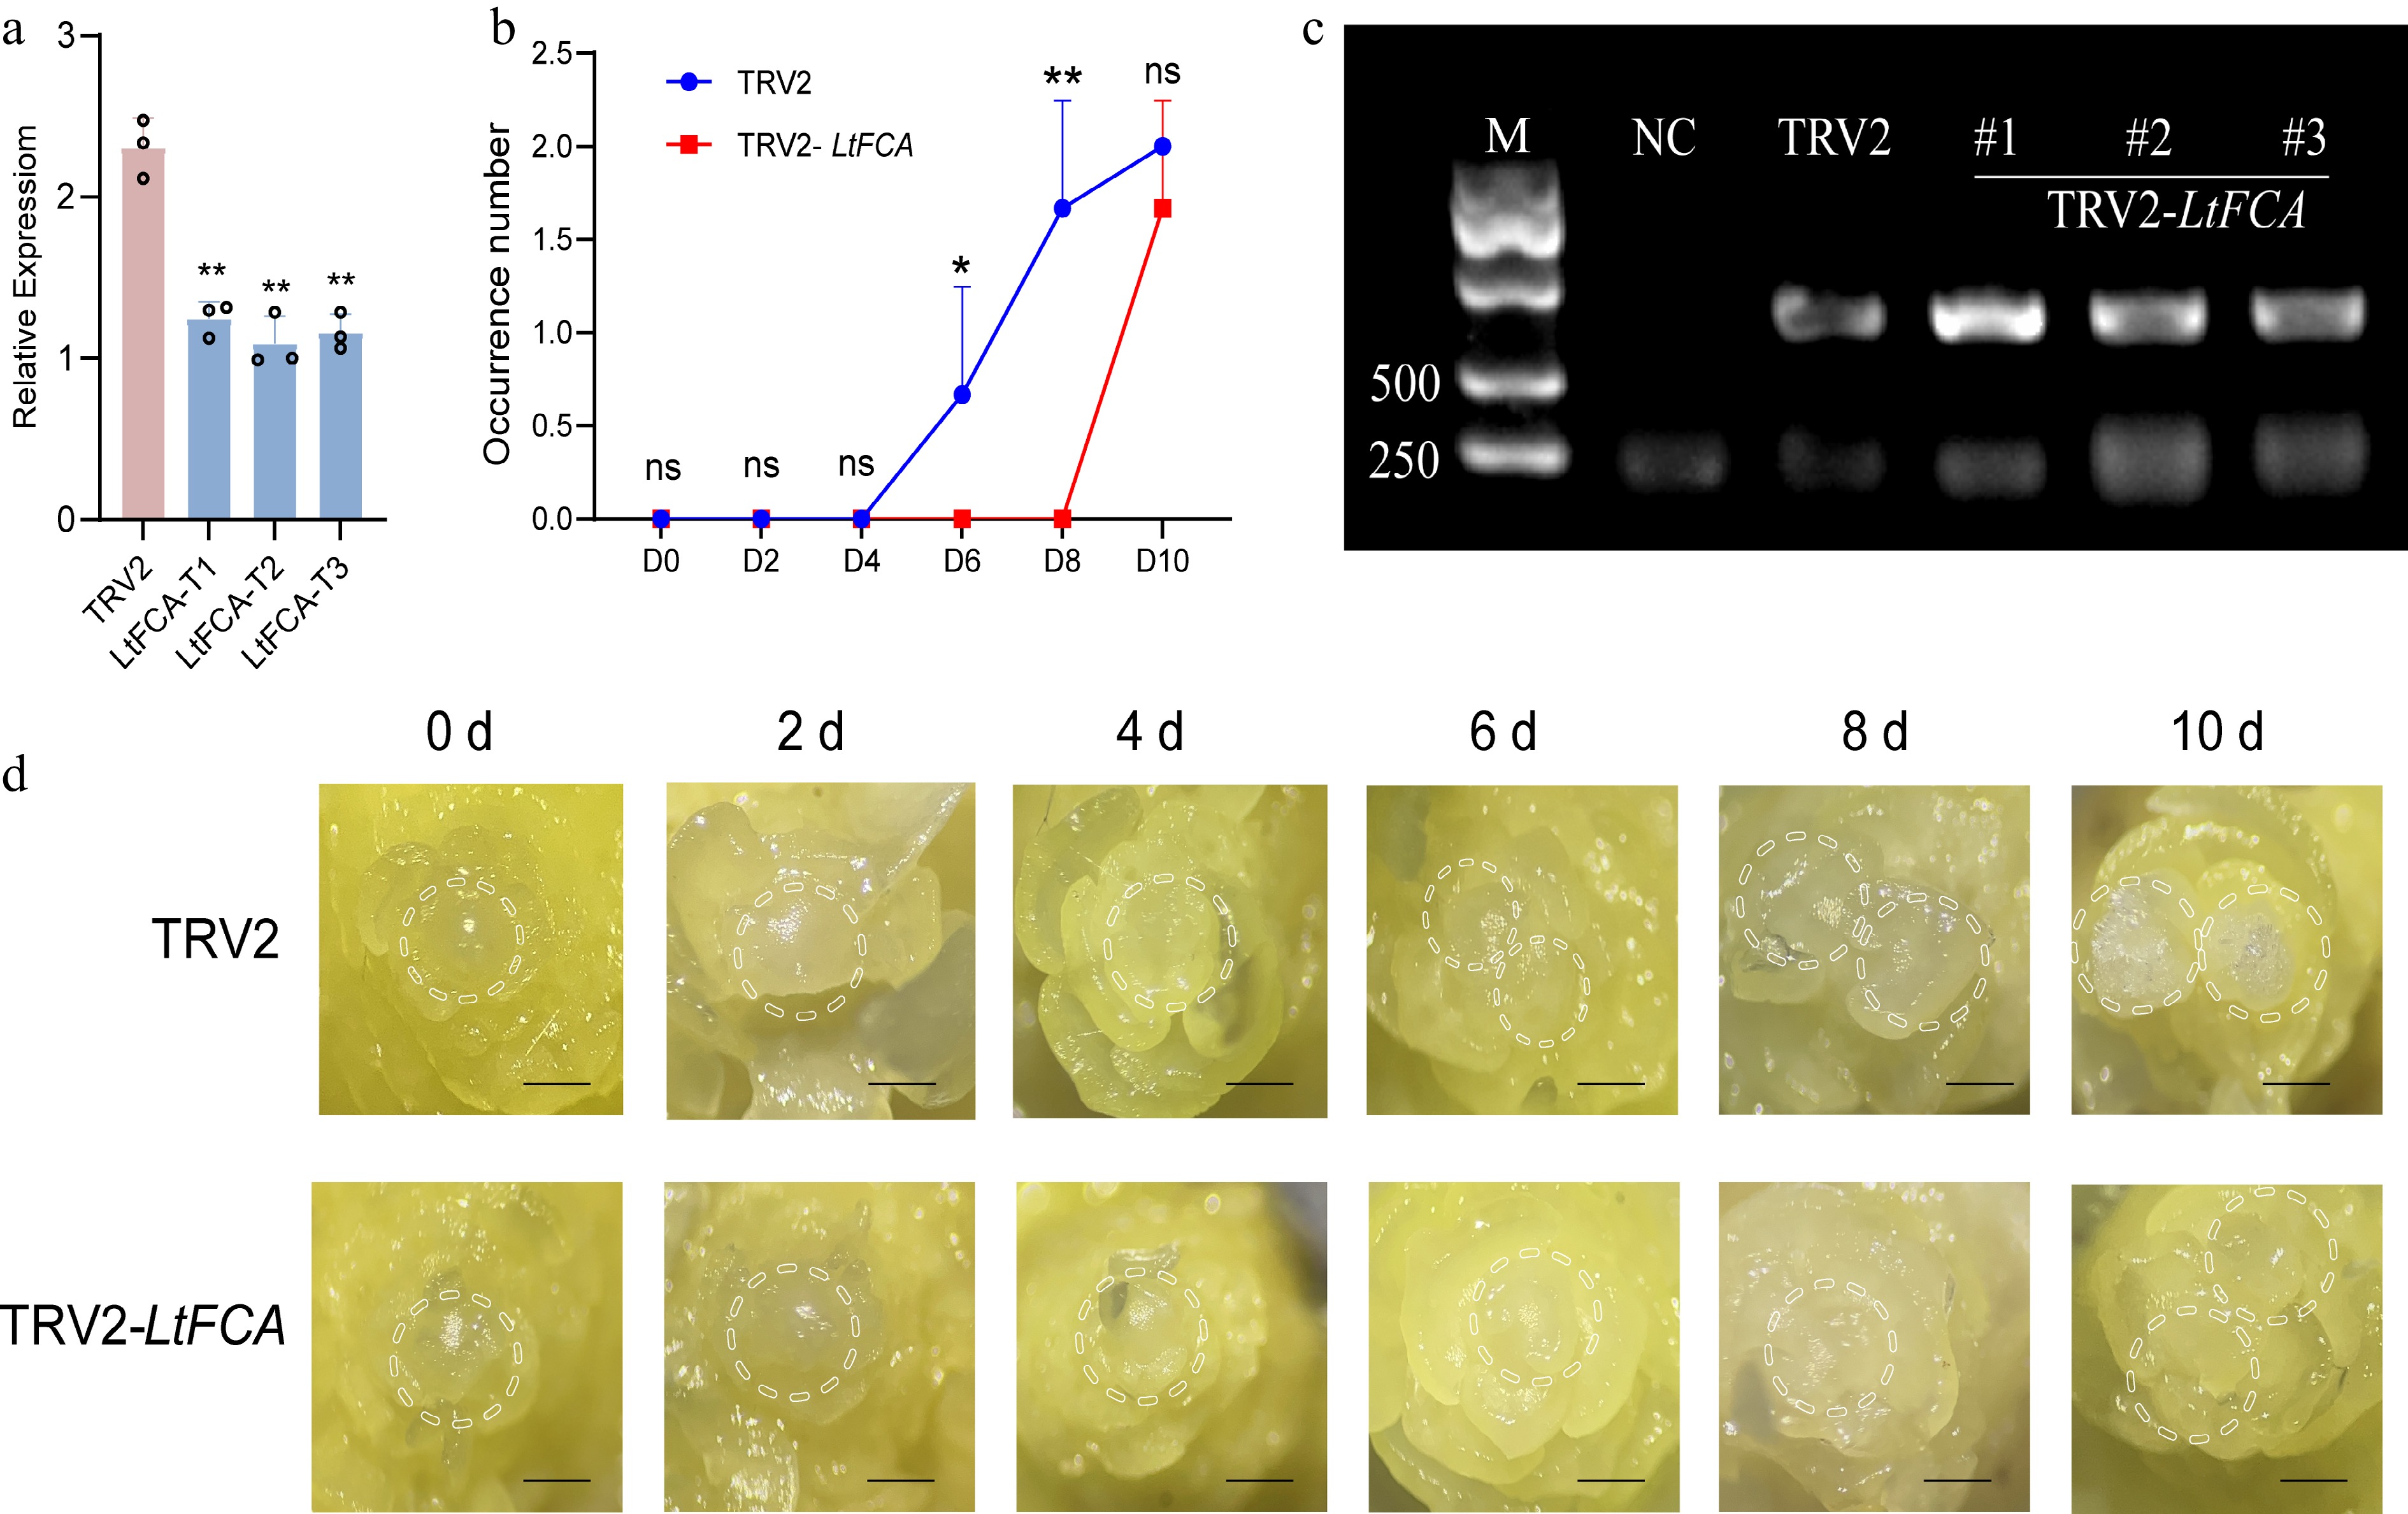
Figure 8.
Gene expression levels and phenotypic changes in lily flowering transition following LtFCA silencing. (a) After gene silencing, LtFCA expression was significantly decreased compared with TRV2, with triplicate samples (T1, T2, and T3) analyzed. qRT-PCR values were calculated using the 2−ΔΔCᴛ method (* p < 0.05; ** p < 0.01). (b) The flower bud occurrence number of TRV2 and TRV2-LtFCA after gene silencing, with three flower buds taken from each time point and repeated in triplicate. (c) CP protein virus detection; M: marker; NC: water. (d) After VIGS, phenotypic changes in the flowering transition process of lilies were observed in TRV2 and TRV2-LtFCA silenced plants. The scale bars represent 100 μm. (*p < 0.05; **p < 0.01).
Through the VIGS technology on the function of key gene LtFCA, further confirmed the transcriptome data in the gene expression changes and the correlation of flower bud initiation, thus combining morphology, transcriptomics, and gene function research results, common interpretation of lily bud transformation regulation network (Fig. 9).
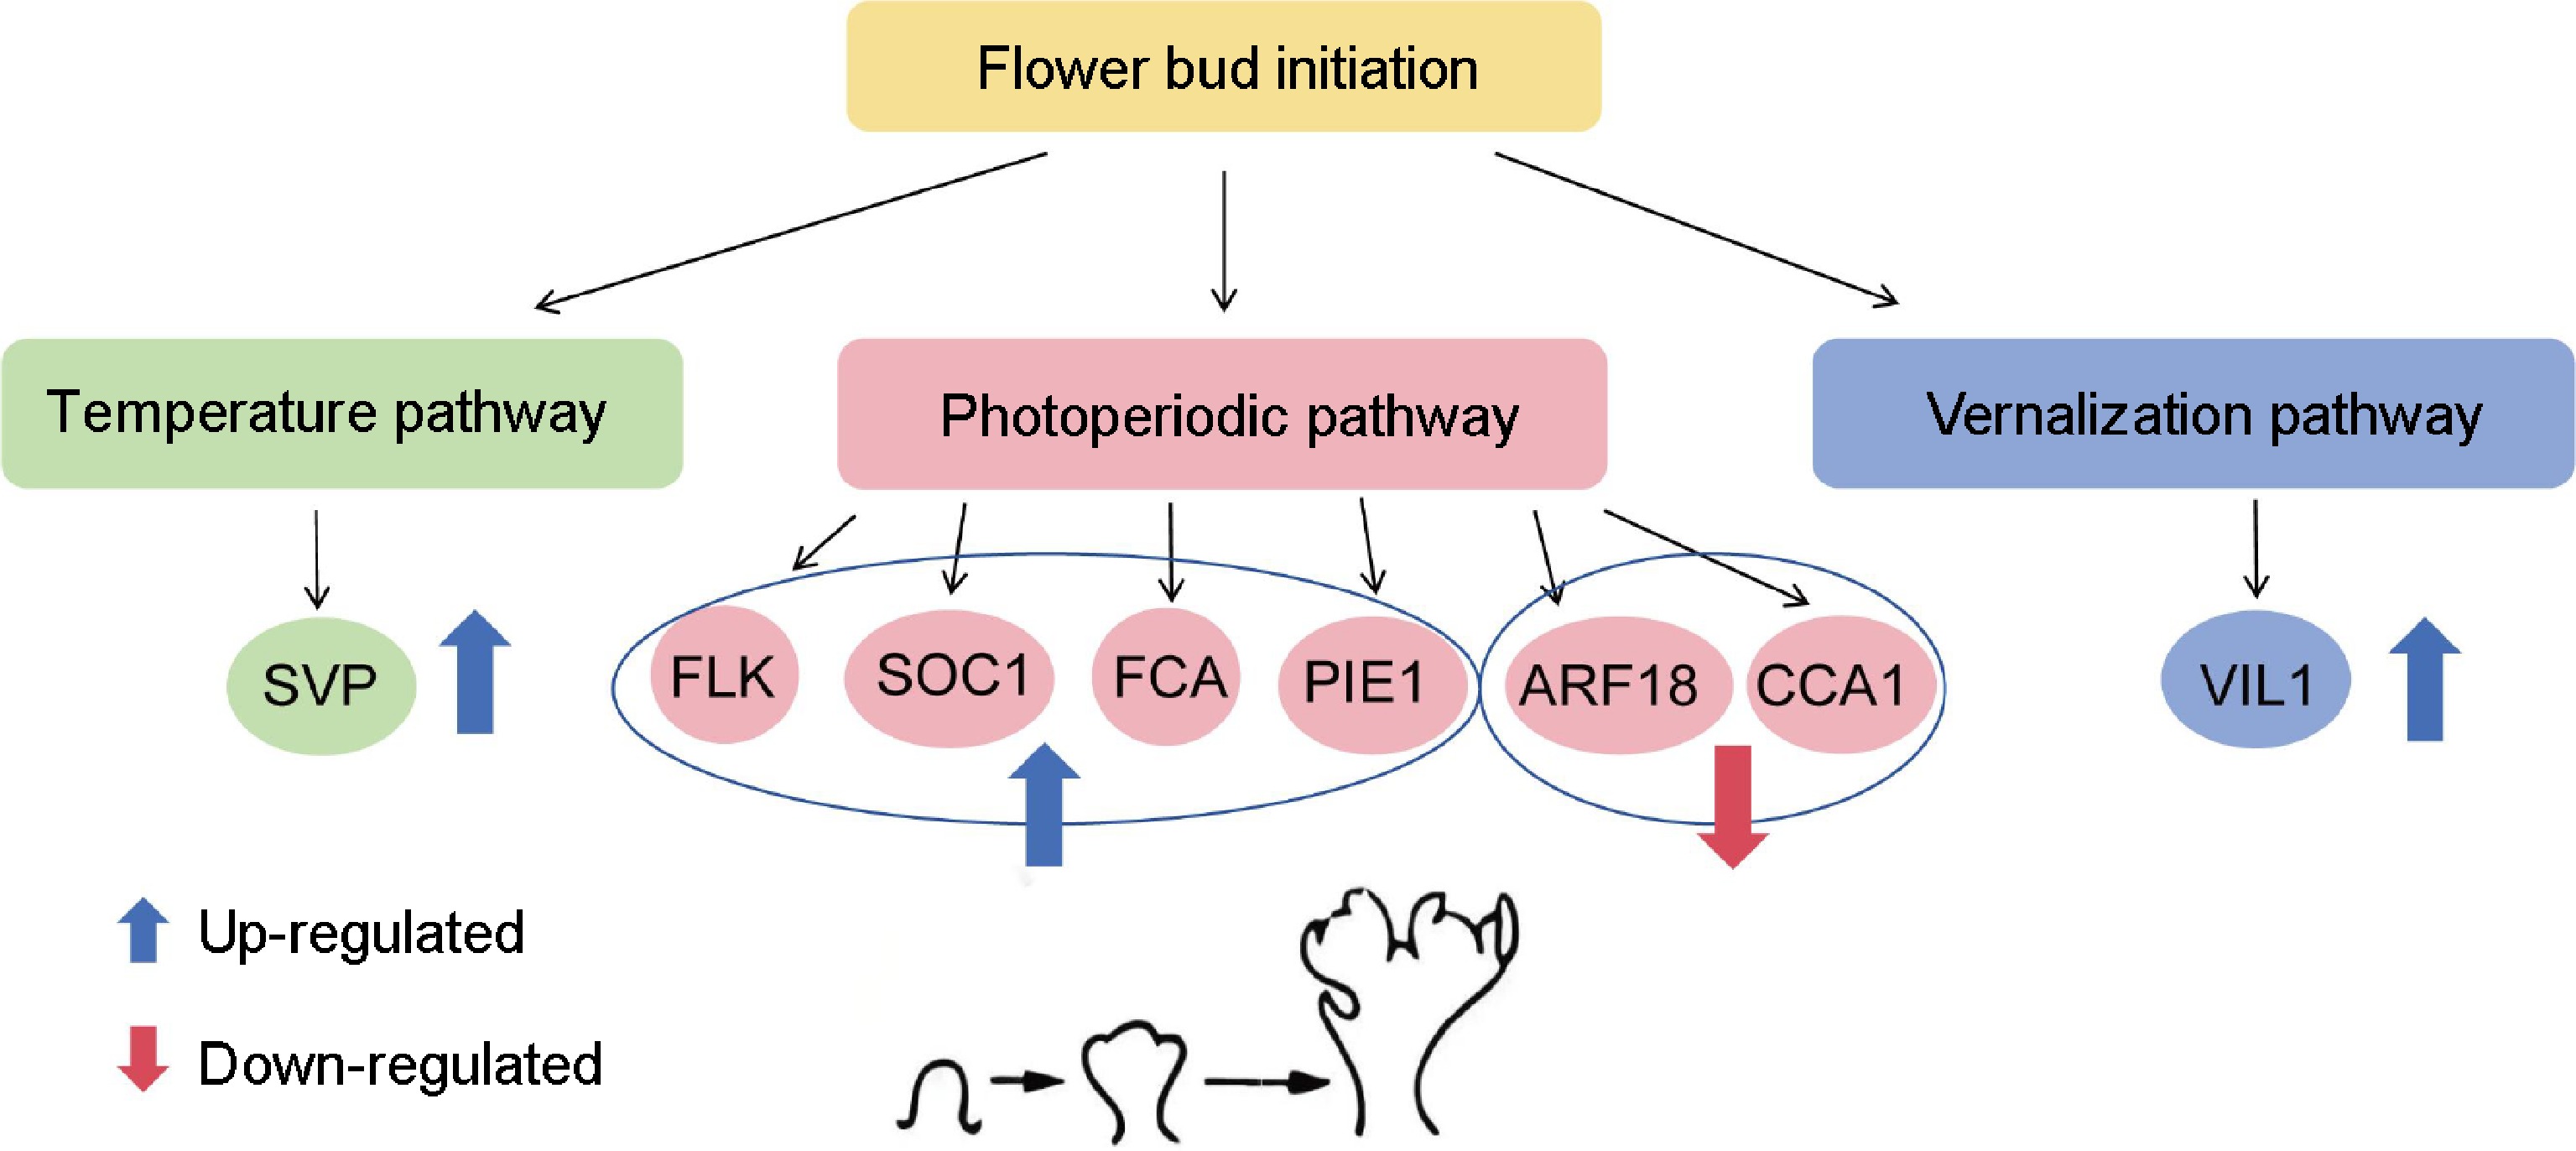
Figure 9.
Schematic model of temperature, photoperiod, and vernalization pathways involved in the flower transition of lilies. The blue circle represents gene expression involved in the photoperiodic pathway. The blue indicates upregulation, and red indicates downregulation.
-
Flower bud initiation marks the transition from vegetative to reproductive growth in plants and occurs after the plant has accumulated the necessary nutrients[33]. Pecan (Carya illinoensis) takes nearly one year to develop and paraffin sectioning determined the stages of initial flower bud differentiation, floral primordium formation, and pistil and stamen primordium formation[34]. The histological analysis of paraffin sections in Lycoris radiata showed that flower bud differentiation can be divided into six stages: the vegetative growth period, bud undifferentiated period, leaf primordium differentiation period, bract primordium differentiation period, petal primordium differentiation period, and stamen primordium differentiation period[35].
In this study, the flower transition process was recorded during the 10 d preceding flowering across different series and varieties of lilies. The paraffin sectioning analysis revealed no significant changes in the floral transition of 'Yellow Planet' and 'Red Morning' during this period; however, the flower transition in 'Purple Marble,' 'Hotel California,' 'Brasilia,' and 'Hachi' could be categorized into six distinct stages: undifferentiated stage: early differentiation stage, flower primordium differentiation, floral organ differentiation, and inflorescence formation (Fig. 1b).
Photoperiod-, vernalization-, and temperature-related gene expression during the flowering transition process in lilies
-
To obtain all DEGs from RNA-seq data, gene expression was analyzed based on FPKM for all genes. The photoperiod is an important factor affecting plant flowering. The photoperiodic pathway is a process in which a plant's photoreceptors perceive light signals and act on the biological clock to initiate or inhibit flowering. At present, there are three main types of photoreceptors found in plants: phytochromes, cryptochromes, and phototropin[36]. There are at least five kinds of photopigments: PHYTOCHROME A (PHYA), PHYTOCHROME B (PHYB), PHYTOCHROME C (PHYC), PHYTOCHROME D (PHYD), and PHYTOCHROME E (PHYE). PHYA promotes flowering, while PHYB inhibits it[37].
FLK is recognized as a positive regulator of flowering and is important in the self-help pathway of flowering[37]. Previous studies have shown that FLK regulates the autonomous flowering pathway by controlling FLC in Arabidopsis[38]. In this study, FLK was identified as a positive regulator of flowering in lilies (Fig. 5b). It may interact with other photoperiod-related genes, such as CO and FT. As a key gene in the photoperiod pathway, CO might activate FLK expression upon perceiving appropriate photoperiod signals. Alternatively, FLK could indirectly influence CO's perception and transduction of light signals by regulating an unknown factor, suggesting that the function of the FLK gene in the regulation of lily flowering may be somewhat conserved with that of Arabidopsis, but it may also have a lilium-specific regulatory mechanism and further study is needed. The FT gene is commonly recognized as an integrator of flowering signals in plants. FLK may interact with FT to jointly promote the expression of genes associated with floral bud transition. For instance, FLK might regulate the stability of FT or its subcellular localization, thereby enhancing FT's activity and enabling it to more effectively activate downstream genes involved in floral bud development.
SOC1, encoding a MADS-box transcription factor, integrates multiple flowering signals derived from photoperiod, temperature, hormone, and age-related signals. It is likely downstream of photoperiod-related genes such as FLK, receiving signals from the photoperiod pathway and integrating them with signals from other pathways. For example, upon activation of FLK, a cascade of signal transduction events may upregulate SOC1 expression. Subsequently, SOC1 regulates the expression of floral meristem identity genes, thereby promoting floral bud differentiation and development. The identification results of pear floral meristematic tissue indicate that PbSOC1d and PbSOC1g promote flowering time and may be involved in flower bud development in pear[39]. The findings of this study reveal a significant upregulation of SOC1, in agreement with transcriptomic data, confirming its involvement in lily flowering; however, the precise molecular mechanisms through which SOC1 regulates this process remain to be fully explored (Fig. 5c).
FCA plays a role in regulating flowering time in Arabidopsis[40] and exhibits differential expression levels among lily cultivars, correlating with floral bud initiation. FCA may interact with other transcription factors, such as FLK and SOC1, to co-regulate the expression of genes involved in floral bud transition. For example, FCA might influence FLK at the post-transcriptional level, modulating each other's mRNA stability or translation efficiency. The interaction could fine-tune the transmission of flowering signals, ensuring precise regulation of floral development. In this study, the relative expression levels of FCA were higher in the T-series 'Yellow Planet' and the OT-series 'Red Morning' compared to that in the LA-series 'Purple Marble', OA-series 'Hotel California', and O-series 'Brasilia' and 'Hachi', consistent with transcriptomic data (Fig. 5d). ARF genes were expressed in most fig tissues, especially the flower and peel. Transcriptomics analysis results showed that FcARF2, FcARF11, and FcARF12 were stable and highly expressed in the early development stage of the flower and peel in the 'Purple peel' fig[41]. This study shows that ARF18 expression levels in 'Yellow Planet' and 'Red Morning' were significantly higher than in other varieties, aligning with transcriptomic data. However, the specific regulatory factors remain unidentified (Fig. 5e).
In Arabidopsis, mutations in PIE1 lead to early flowering under non-inductive photoperiods for FLC, suggesting that PIE1 may play a role in multiple flowering pathways[42] (Fig. 5f). In Arabidopsis thaliana, the CCA1 gene plays important circadian clock-associated roles[43]. CCA1 is a central clock component, and CCA1 overexpression causes circadian dysfunction, elongated hypocotyls, and late flowering[44]. The results of this study indicate that CCA1 expression levels in 'Yellow Planet' and 'Red Morning' were significantly lower than in other varieties, consistent with transcriptomic data; however, the specific regulatory factors remain unidentified (Fig. 5g).
SHORT VEGETATIVE PHASE (SVP) is a MADS-box protein and a temperature-dependent regulator that plays a crucial role in controlling plant growth and development; SVP can bind to the CARG element in the FT and SOC1 promoters and, inhibit flowering[7,45]. The expression of MdSVPa and MdSVPb during flower bud development in the biennial cultivar 'Sciros-Off' suggests that SVP may play a role in floral meristem development[46]. During the floral bud transition in lilies, the expression of SVP may be regulated by genes in the photoperiod pathway. For instance, under unfavorable photoperiod conditions, certain repressors in the photoperiod pathway might upregulate SVP expression, thereby inhibiting floral bud formation. Conversely, under favorable photoperiod conditions, activation of the photoperiod pathway could suppress SVP expression, releasing its inhibitory effect on floral bud development. This study revealed that the relative expression levels of SVP were higher in the T-series 'Yellow Planet' and OT-series 'Red Morning' compared to that in the LA-series 'Purple Marble', the OA-series 'Hotel California', and the O-series 'Brasilia' and 'Hachi', consistent with transcriptomic (Fig. 6b).
Vernalization plays an important role in regulating flowering and can induce plants to bloom through low-temperature induction and affect the quality and quantity of flowers. VERNALIZATION INSENSITIVE 3 (VIN3) is an important regulator in the vernalization response, with its expression increasing as the vernalization period progresses and rapidly decreasing as temperatures rise. Previous studies indicate that LoVIL1 is a suitable marker for the bud-growth-transition trait following the release from dormancy in lily cultivars[12]. The results of this study indicate that VIL1 expression levels in 'Yellow Planet' and 'Red Morning' are significantly higher than those in other varieties, consistent with transcriptomic data (Fig. 6d).
Validation of RNA-seq accuracy and specificity in VIGS-based gene silencing
-
To assess the accuracy of the RNA-seq technique, we performed multiple replicate experiments, and performed strict quality control, and filtered the data. Meanwhile, some key genes were validated by qRT-PCR and showed a high agreement, thus enhancing the accuracy of RNA-seq data. For the specificity and efficacy assessment of the VIGS system, we set up multiple controls in our experiments, including both TRV2 empty vector controls and untreated controls. Through the detailed comparison of LtFCA gene silenced plants and control plants in phenotype and gene expression level, we found that only in LtFCA gene silenced plants, and the expression level of LtFCA gene was significantly reduced, indicating that the silencing effect of the gene is specific, rather than other non-specific factors.
Role of LtFCA in flower bud initiation in lilies
-
VIGS systems are effective for the rapid analysis of gene functions in plants that require a long period of growth such as lilies[47]. The transient silencing of LiMYB305 in Lilium 'Siberia' petals using VIGS technology showed that the mRNA expression levels of LiLiS, LiOcS, and LiMyS were downregulated[48]. In Rosa chinensis, silencing RcJMJ12 via VIGS delayed flowering and reduced the expression of key flowering regulators, including RcFT, RcSOC1, RcFUL, RcLFY, and RcAP1 in flowering initiation[49]. To test the efficacy of the established TRV-mediated VIGS system for lily gene functional analysis, knocking down the expression of LtFCA via TRV-mediated VIGS was attempted to characterize its potential role in flower bud initiation. The results showed the expression of LtFCA was successfully knocked down using the VIGS system (Fig. 8a), and this led to compromised flower bud initiation in the silenced Lilium plants (Fig. 8d). The TRV-based VIGS system established may, therefore, substantially facilitate functional genomic studies in Lilium.
Through transcriptome data and functional gene analysis, we identified several differentially expressed genes that play critical roles in the floral bud transition of lilies. Genes such as FLK and SOC1 may form a complex regulatory network, influencing each other's expression levels and subsequently regulating physiological processes related to floral bud transition. FLK might interact with other unknown factors to activate SOC1 expression, while SOC1, as a transcription factor, could regulate the expression of a downstream set of genes associated with floral bud differentiation. Together, these genes coordinate at both cellular and physiological levels to drive the progression of floral buds from initiation to mature development. However, the specific interaction patterns among these genes remain to be elucidated and will require further studies using methods such as yeast two-hybrid assays and gene co-expression analyses.
In conclusion, this study confirmed the accuracy of the flower bud initiation transcriptome data through qRT-PCR and explained the influence of photoperiod, vernalization, and temperature factors on lily flowering. Although genes related to lily flower bud initiation were identified, their specific functions and mechanisms of action remain incompletely understood. The regulation of flowering is governed by a complex genetic network that includes transcription factors, miRNAs, and various other components. While some genes may exhibit high expression levels, they can still be modulated by negative regulatory factors, leading to delays in the flowering process. There may be discrepancies between gene expression patterns and their physiological roles, requiring further experimental validation. This research provides insights into the molecular mechanisms of lily flower bud initiation and highlights the connections between the developmental processes of flower bud formation across different lily varieties. It also offers valuable candidate genes for molecular breeding.
This work was supported by the Excellent Youth Science Foundation of Beijing Academy of Agriculture and Forestry Sciences (YXQN202303 to Yunpeng Du), the National Natural Science Foundation of China (32371954 to Yunpeng Du; 32302599 to Jiahui Liang and 32201606 to Mingfang Zhang), and the Special Projects for Capacity Building in Scientific and Technological Innovation of the Beijing Academy of Agriculture and Forestry Sciences (KJCX20230801 and KJCX20230106).
-
The authors confirm contribution to the paper as follows: study conception and design: Liu D, Liang J; data collection: Liu D; analysis and interpretation of results: Liu D, Liang J, Pan W; software analysis: Liu D, Yu S, Zhang Z, Zhang M, Yang F; draft manuscript preparation: Liu D, Pan W, Du Y. All authors reviewed the results and approved the final version of the manuscript.
-
The data supporting the findings of this study are available upon request from the corresponding author. To facilitate reproducibility and transparency, all primers utilized in this study are provided in Supplementary Table S1.
-
The authors declare that they have no conflict of interest.
- Supplementary Table S1 List of primers used in qPCR analysis.
- Supplementary Fig. S1 Key genes involved in aging pathways during flower bud initiation. Heat maps show correlations between samples and genes. Red and blue indicate positive and negative correlations, respectively.
- Supplementary Fig. S2 Key genes involved in autonomic pathway during flower bud initiation. Heat maps show correlations between samples and genes. Red and blue indicate positive and negative correlations, respectively.
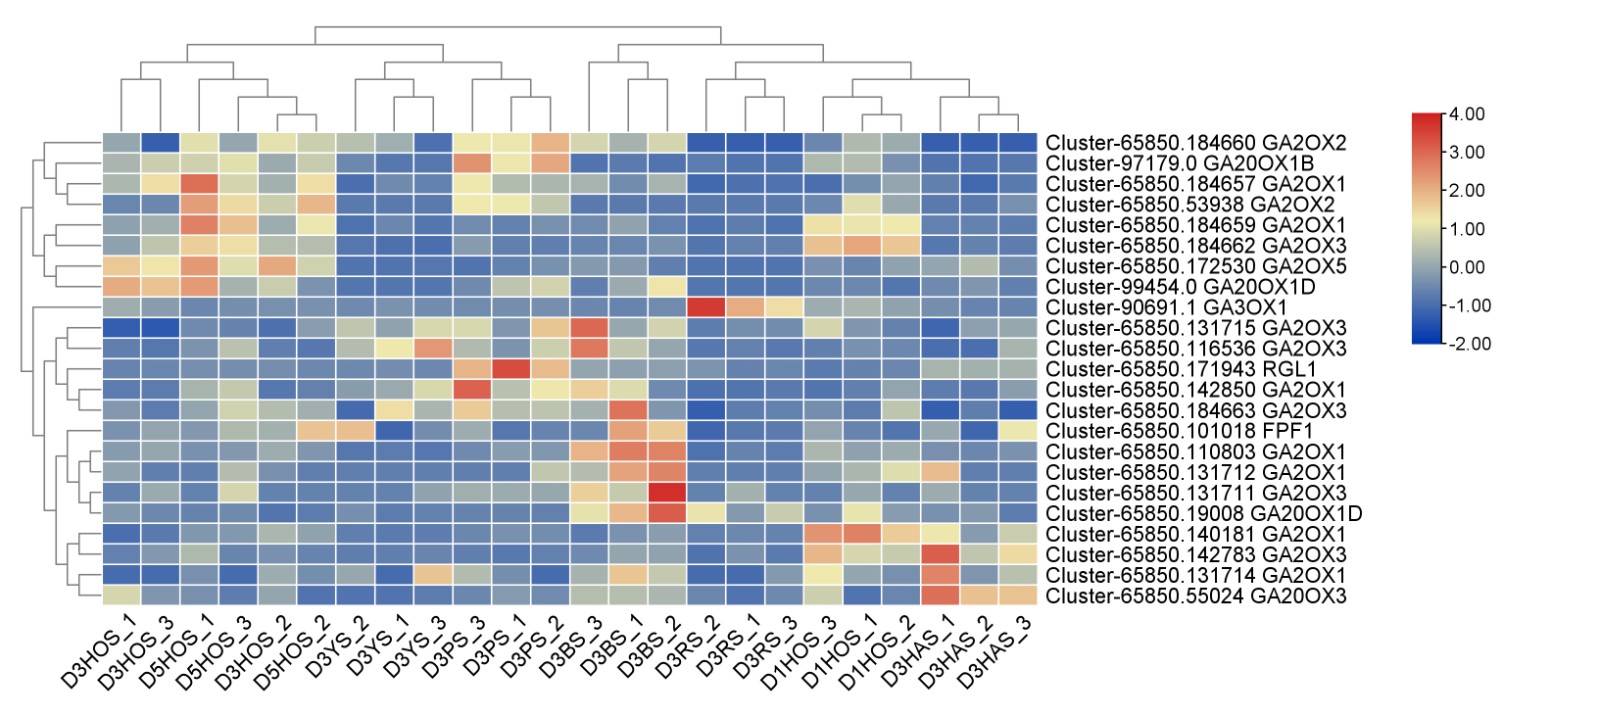
- Supplementary Fig. S3 Key genes involved in gibberellin pathway during flower bud initiation. Heat maps show correlations between samples and genes. Red and blue indicate positive and negative correlations, respectively.
- Copyright: © 2025 by the author(s). Published by Maximum Academic Press, Fayetteville, GA. This article is an open access article distributed under Creative Commons Attribution License (CC BY 4.0), visit https://creativecommons.org/licenses/by/4.0/.
-
About this article
Cite this article
Liu D, Liang J, Pan W, Zhang M, Yang F, et al. 2025. Histological, transcriptomic, and gene functional analyses of flower transition in lily. Ornamental Plant Research 5: e006 doi: 10.48130/opr-0025-0006 

Histological, transcriptomic, and gene functional analyses of flower transition in lily
- Received: 18 November 2024
- Revised: 24 December 2024
- Accepted: 02 January 2025
- Published online: 21 February 2025
Abstract: Lilies are globally cultivated ornamental flowers and an economic crop, whose flower bud initiation is regulated by a complex interplay of intrinsic factors and external environmental conditions; however, this mechanism remains largely unknown. In the present study, RNA sequencing (RNA-seq) coupled with histological and gene functional data were employed to reveal the differences in flower bud initiation between various lily cultivars. The results exhibited that the floral buds of the O-series 'Brasilia' and 'Hachi' differentiated quickly, the LA -series 'Purple Marble' and the OA-series 'Hotel California' were slower compared to the O-series. Additionally, the T-series 'Yellow Planet' and OT-series 'Red Morning' floral buds differentiated later. By comparing 'Yellow Planet' and 'Red Morning' with the 'Brasilia,' 'Hachi,' 'Purple Marble', and OA-series 'Hotel California', 5,829 upregulated genes, 1,010 downregulated genes, and some differentially expressed genes (DEGS) involved in pathways such as photoperiod, gibberellin, age, vernalization, autonomous, and temperature were identified. A flowering transition-related gene, FCA, was identified, and the effectiveness of the virus-induced gene silencing (VIGS) system was validated. The results showed the expression of LtFCA was successfully knocked down using the VIGS system, leading to compromised flower bud initiation in silenced lily plants. This observation underscores a potential correlation between the expression patterns of flowering regulatory genes and the distinct species within the lily series. In conclusion, this research provides a basis for understanding the regulatory mechanisms of flower bud transition in lilies.
-
Key words:
- Histological /
- qRT-PCR /
- Flower transition /
- Transcriptomic