-
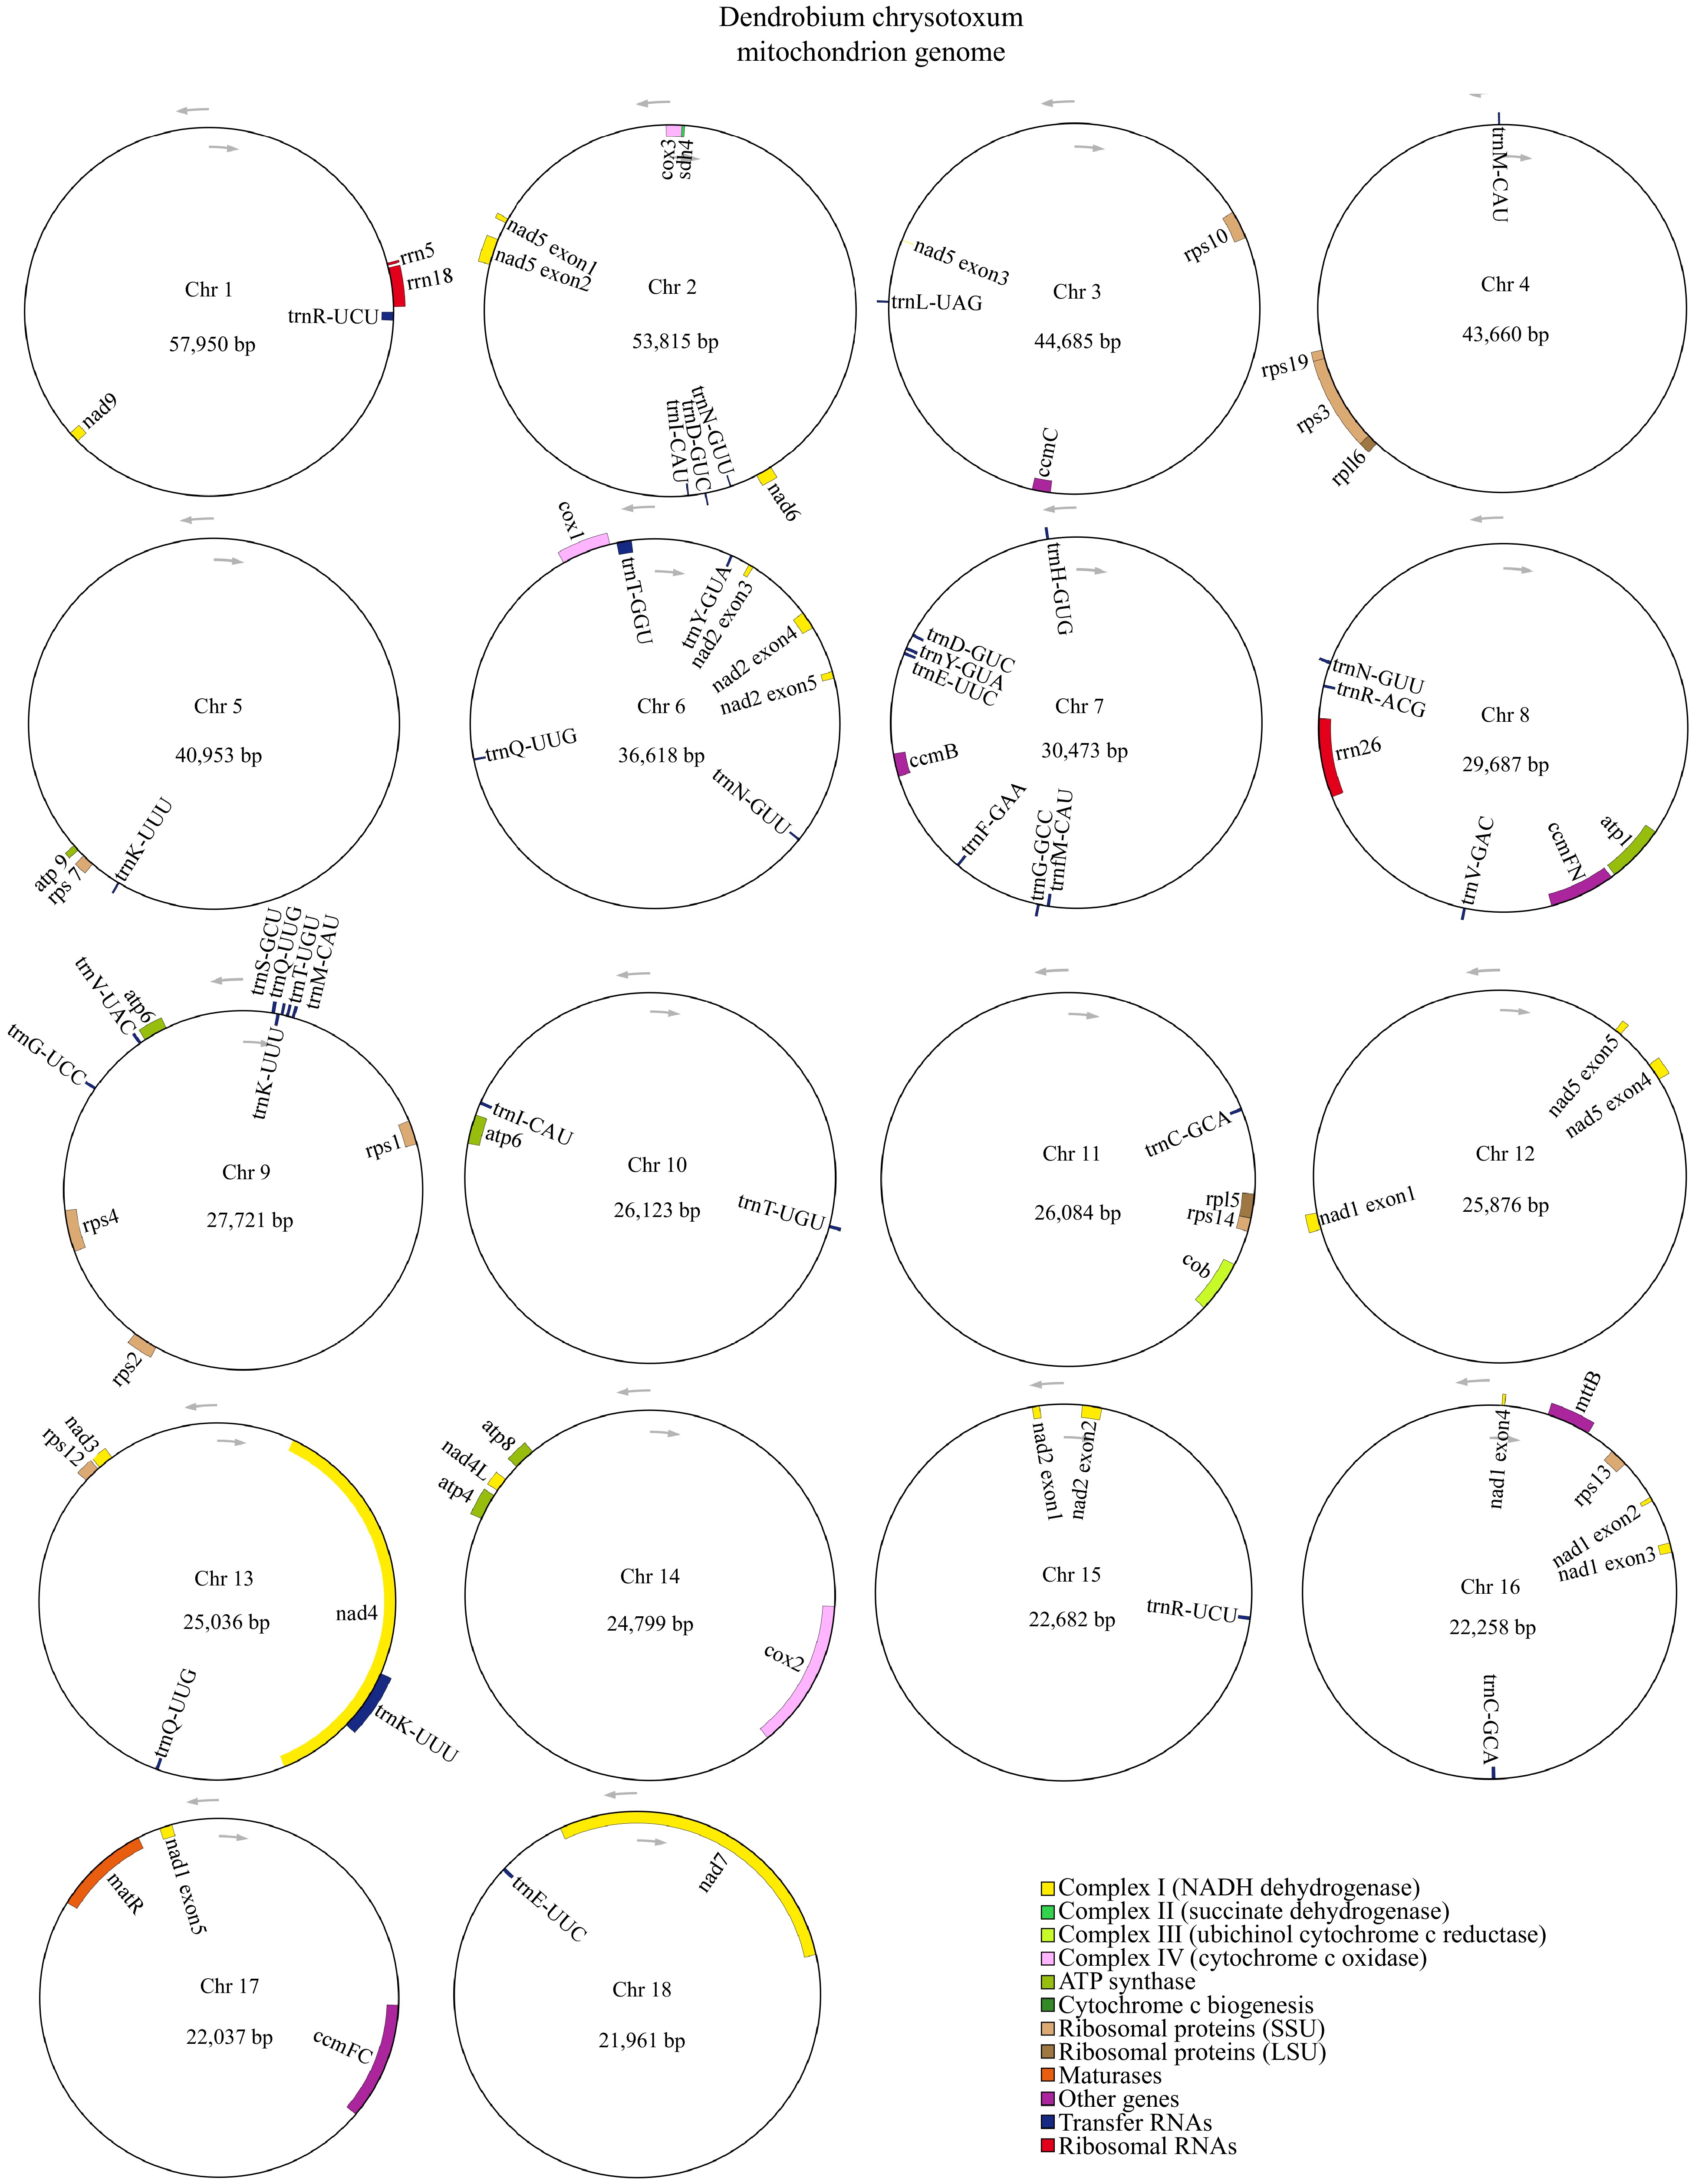
Figure 1.
The mitogenome of D. chrysotoxum was represented as a multiple-branching map, consisting of 18 circular chromosomes. Genes transcribed clockwise are depicted inside each circle, while those transcribed counterclockwise are shown outside the circles. Genes are color-coded according to their functional classification.
-
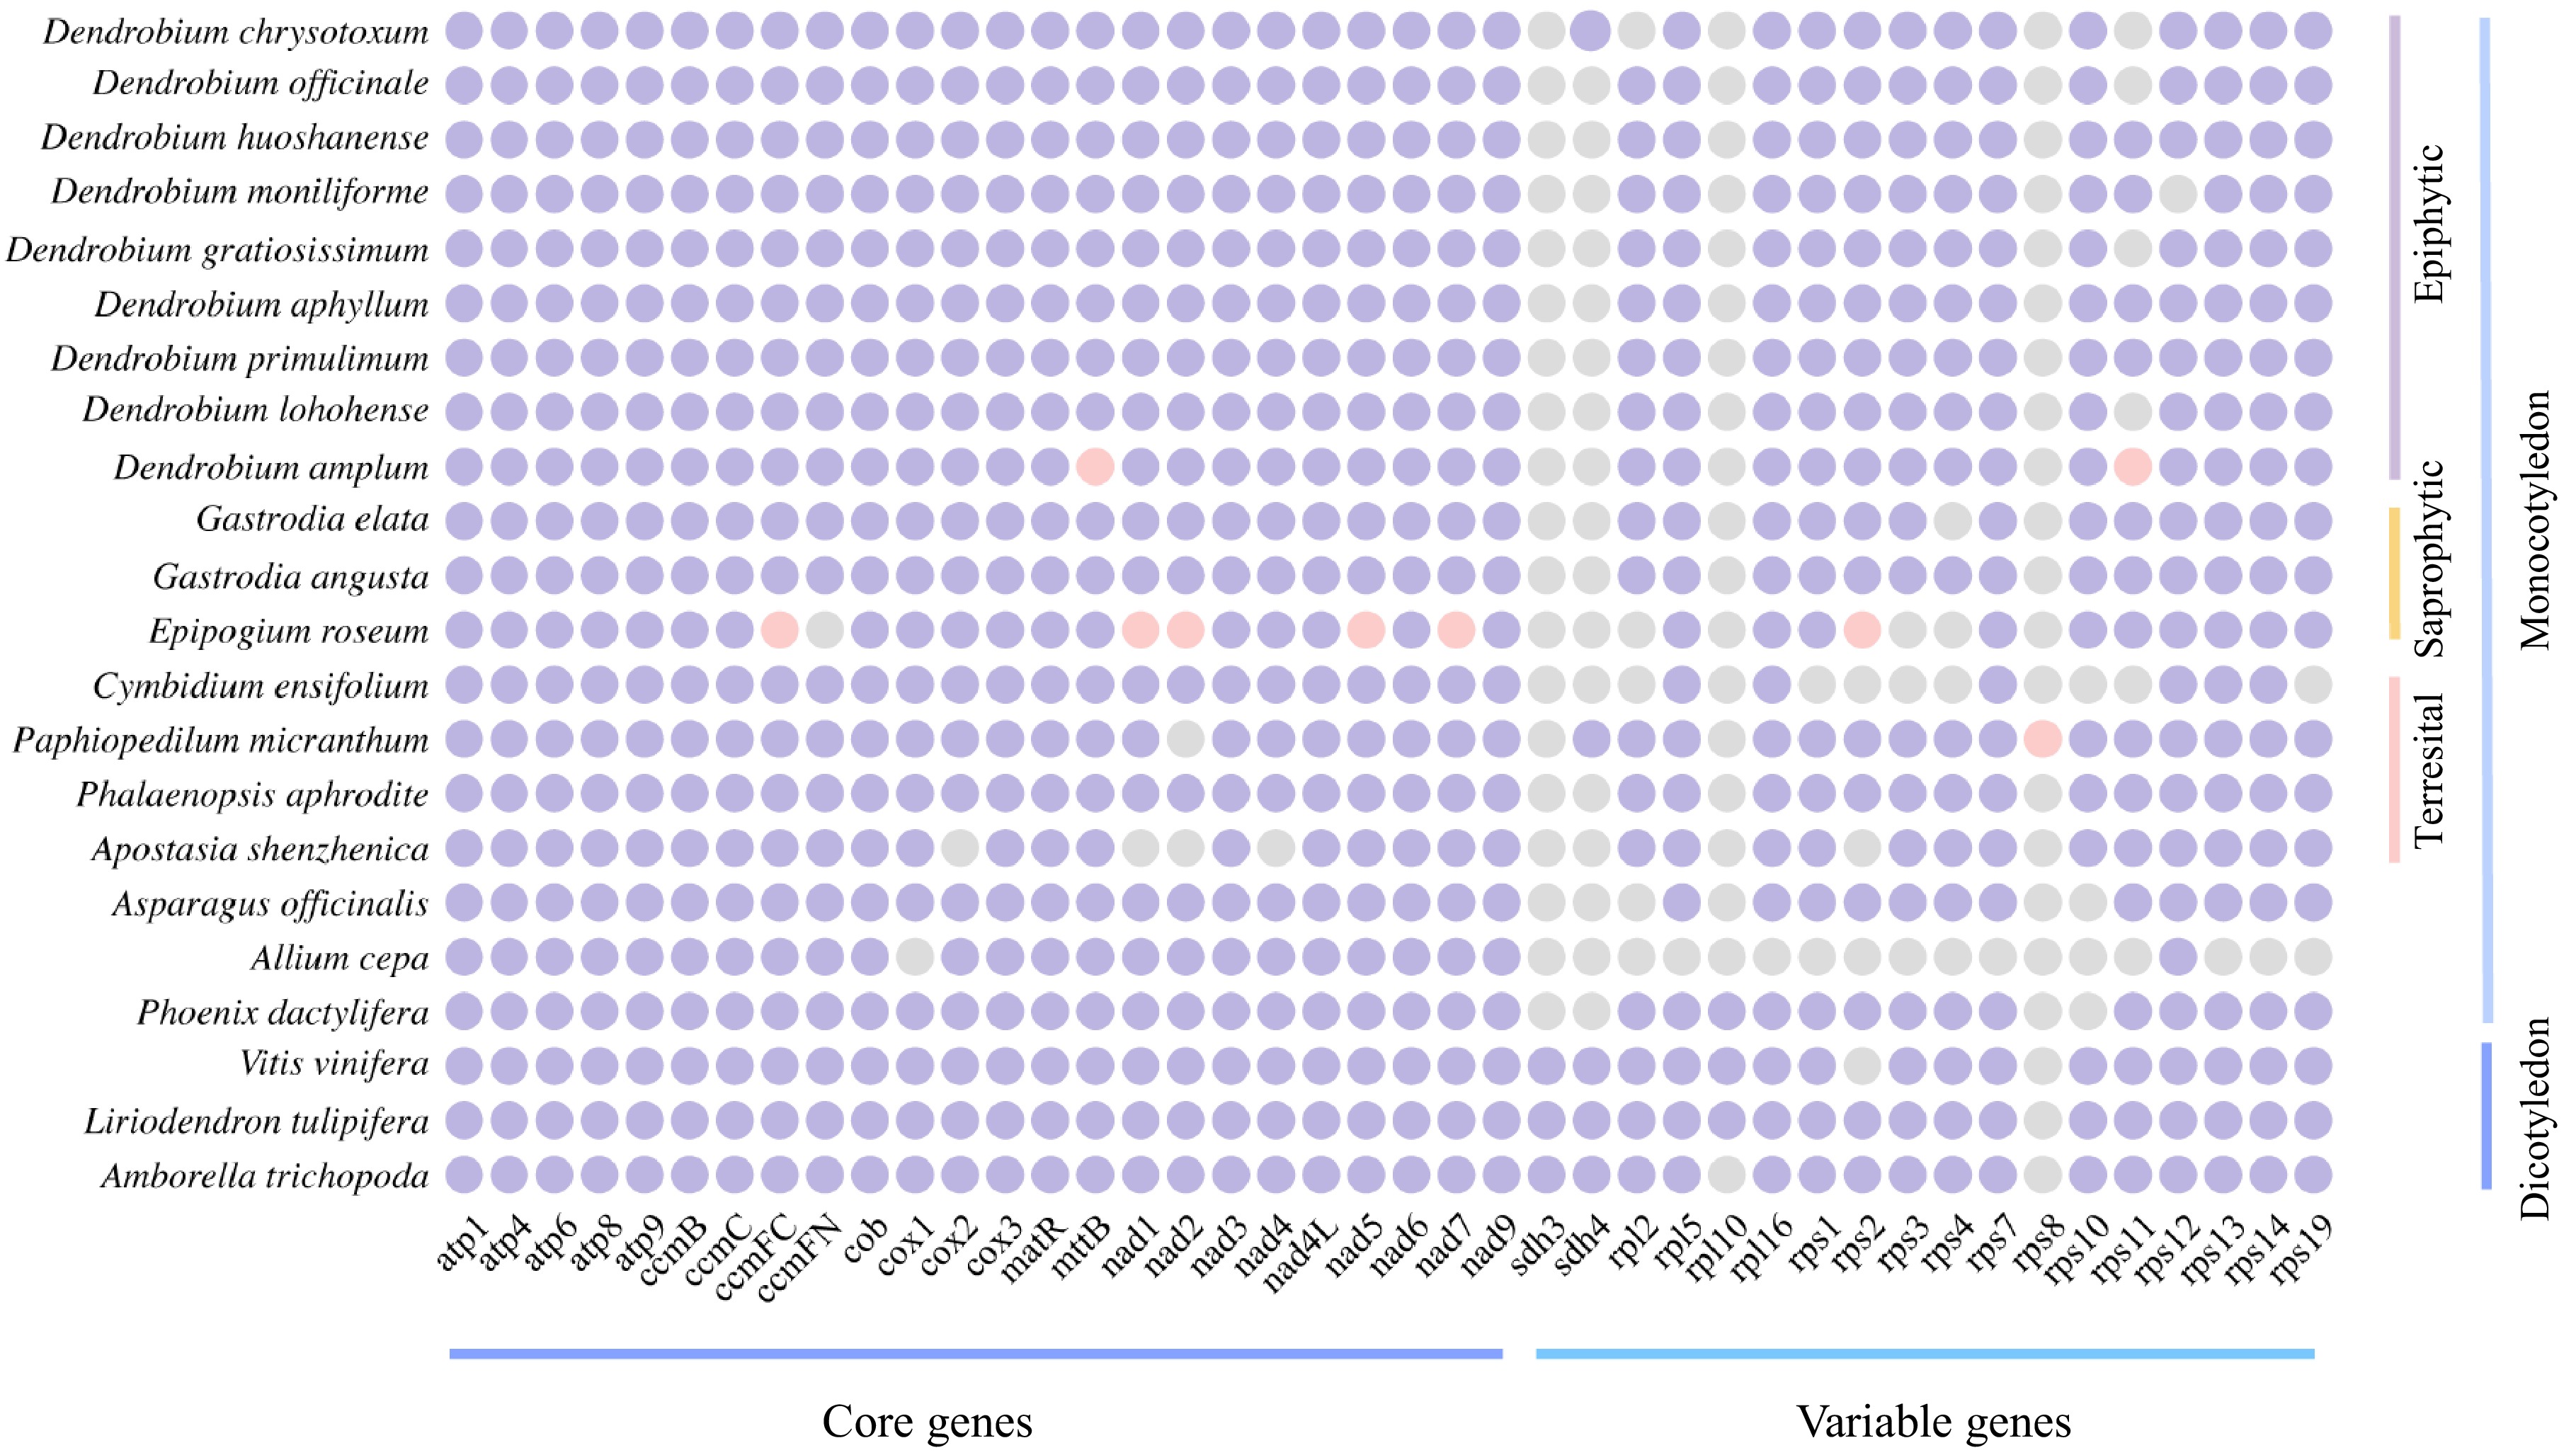
Figure 2.
Comparison of the mitogenome PCGs content of D. chrysotoxum and selected angiosperms. Purple indicates present, grey indicates lost, and pink indicates pseudogenes.
-
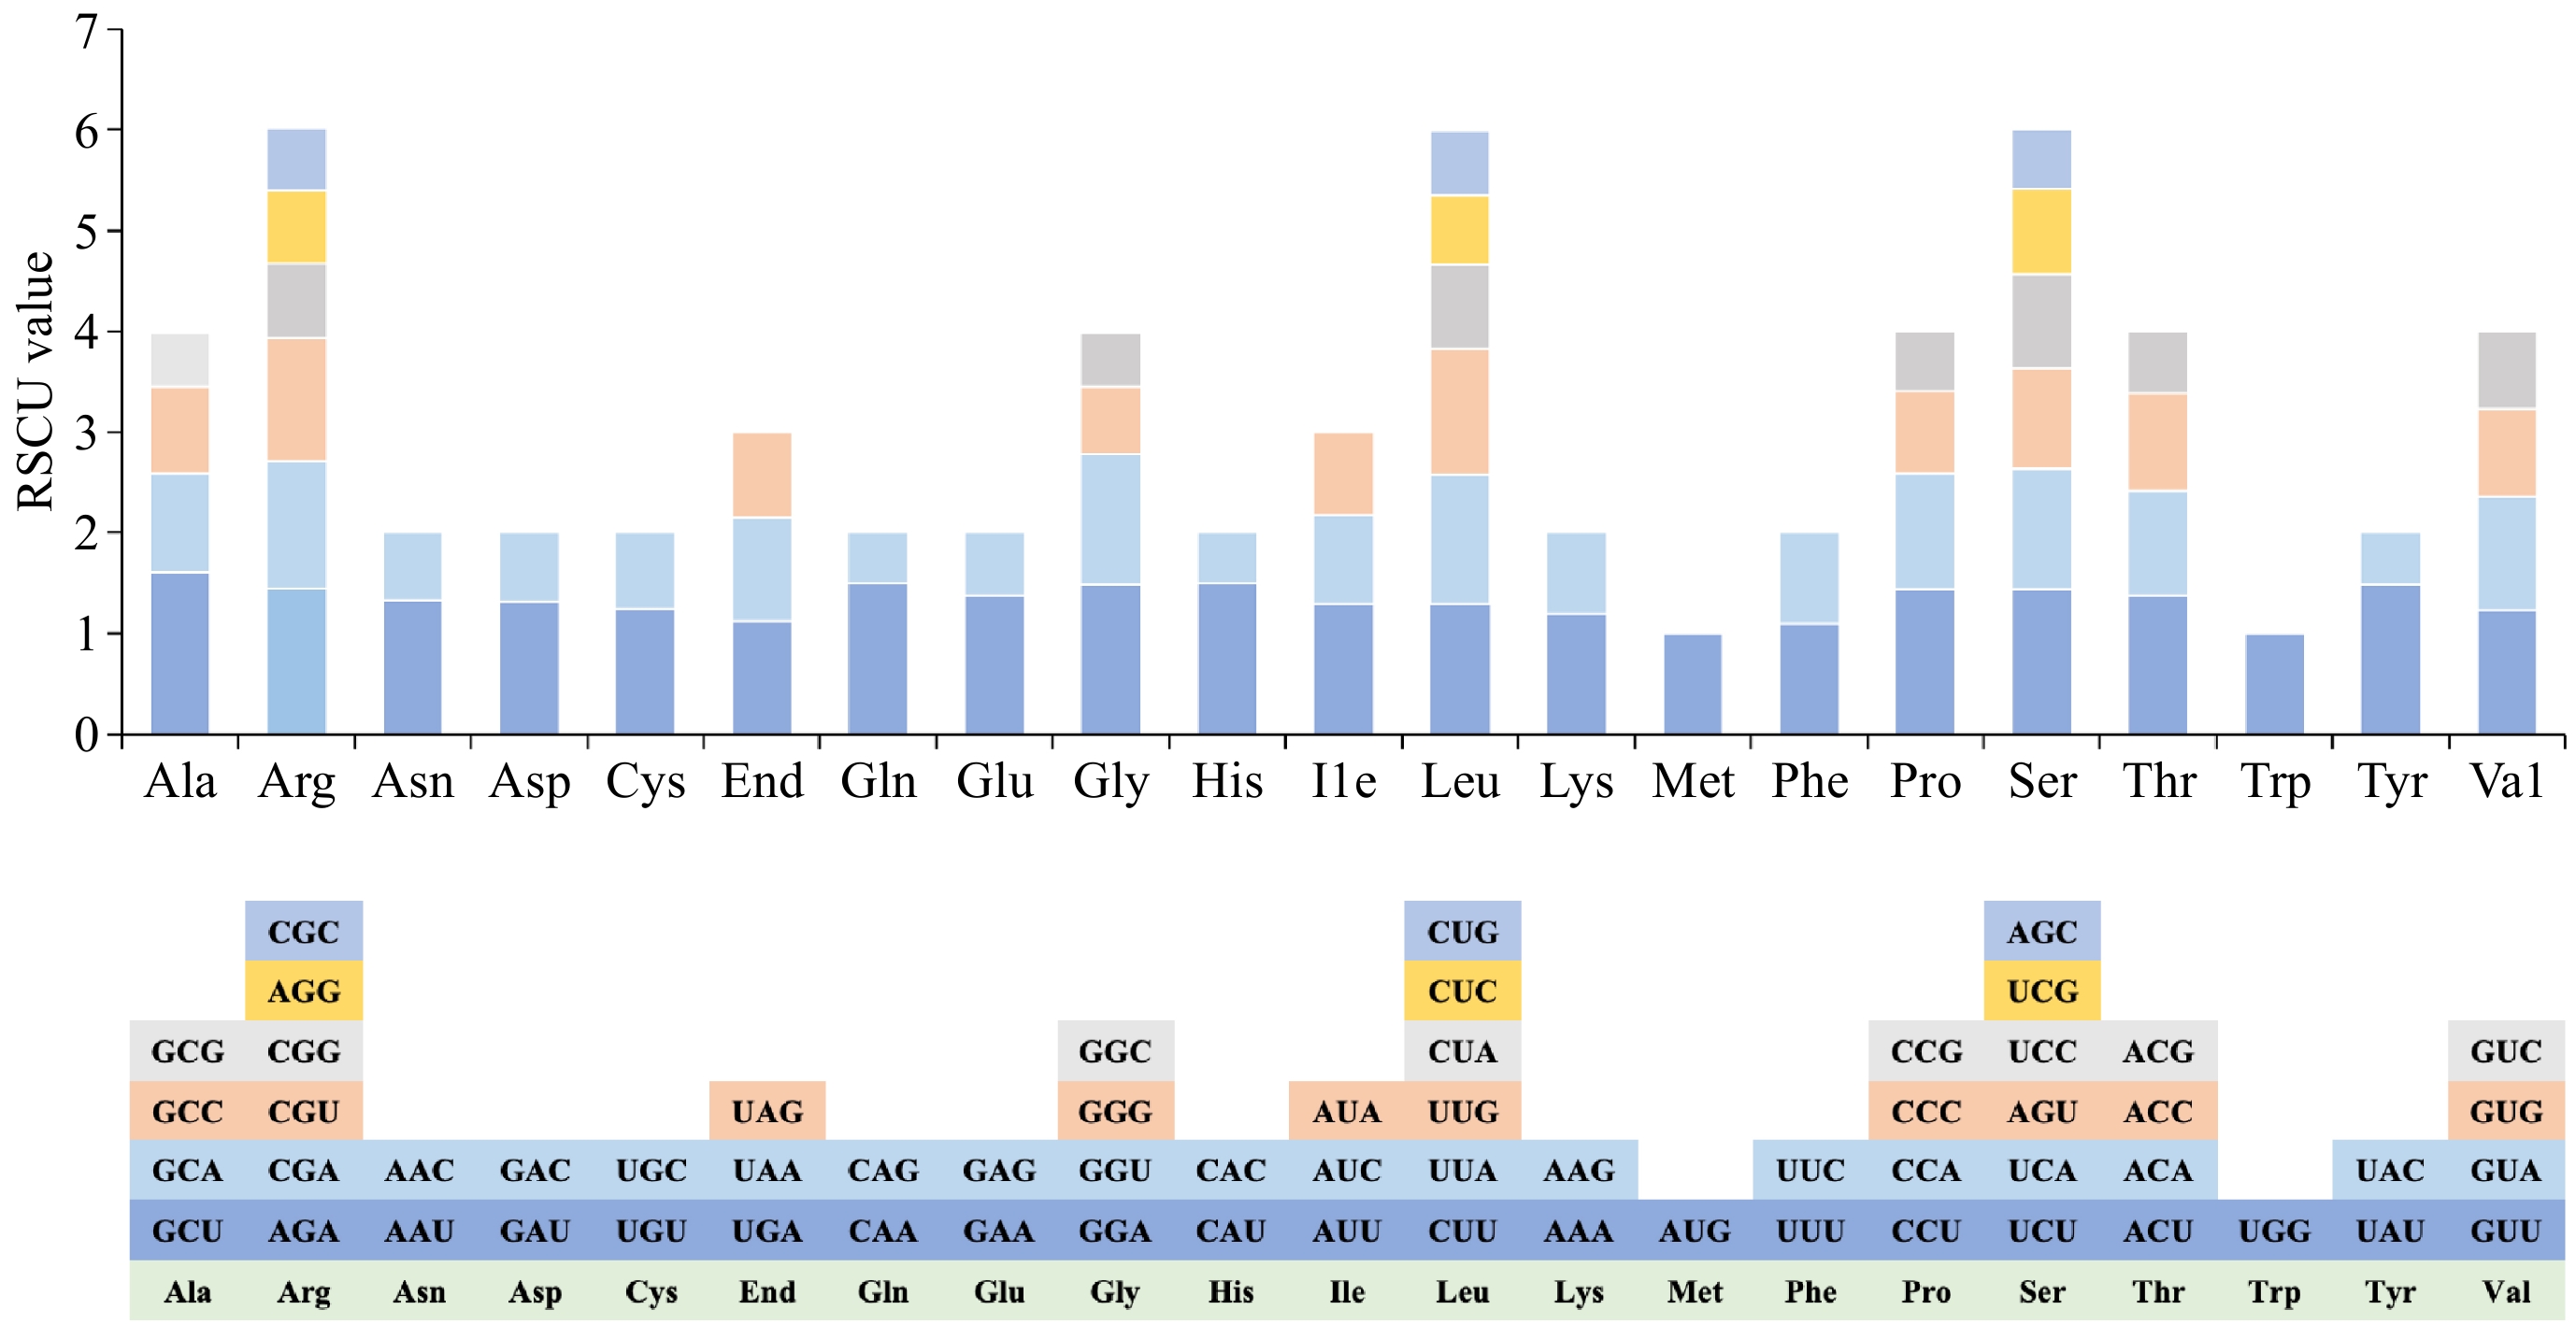
Figure 3.
Analysis of relative synonymous codon usage (RSCU) from D. chrysotoxum mitogenome.
-
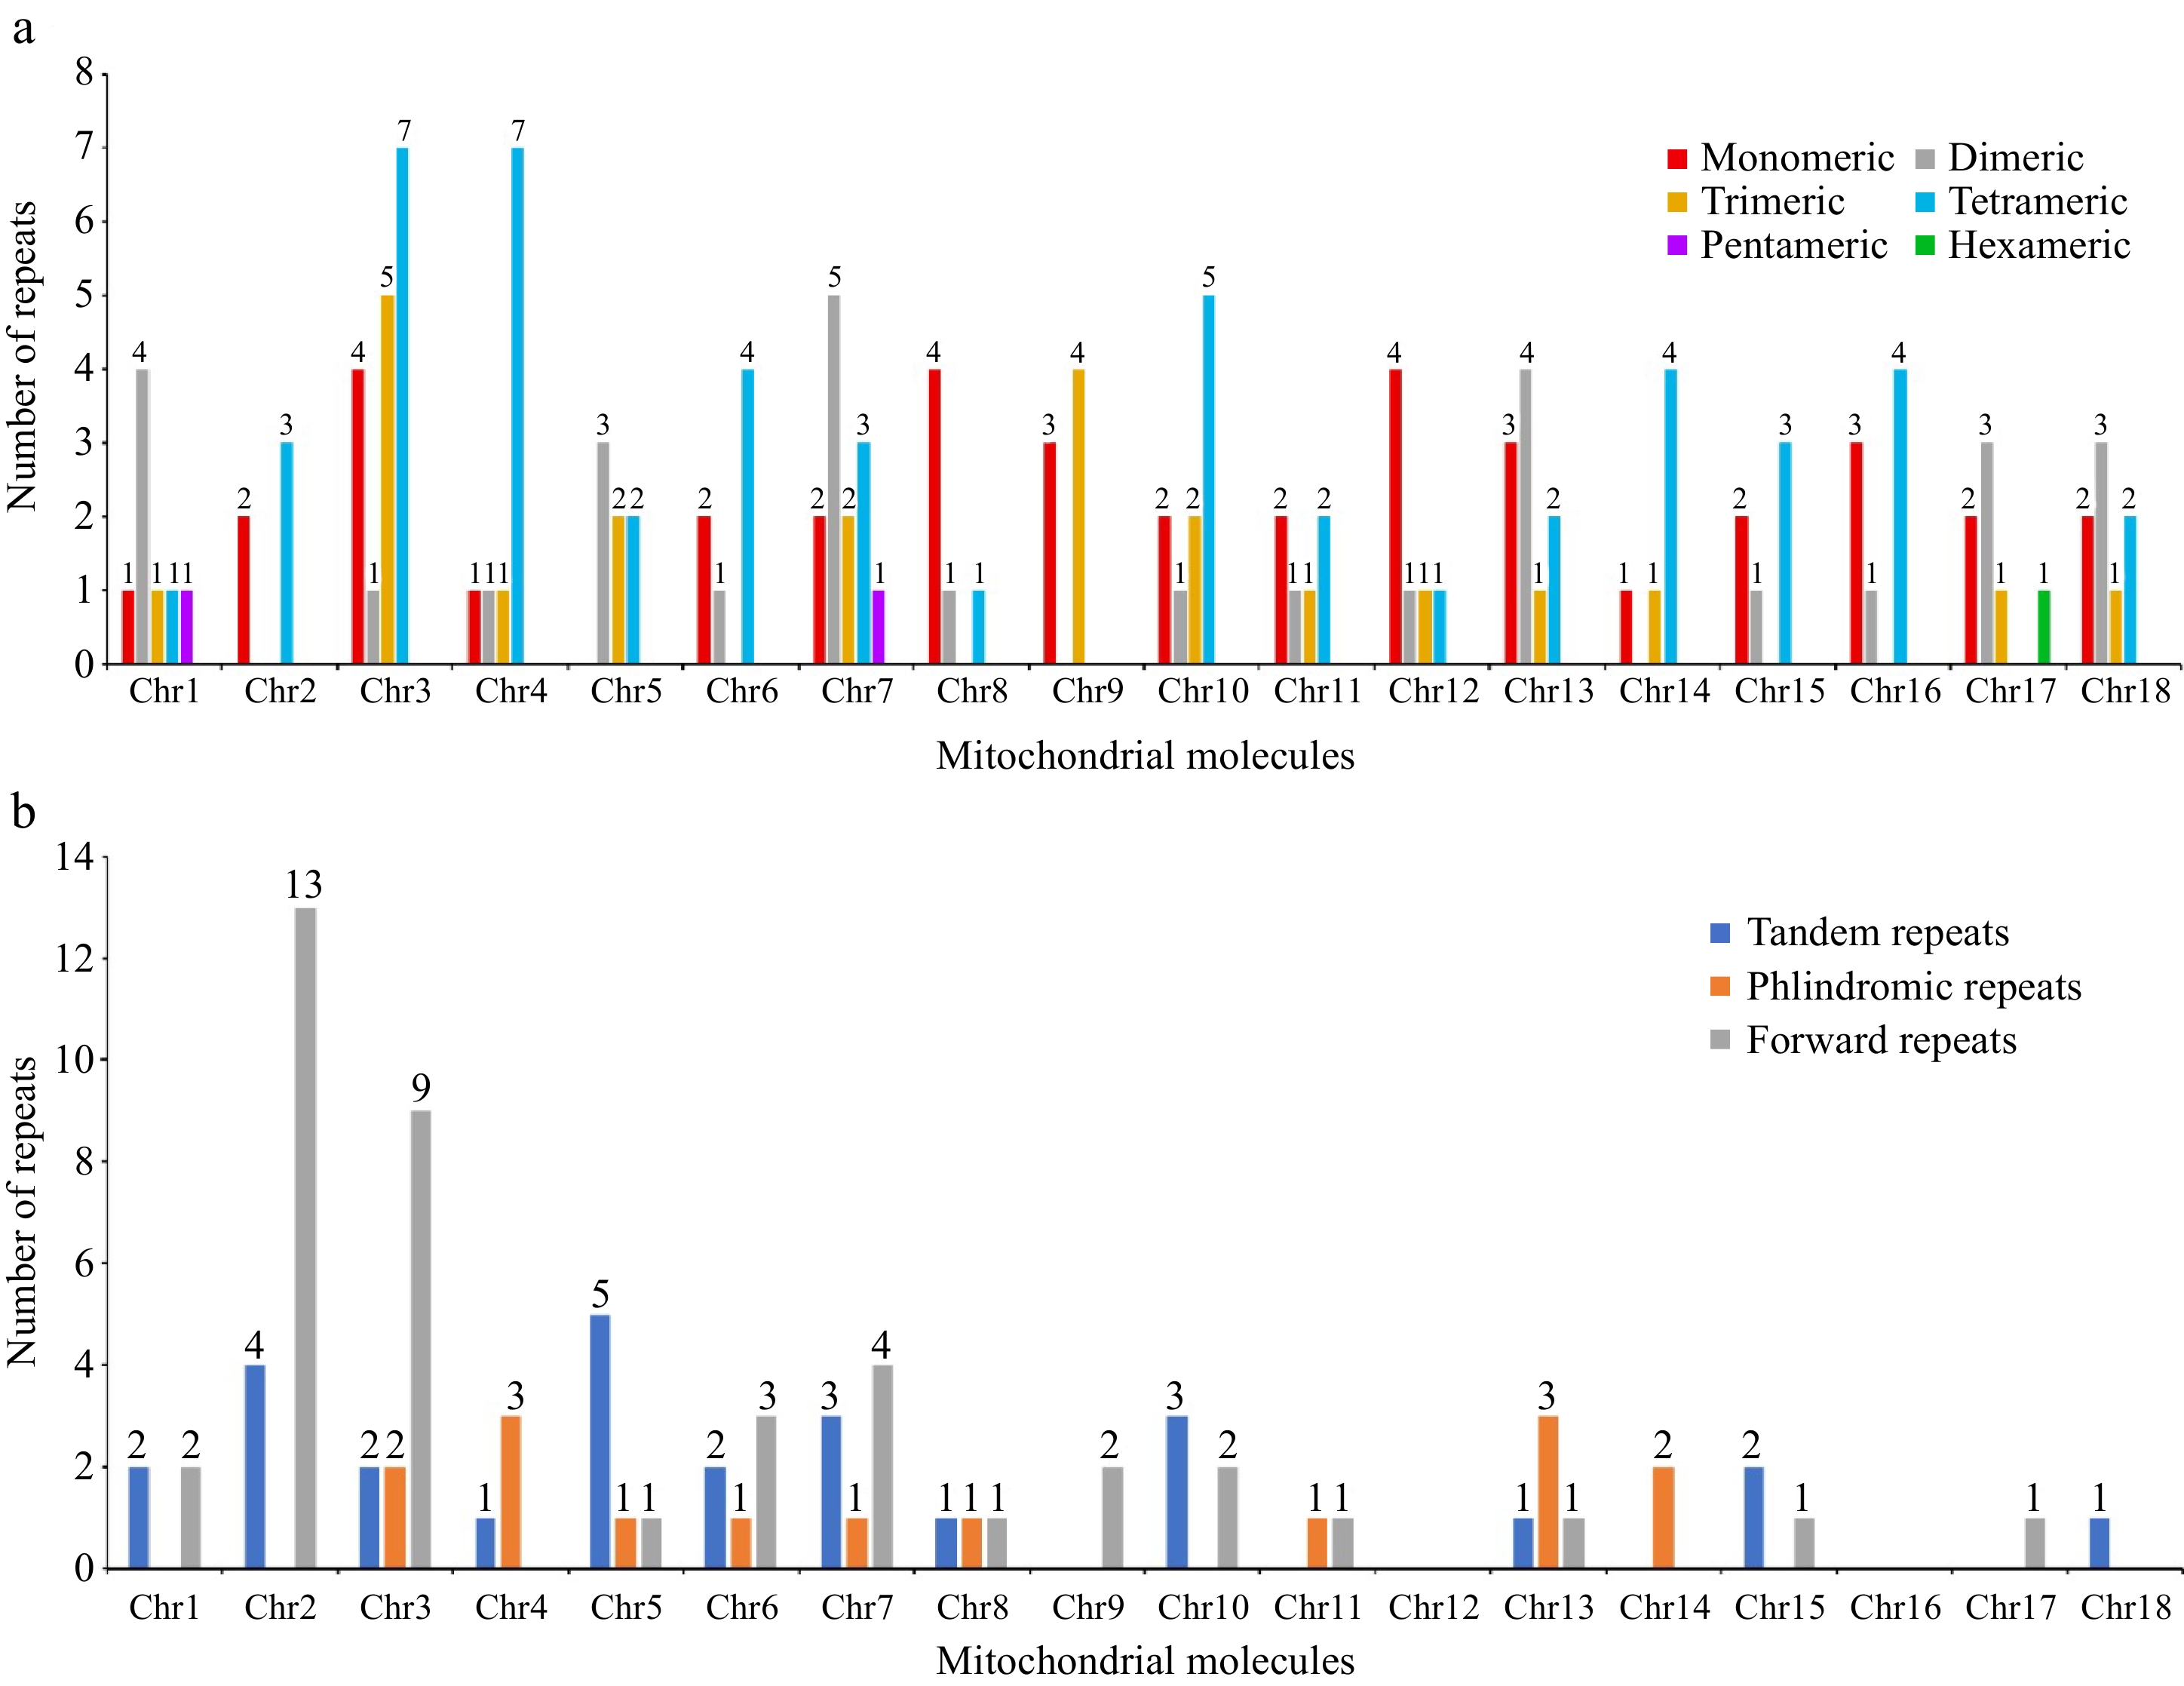
Figure 4.
The repeated sequences in the mitogenome of D. chrysotoxum. (a) The SSRs identified in the D. chrysotoxum mitogenome. The x-axis indicates mitochondrial molecules. The y-axis indicates the number of repeat fragments. The red legend indicates monomeric SSRs, the gray legend indicates dimeric SSRs, the orange yellow legend indicates trimeric SSRs, the blue legend indicates tetrameric SSRs, the purple legend indicates pentameric SSRs, and the green legend indicates hexametric SSRs. (b) The tandem and dispersed repeats identified in the D. chrysotoxum mitogenome. The blue legend said tandem repeats, the yellow legend says palindromic repeats, and the gray forward repeats.
-
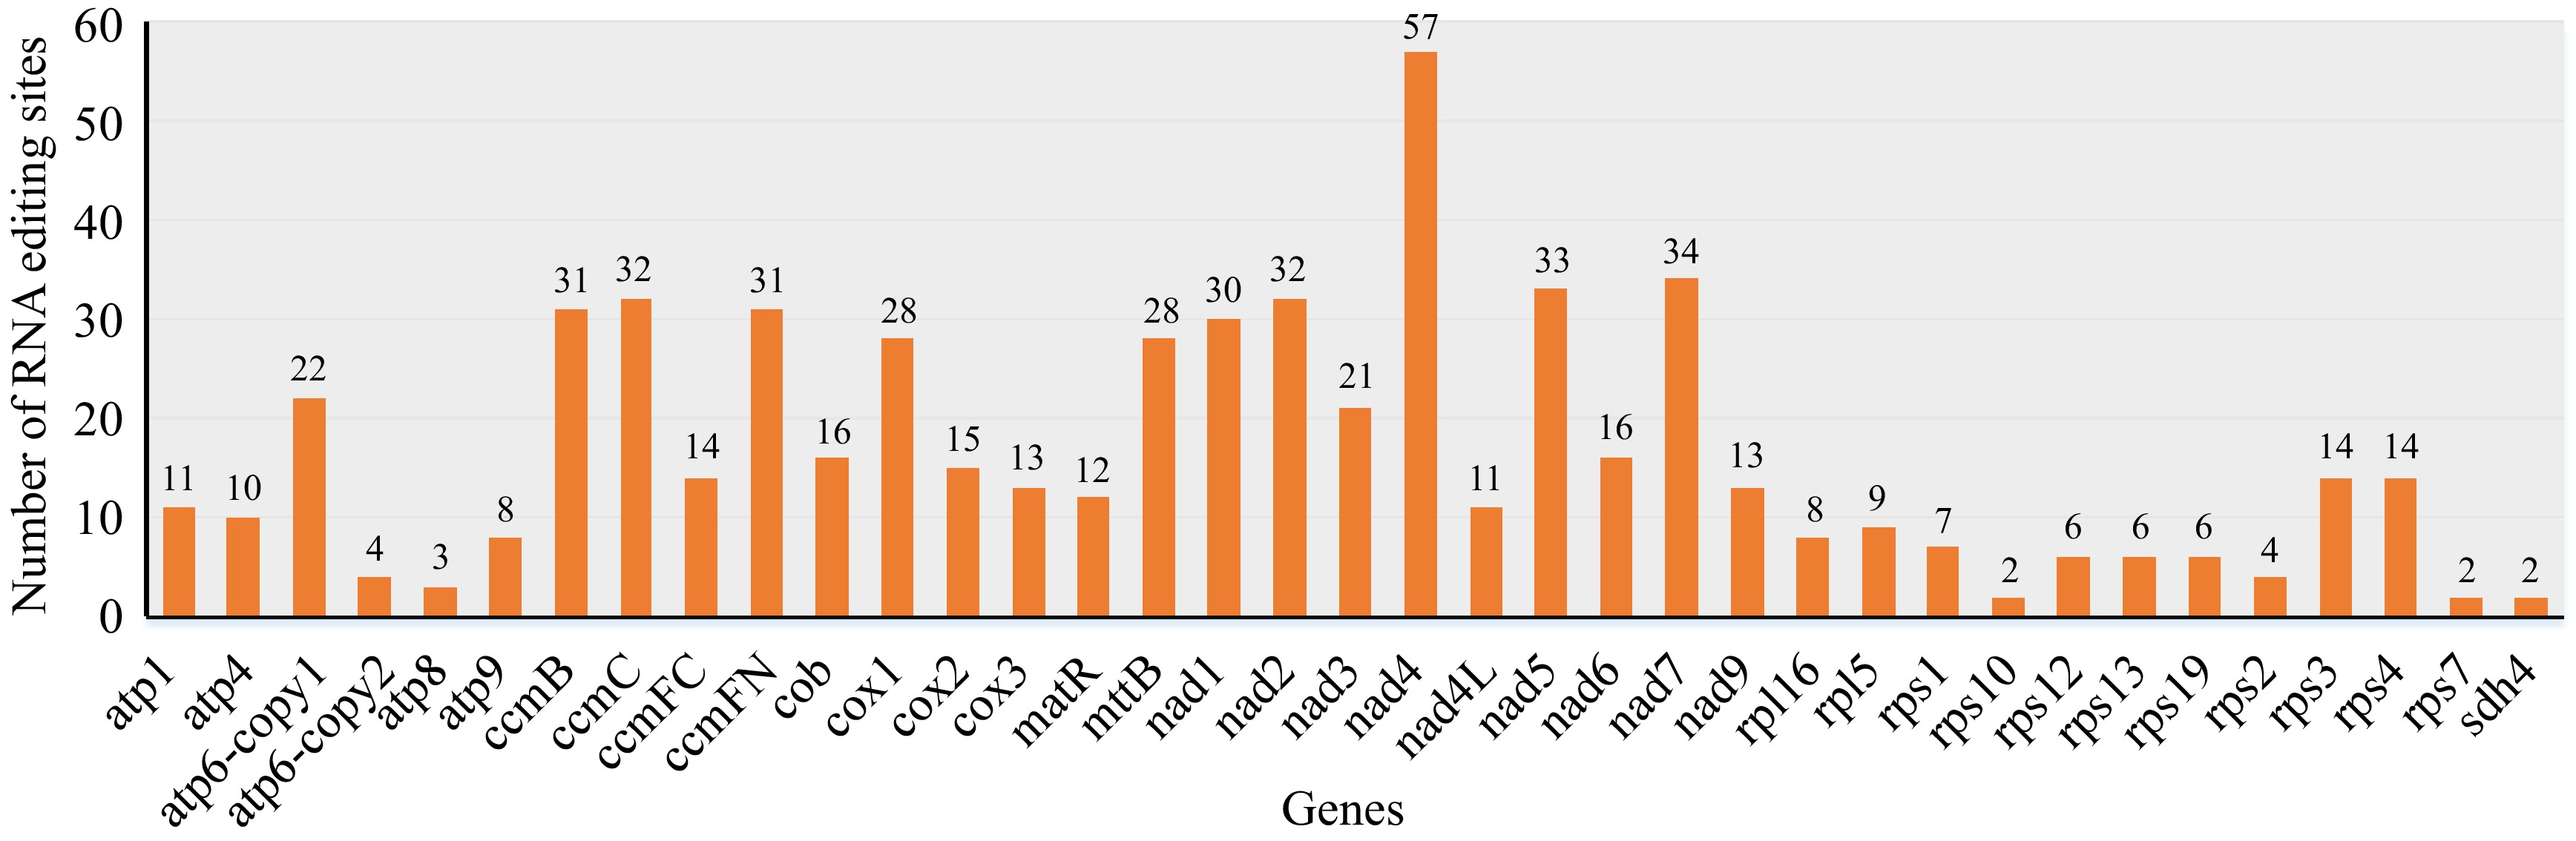
Figure 5.
Prediction of RNA editing sites in mitogenome of D. chrysotoxum. The horizontal and vertical coordinates indicate the gene name and the number of RNA edits, respectively.
-
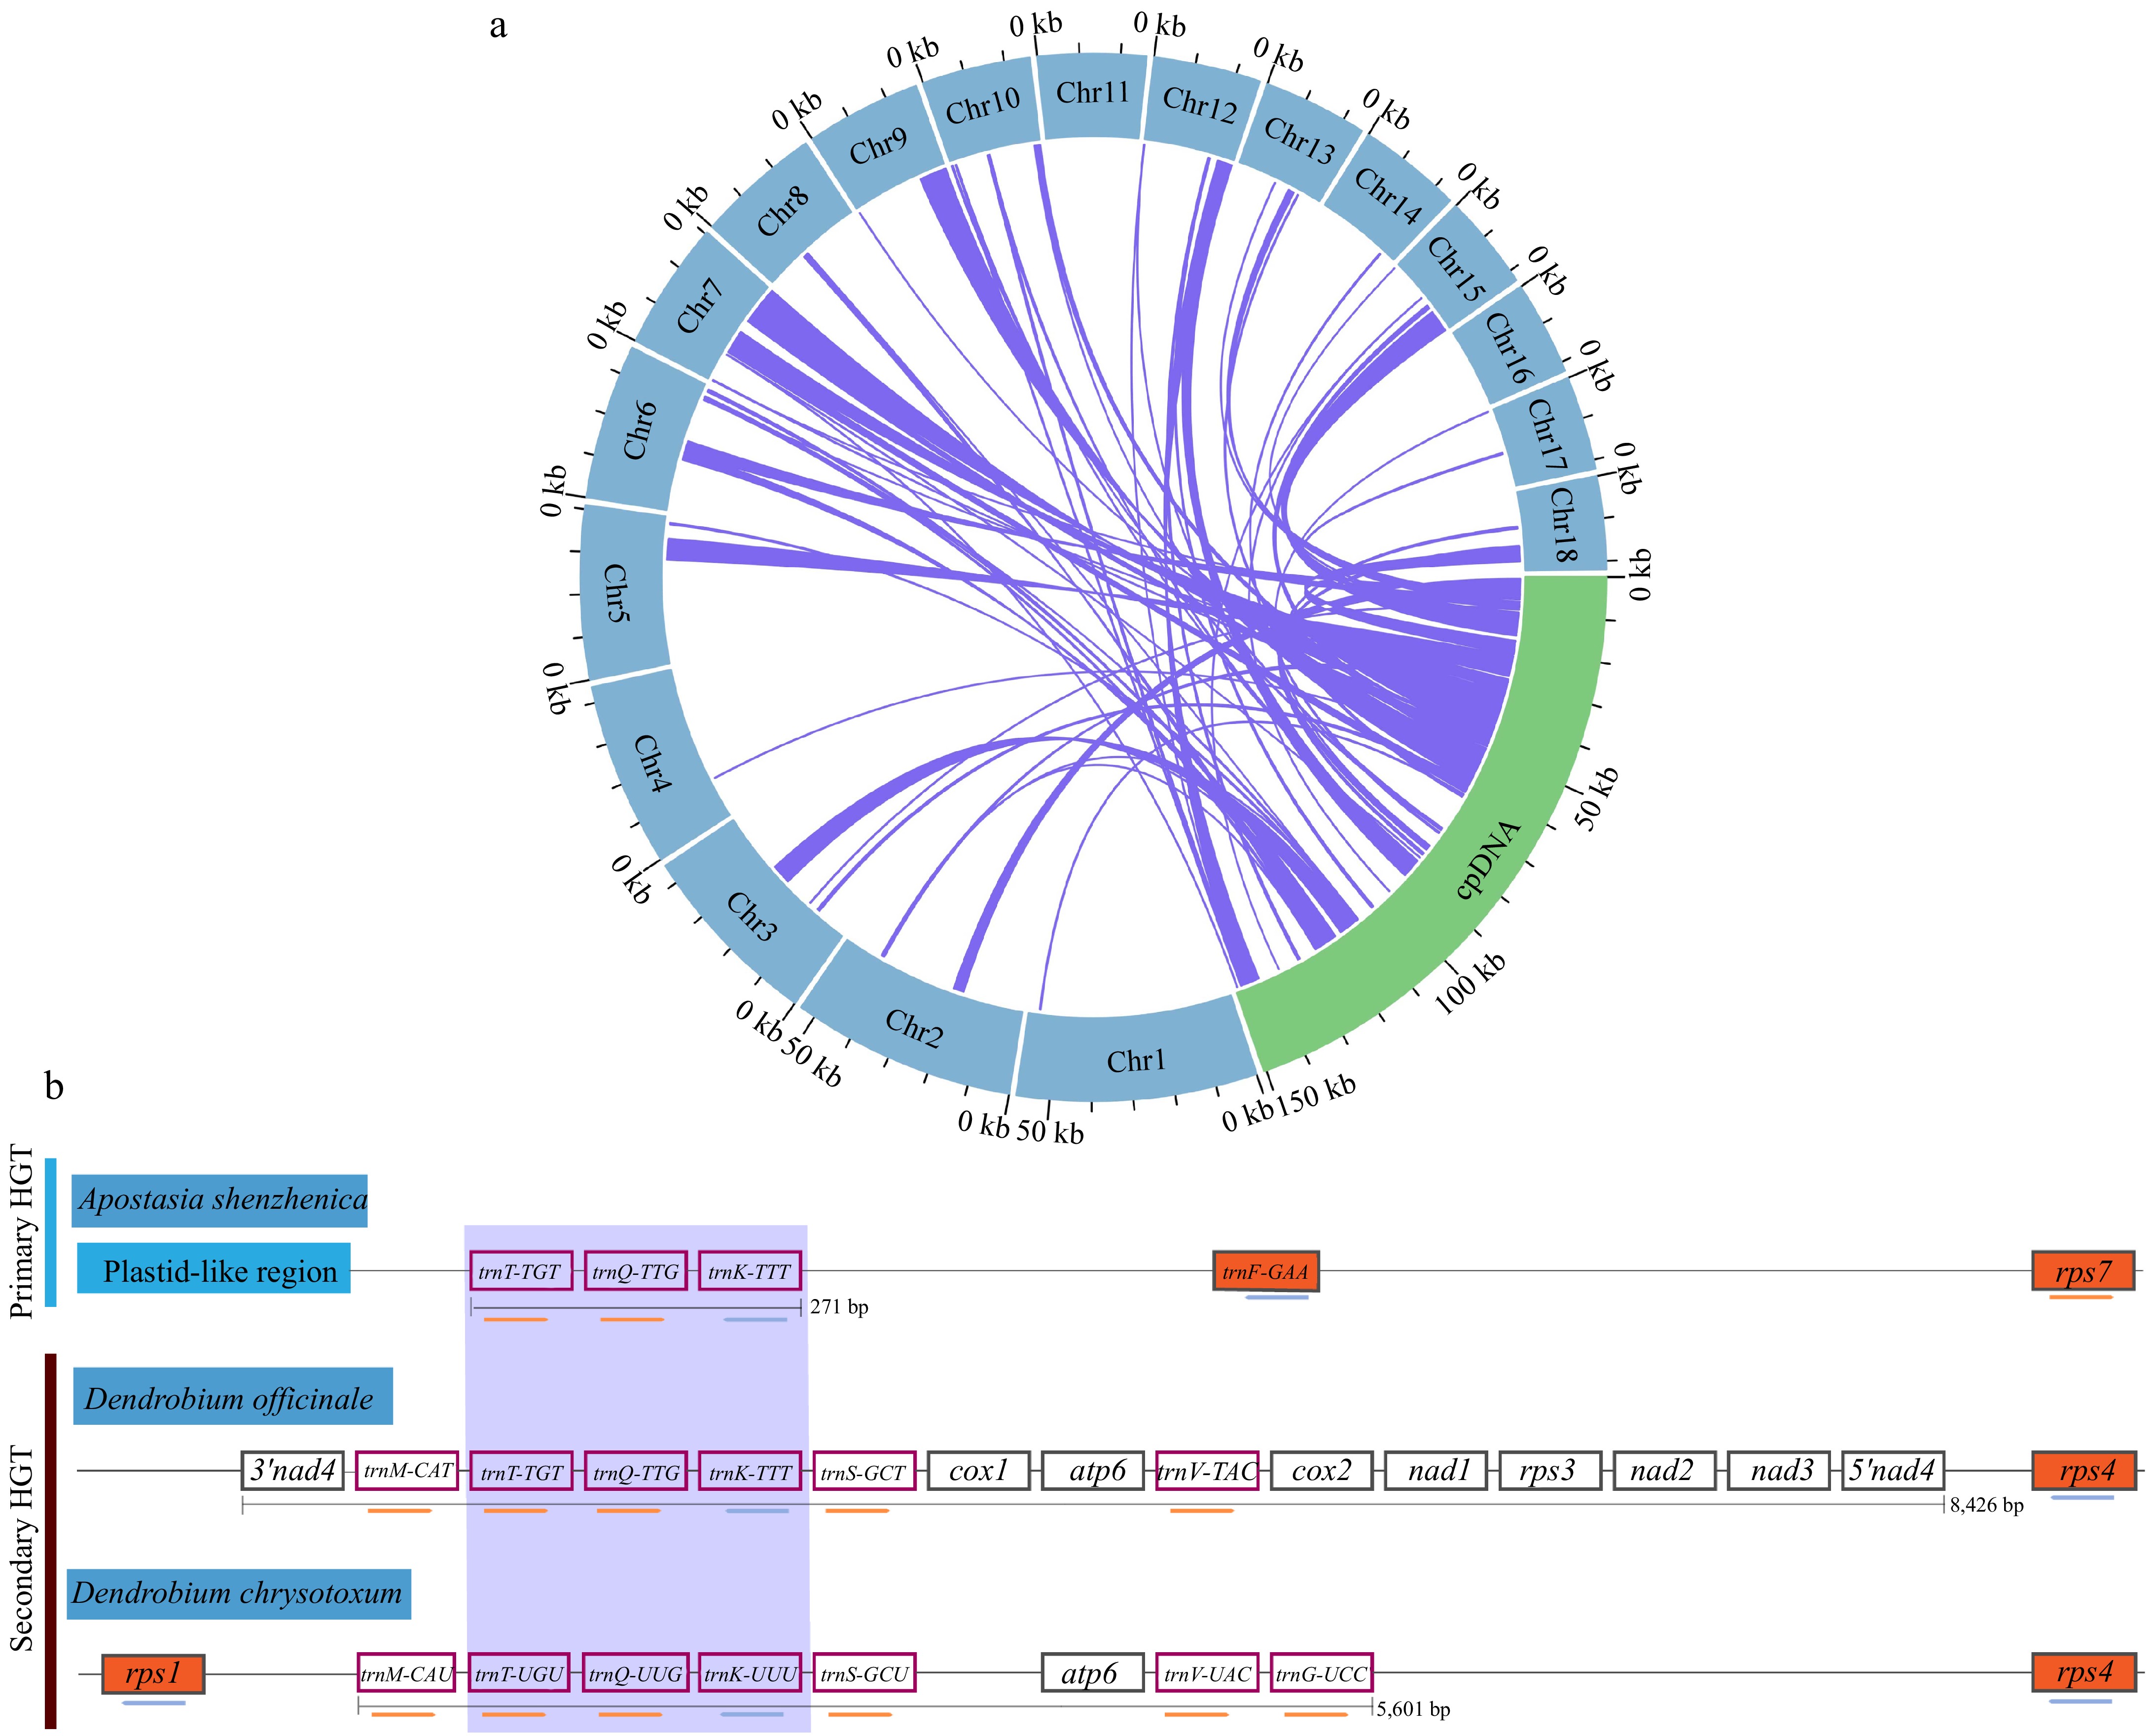
Figure 6.
The intracellular gene transfer and horizontal gene transfer from fungi in the mitogenome of D. chrysotoxum. (a) Gene transfer between the cpDNA and mitogenome of D. chrysotoxum. Blue represents the mitogenome, the green arc represents cpDNA, and the homologous fragments are indicated using the purple lines between the blue and green arcs. (b) Horizontal gene transfer from fungi in the mitogenome of D. chrysotoxum. The purple box highlights the transfer of RNA genes common to all HGTs in three orchids. Orchids plant mitochondrial genes, or nearby plastid-like mitogenomic sequence, is depicted in vermilion, while genes with white backgrounds represent genes of fungal origin, and the coral box represent transfer RNA. The maps are not drawn to scale.
-
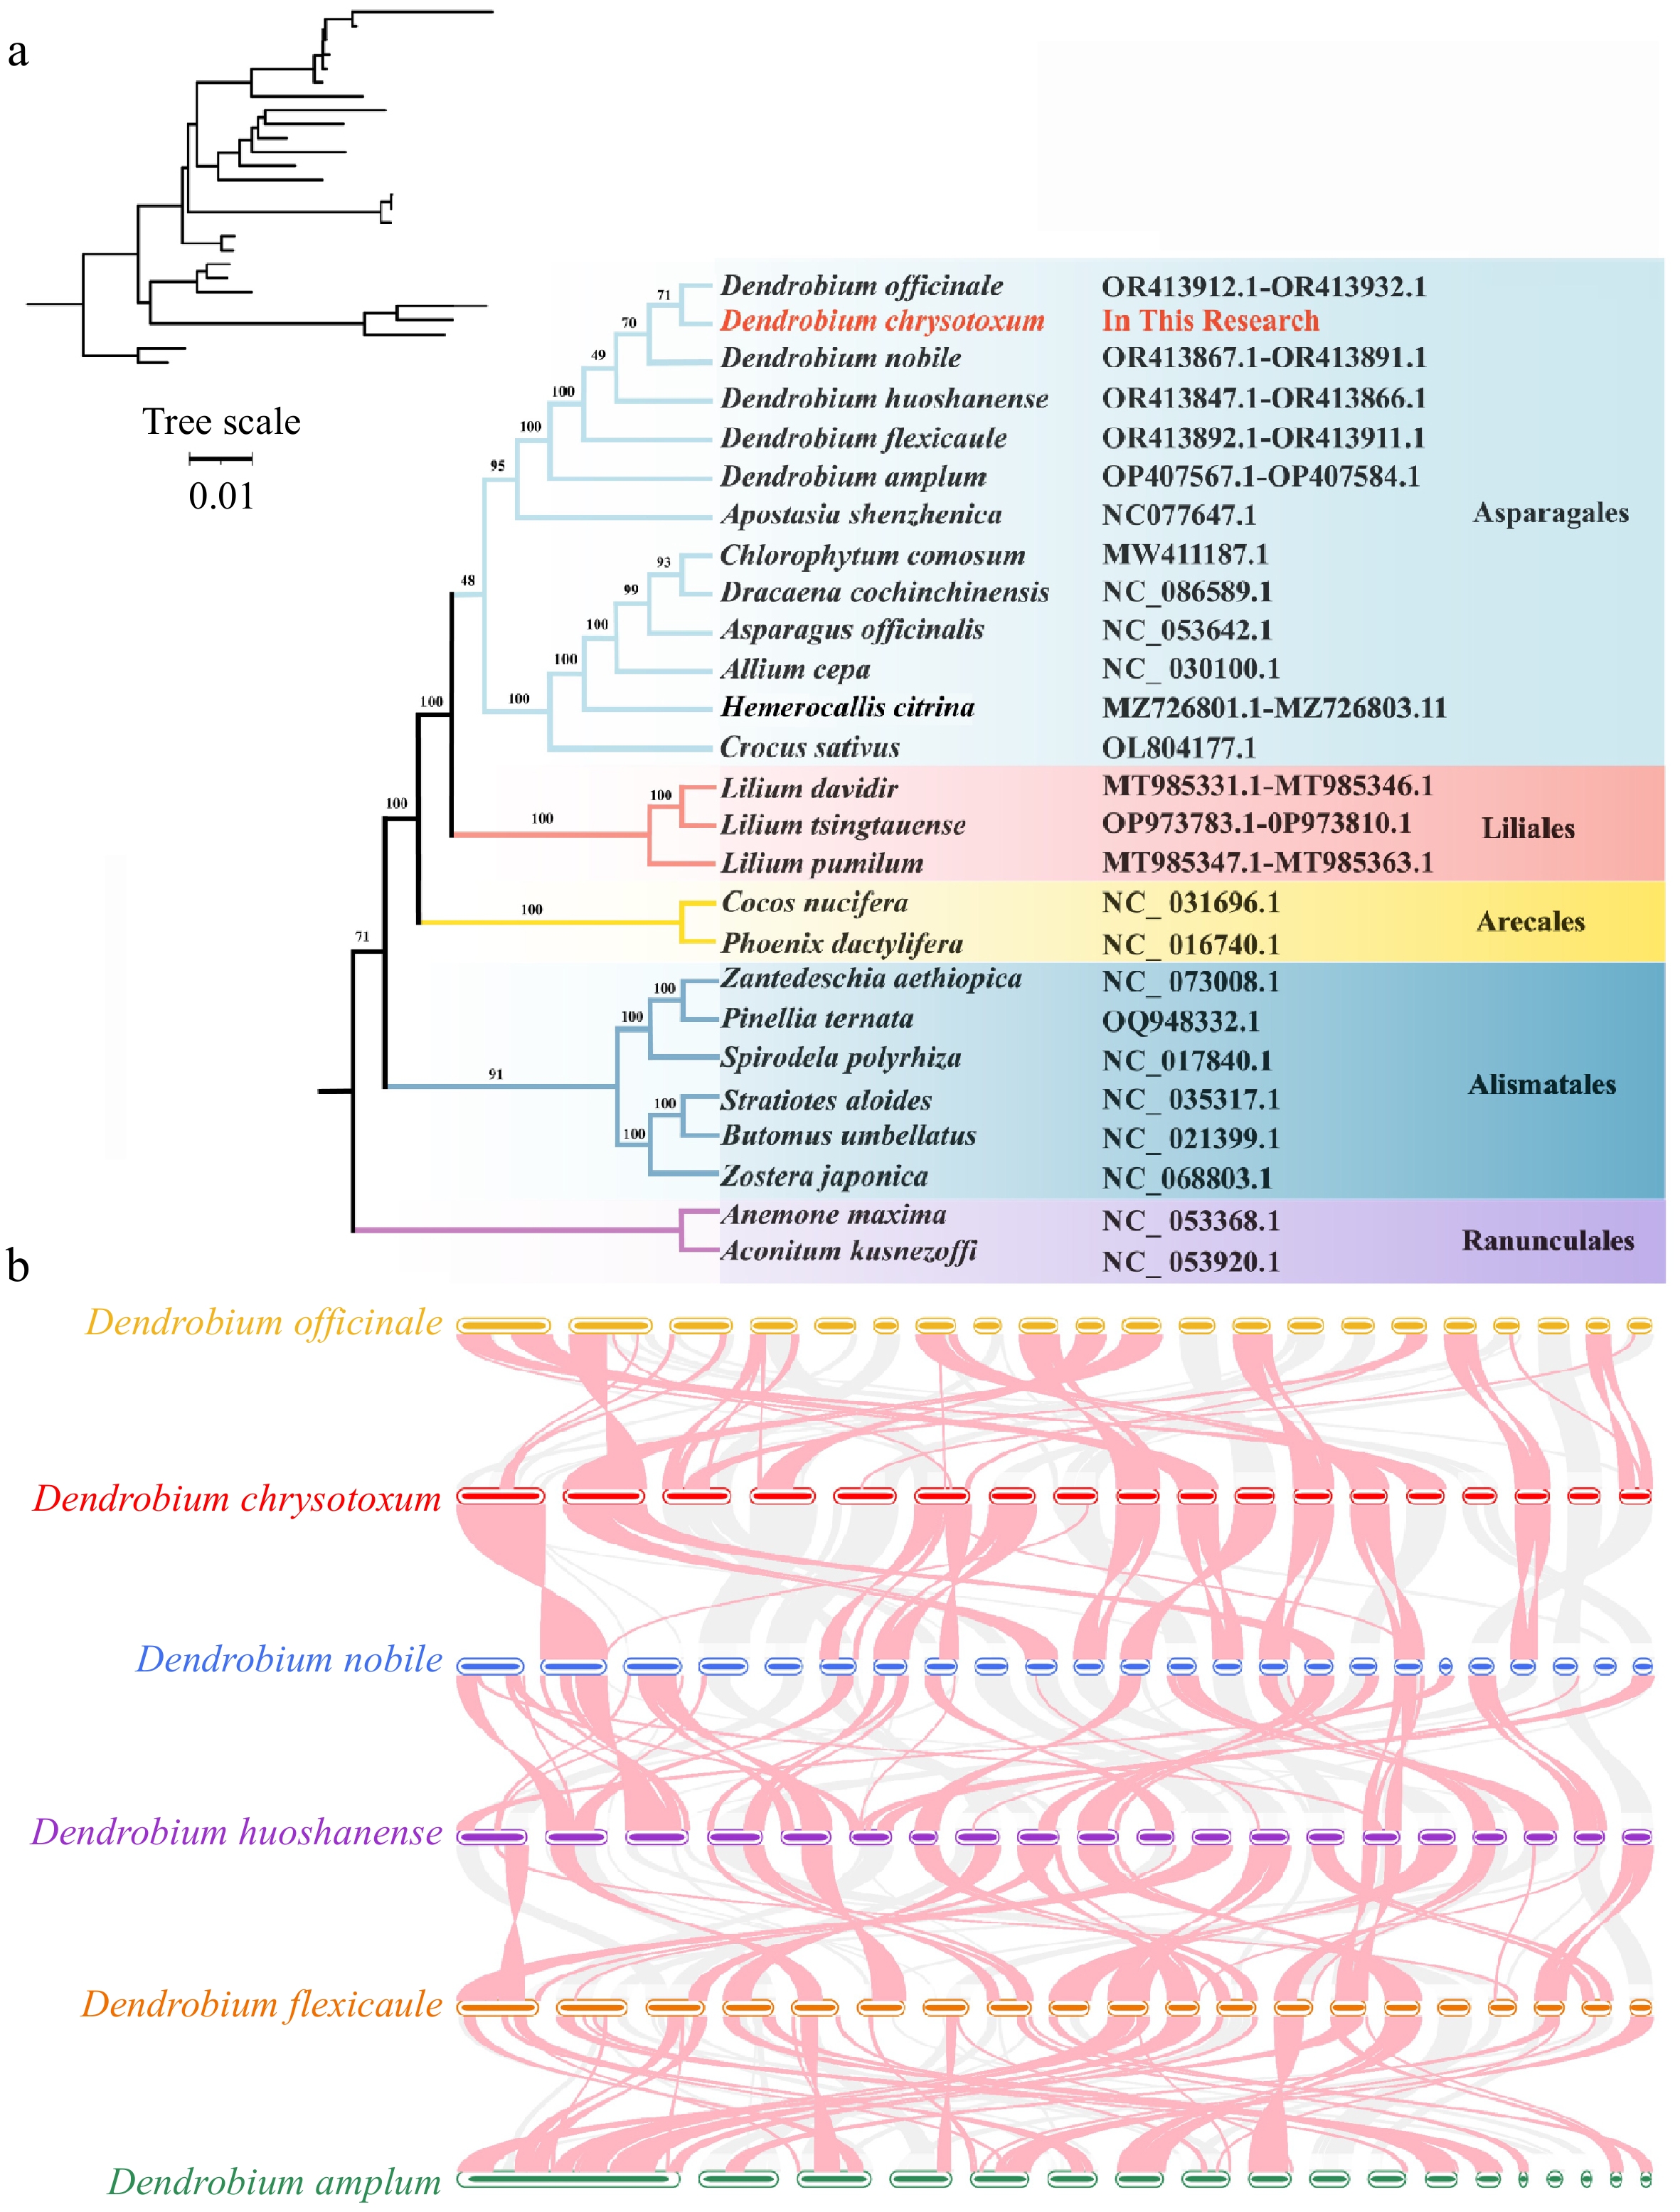
Figure 7.
Phylogenomic and collinear analysis of D. chrysotoxum. (a) Construction of the maximum likelihood (ML) tree based on the 26 species. (b) Collinear analysis of the mitogenome of six Dendrobium species. The red arcs indicate inverted regions, and the gray arcs indicate better homologous regions.
-
Group of genes Name of genes ATP synthase atp1, atp4, atp6 (×2), atp8, atp9 NADHdehydrogenase nad1, nad2, nad3, nad4, nad4L, nad5, nad6, nad7, nad9 Cytochrome b cob Cytochrome c biogenesis ccmB, ccmC, ccmFC, ccmFN Cytochrome c oxidase cox1, cox2, cox3 Maturases matR Protein transport subunit mttB Ribosomal protein large subunit rpl5, rpl16 Ribosomal protein small subunit rps1, rps2, rps3, rps4, rps7, rps10, rps12, rps13, rps14, rps19 Succinate dehydrogenase sdh4 Ribosome RNA rrn5, rrn18, rrn26 Transfer RNA trnC-GCA×2, trnD-GUC×2, trnE-UUC×2,
trnF-GAA, trnfM-CAU, trnG-GCC, trnG-UCC, trnH-GUG, trnI-CAU×2, trnK-UUU×3, trnL-UAG, trnM-CAU×2, trnN-GUU×3, trnQ-UUG×3,
trnR-ACG, trnR-UCU×2, trnS-GCU, trnS-GGA, trnT-GGU, trnT-UGU×2, trnV-GAC, trnV-UAC, trnY-GUA×2Table 1.
Gene contents of the mitogenome of D. chrysotoxum.
Figures
(7)
Tables
(1)