-
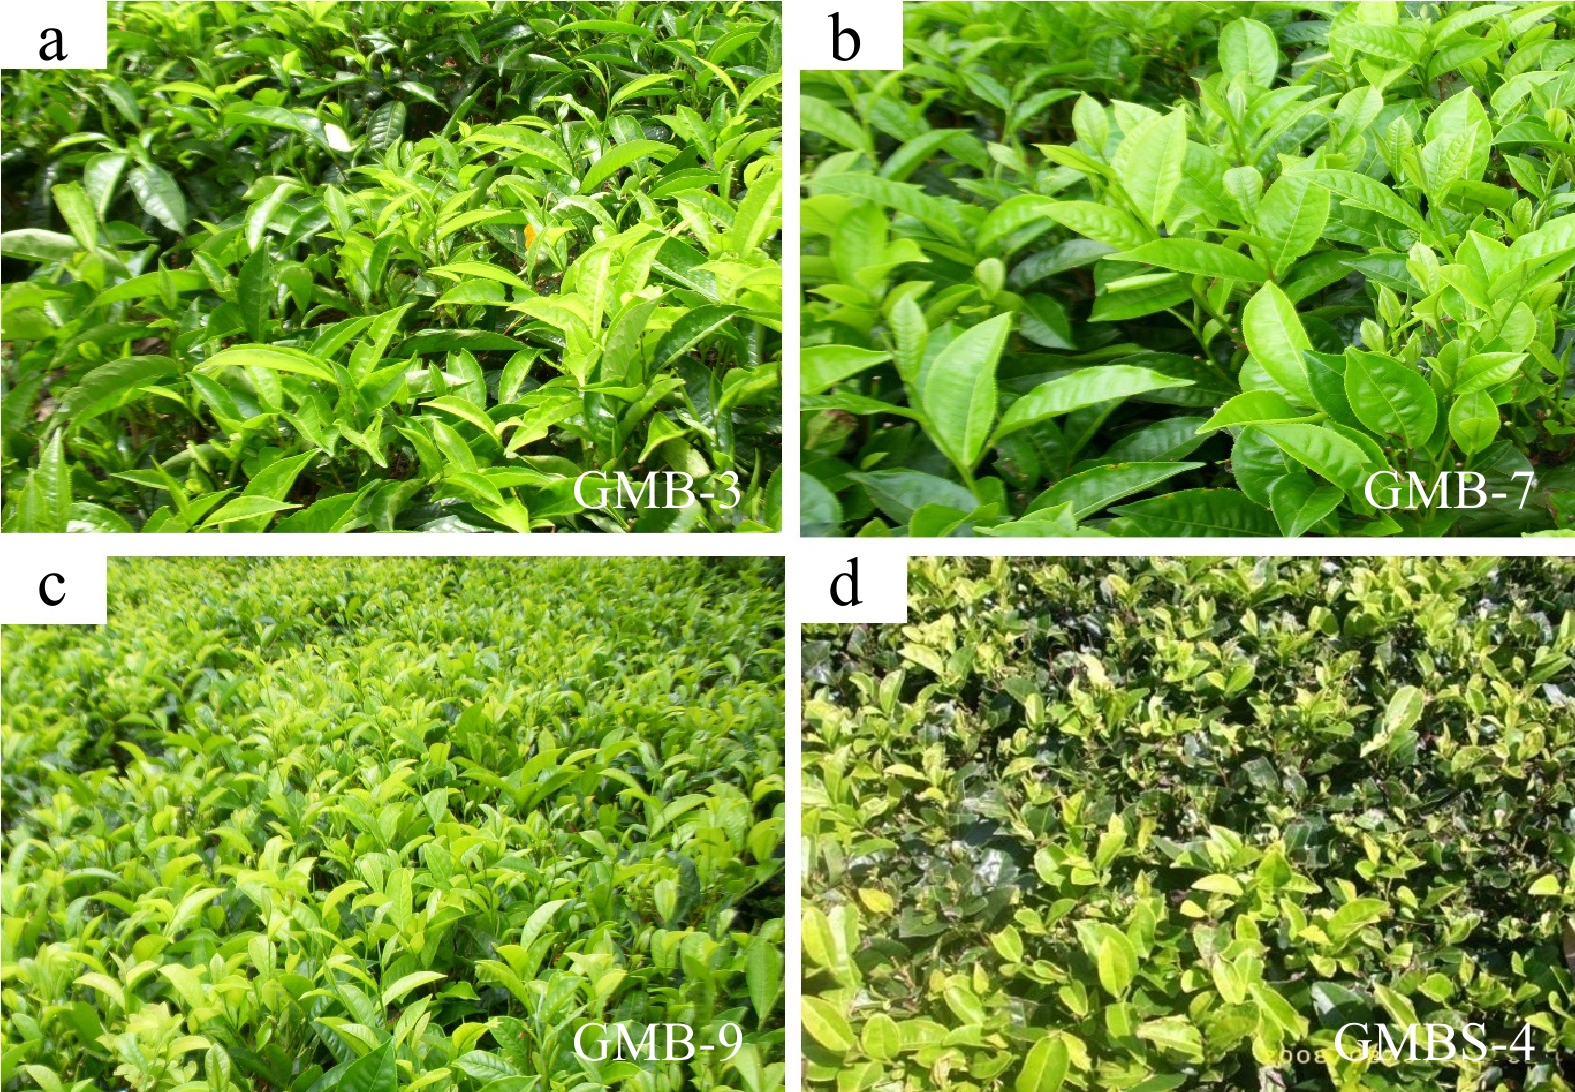
Figure 1.
Morphological differences among tea cultivars (a) 'GMB-3', (b) 'GMB-7', (c) 'GMB-9', and (d) 'GMBS-4'. This figure was reproduced with permission from Heri K. Syahrian and M. Khais Prayoga (affiliated with the Indonesia Research Institute for Tea and Cinchona).
-

Figure 2.
Scanning electron microscopy observation of Indonesian green tea powder from various tea cultivars at 200× magnification (code 1) and 1,000× magnification (code 2). (a) GTP from 'GMB-3'; (b) GTP from 'GMB-7'; (c) GTP from 'GMB-9'; and (d) GTP from 'GMBS-4' cultivars.
-
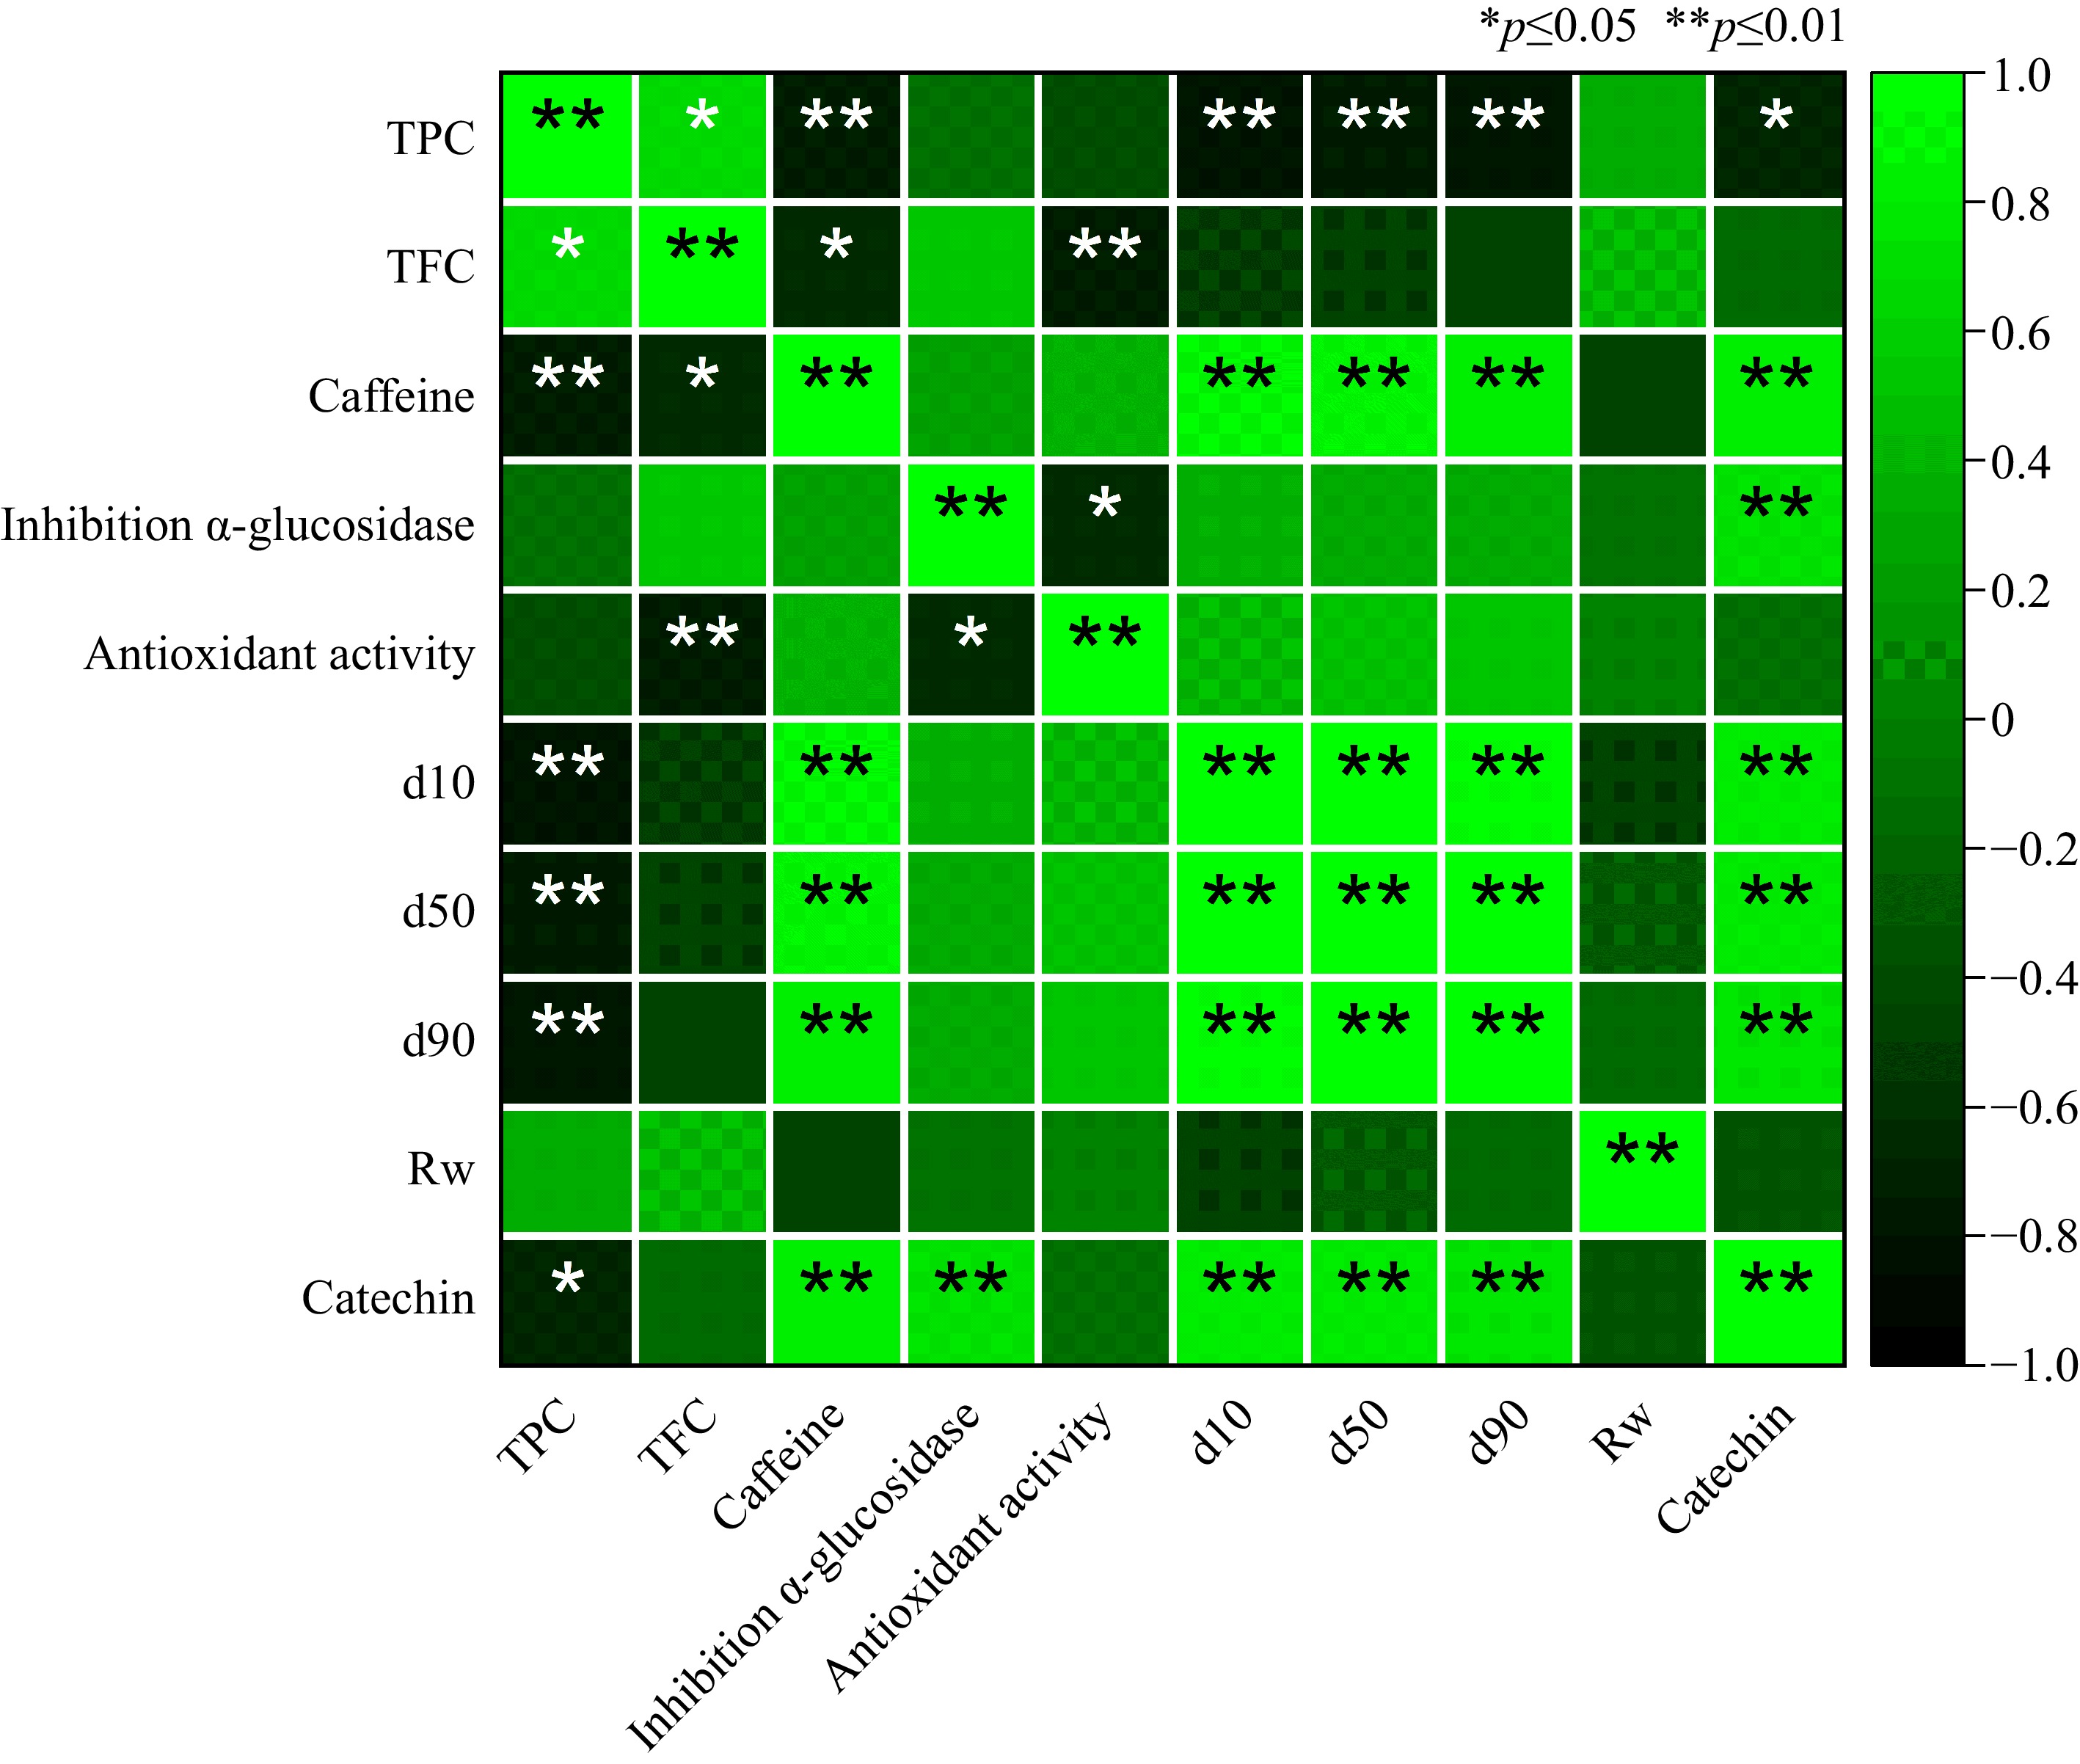
Figure 3.
Pearson correlation analysis of phytochemicals in green tea powder. Abbreviations: TPC, total polyphenol content; TFC, total flavonoid content; d10, d50, and d90 are 10, 50, and 90% of typical particle size distribution; Rw, relative width of particle size; IC50, antioxidant activity at 50% inhibition concentration; Inh. α-glucosidase, inhibition of α-glucosidase activity.
-
Parameters Tea cultivars 'GMB-3' 'GMB-7' 'GMB-9' 'GMBS-4' Particle size d10 (μm) 1.67 ± 0.03a 1.17 ± 0.02b 0.92 ± 0.03c 0.86 ± 0.02c d50 (μm) 1.97 ± 0.06a 1.34 ± 0.10b 1.11 ± 0.03c 1.03 ± 0.07c d90 (μm) 2.64 ± 0.17a 1.86 ± 0.12b 1.50 ± 0.19c 1.42 ± 0.10d Relative width (Rw) 0.49 ± 0.07a 0.51 ± 0.03a 0.52 ± 0.13a 0.53 ± 0.04a Color L Hunter 67.78 ± 0.56d 69.4 ± 0.36c 73.38 ± 0.21a 71.12 ± 0.28b a* −2.94 ± 0.03c −1.48 ± 0.02a −1.69 ± 0.04b −1.53 ± 0.02a b* 30.03 ± 0.25a 28.88 ± 0.09c 29.62 ± 0.07b 27.26 ± 0.06d Data are means ± S.E. from the triplicate analysis. d10, d50, and d90 represent 10%, 50%, and 90% of the typical particle size distribution. L* value (brightness), a* value (redness), and b* values (yellowness). Different letters (a−d) within a row indicate significantly different values (p < 0.05). Table 1.
Particle size and color of Indonesian green tea powder produced from various tea cultivars.
-
Parameters Tea cultivars 'GMB-3' 'GMB-7' 'GMB-9' 'GMBS-4' Moisture contents (%, d.b.) 4.27 ± 0.08a 3.58 ± 0.05b 3.36 ± 0.04bc 3.26 ± 0.10c Total polyphenols (mg GAE/g) 244.57 ± 6.80b 276.09 ± 1.54a 273.09 ± 8.18a 277.91 ± 3.12a Total flavonoid (mg QE/g) 156.85 ± 3.13b 208.33 ± 6.02a 164.26 ± 6.15b 223.52 ± 8.00a Caffeine (%. d.b.) 3.58 ± 0.12a 2.33 ± 0.09b 2.50 ± 0.02b 2.37 ± 0.06b Total catechin (%) 4.39 ± 0.03a 3.21 ± 0.01d 2.81 ± 0.05b 3.60 ± 0.07c Data are means ± S.E. from the triplicate analysis. Different letters (a−d) within a row indicate significantly different values (p < 0.05). Table 2.
Bioactive compounds in Indonesian green tea powder from various tea cultivars.
-
Tea cultivars Antioxidant
activity (IC50, mg/L)Inhibition
α-glucosidase* (%)'GMB-3' 16.41 ± 0.48ab 40.93 ± 0.08b 'GMB-7' 15.41 ± 0.23b 39.48 ± 0.16c 'GMB-9' 17.32 ± 0.49a 30.76 ± 0.16d 'GMBS-4' 12.27 ± 0.29c 42.54 ± 0.21a Acarbose** − 87.57 ± 0.38 Data are means ± S.E. from the triplicate analysis. Different letters (a−d) within a column indicate significantly different values (p < 0.05). * Measured at a concentration of 500 μg/mL. ** Inhibition of α-glucosidase activity measured at a 5 μg/mL concentration. Table 3.
Antioxidant and α-glucosidase inhibitory activity of Indonesian green tea powder from various tea cultivars.
-
Source DF TPC
(mg/g)TFC
(mg/g)Caffeine
(%)Inhibition of
α-glucosidase (%)Antioxidant activity
(IC50, mg/L)Catechin
(%)d10
(μm)d50
(μm)d90
(μm)Rw 1 75.54 79.03 0.001878 0.0531 5.7615* 0.00703* 0.003873 0.097606* 0.52956* Cultivars 3 671.24* 2637.78* 0.792153* 81.8692* 16.5338* 1.20196* 0.298532* 0.50452* 1.06104* Error 7 96.640 115.390 0.023 0.080 0.039 0.000 0.002 0.004 0.004 R² 0.772 0.923 0.953 0.998 0.995 0.9997 0.989 0.984 0.991 DF, degrees of freedom; TPC, total polyphenol content; TFC, Total flavonoid content; Rw, Relative width of particle size; and IC50, 50% antioxidant activity at inhibition concentration; * significant at p < 0.05. Table 4.
Mean square summary of covariance (ANCOVA) analysis with relative width (Rw) as a covariate for green tea powder parameters.
Figures
(3)
Tables
(4)