-
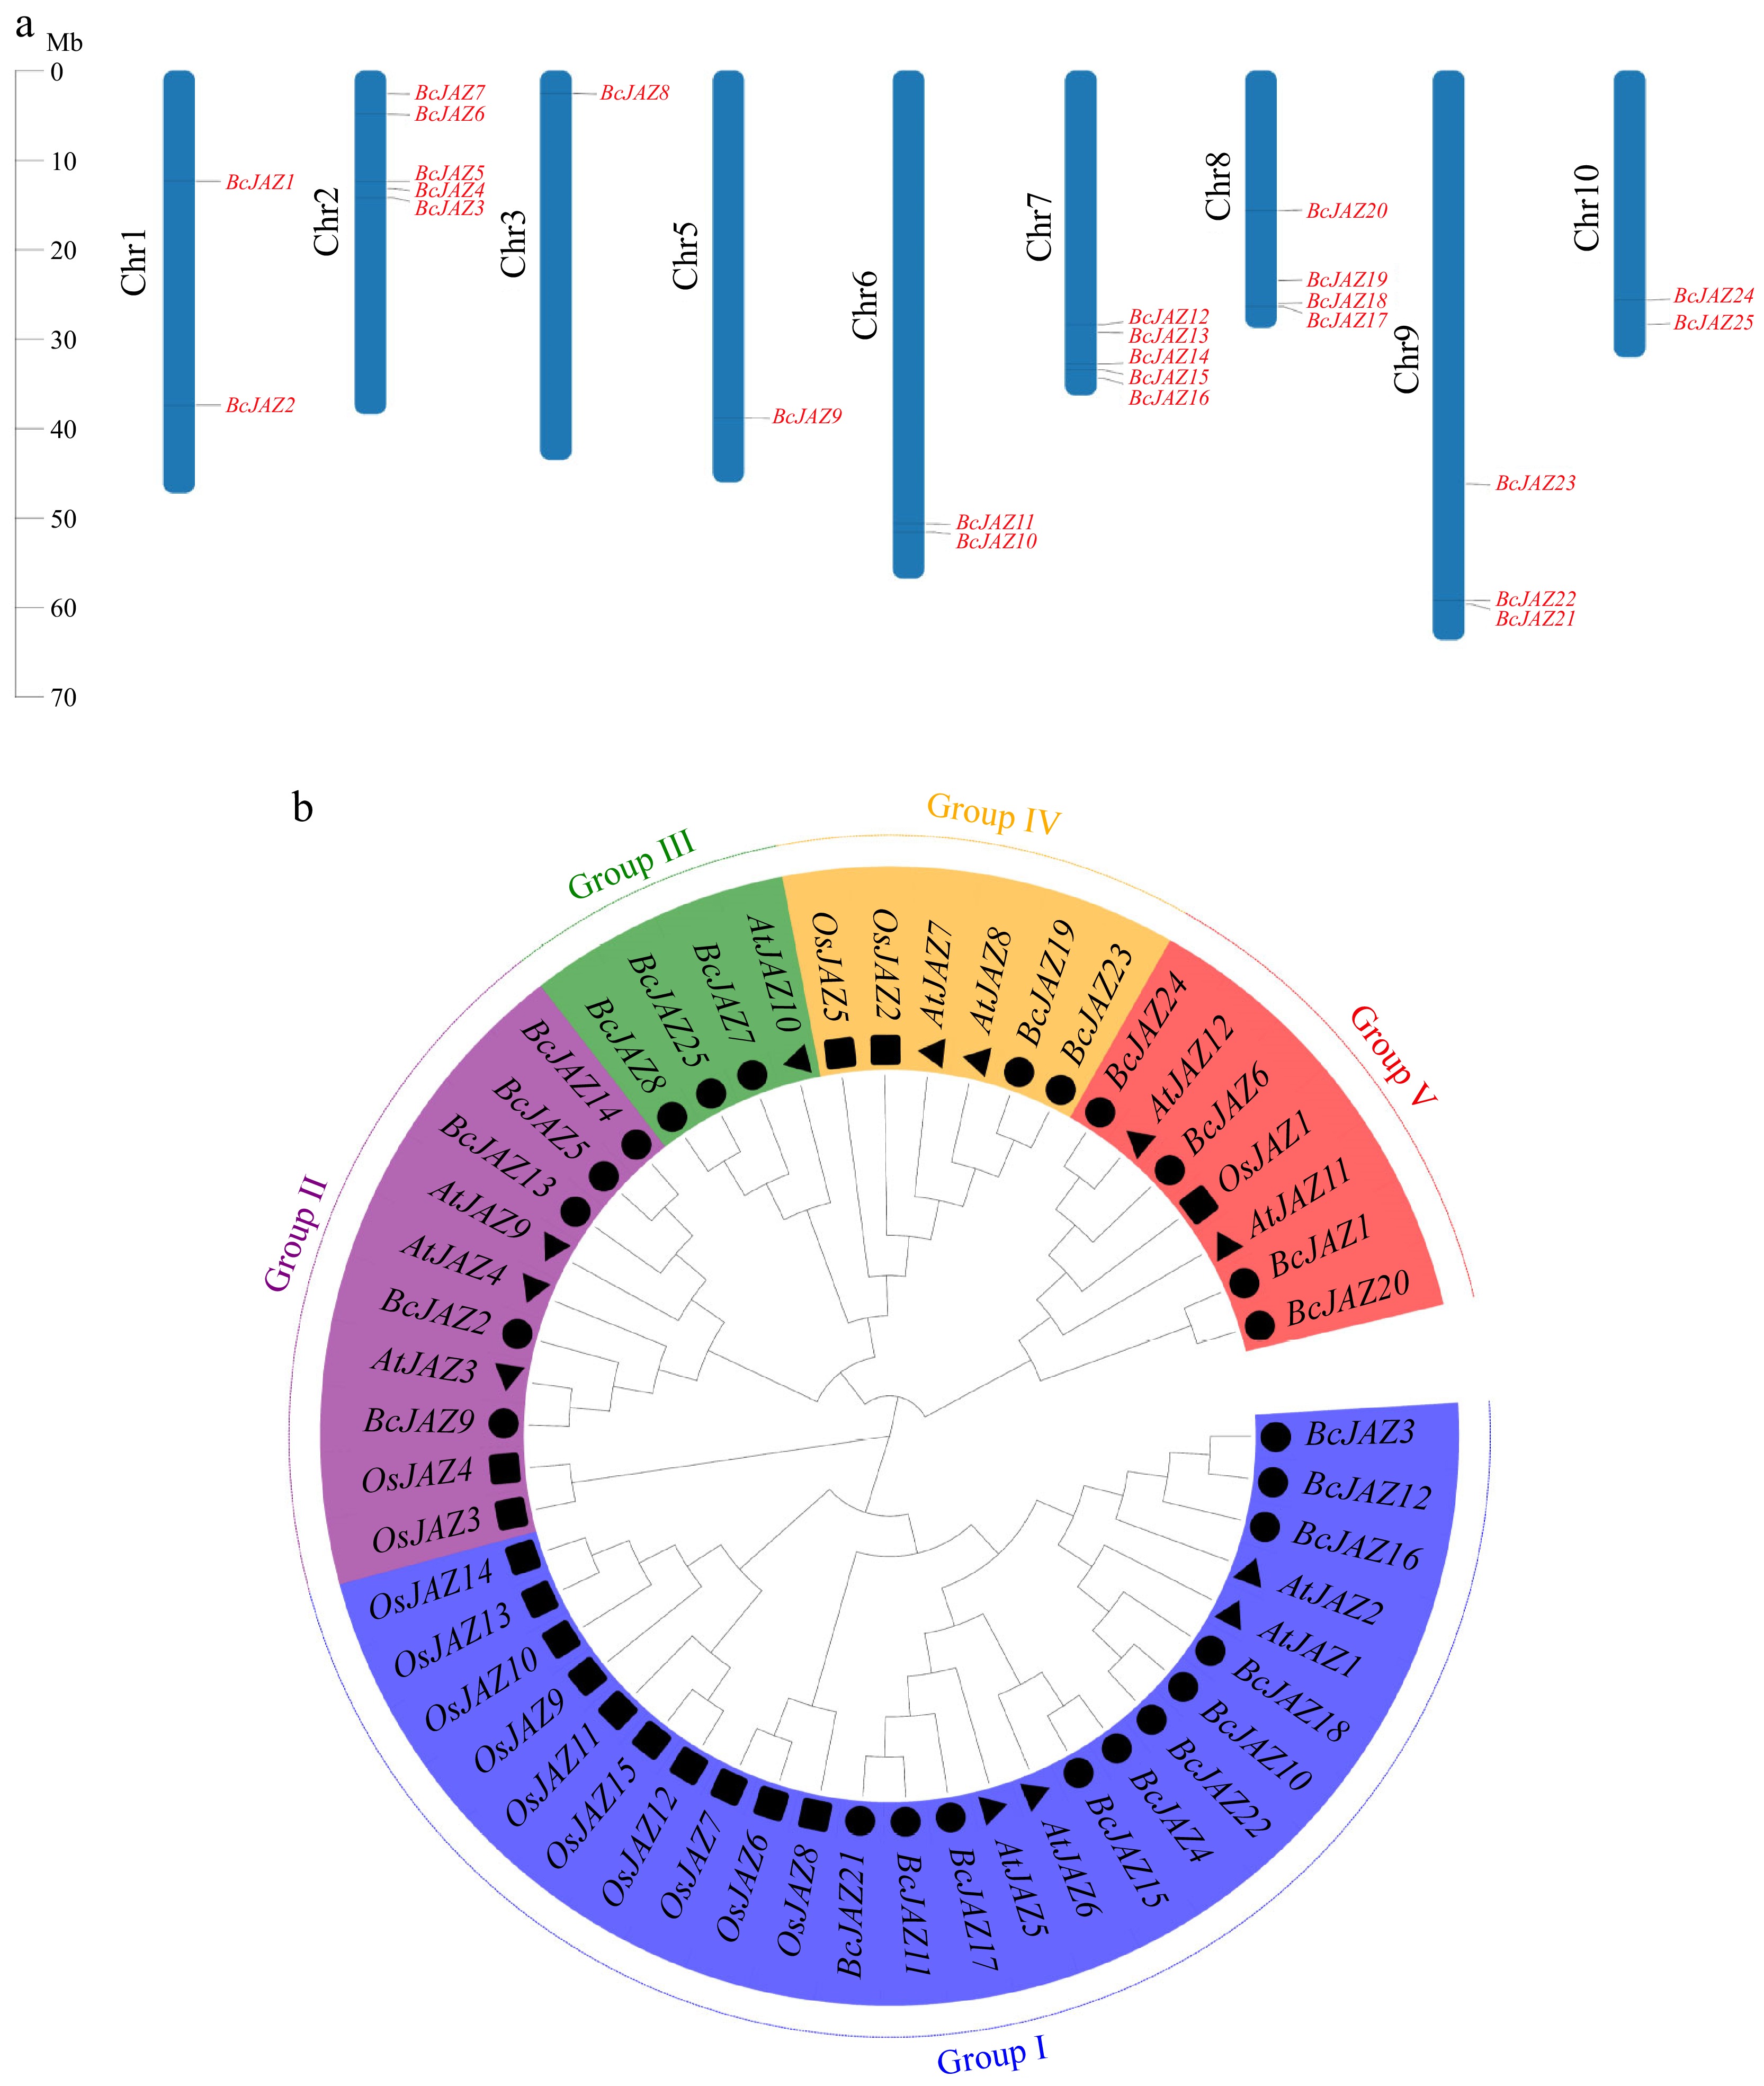
Figure 1.
Chromosomal mapping and phylogenetic tree of BcJAZ gene family. (a) Chromosomal mapping of BcJAZ family members. (b) Phylogenetic tree of NHCC, Arabidopsis, and rice. Subfamilies I, II, III, IV, and V were indicated by different colors. The black circles represent the 25 BcJAZs in NHCC. The black triangles represent the 12 AtJAZs in Arabidopsis. The black squares represent the 15 OsJAZs in rice.
-
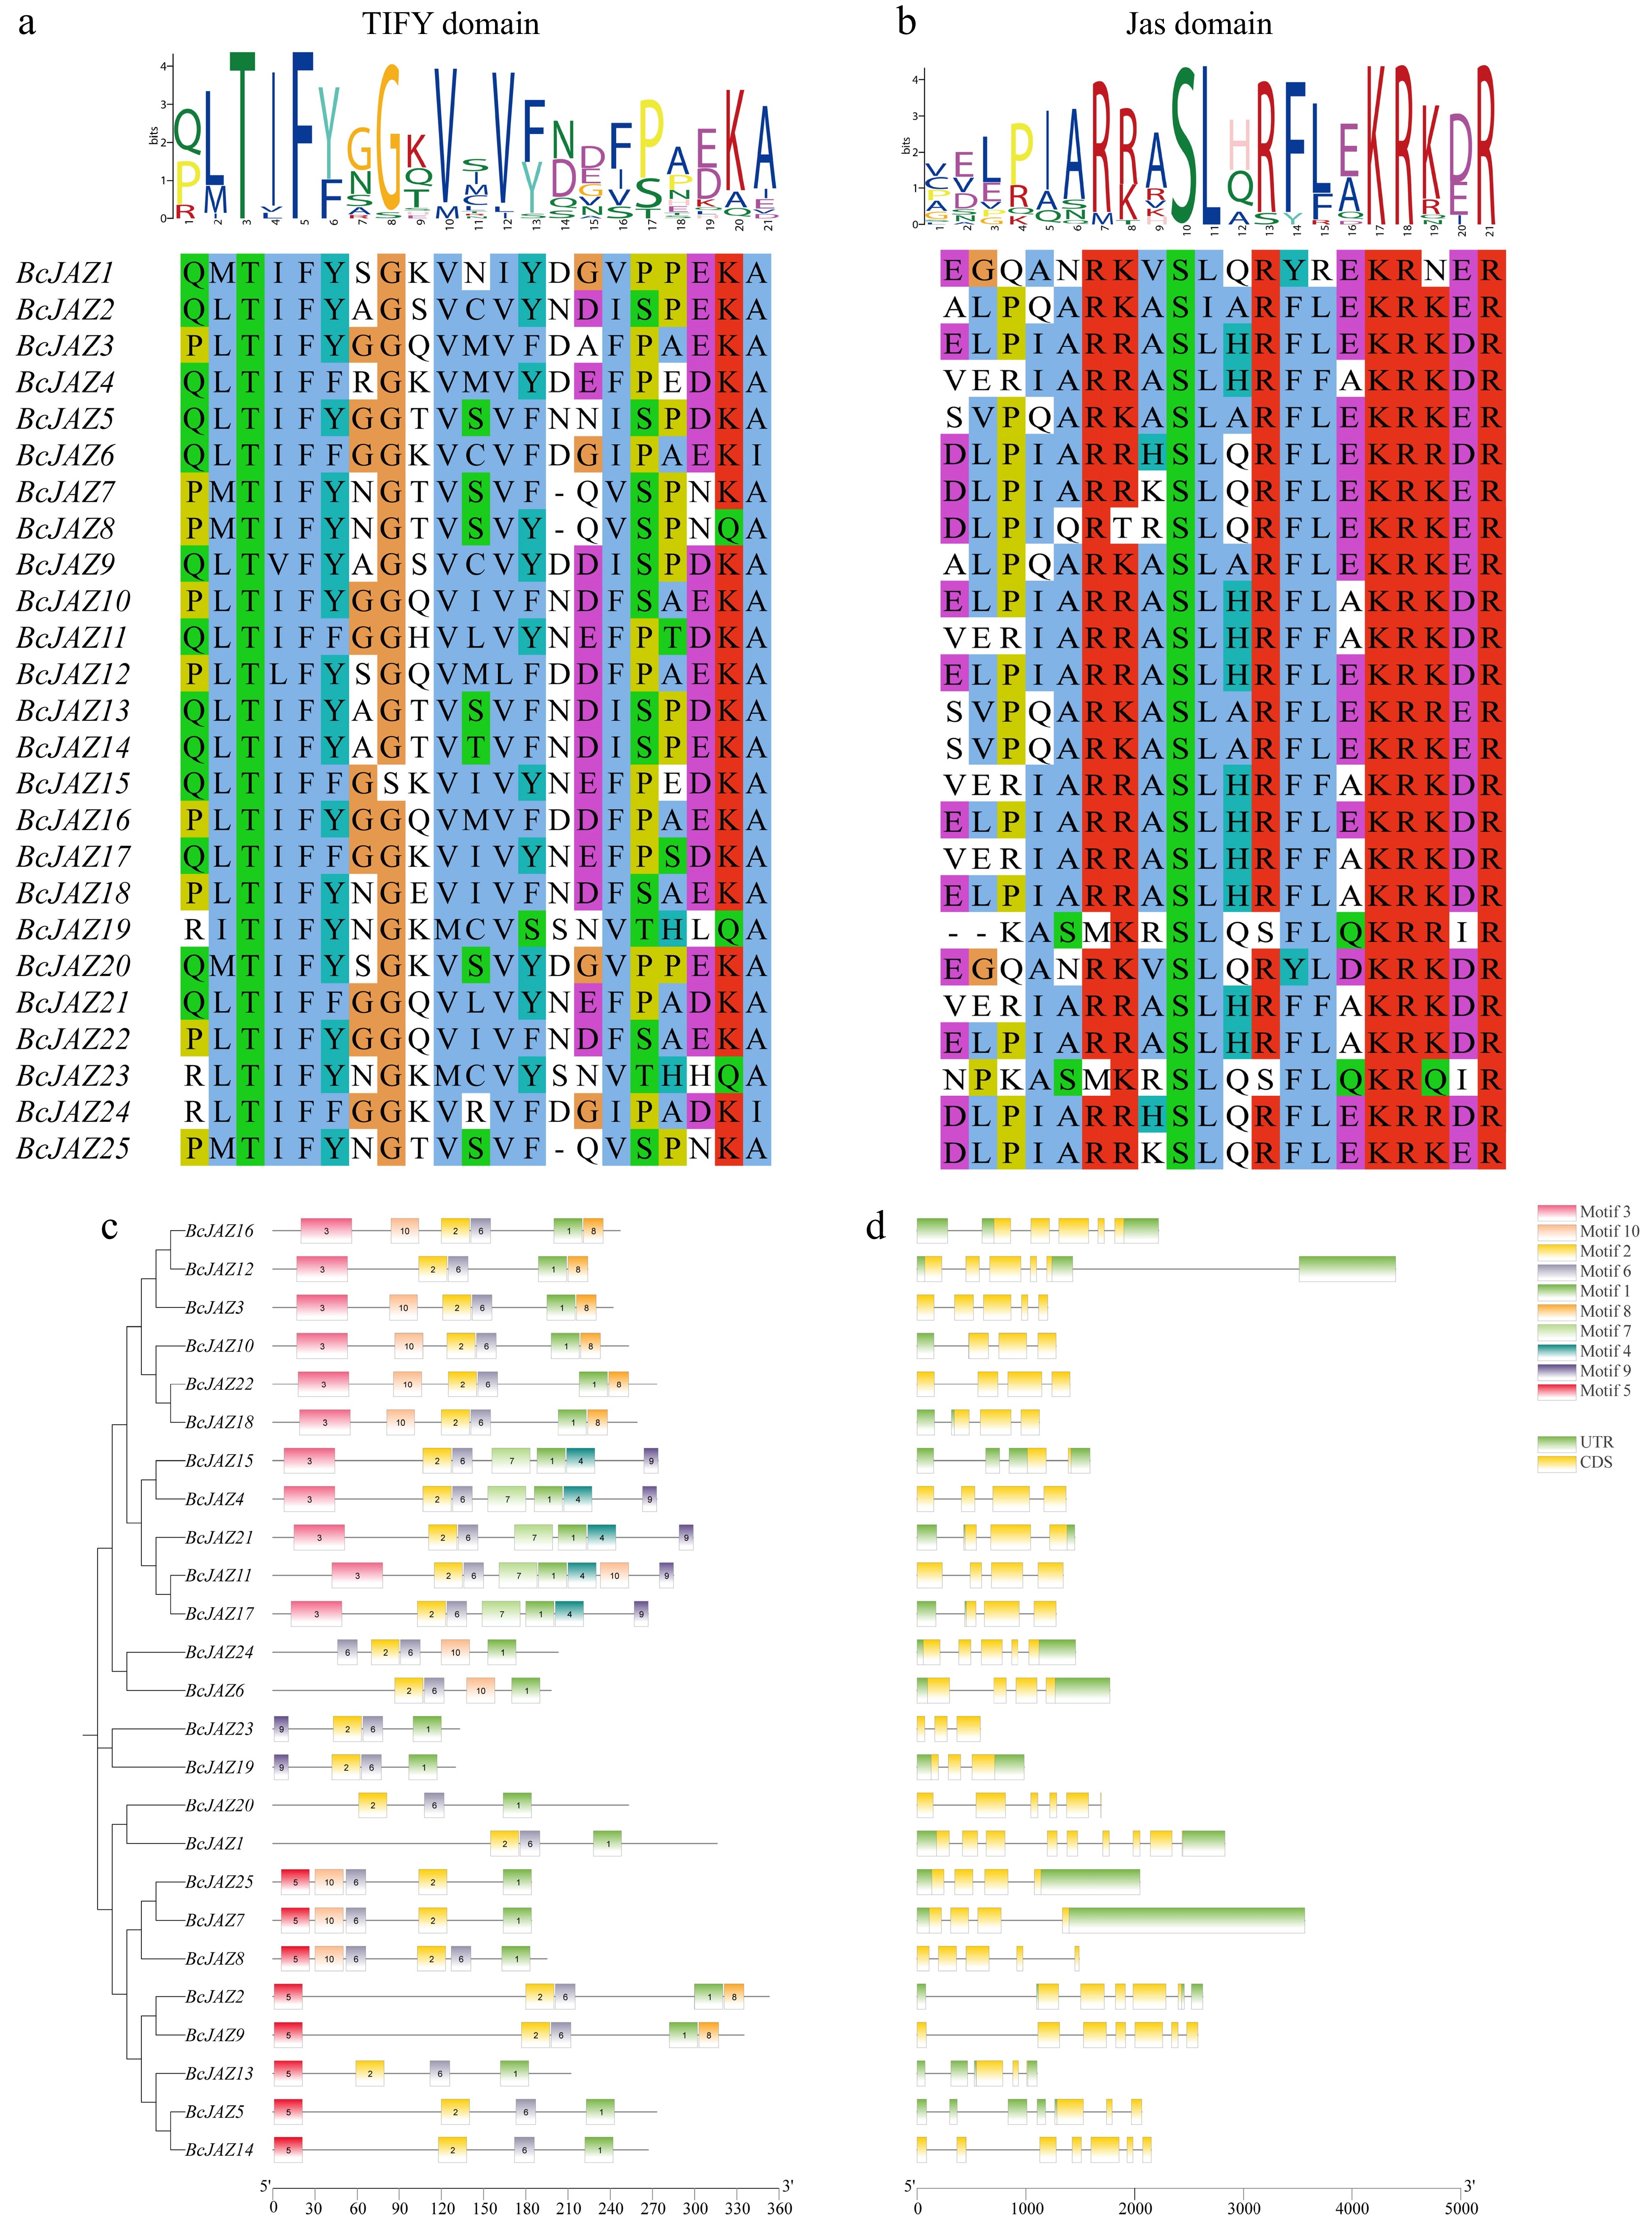
Figure 2.
Multiple sequence alignment, motifs and gene structure of BcJAZ genes. (a), (b) Multiple sequence alignment and conserved domains of BcJAZ. (c) Conserved motifs of BcJAZs. (d) The gene structure of BcJAZs; CDS are represented by yellow boxes, introns by grey lines, and UTRs by green boxes.
-
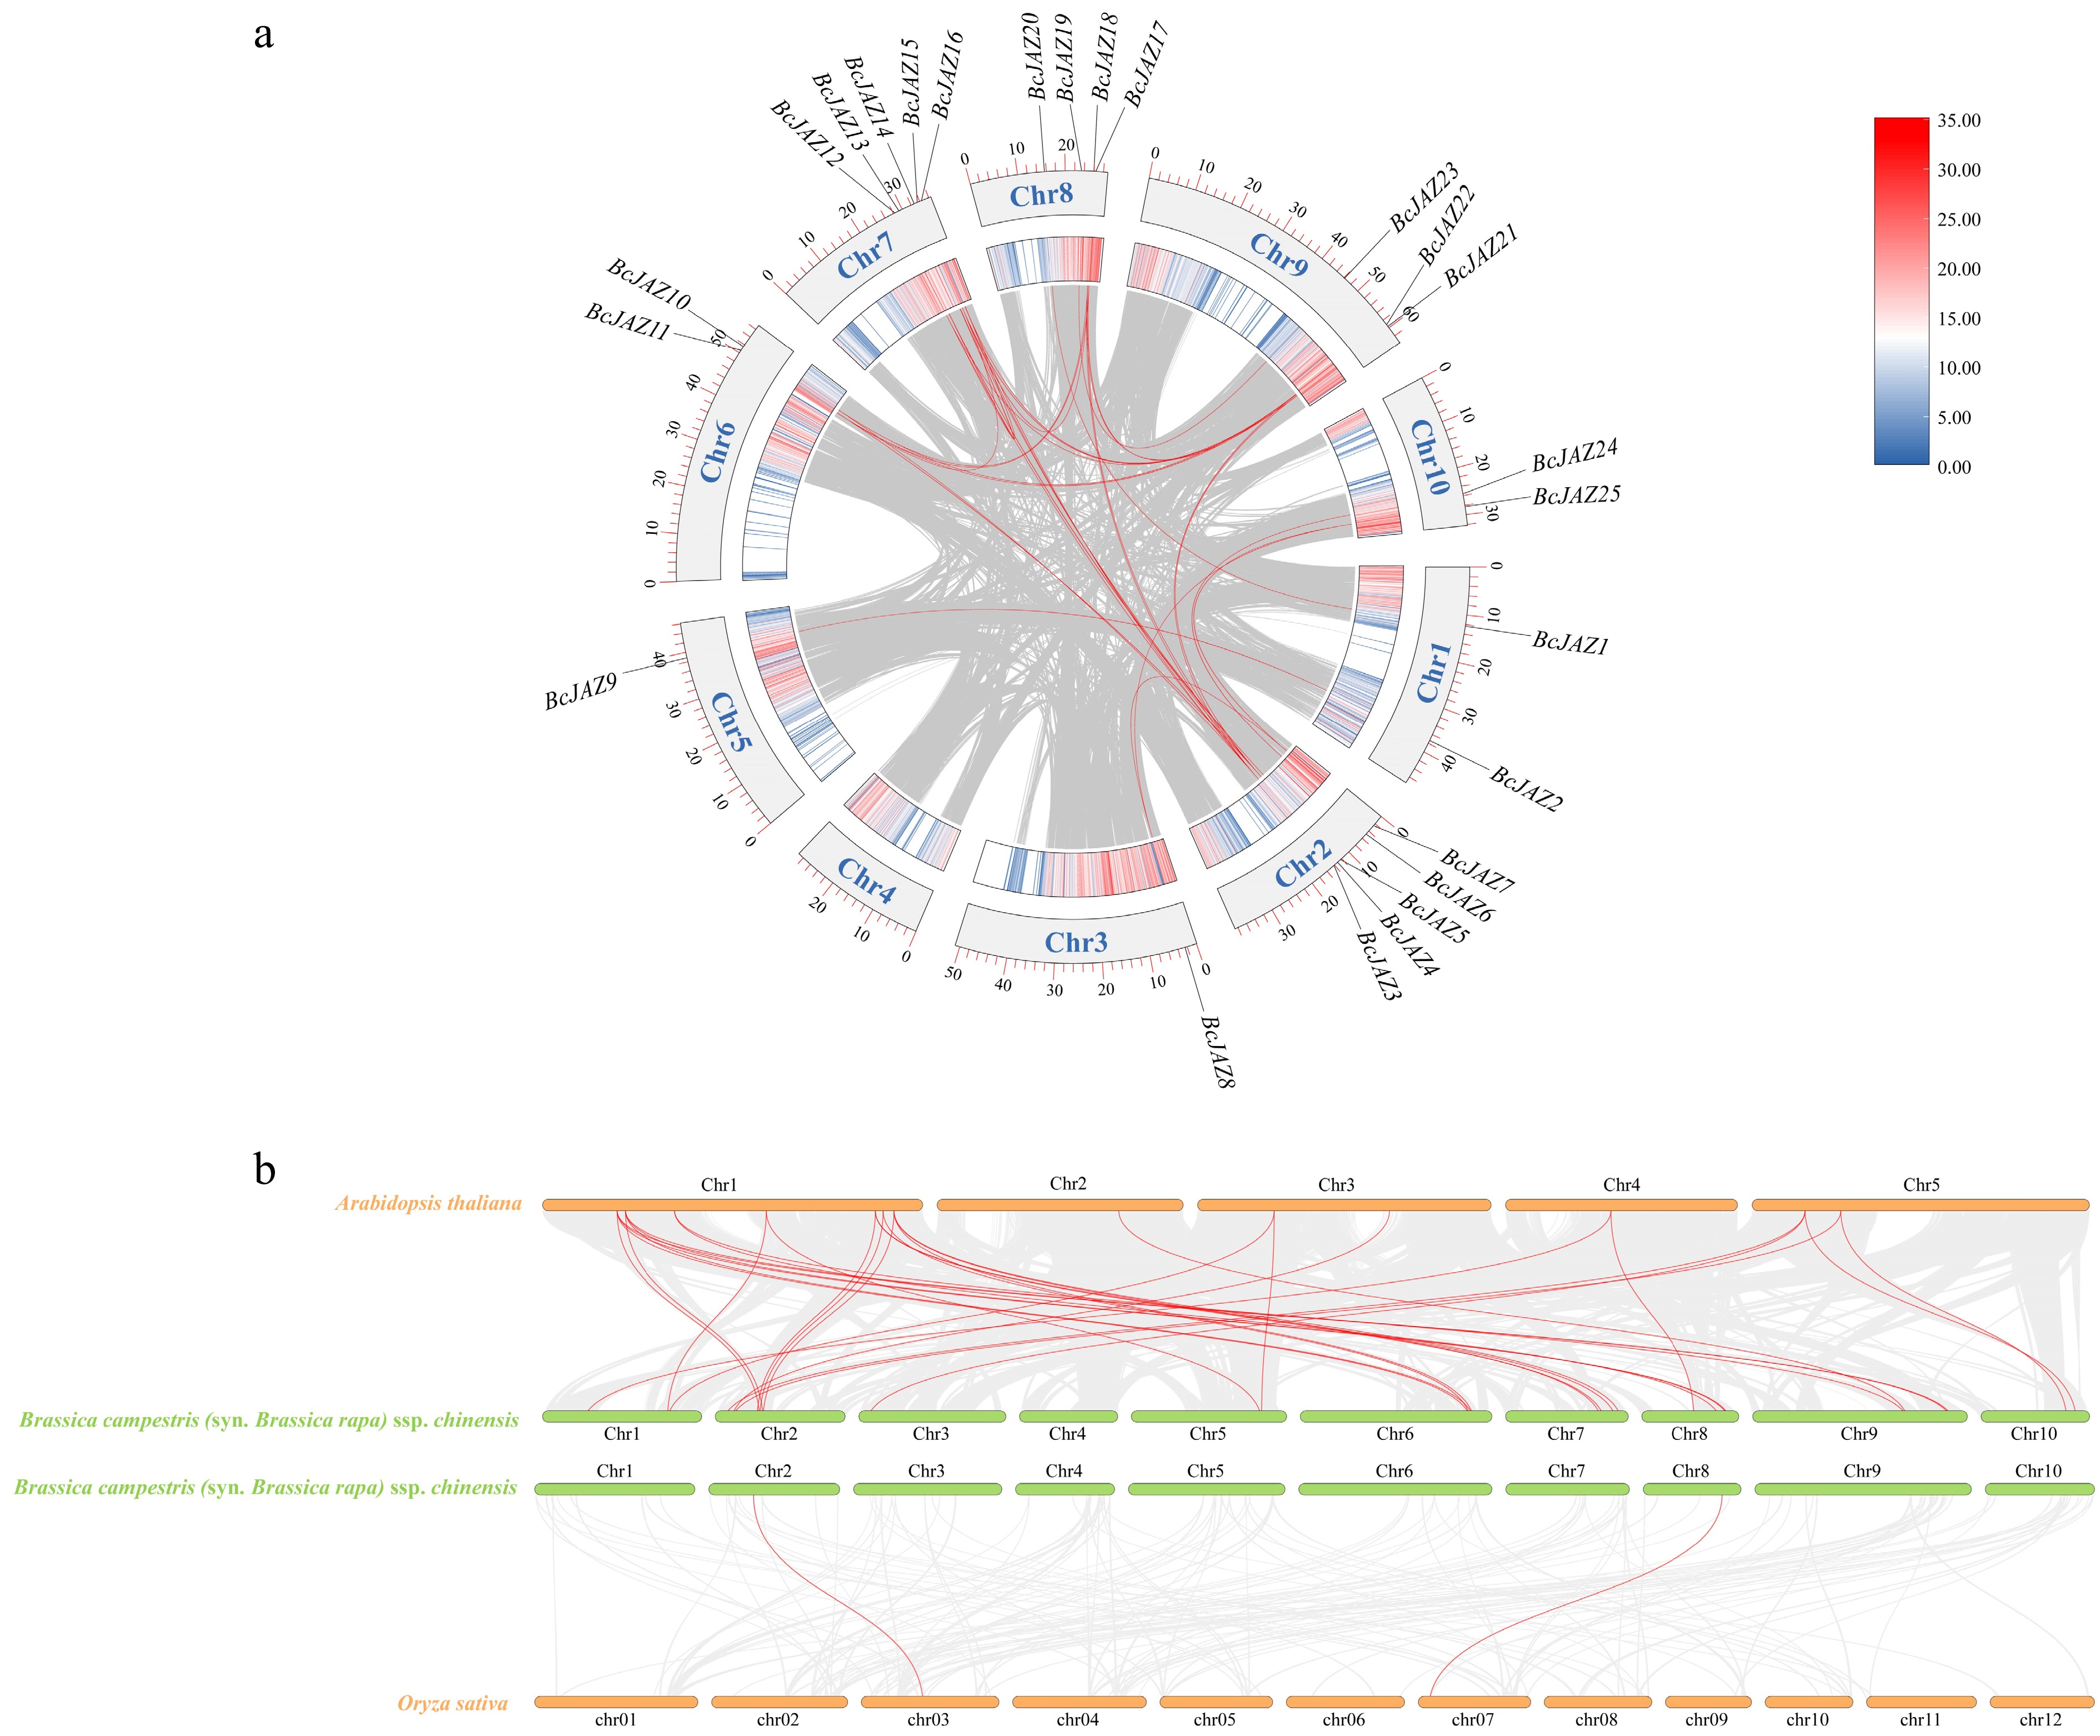
Figure 3.
Collinearity analysis of the BcJAZs. (a) Intraspecies collinearity analysis of BcJAZs. (b) Interspecific collinearity analysis of BcJAZs in NHCC, Arabidopsis thaliana, and Oryza sativa.
-
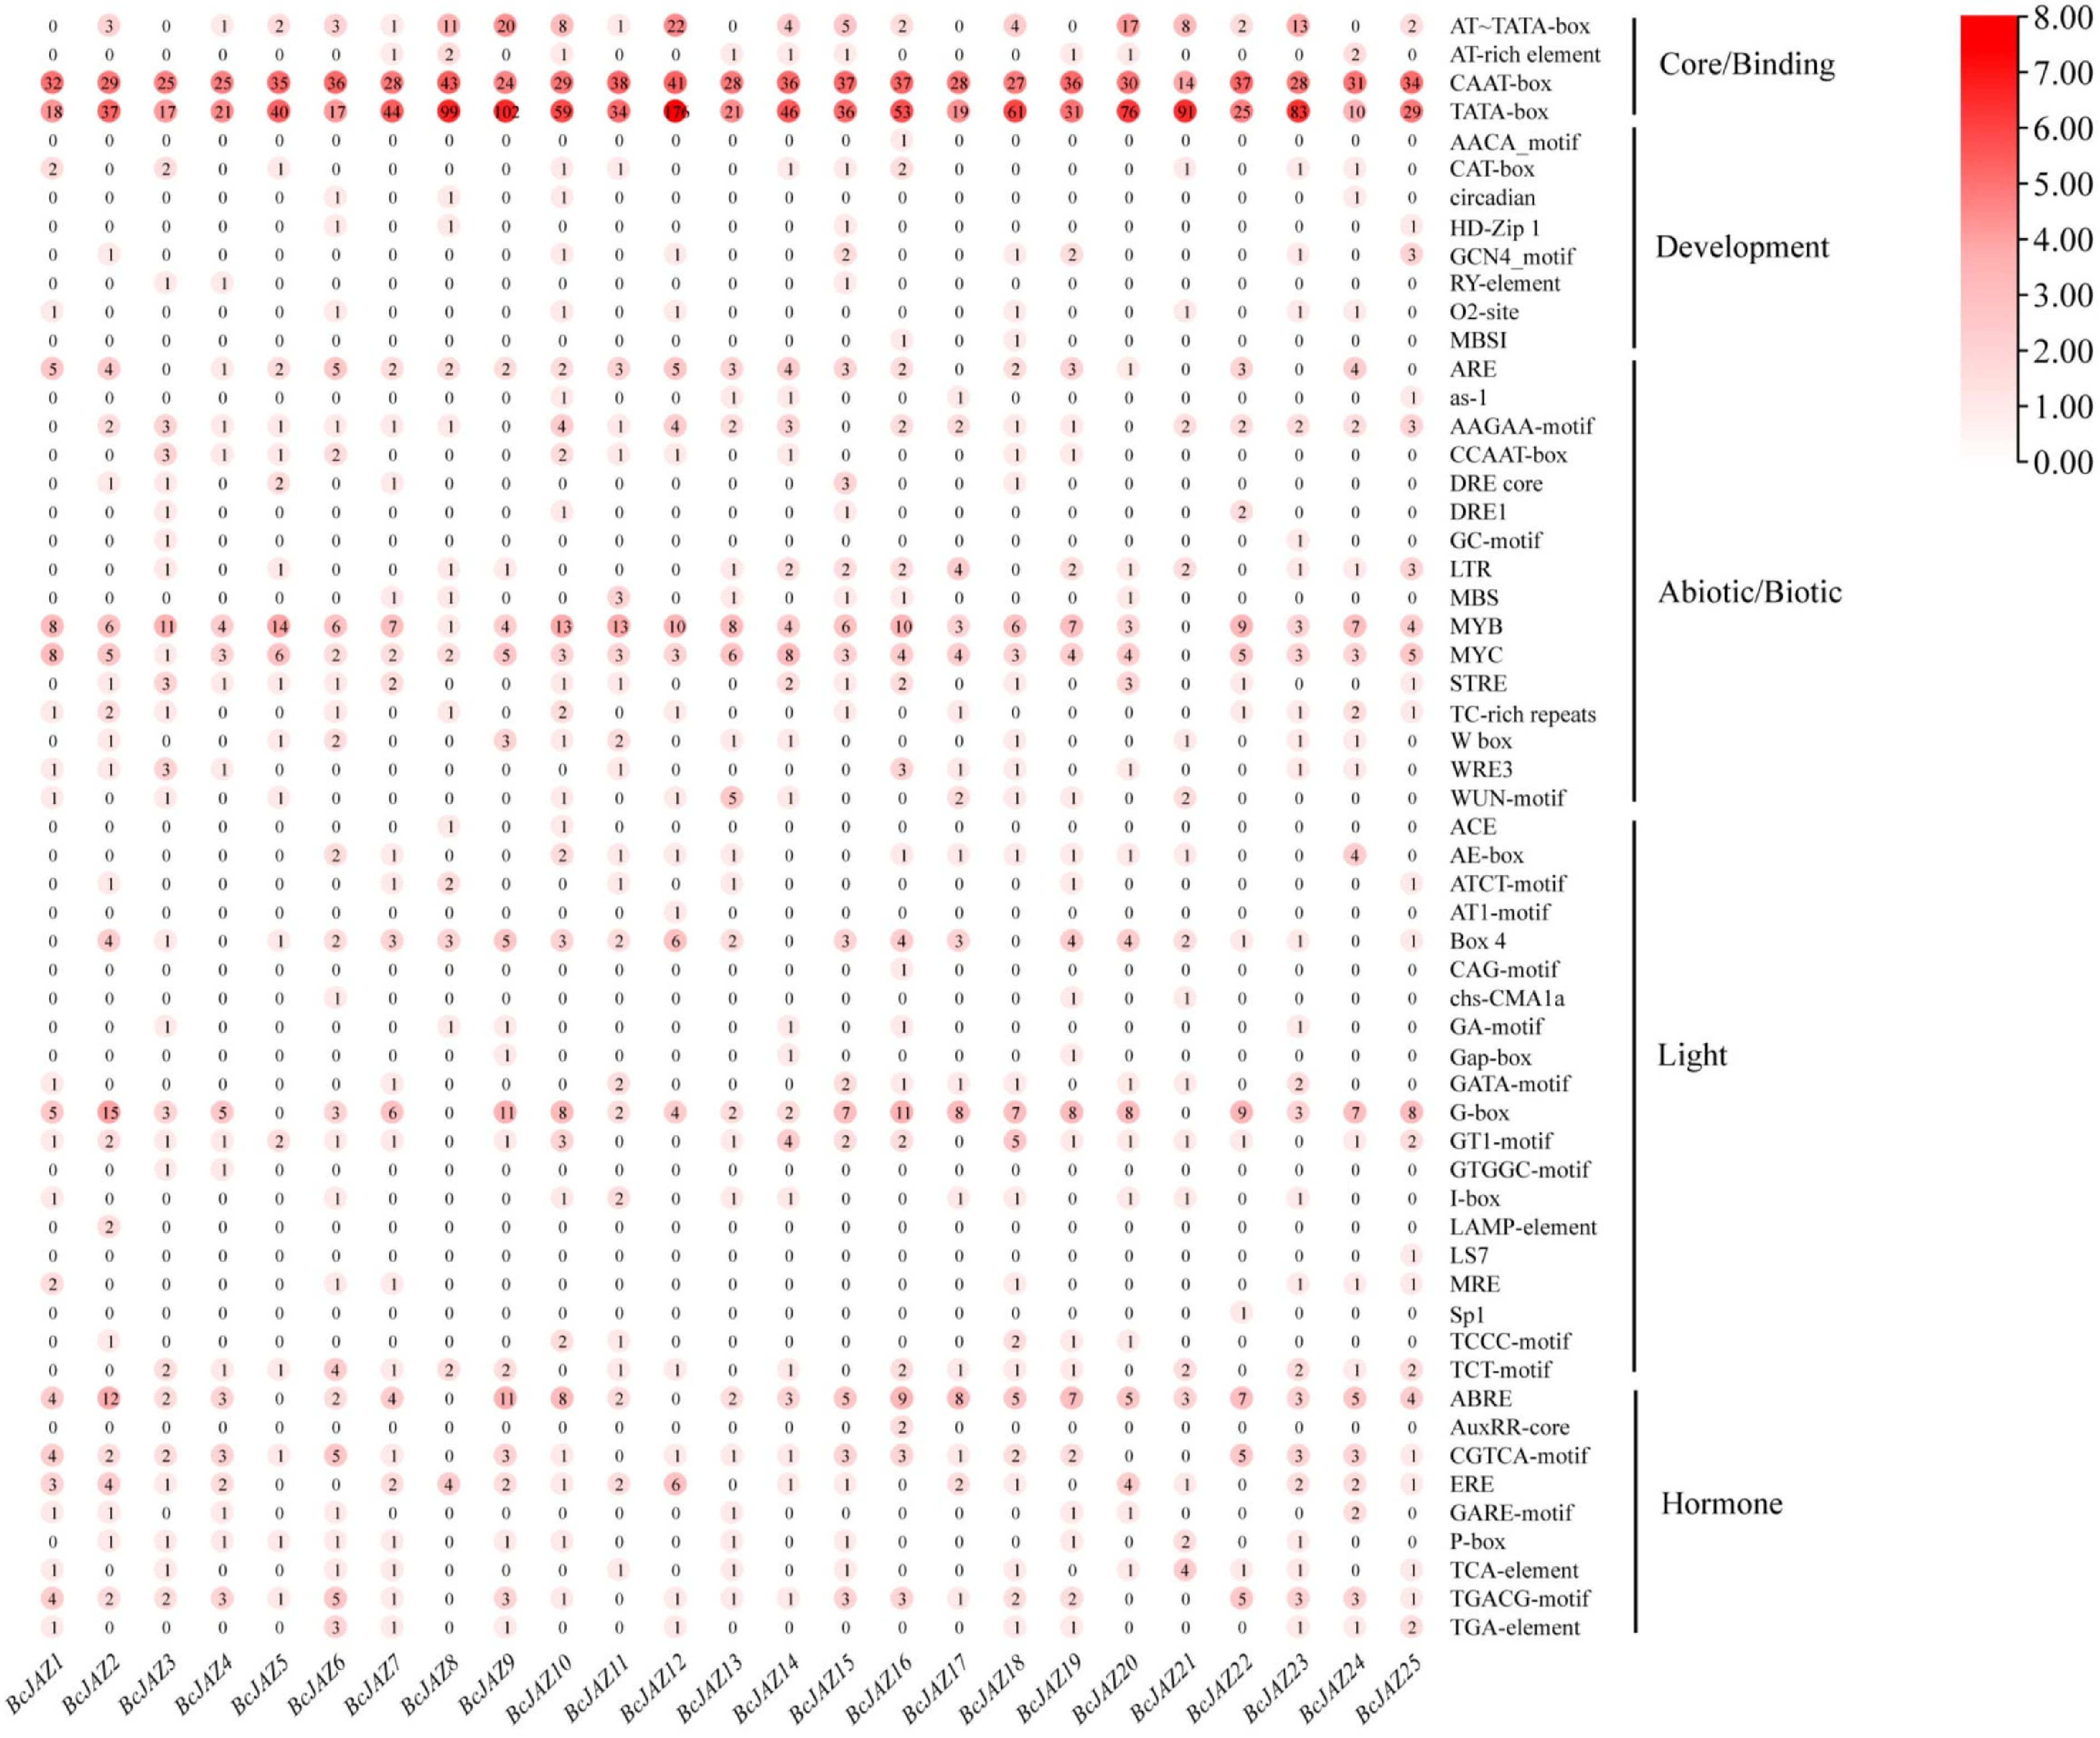
Figure 4.
Cis-elements analysis of BcJAZs promoters in NHCC. The numbers within the red circles indicated the quantities of cis-elements.
-
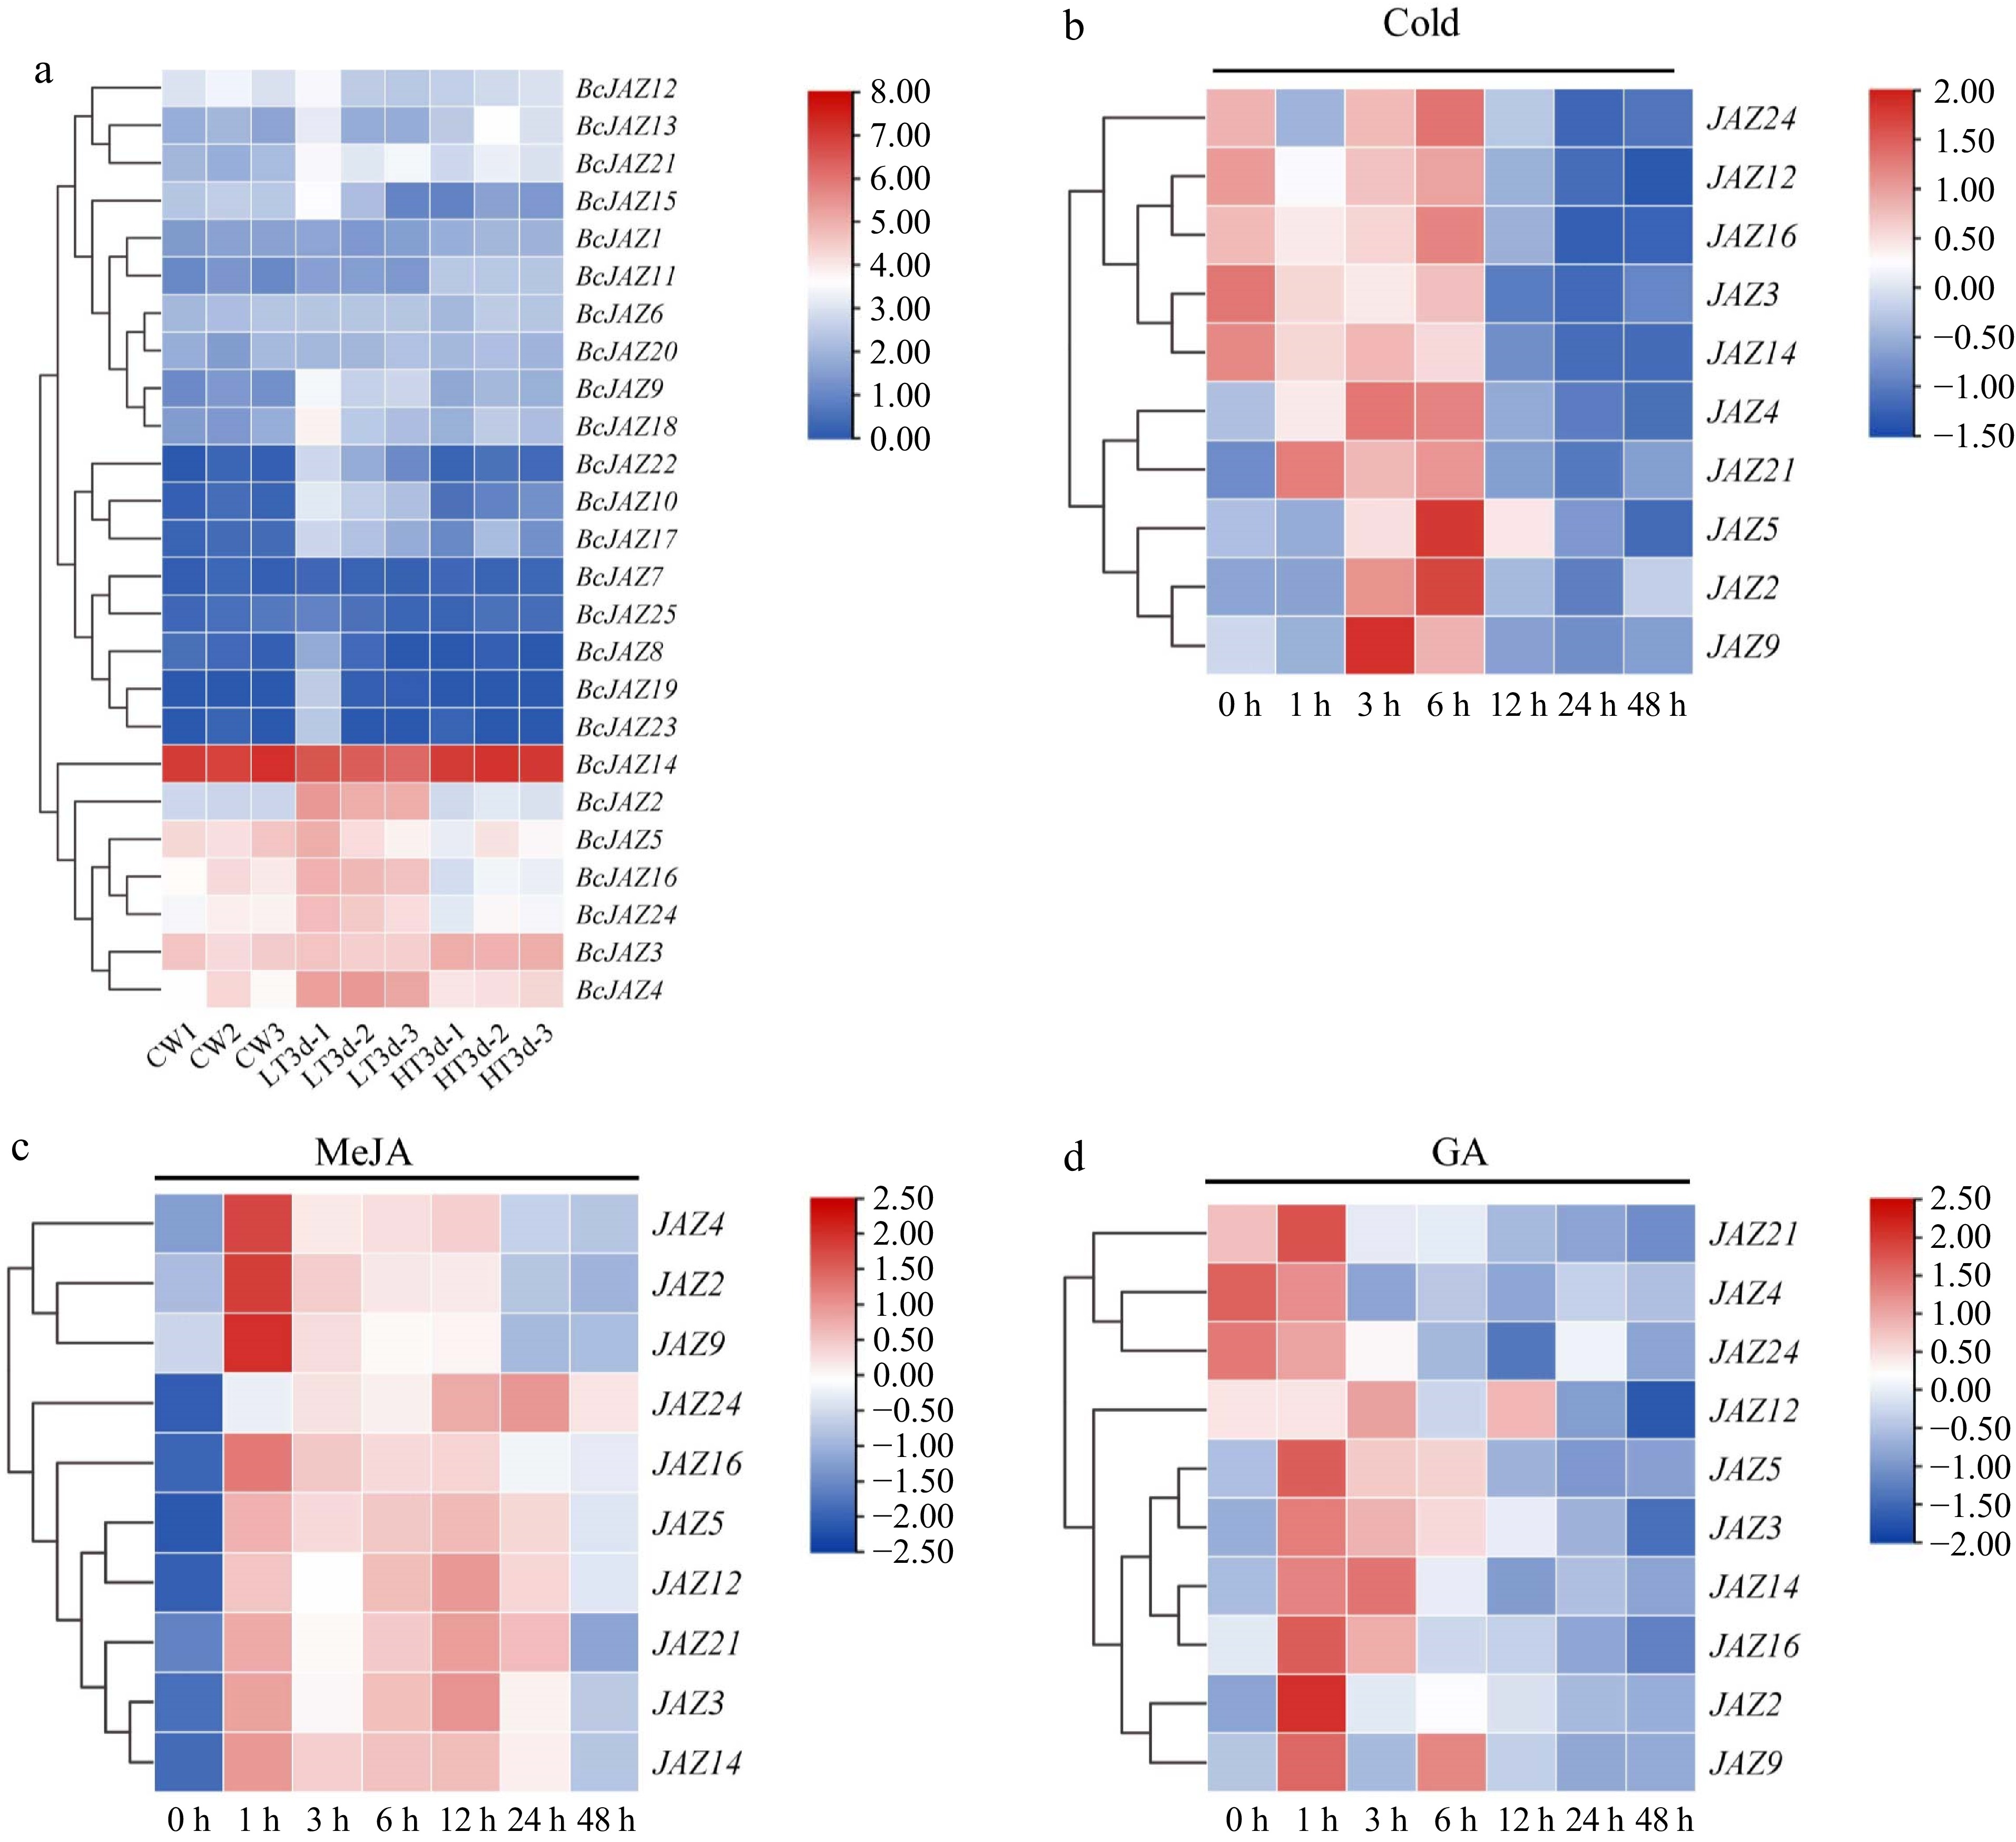
Figure 5.
Expression patterns of BcJAZ genes in response to abiotic stresses and hormone treatments. (a) RNA-Seq data of the BcJAZ gene family at different temperatures (CW represented normal temperature, LT3d represented low temperature 8/4 °C and HT3d represented high temperature 38/25 °C). The bar graph shows the Log2 (TPM + 1) values, indicating expression levels from low to high. (b) The expression patterns of BcJAZs under 4 °C, (c) MeJA, and (d) GA treatment. After being normalized, the expression levels were visualized using TBtools.
-
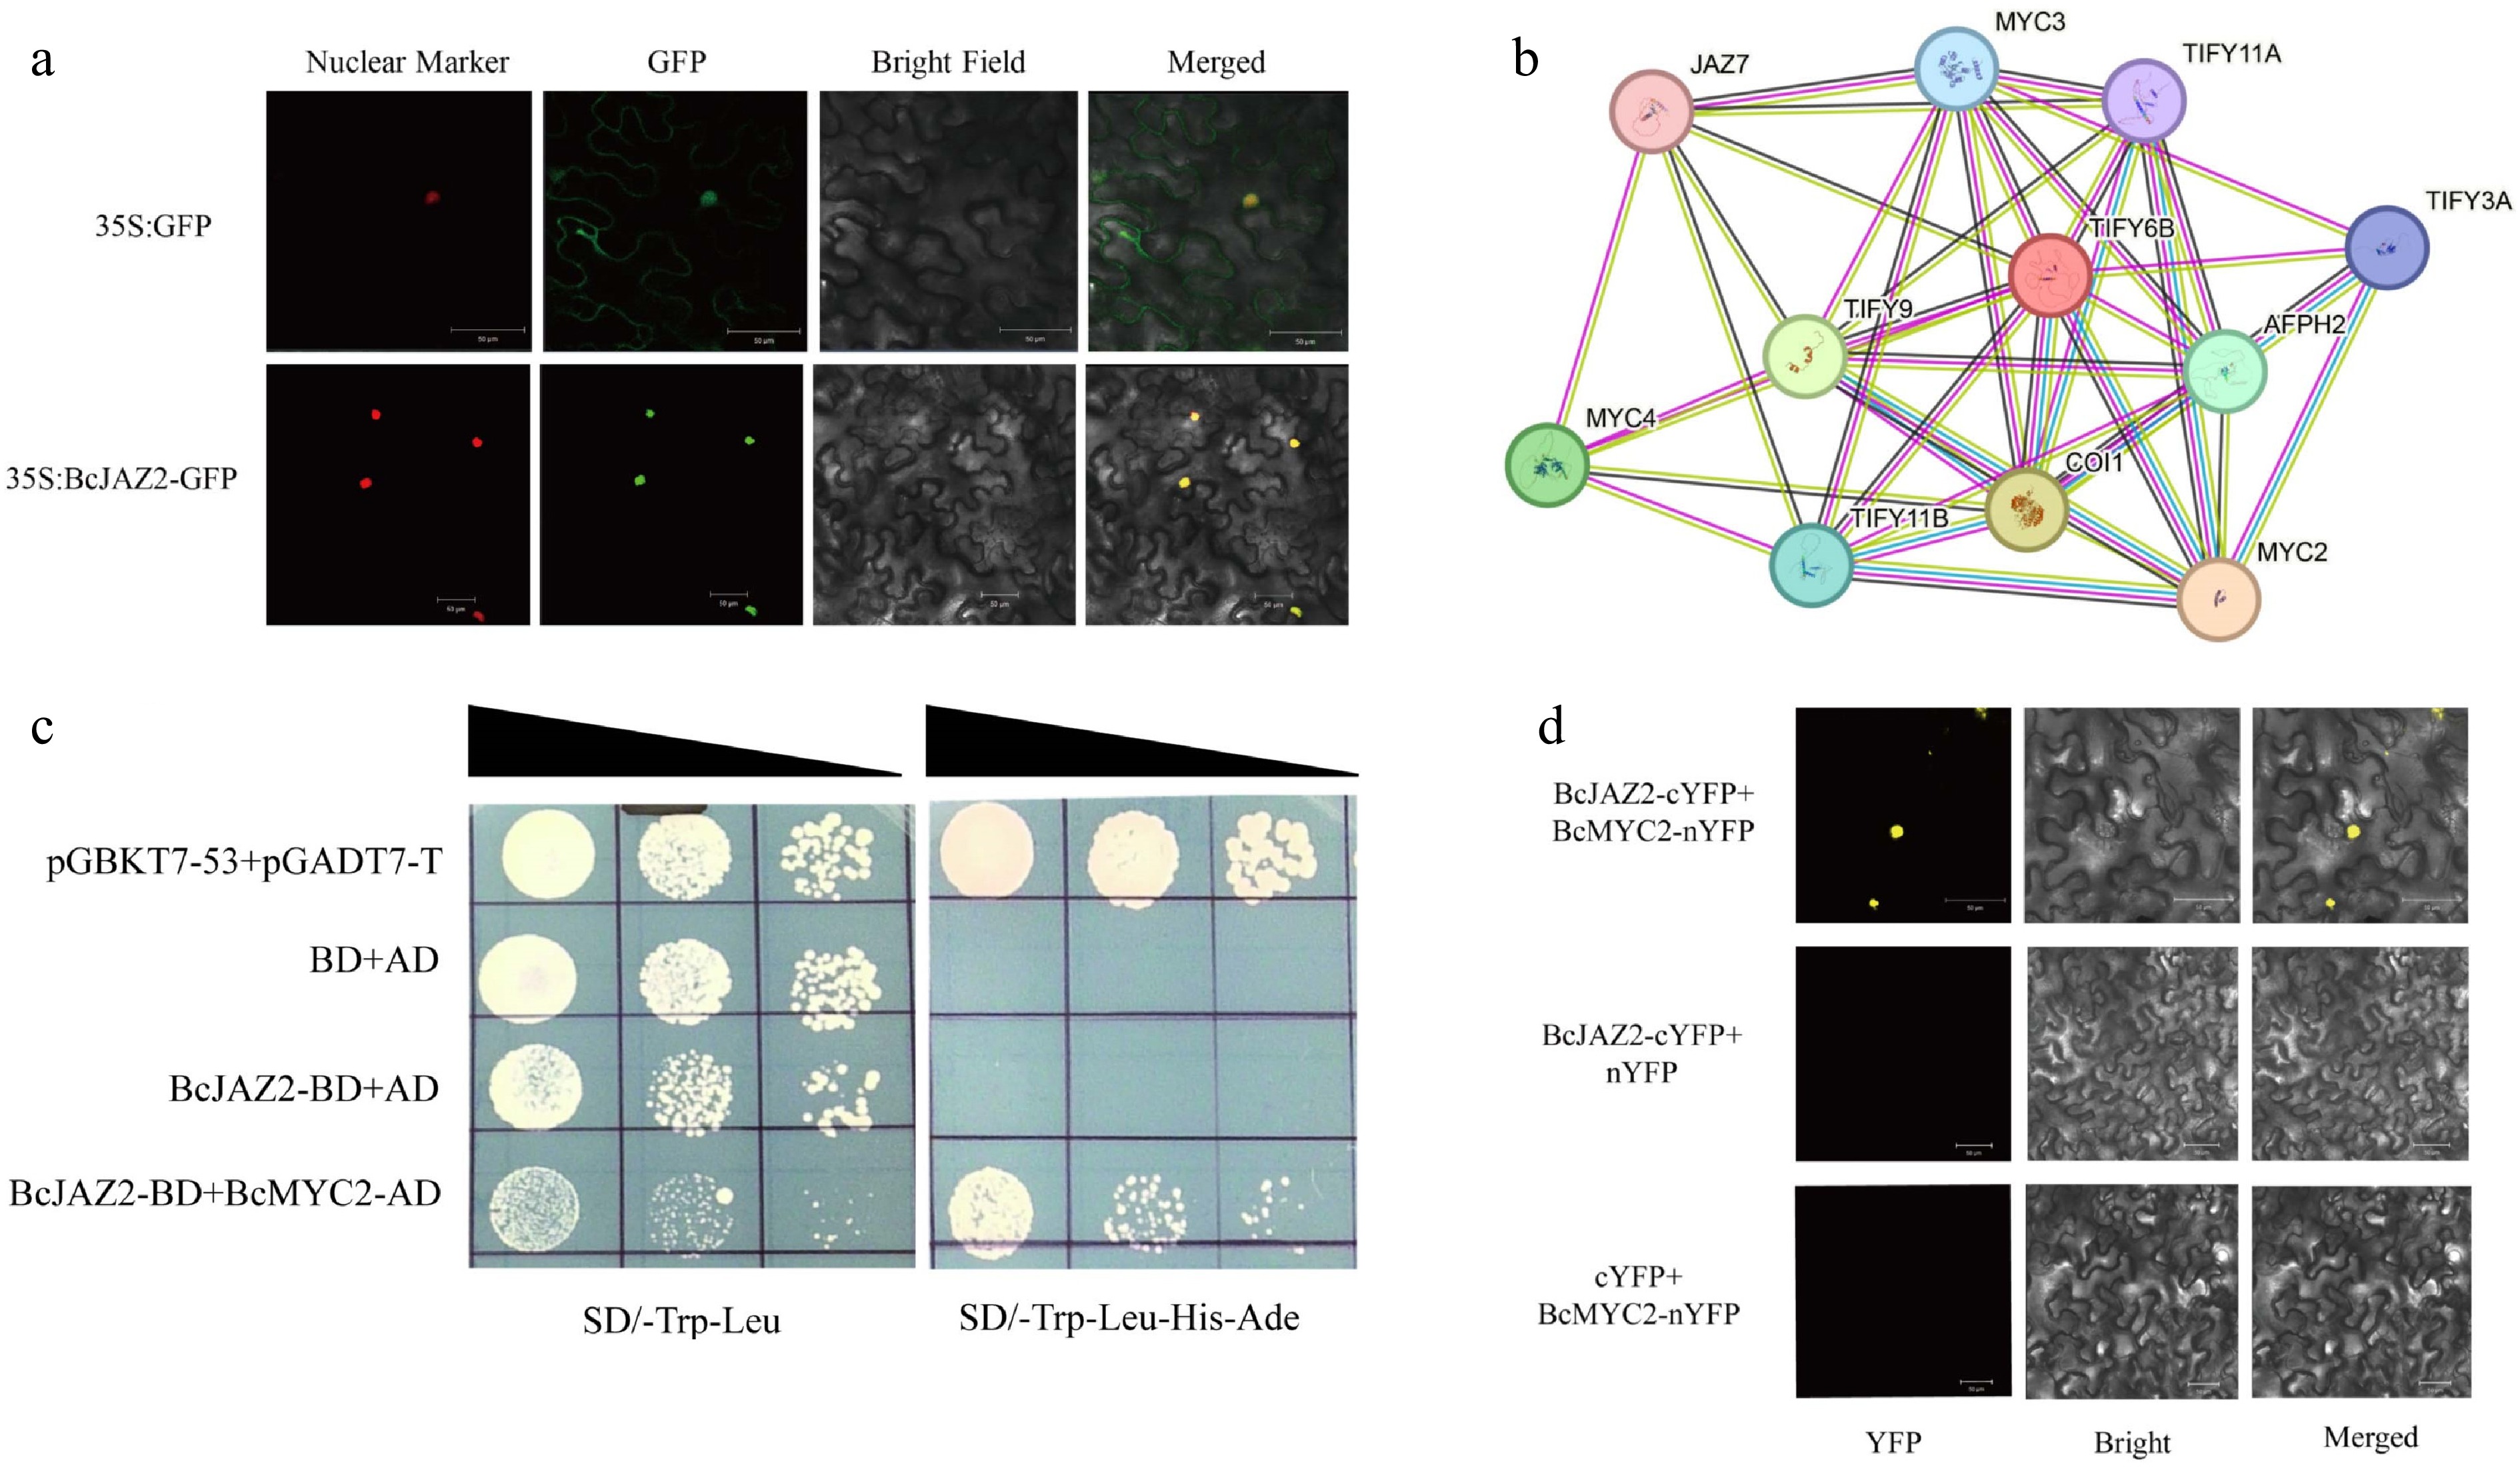
Figure 6.
BcJAZ2 interacts with BcMYC2. (a) Subcellular localization of BcJAZ2. The scale bar was 50 μm. (b) The protein-protein interaction (PPI) network of BcJAZ2 (TIFY6B) from the STRING 12.0 database. (c) Yeast two-hybrid assays. Positive control was yeast co-transformed with pGBKT7-53 and pGADT7-T and yeast co-transformed with pGBKT7 and pGADT7 was negative control. (d) Bimolecular fluorescence complementation assay. The scale bar was 50 μm.
-
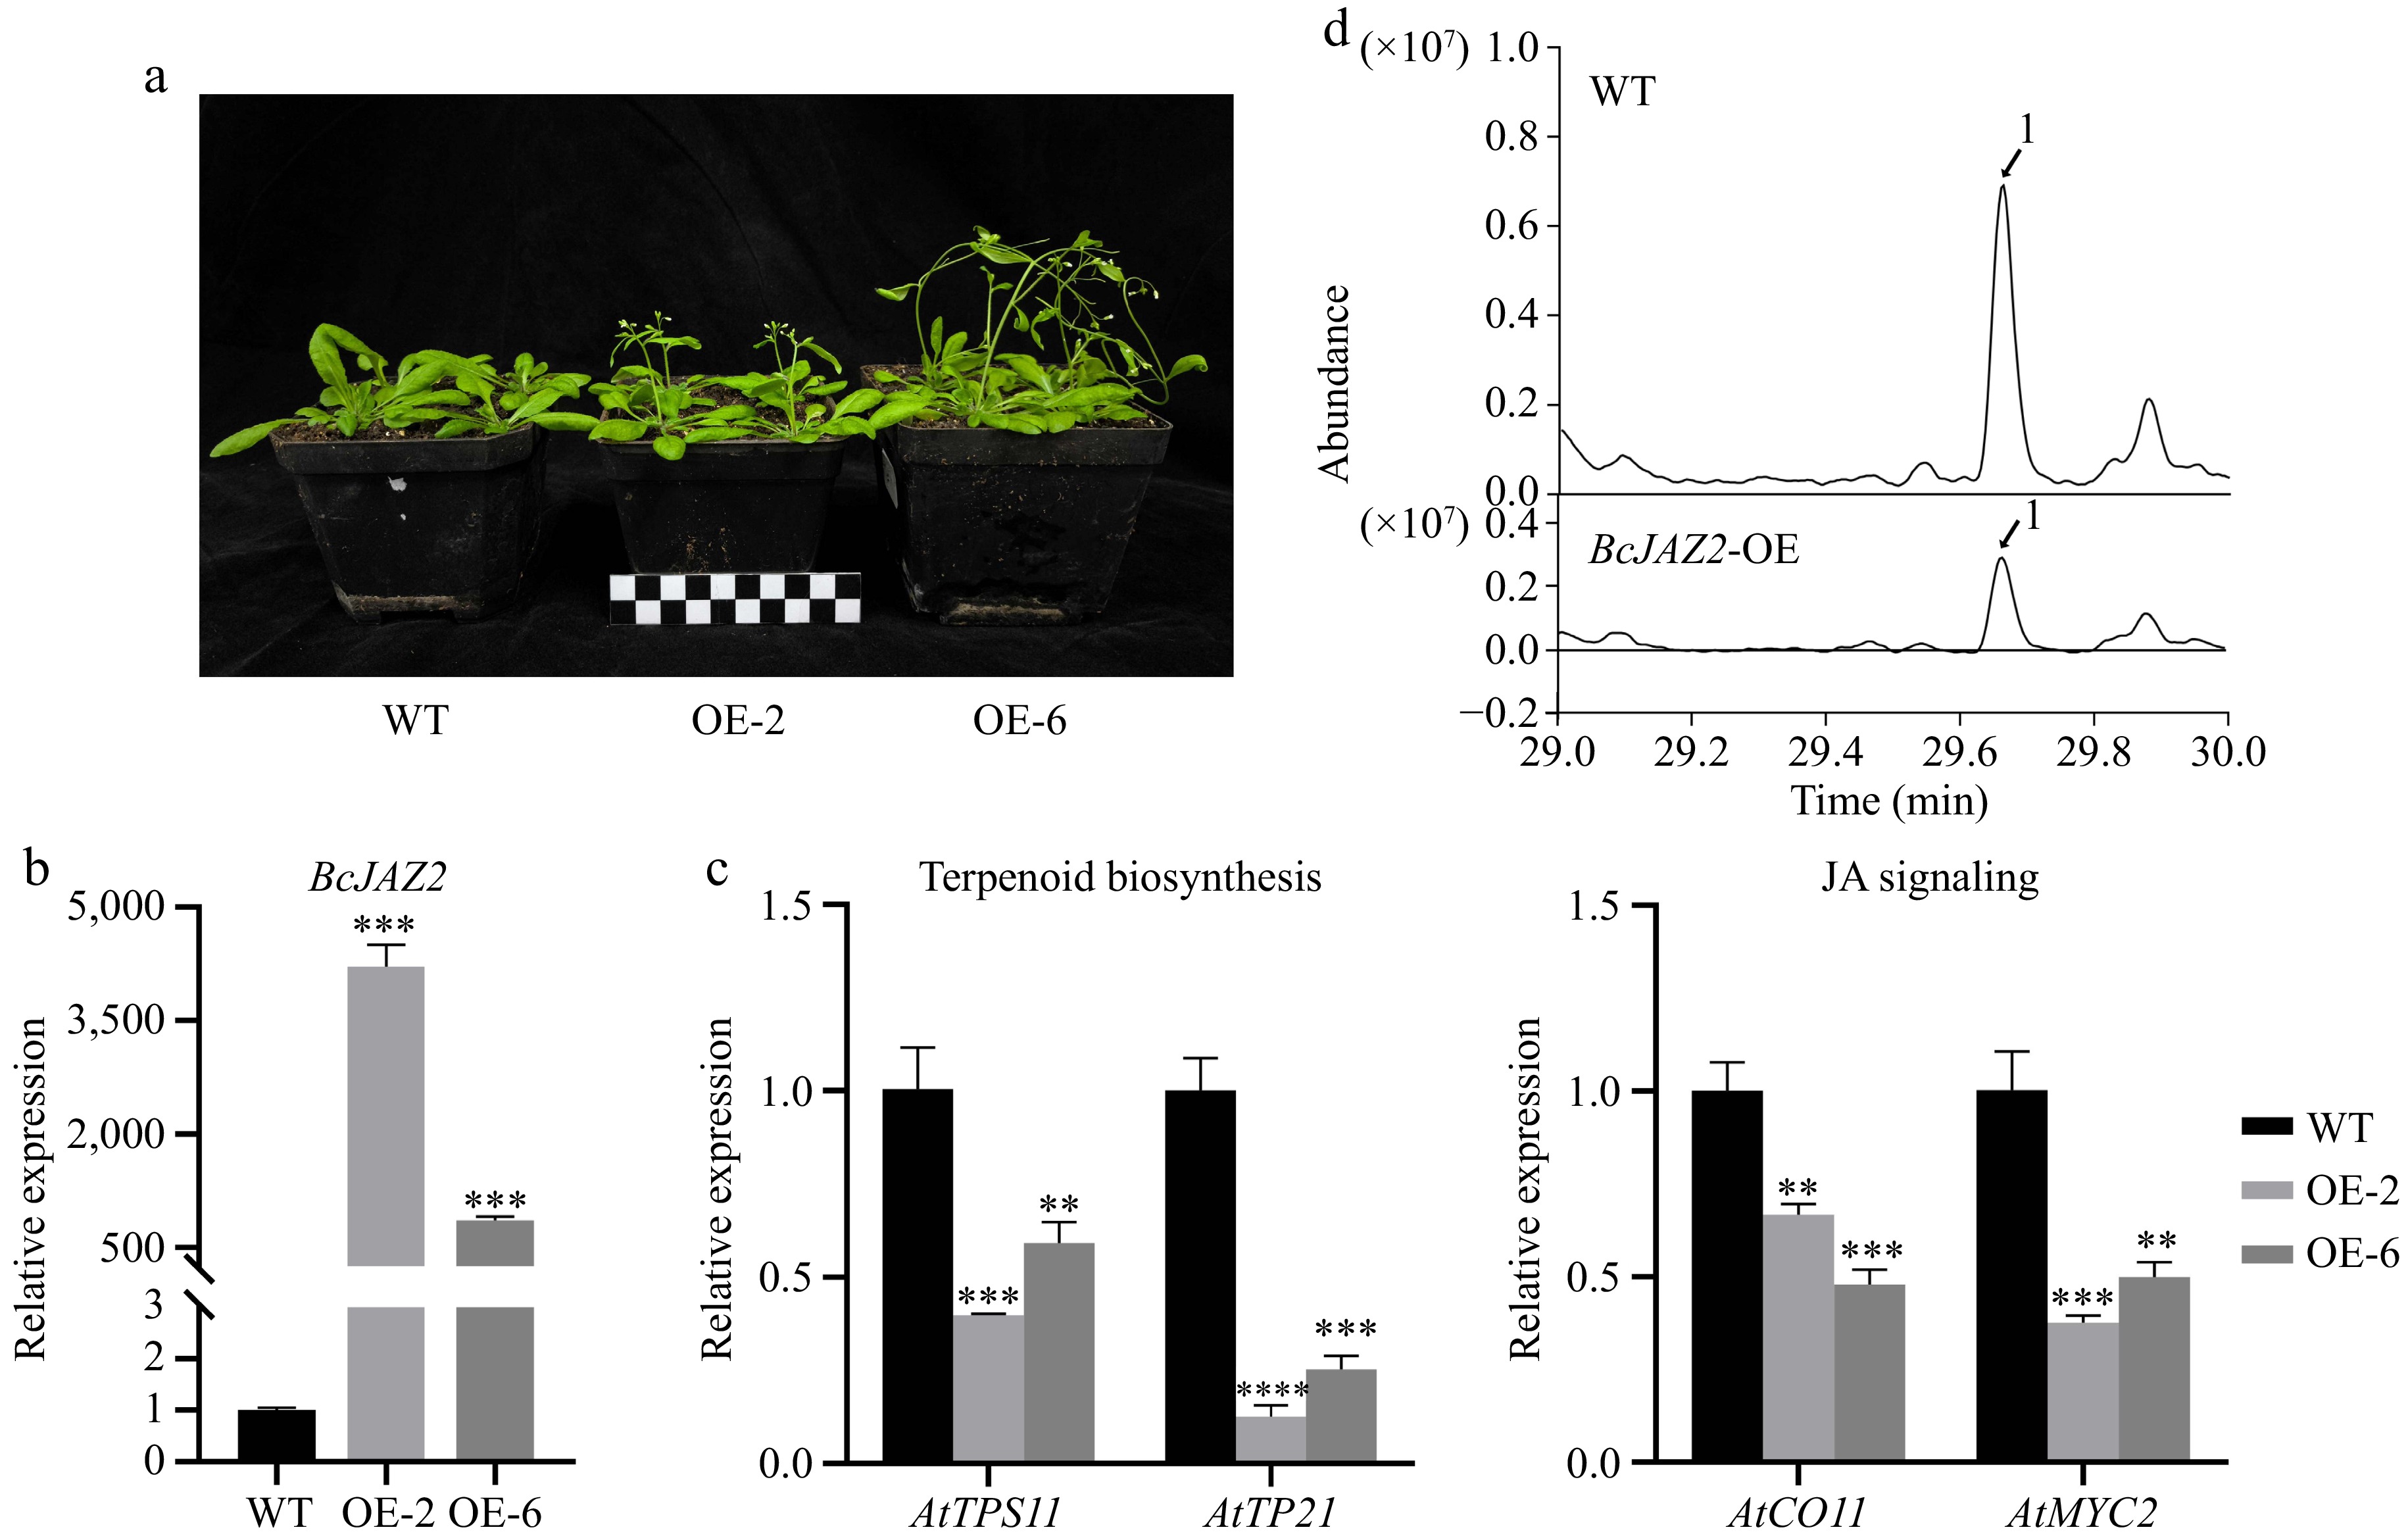
Figure 7.
Overexpression of BcJAZ2 inhibits β-caryophyllene biosynthesis in Arabidopsis. (a) The phenotypes of BcJAZ2 transgenic Arabidopsis. The black and white boxes are scale bar and one box represents 1 cm. (b) Relative expression of BcJAZ2 in Arabidopsis transgenic lines inflorescences. (c) Analysis of sesquiterpene synthase and JA signaling genes expression level in inflorescences of BcJAZ2 transgenic Arabidopsis. Student's t-test: **p ≤ 0. 01, ***p ≤ 0.001, ****p ≤ 0.0001. Three experiments were repeated and values were means ± SD. (d) GC-MS chromatogram analysis of β-caryophyllene emitted by Arabidopsis inflorescences in both wild-type (WT) and transgenic lines. Peaks with number represented β-caryophyllene.
-
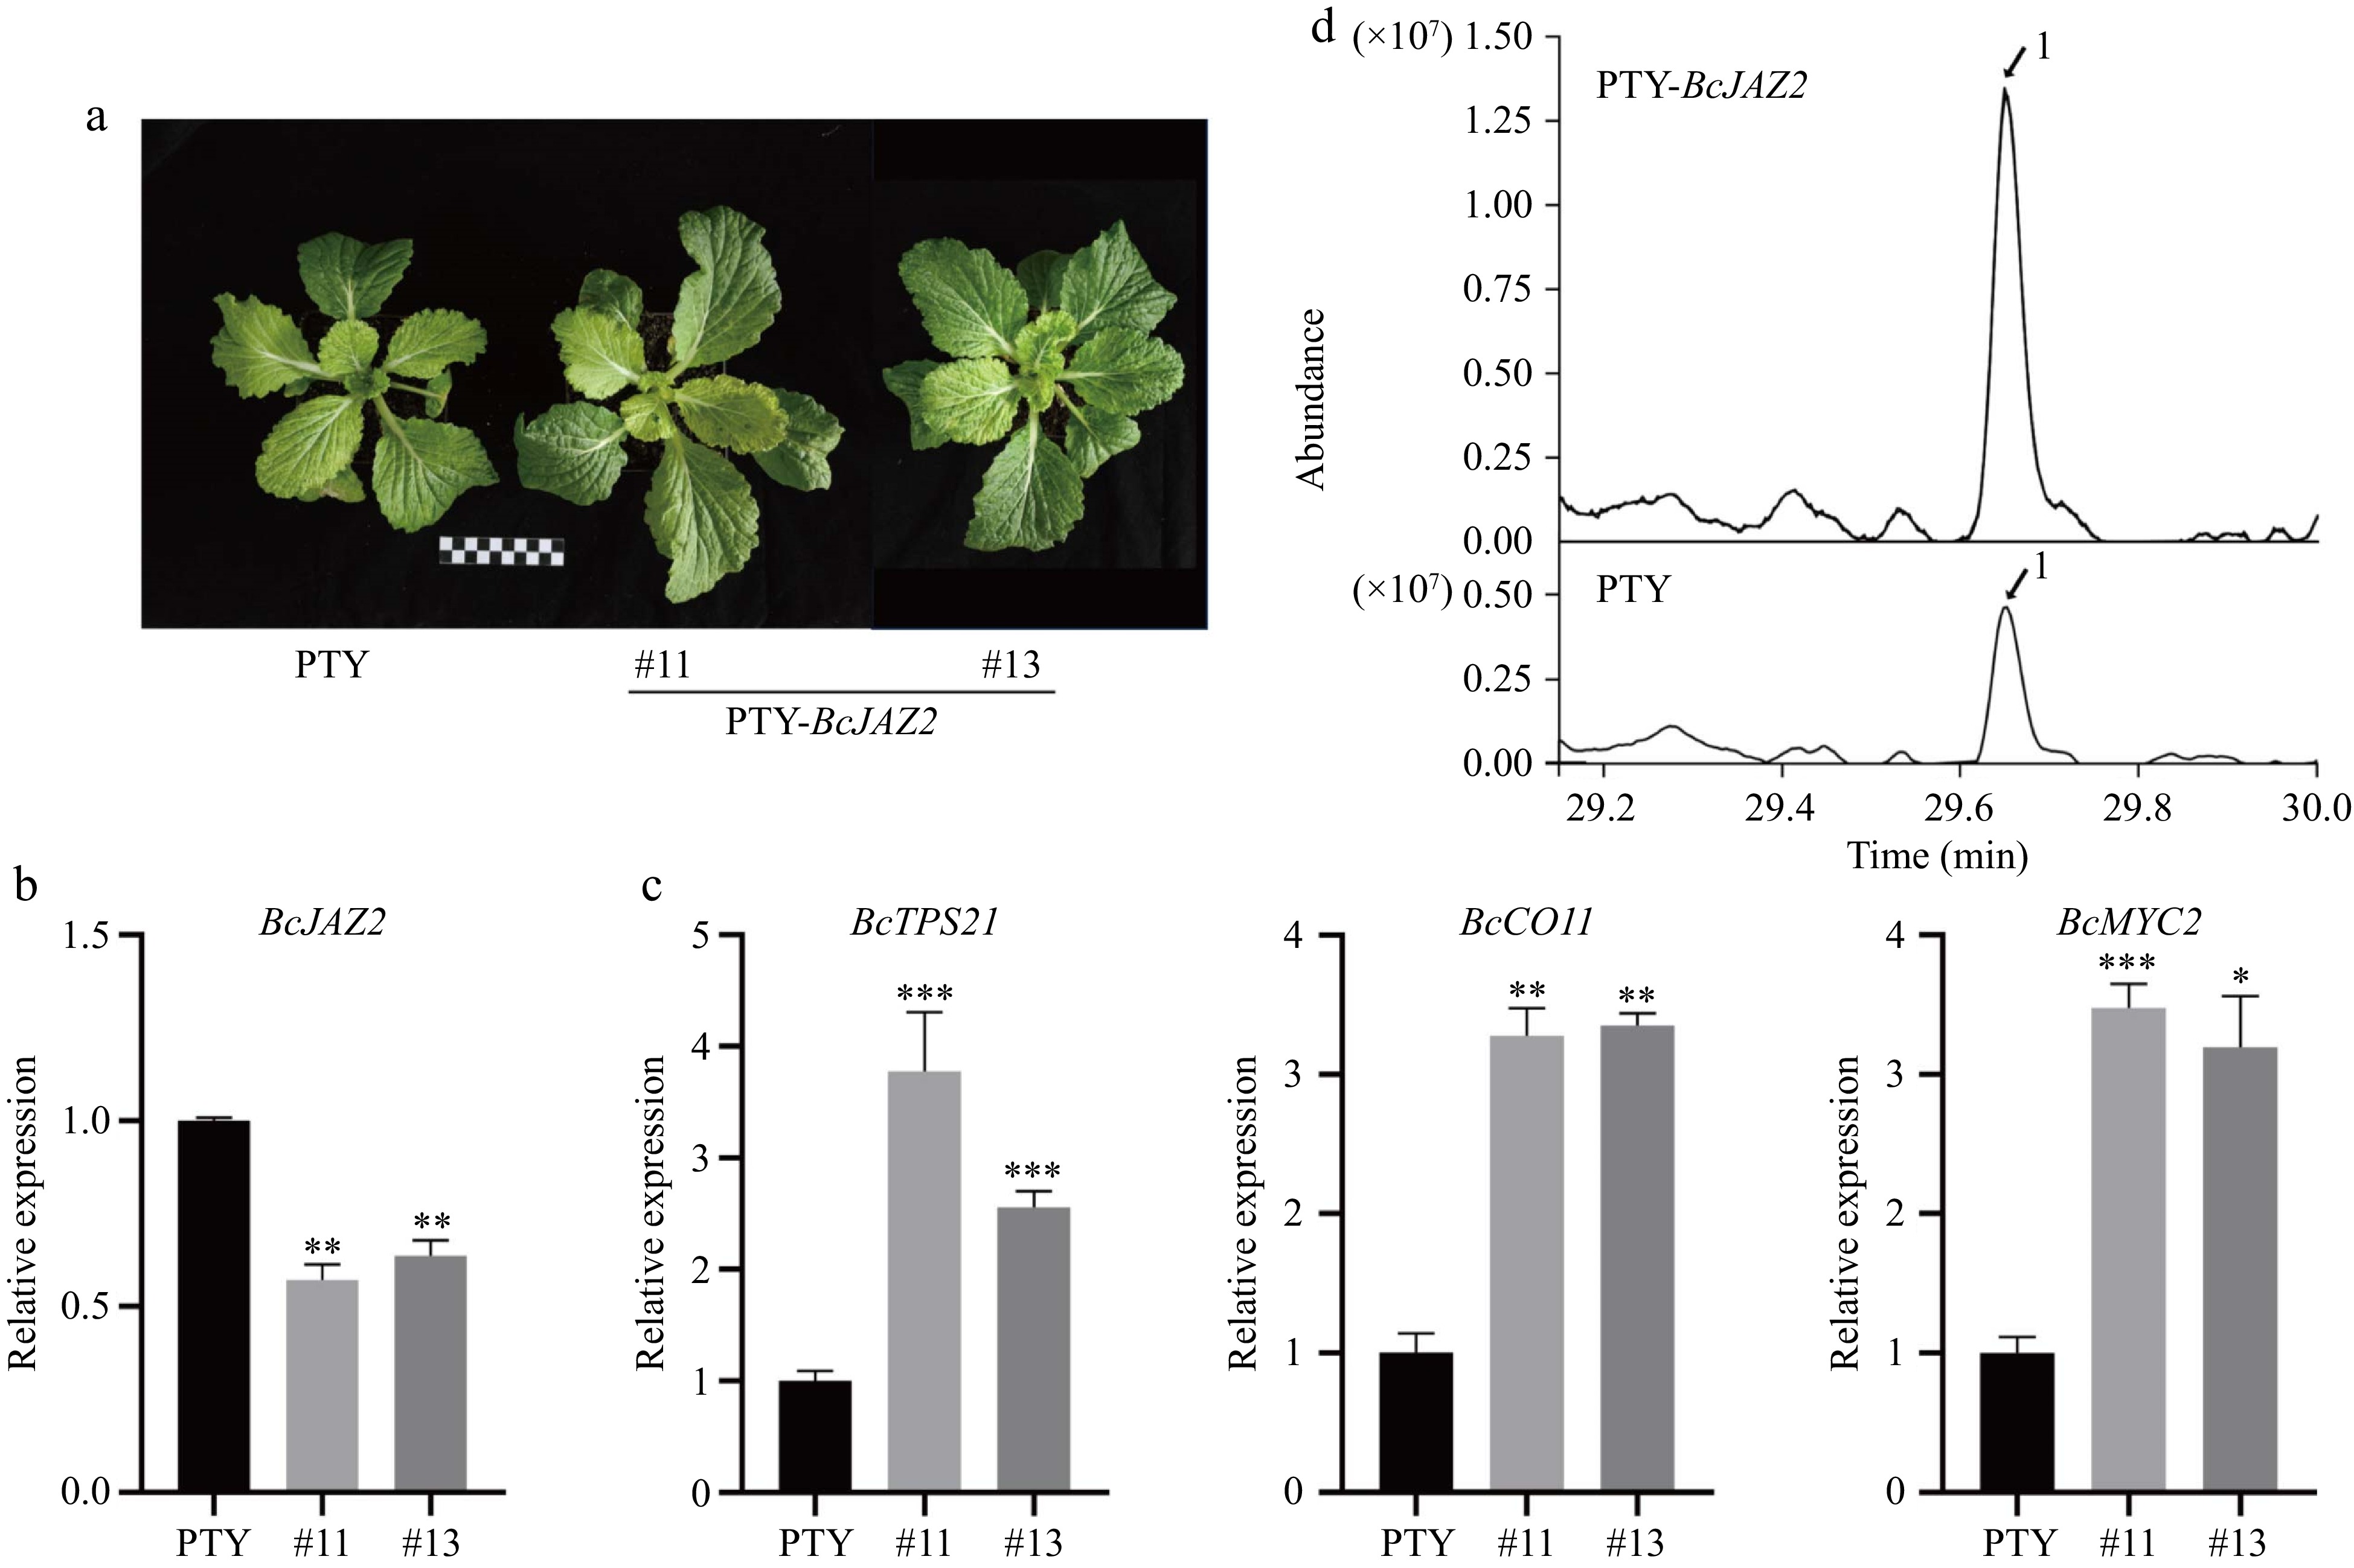
Figure 8.
Silencing BcJAZ2 by VIGS promotes β-caryophyllene biosynthesis in NHCC. (a) The phenotypes of BcJAZ2 in silenced plants. The black and white boxes are scale bar and one box represents 1 cm. (b) Relative expression of BcJAZ2 in silenced and control plants. (c) Analysis of sesquiterpene synthase and JA signaling genes expression level of BcJAZ2 in silenced and control plants. Student's t-test: *p ≤ 0.05, **p ≤ 0.01, ***p ≤ 0.001. Three experiments were repeated and values were means ± SD. (d) GC-MS chromatogram analysis of β-caryophyllene in silenced and control plants. Peaks with number represented sesquiterpenes β-caryophyllene.
-
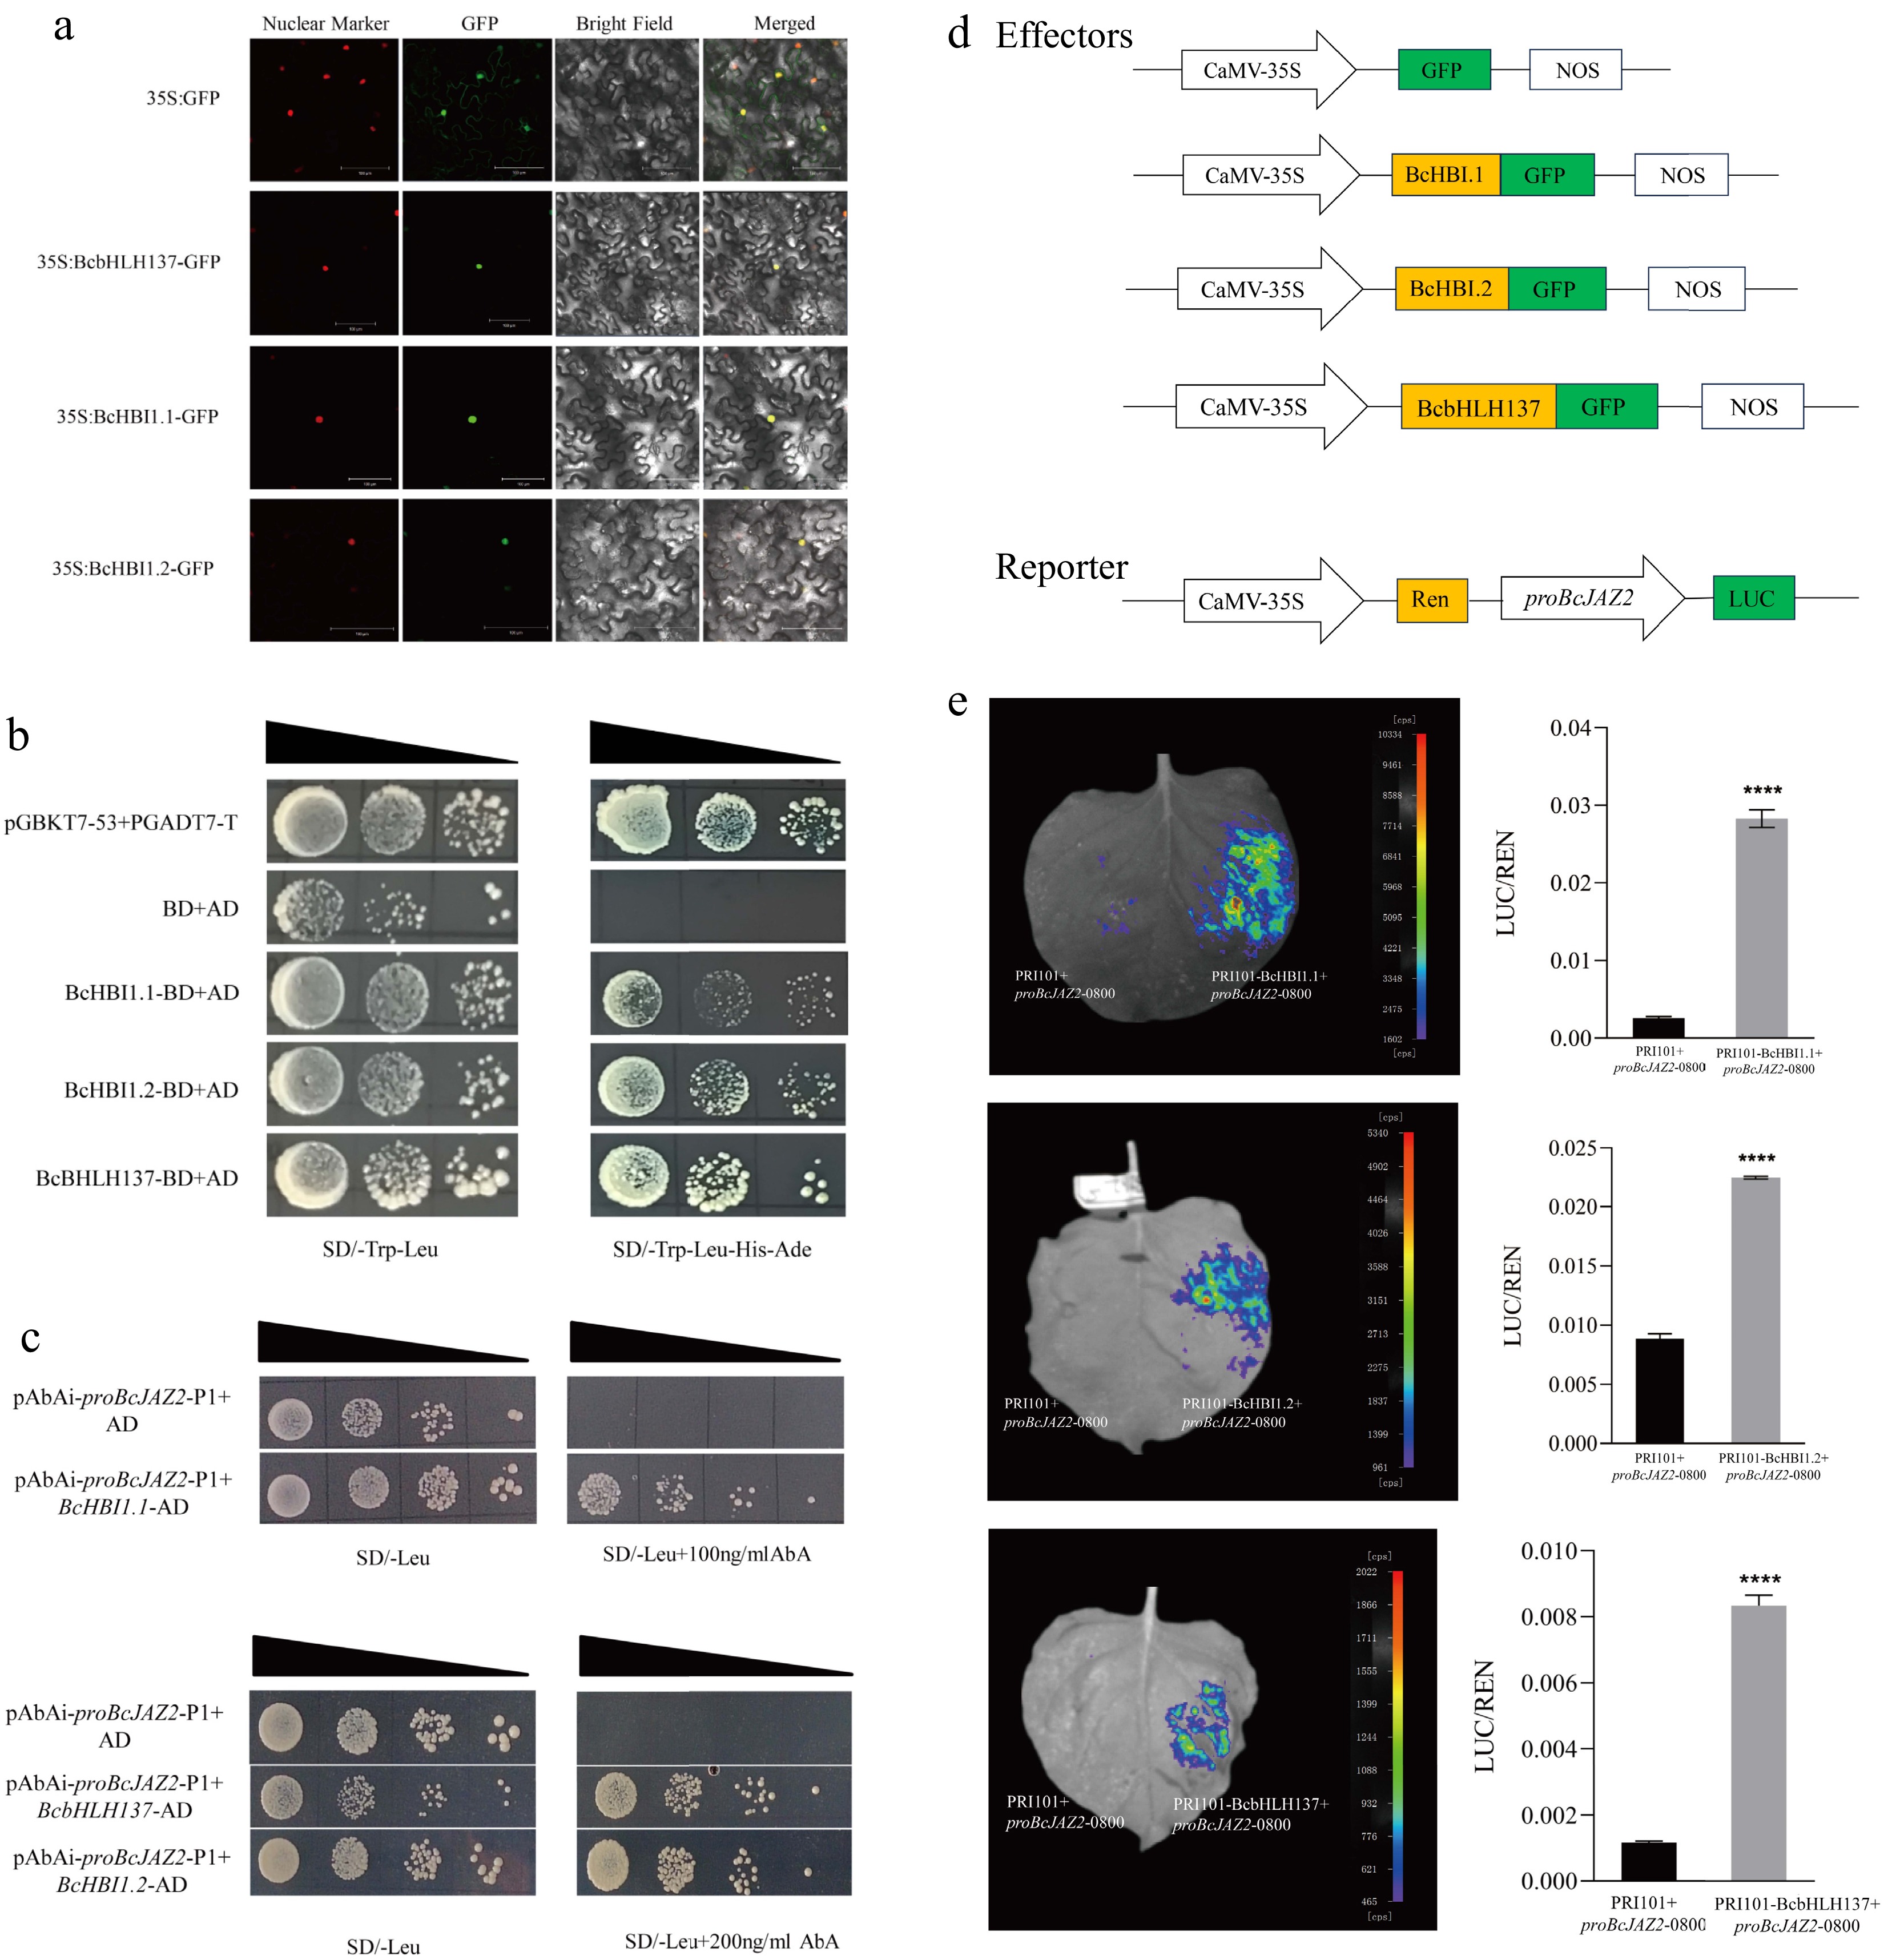
Figure 9.
Screening of upstream regulatory genes of BcJAZ2. (a) Subcellular localization of BcbHLH137, BcHBI1.1, and BcHBI1.2. The scale bar was 100 μm. (b) Trans-activation activity of BcHBI1.1, BcHBI1.2, and BcbHLH137 using yeast two-hybrid assay. (c) Yeast one-hybrid assay. (d) Schematic diagram of the effectors and reporter vectors. (e) Dual-luciferase assay showed that the screened transcription factors promoted BcJAZ2 expression. The data were from three experiments replicates and values were means ± SD. Student's t-test: ****p ≤ 0.0001.
Figures
(9)
Tables
(0)