-
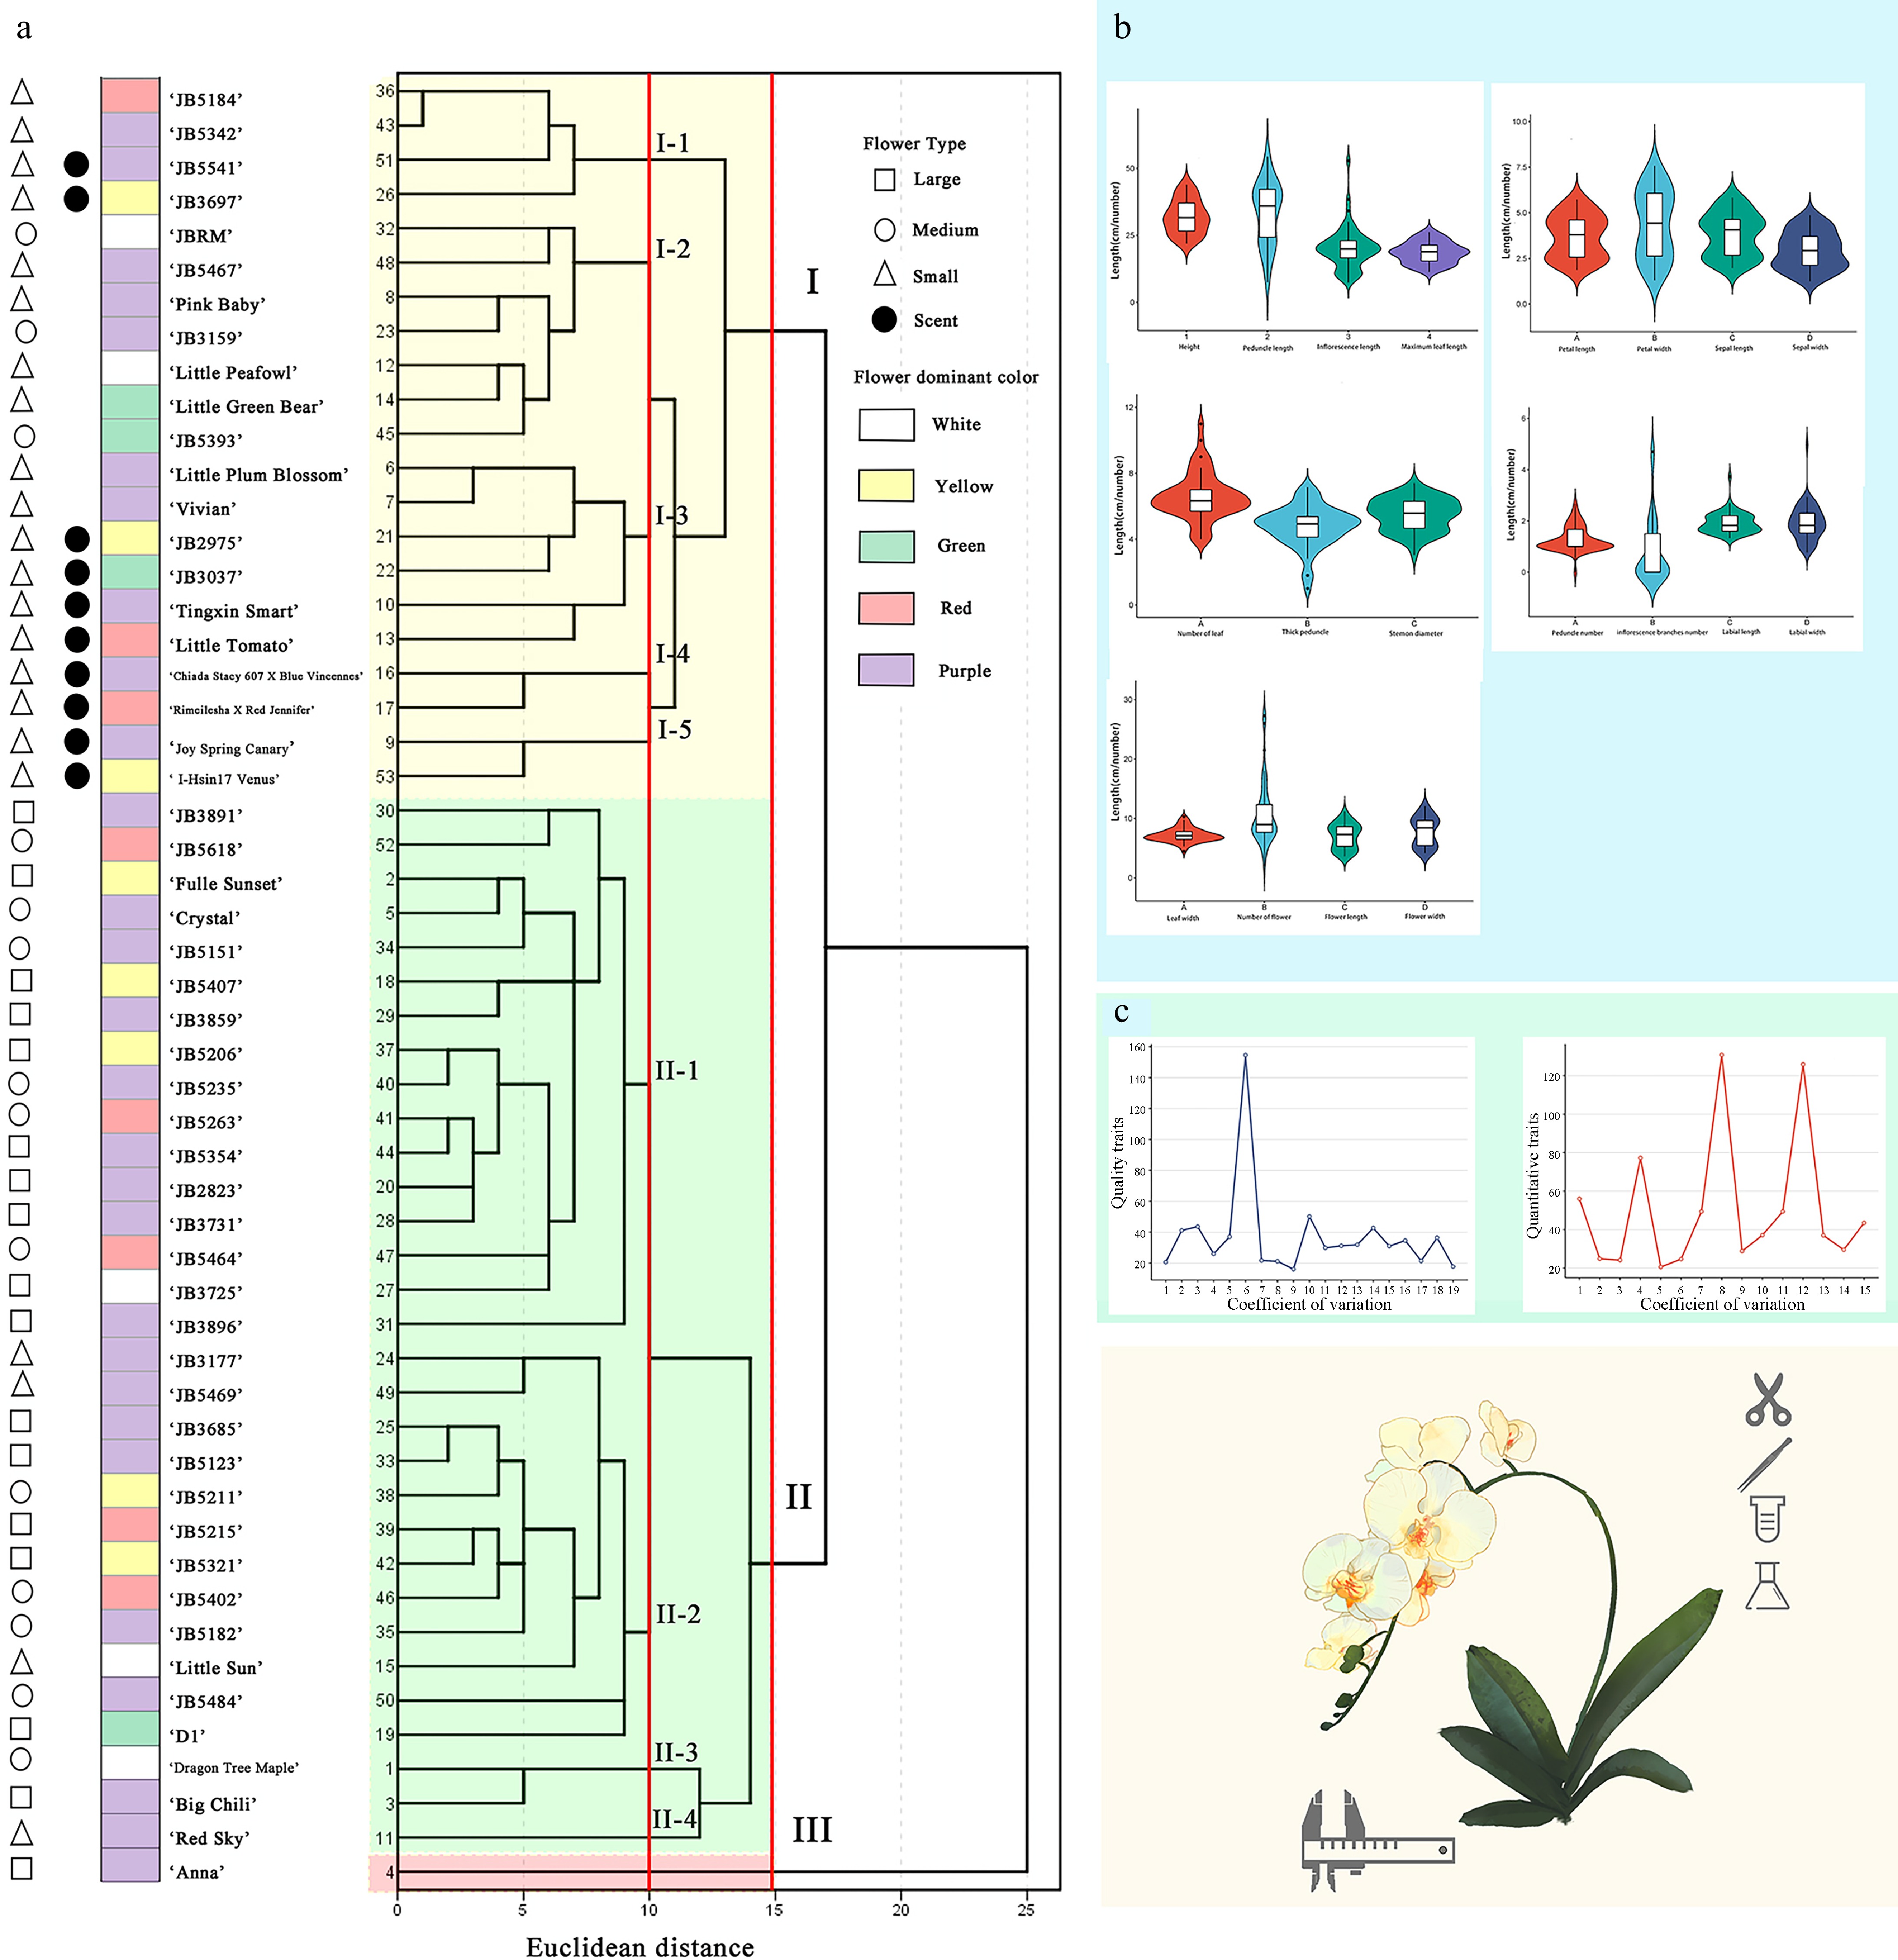
Figure 1.
(a) Q-type cluster analysis of the 53 Phalaenopsis cultivars revealed genetic distances ranging from 1 to 25; (b) The mean value of 19 quantitative traits; (c) Coefficient of variation of 19 quantitative traits and 15 quality traits. (For specific trait characteristics, see Supplementary Table S2).
-
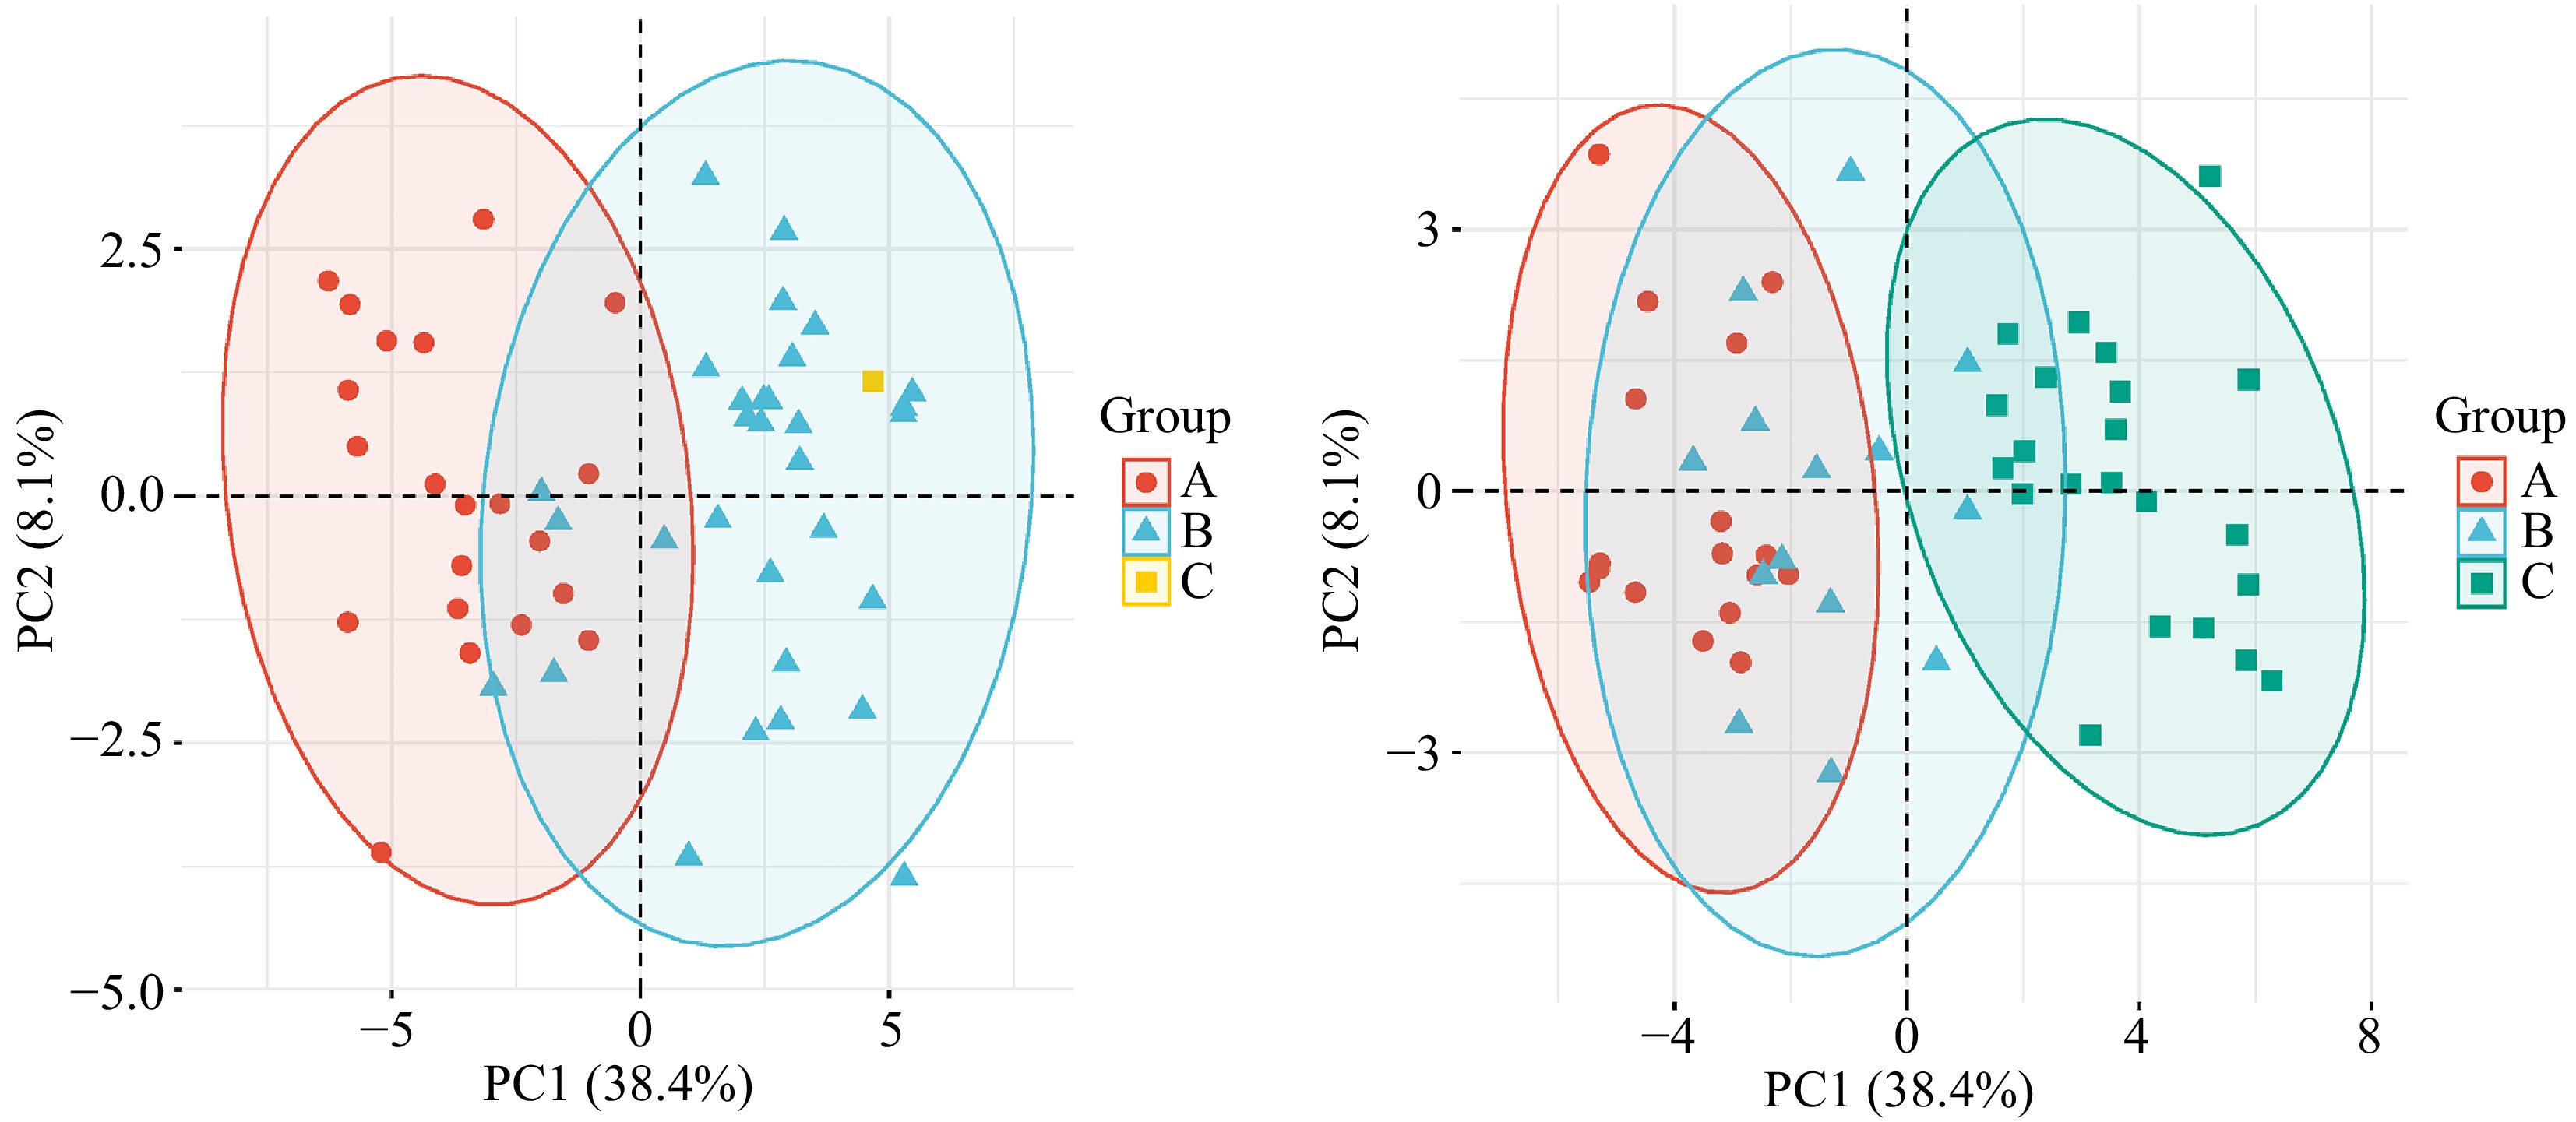
Figure 2.
Based on 34 phenotypic traits, PCA analysis of 53 species of Phalaenopsis.
-
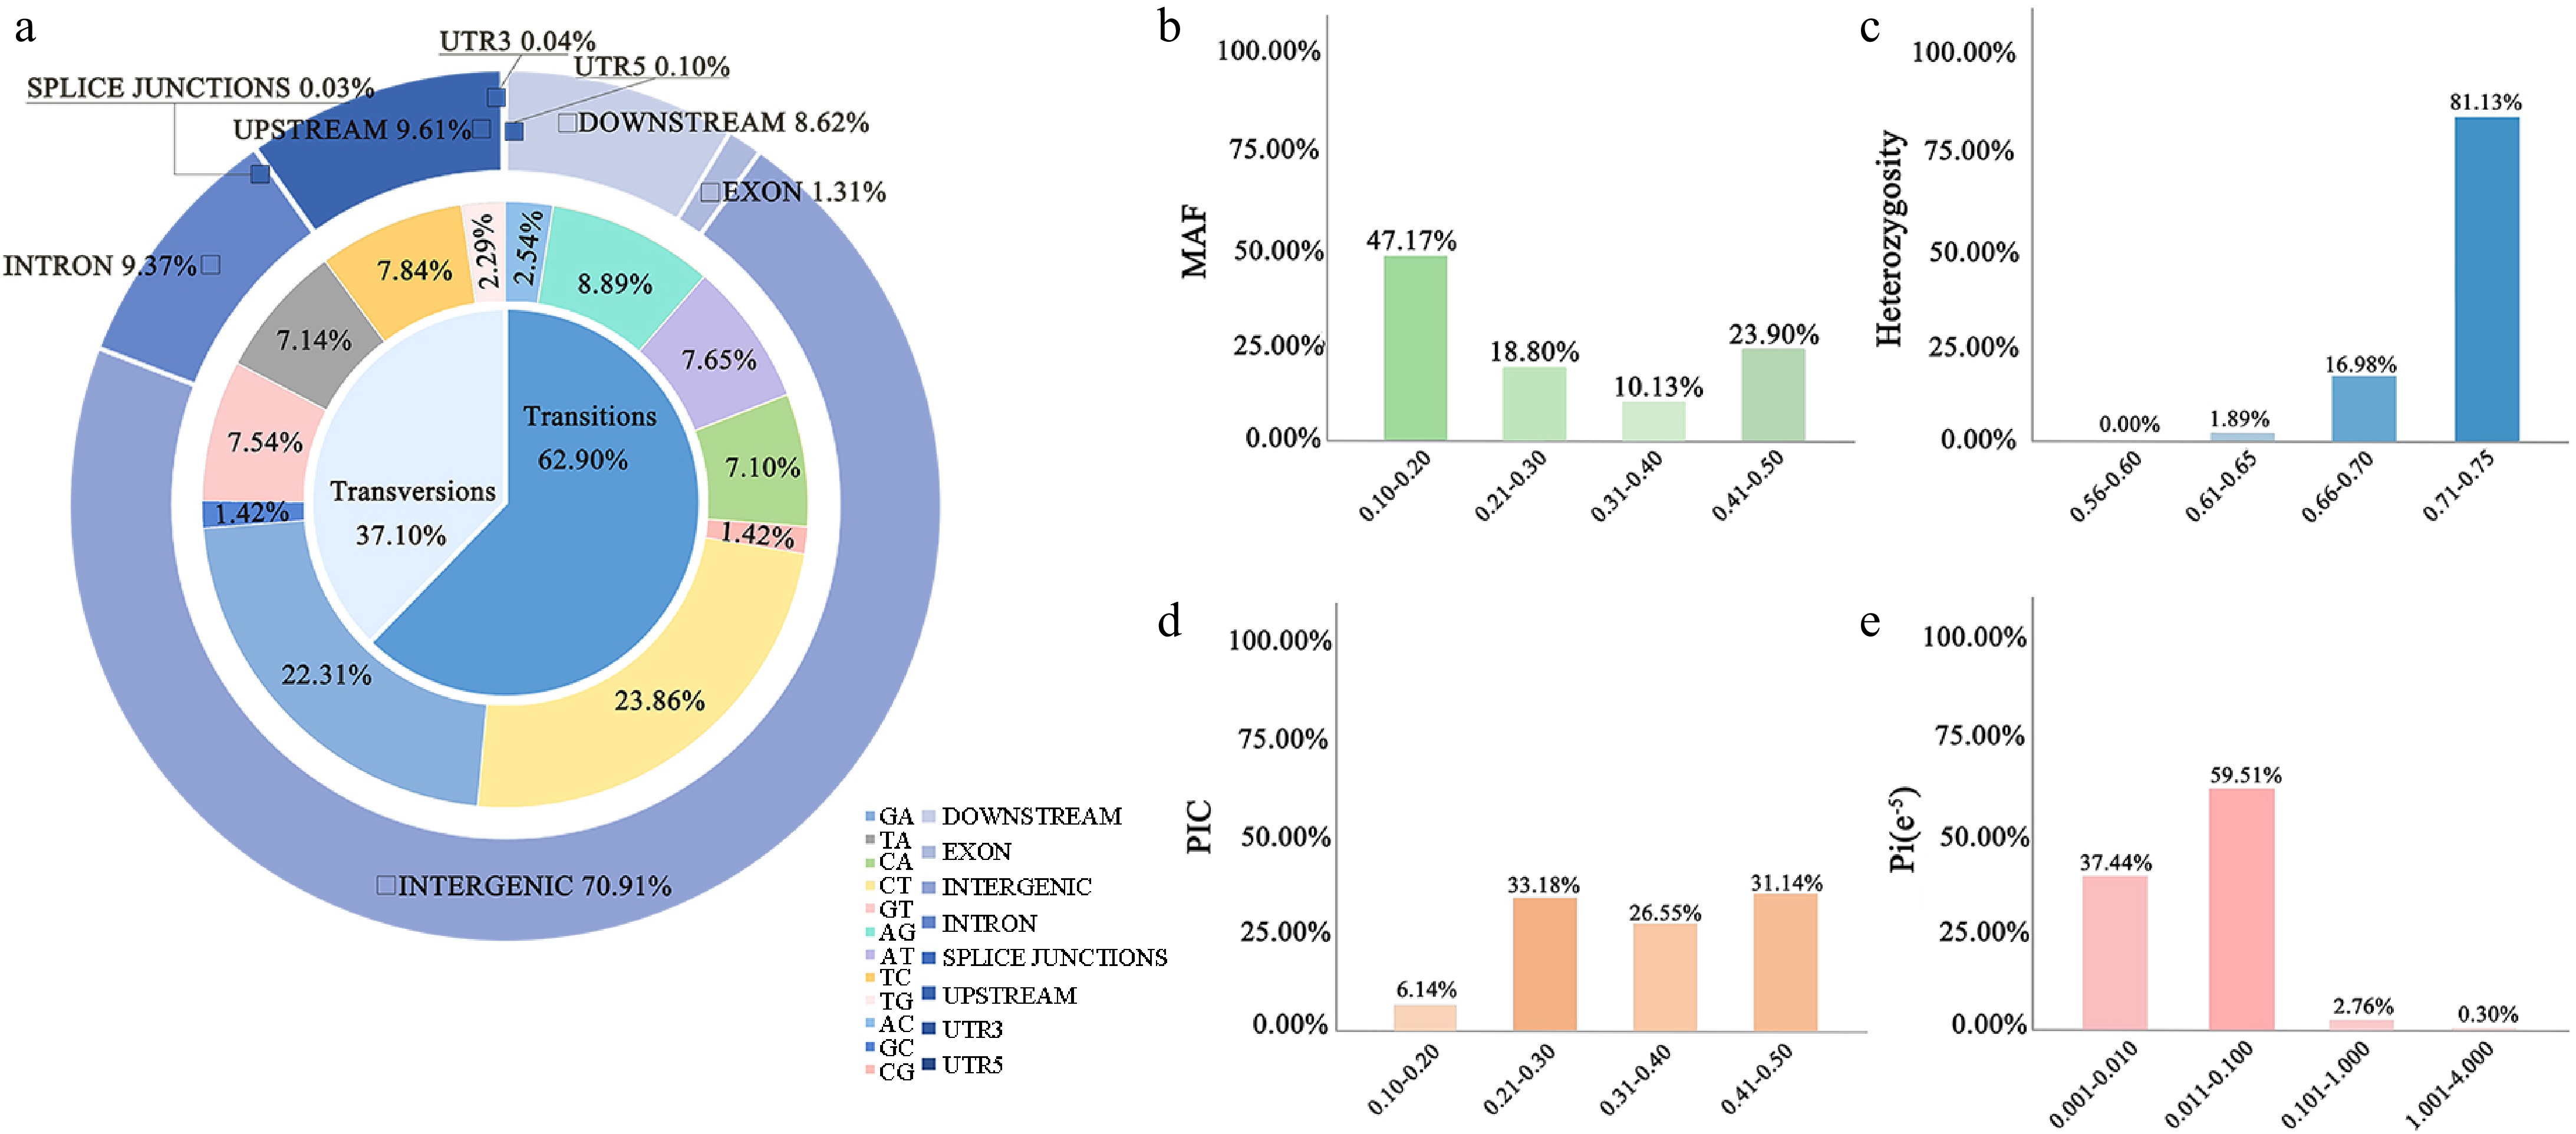
Figure 3.
SNP screening and statistics. (a) The positions of the SNPs in the gene structures. Genotype statistics for the six most commonly identified variants. Genetic information content of 5,984 high-quality markers in 53 cultivars including (b) MAF, (c) heterozygosity rate, (d) PIC, and (e) nucleotide diversity.
-
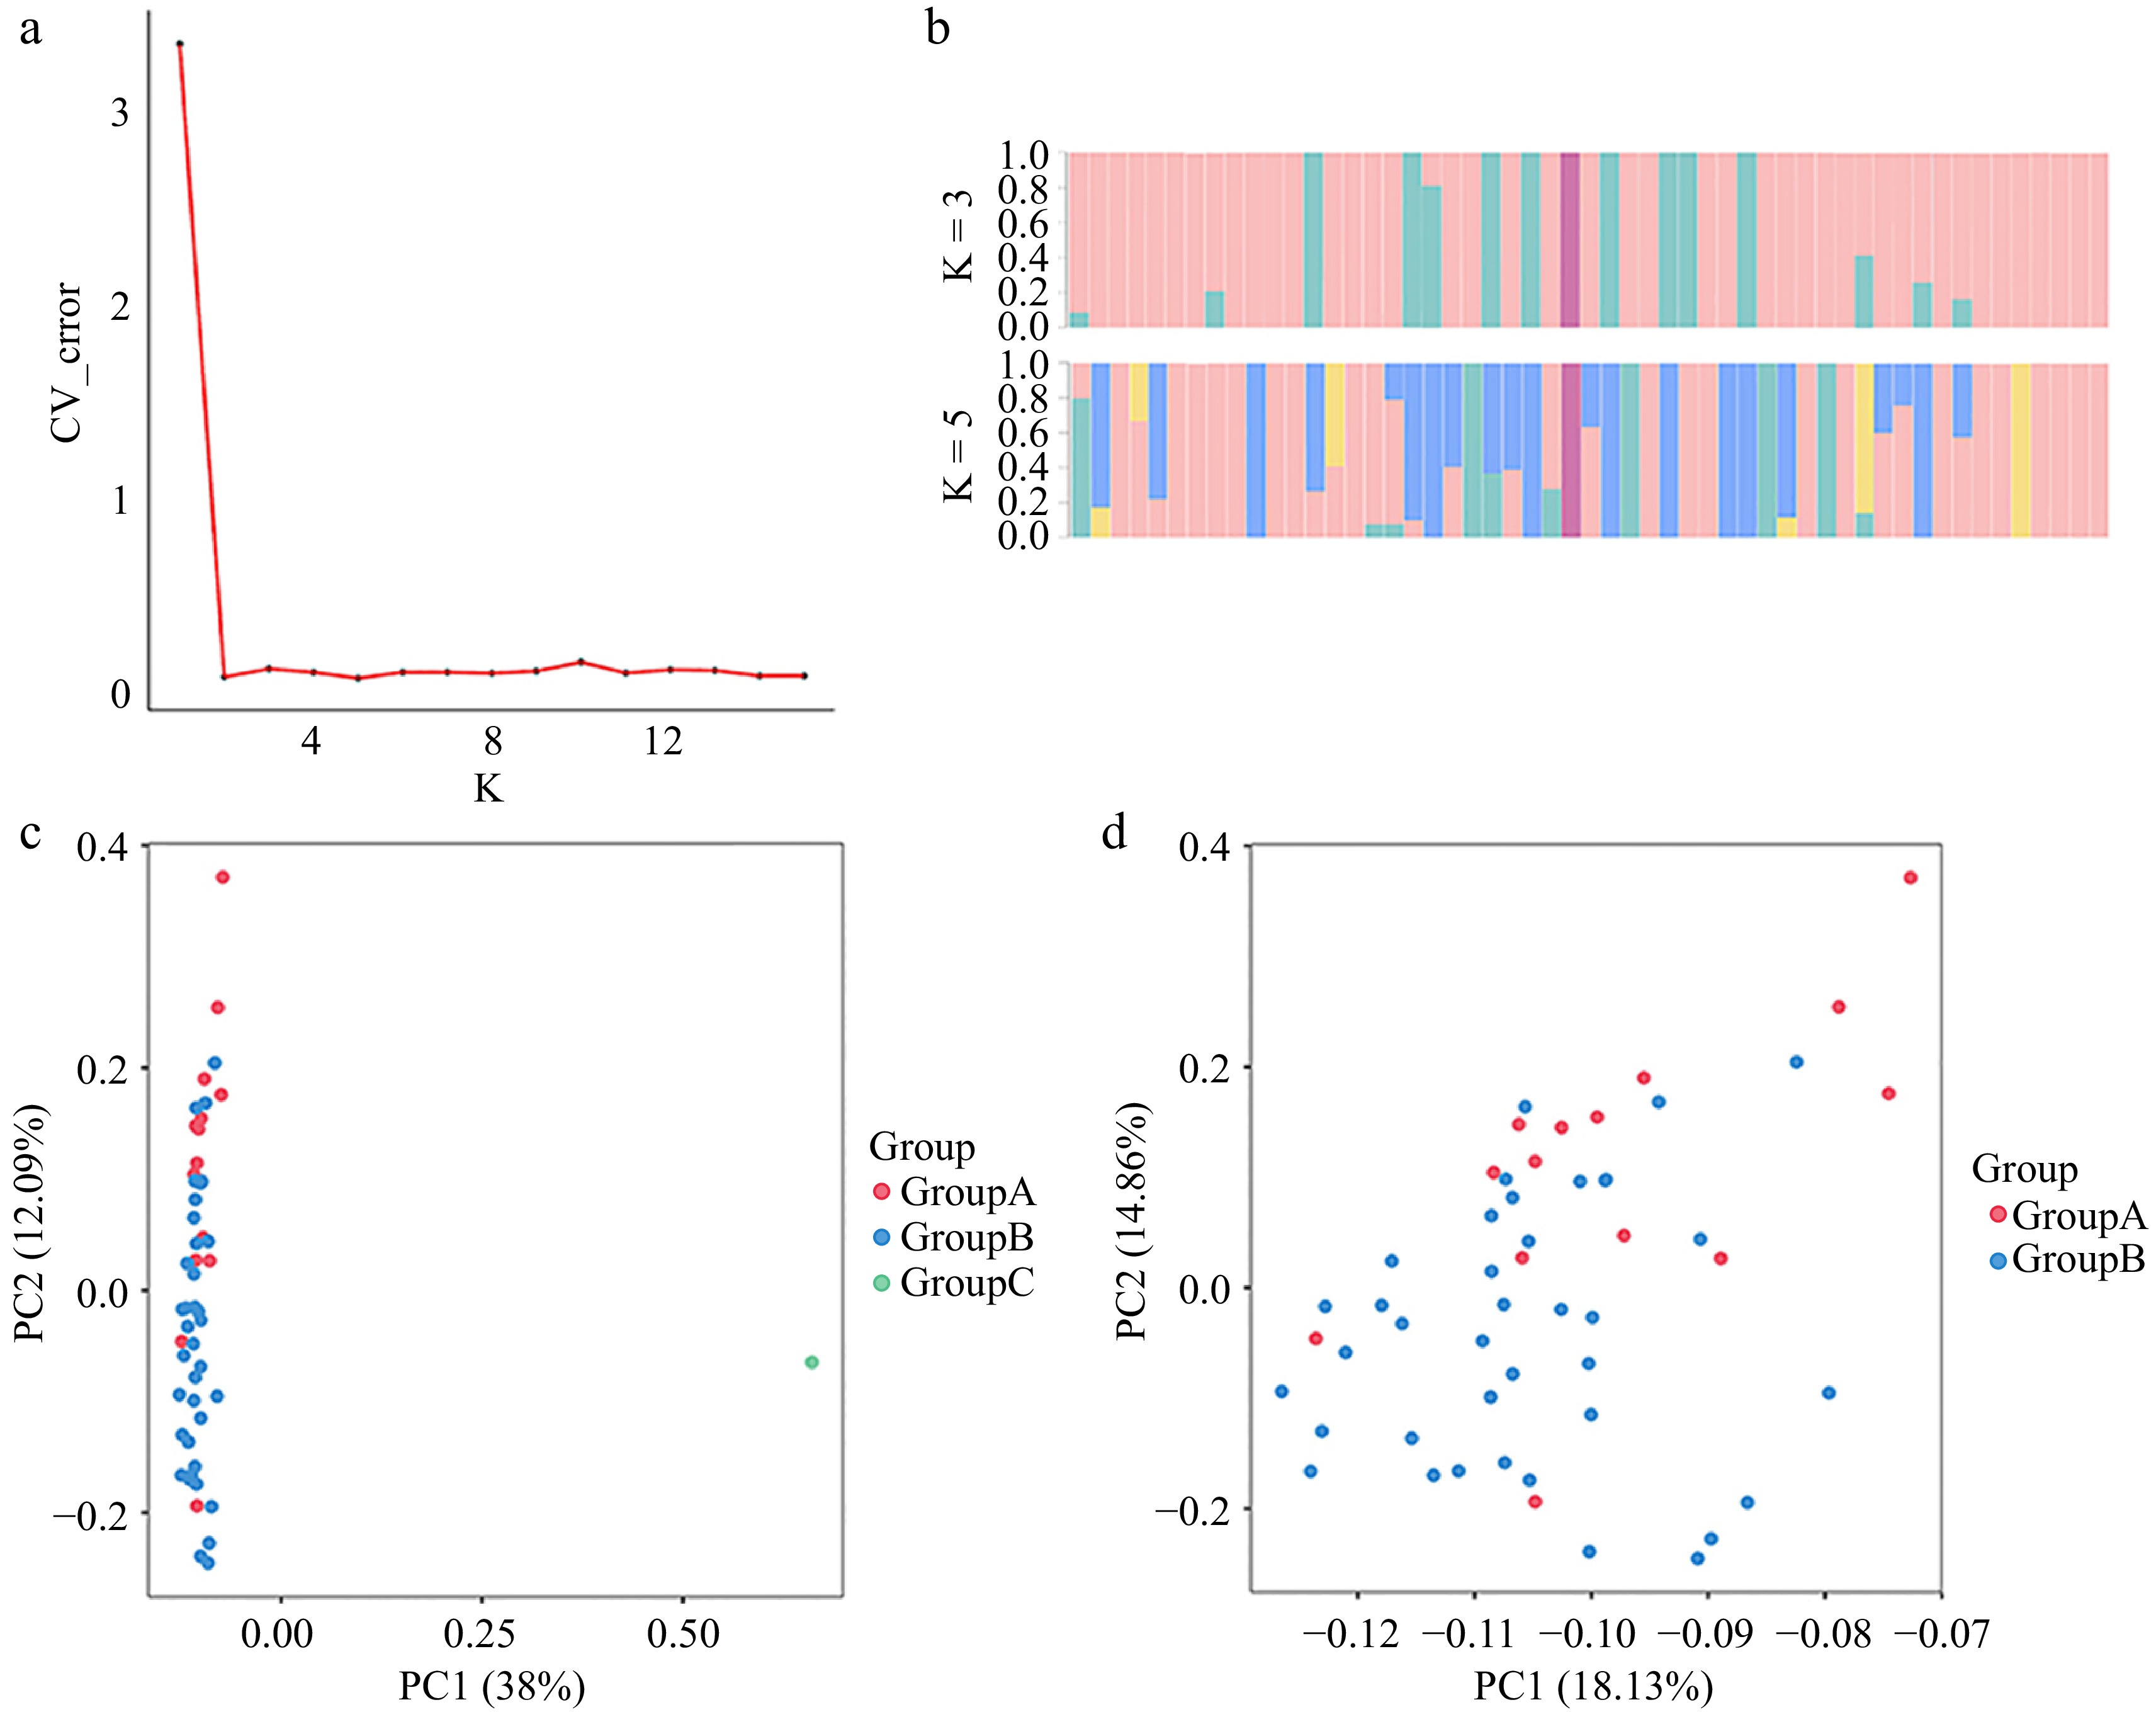
Figure 4.
Genetic diversity analysis. (a) DK values corresponding to different K measurements. (b) Population structure of the 53 germplasm resources at different values of K. (c) Principal component analysis of 53 Phalaenopsis materials. (d) Principal component analysis of 52 Phalaenopsis materials.
-
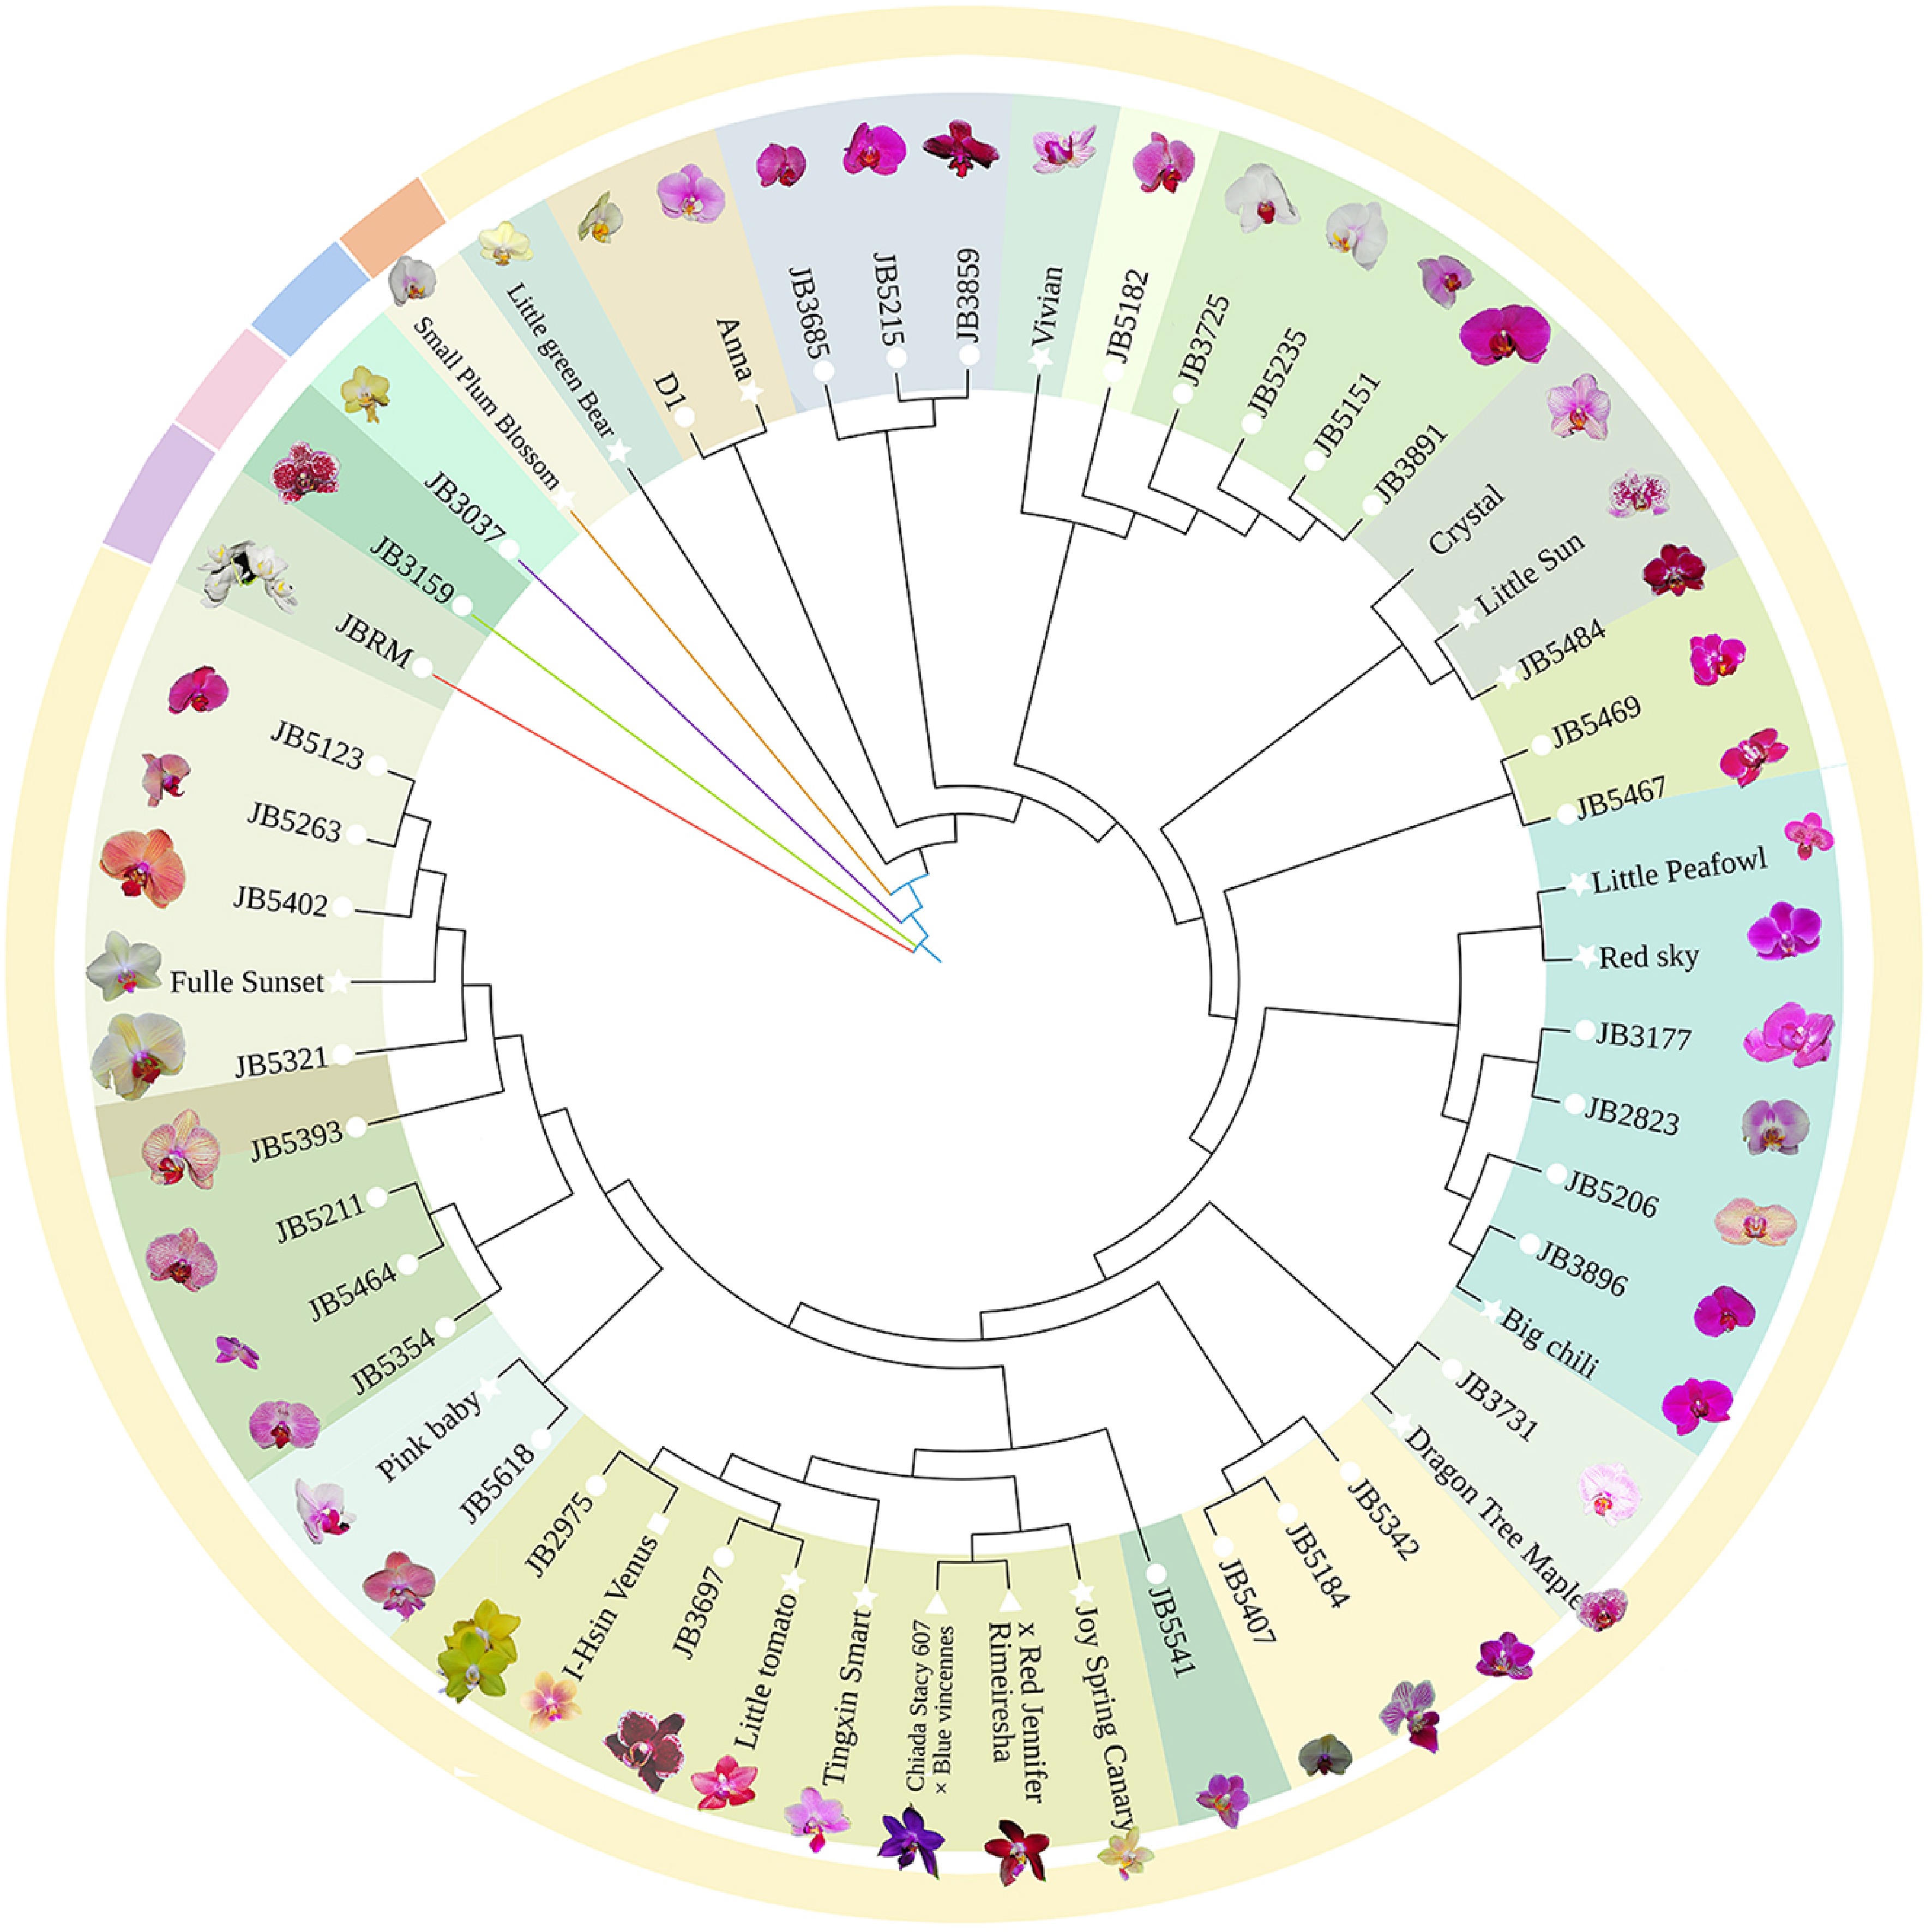
Figure 5.
Phylogenetic tree of 53 cultivars constructed with 5,984 SNP markers.
-
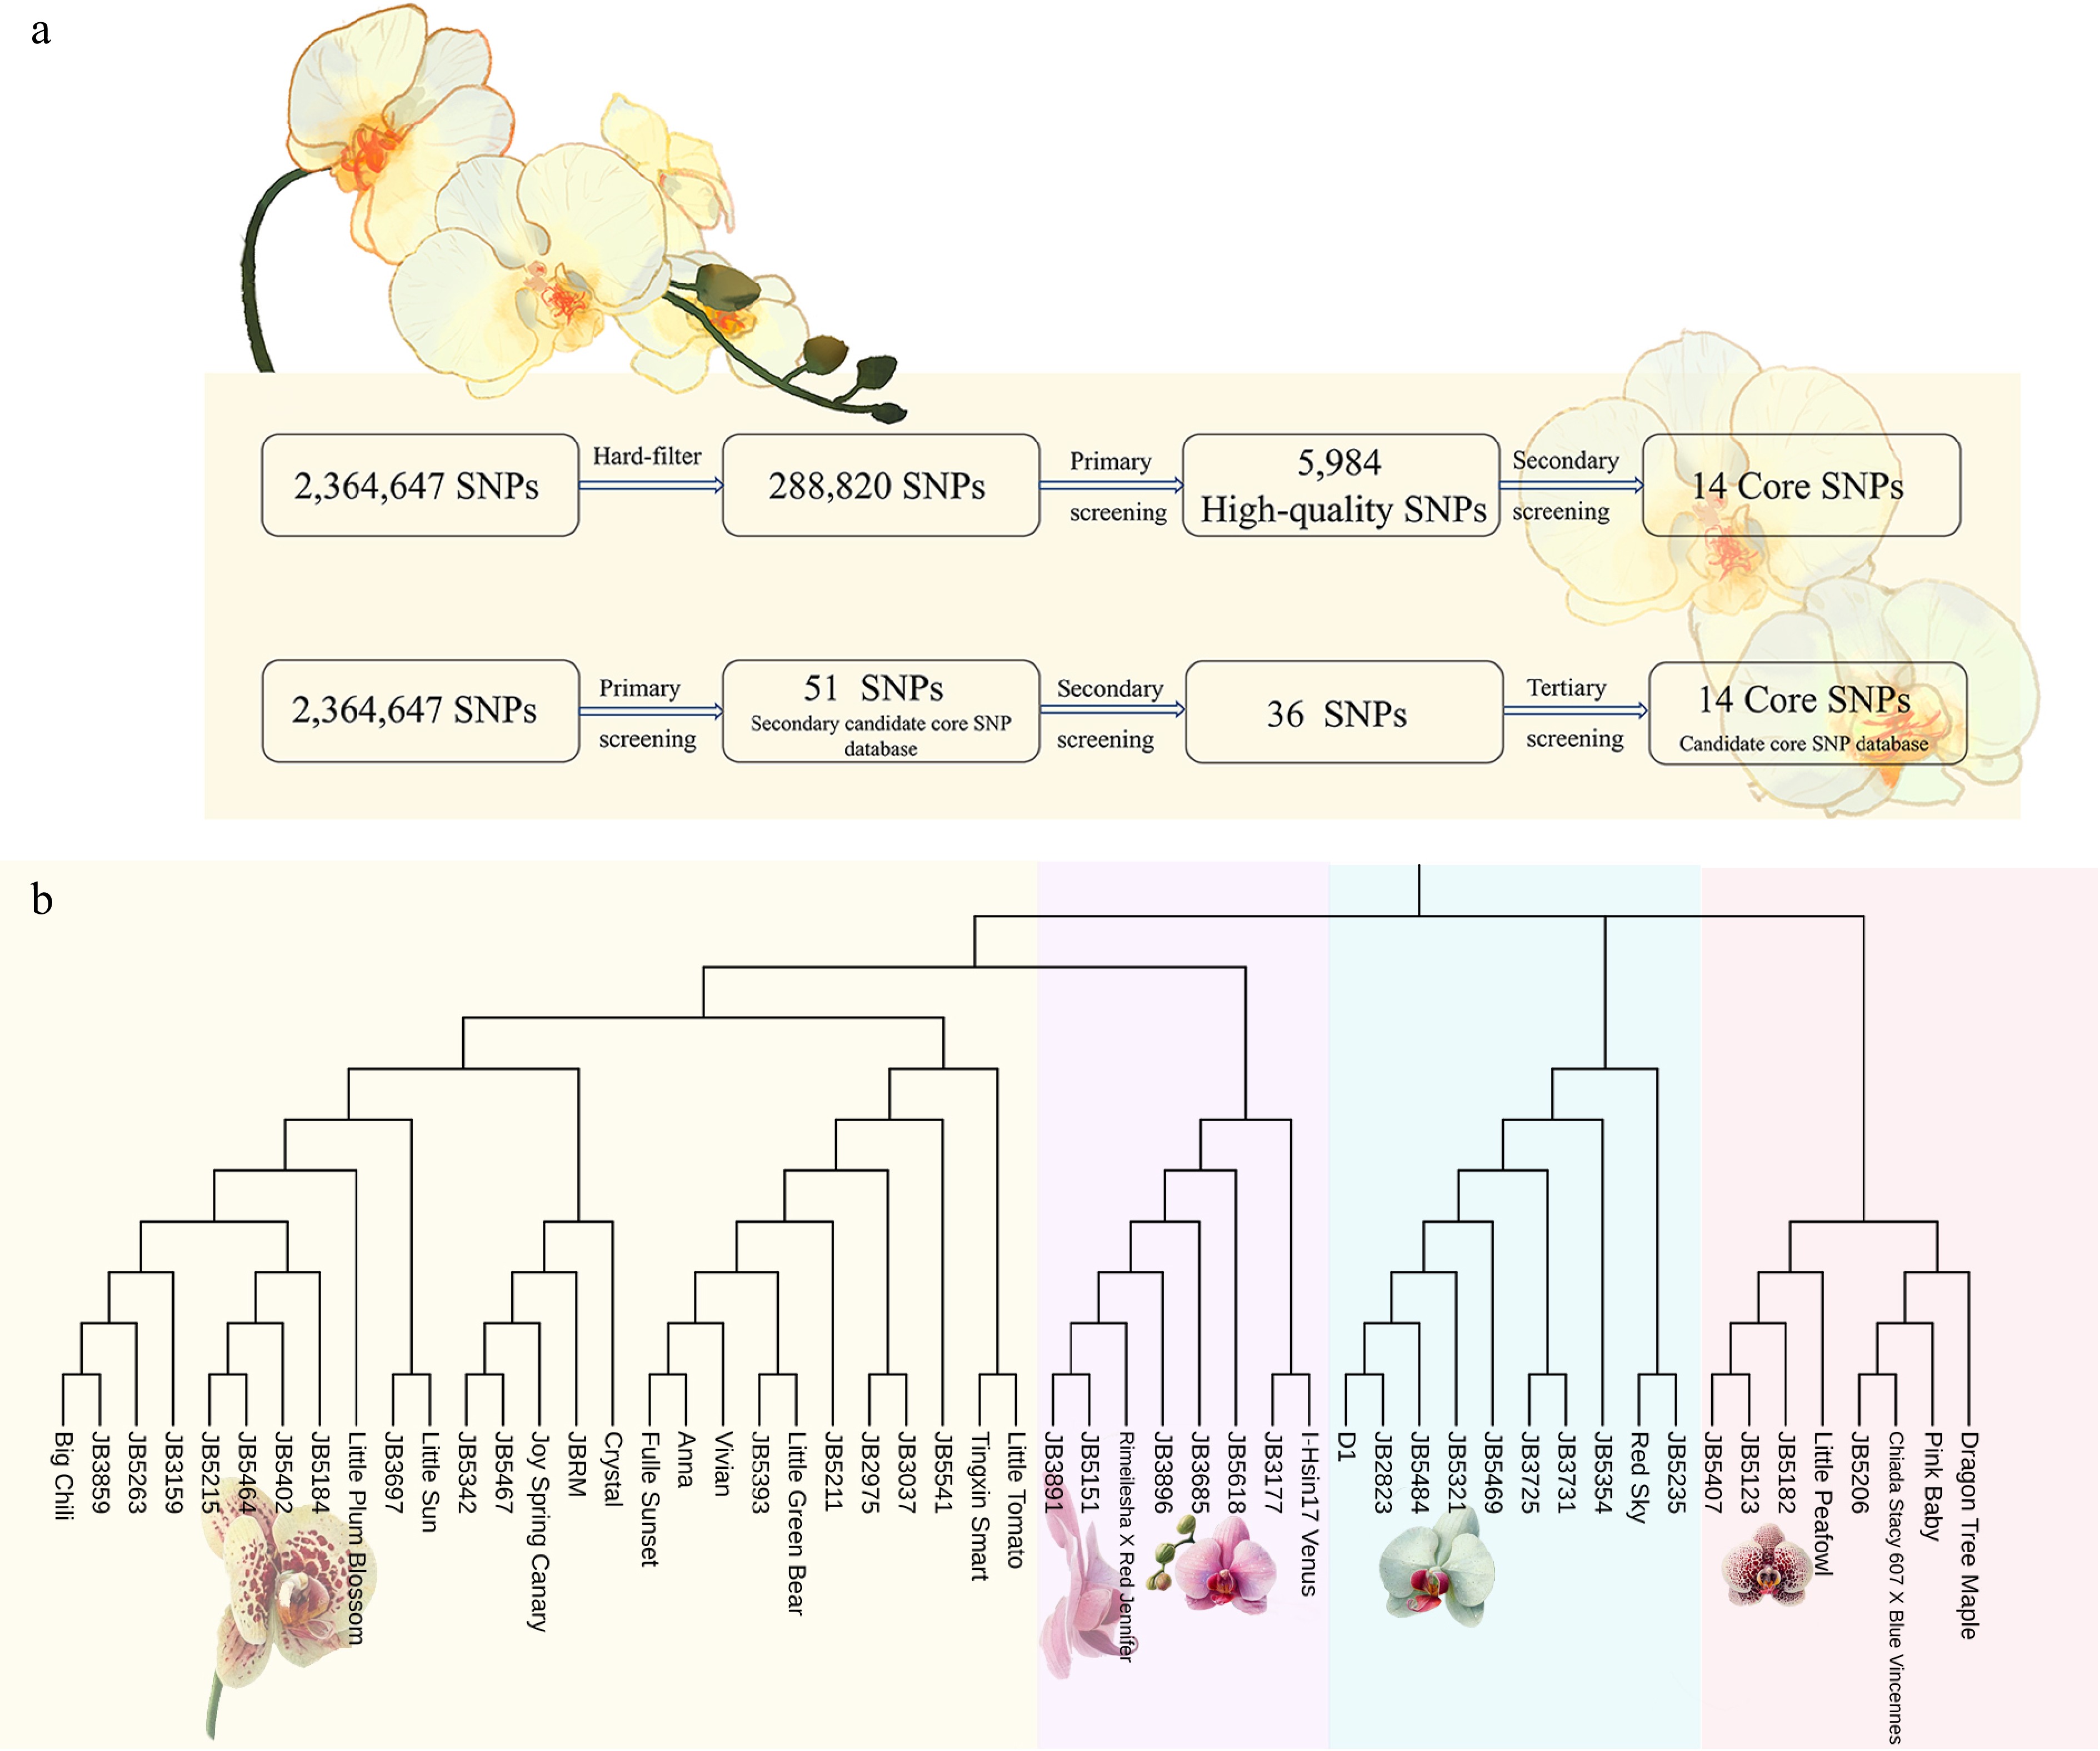
Figure 6.
(a) Flow chart of candidate SNP site screening. (b) NJ tree was constructed based on 14 core SNP sites.
-
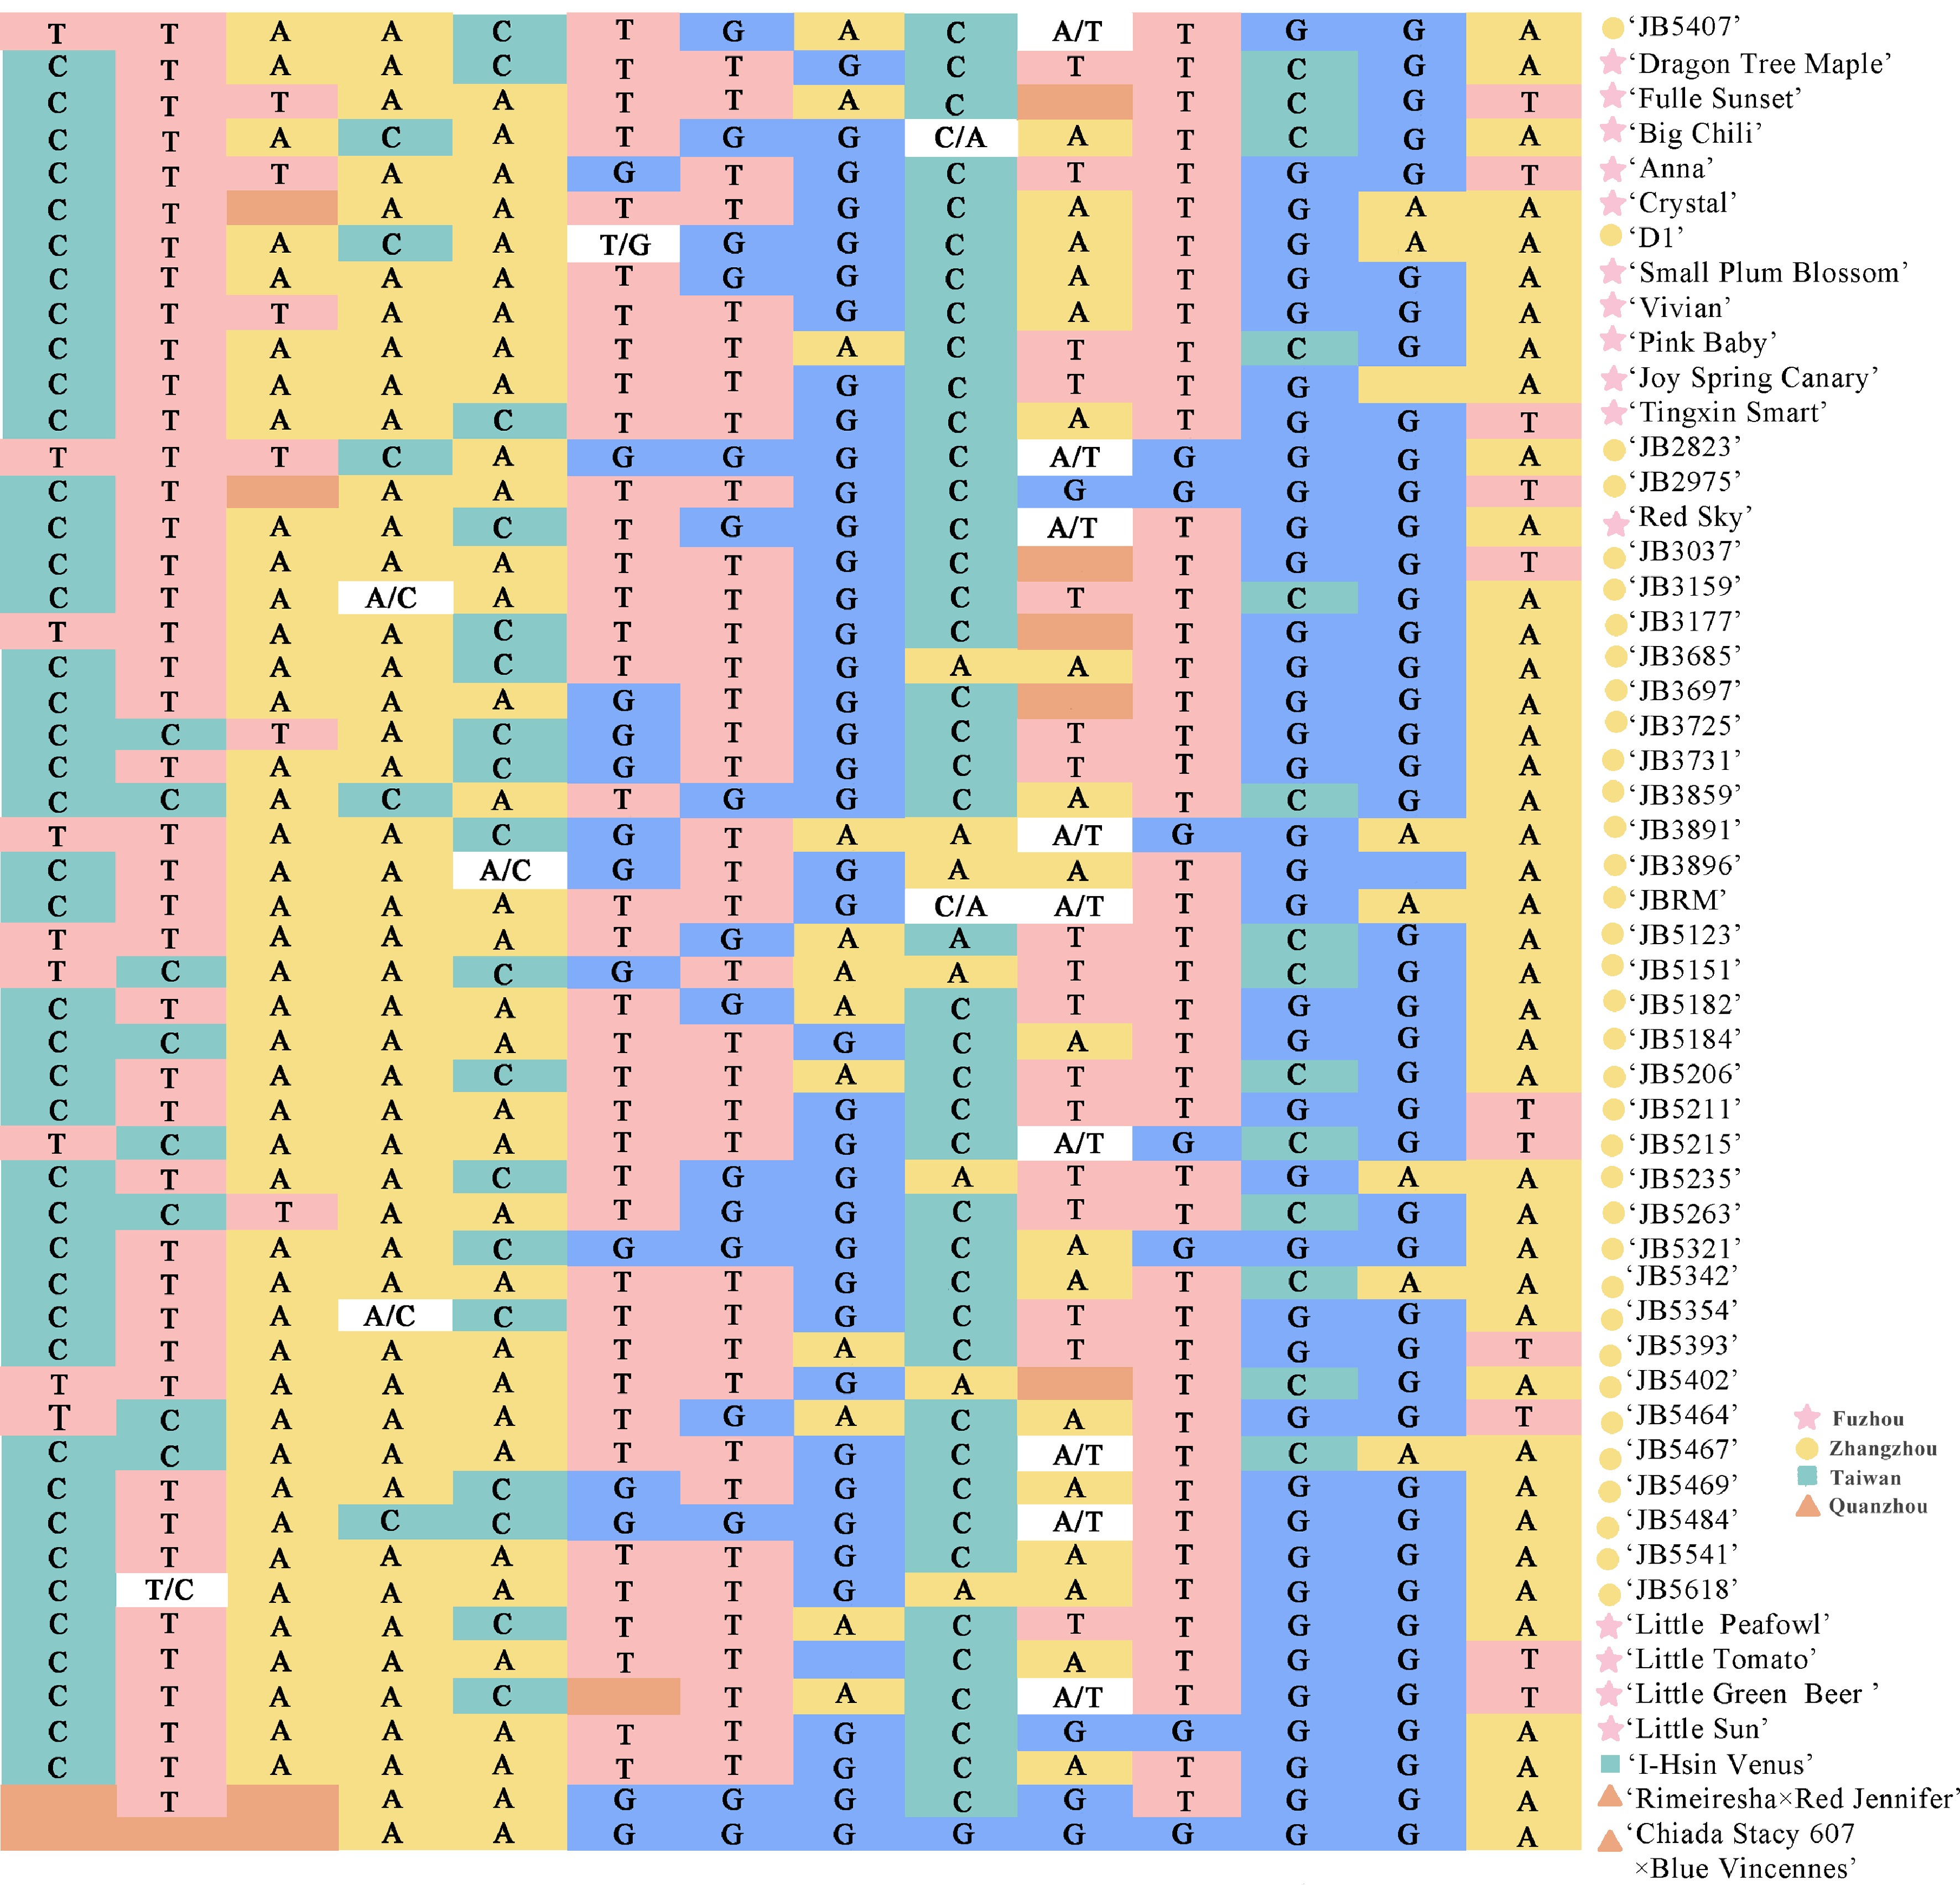
Figure 7.
Fingerprint analysis of 53 Phalaenopsis varieties. Each row represents a sample and each column represents a genome. Pure genotypes are AA = yellow, CC = green, GG = blue, TT = pink; heterozygous genotypes are orange; no call genotypes are white.
-
Chr Variation type MAF PIC Pi scaffold3 T/C 0.18 0.29 1.36E-04 scaffold17 C/T 0.16 0.27 1.33E-04 scaffold87 T/A 0.12 0.21 9.27E-05 scaffold98 C/A 0.11 0.19 9.19E-05 scaffold138 C/A 0.35 0.45 2.29E-04 scaffold142 G/T 0.19 0.31 1.23E-04 scaffold214 G/T 0.27 0.40 1.86E-04 scaffold260 A/G 0.24 0.36 1.68E-04 scaffold480 A/C 0.15 0.26 1.27E-04 scaffold480 T/A 0.50 0.50 3.01E-04 scaffold562 G/T 0.12 0.20 9.92E-05 scaffold943 C/G 0.28 0.40 1.81E-04 scaffold1243 A/G 0.13 0.22 1.04E-04 scaffold4495 T/A 0.23 0.35 1.77E-04 Table 1.
Genetic diversity parameter of core SNPs.
Figures
(7)
Tables
(1)