2025 Volume 5
Article Contents
About this article
ARTICLE   Open Access    

SNP fingerprint database and makers screening for current Phalaenopsis cultivars

More Information
  • The Moth orchid is globally recognized as one of the most popular and important ornamental species. However, due to the complicated history of hybridization, long growth cycles, and industrial vegetative propagation, there are huge challenges in cultivar identification and protection leading to market issues. Consequently, it is important to develop effective and stable markers to identify and preserve core Phalaenopsis cultivar resources. In this study, we collected 53 commercially prevalent Phalaenopsis cultivars in China. Through detailed phenotypic observations, morphological genetic diversity was measured in 19 quantitative and 15 qualitative traits. By genome skimming and the subsequent SNP calling pipeline, we discovered 5,984 high-quality single nucleotide polymorphisms (SNPs) and constructed a comprehensive Phalaenopsis SNP database of cultivars. These SNPs got a high correlation with variation for quantitative traits ranging from 16.09% to 154.60%, while those for qualitative traits spanned from 20.54% to 130.81%. This database demonstrated a high degree of genetic diversity and a robust capacity for identifying polymorphisms and distinguishing among current varieties. These discovered SNPs consist of 12 types, C/T (23.86%), G/A (22.31%), A/G (8.89%), and T/C (7.84%). The ratio of transition to transversion was approximately 1.70. 70.91% of the SNP loci were in intergenic regions, 9.61% in upstream regions, and 9.37% within intronic regions. Fifty three cultivar PCAs could serve as three groups, which was matched with trait clusters. Based on 5,984 SNP sites, we conducted secondary screening and screened out 14 core sites. The clustering results of the NJ tree based on 14 core SNP loci and the NJ tree based on 5,984 whole genome SNP loci were consistent among 53 Phalaenopsis cultivars. Besides, each variety was then encoded with a unique barcode by 14 core SNP markers. This preliminary approach offers a putative and effective tool for variety identification, genetic analysis, and further development of Phalaenopsis germplasm resources.
  • Abiotic stresses such as drought, salinity, and oxidative significantly impact plant growth, development, and productivity, particularly in staple crops grown in challenging environments[1]. Drought stress, in particular, leads to a cascade of physiological and molecular changes, including the accumulation of ROS, which cause cellular damage and impair plant growth[2,3]. Plants have evolved complex mechanisms to counteract these effects, including the modulation of antioxidant enzyme activities and the regulation of ROS homeostasis through the expression of stress-responsive genes[4,5]. Under stress conditions, Fe2+ can activate H2O2 to form hydroxyl radicals (·OH), which possess extremely strong redox potential capable of damaging cellular structures. This disruption can impair normal cellular functions and, in severe cases, lead to cell apoptosis and death[6]. Among the antioxidant-related proteins, ferritins are iron storage proteins that play a pivotal role in maintaining cellular iron homeostasis and regulating oxidative stress responses. These proteins mitigate the toxic effects of excess iron by sequestering it in a biologically inert form, thereby preventing the generation of hydroxyl radicals via the Fenton reaction (Fe2+ + H2O2→Fe3+ + OH + ·OH)[7]. In addition to their well-established role in iron storage, ferritins have been implicated in the regulation of abiotic stress responses in plants. The TaFER5D-1 gene was found to be significantly up-regulated under drought and salt stresses in wheat, over-expression of TaFER5D-1 in Arabidopsis conferred greater tolerance to drought and salt stress[8]. Plant ferritins are localized mainly in chloroplasts, but they can also be targeted to mitochondria, ATFER4 whose role in counteracting the environmental or developmental oxidative conditions in Arabidopsis is ancillary to that of the other isoforms, regardless of its mitochondrial localization[9]. Our experimental results demonstrate that cassava MeFER4 is predominantly localized in chloroplasts, while functional annotation analyses suggest its potential involvement in regulating iron storage and homeostasis. Previous studies confirmed that MeFER4 was significantly associated with drought-related marker-traits[10], which could affect the balance of ROS under stress conditions. Despite these indications, the specific role of MeFER4 in stress tolerance, particularly in response to drought and oxidative stress, remains unclear.

    Cassava, a major tropical staple crop, is highly susceptible to seasonal droughts, which significantly impact its productivity and yield[11]. Understanding the molecular mechanisms underlying cassava stress responses is crucial for developing more resilient cultivars[10,12]. Due to the specific characteristics of cassava-growing regions, the crop frequently encounters various abiotic stresses, including drought, flooding, salinity, and extreme temperatures. These stresses often lead to abnormal accumulation of ROS in plants, disrupting cassava growth and development, reducing yields, and causing significant economic losses[1317]. R2R3-MYB transcription factor MeMYB2 responds to drought, low temperature, and ABA treatment[18]. Furthermore, RNAi-mediated suppression of MeMYB2 enhances cold tolerance in transgenic cassava by promoting anthocyanin accumulation, which effectively scavenges ROS[14]. A CC-type glutaredoxin of MeGRXC3 interacted with two catalases of cassava, MeCAT1, and MeCAT2, and regulated their activity in vivo, thereby affecting cassava drought tolerance[2]. MePP2C1 negatively regulated thermotolerance and redox homeostasis by dephosphorylating MeCAT1S112 and MeAPX2S160[19]. Hence, regulating ROS homeostasis thereby enhances cassava stress tolerance, making it an effective pathway for developing stress-tolerant cassava germplasm.

    Genome-wide association analysis (GWAS) linked MeFER4 with physiological traits such as malondialdehyde (MDA), proline, and antioxidant enzymes (e.g., catalase, CAT; superoxide dismutase, SOD) across different years[10]. We hypothesize that MeFER4 plays a significant role in regulating ROS homeostasis and enhancing plant tolerance to drought and oxidative stress. To test this hypothesis, we conducted gene mapping, expression analysis, and overexpression experiments in Arabidopsis. Our primary objective was to decipher how MeFER4 modulates plant stress adaptation mechanisms. Specifically, we investigated: (1) its physical/functional interactions with core antioxidant enzymes; (2) its regulatory effects on ROS homeostasis; and (3) its overall impact on plant vitality under a comprehensive set of abiotic stresses: drought, oxidative challenge, salinity, and osmotic imbalance. This study provides new insights into the function of ferritins in plant stress physiology and their potential applications in improving crop resilience.

    The coding sequence of MeFER4 was isolated from the cassava cultivar SC124 based on its locus in the cassava genome (https://phytozome.jgi.doe.gov, M. esculenta v8.1). A total of 100 cassava accessions were selected for re-sequencing from germplasm resources collected by our laboratory[10]. Primers were designed to cover the entire candidate coding sequence region (Supplementary Table S1), and the target segments were amplified using polymerase chain reaction (PCR). The resulting sequences were aligned with the MeFER4 coding sequence in the draft cassava genome for SNP identification (Supplementary Table S2). GWAS was performed to analyze the association between SNPs and DTCs following previously described procedures[2,10].

    Arabidopsis thaliana (Col-0) was used as the wild-type plant for all experiments. Transgenic Arabidopsis lines overexpressing MeFER4 (OE-6, OE-7, and OE-10) were generated and confirmed by PCR using eGFP-specific primers (Supplementary Table S1) and Western blot analysis was conducted using anti-GFP and anti-Actin antibodies to verify the expression of the MeFER4-GFP fusion protein in transgenic lines. Plants were grown in a controlled growth chamber under 8 h light/16 h dark photoperiod, 22 °C temperature, and 60% relative humidity.

    The MeFER4 gene was amplified from SC124 cassava cDNA using specific primers (Supplementary Table S1). The coding sequence was cloned into the pCAMBIA1300 vector with an eGFP tag under the control of the CaMV35S promoter. The resulting construct was transformed into Agrobacterium tumefaciens strain LBA4404 and used for Arabidopsis transformation. The coding sequence was cloned into the pNC-GBKT7 (provided by Dr. Yan Pu[20]) with an MYC tag and GAL4 DNA binding domain under the control of the ADH1 promoter. The resulting construct was transformed into the yeast strain Y2H Gold and used for yeast two-hybrid screening. The coding sequence was cloned into the pCAMBIA1300-NLUC vector with an NLUC tag under the control of the CaMV35S promoter. The resulting construct was transformed into Agrobacterium tumefaciens strain LBA4404 and used for split-LUC assays. The coding sequence was cloned into the pSPYNE-35S vector with a YFP-N tag under the control of the CaMV35S promoter. The resulting construct was transformed into Agrobacterium tumefaciens strain LBA4404 and used for Bimolecular Fluorescence Complementation (BiFC) Assay.

    For drought stress experiments, two different approaches were utilized. First, mature leaves of Arabidopsis plants were excised for a detached leaf water loss assay, where the leaf water loss rate (LWLR) was measured over 24-h. Second, drought stress was directly applied to potted seedlings by withholding water for 23 d, and leaf wilting was observed. Each sample consisted of homogenized mature leaf tissue (from third to fifth leaves) from three plants of each line and was treated as one of three biological replicates.

    For ABA sensitivity assays, 3-week-old Arabidopsis plants were with 40 μM ABA for 3 d. Leaves were collected for 3,30-diaminobenzidine (DAB) staining to assess ROS accumulation. Three-week-old Arabidopsis plants were sprayed with 3% H2O2 or 50 μM MV. After 24 h, leaves were collected for DAB staining to visualize ROS accumulation. Arabidopsis seedlings were grown on MS medium supplemented with 110 mM NaCl or 300 mM mannitol for 3 d. Phenotypic changes, including chlorosis and necrosis, were documented, and leaves were collected for ROS assessment by DAB staining. Expression levels of stress-responsive and antioxidant-related genes were analyzed by qRT-PCR.

    DAB was performed as previously described by Guo et al.[14]. To detect the presence and distribution of hydrogen peroxide in plant cells, mature leaves of 3-week-old Arabidopsis plants were incubated at room temperature for 2 h with 1 mg mL−1 DAB staining solution, which was freshly prepared in 10 mmol L−1 phosphate buffer (pH 7.8) and 0.05% (v/v) Tween 20. Leaves were then immersed in a bleaching solution (ethanol : acetic acid : glycerol, 3:1:1). Average optical density of DAB staining was quantified using the IHC-Toolbox plugin in ImageJ software (https://imagej.nih.gov/ij).

    Total RNA was extracted from Arabidopsis leaves using 100 mg of leaf tissue and an RNAprep Pure Plant Plus Kit (DP441, Tiangen Biotech, Beijing, China). First-strand cDNA was synthesized using a FastKing gDNA Dispelling RT SuperMix (Tiangen) per the manufacturer's instructions. qRT-PCR was performed with gene-specific primers to analyze the expression of ROS-related marker genes, including MPK11, SOD, CAT1, PER5, PER63, PER66, APX1, APX3, and APX5 (Supplementary Tables S1 & S3). The MeActin gene was used as a reference[14]. Relative expression levels were calculated using the ∆∆Ct method[14]. All PCR reactions were performed using a Step-One Plus Real-time PCR system (ABI, Carlsbad, CA, USA) using TB Green Premix Ex Taq II (Tli RNaseH Plus) (RR820A, TaKaRa, Dalian, Liaoning, China).

    Y2H was performed as previously described by Guo et al.[14]. The full-length MeFER4 coding sequence was cloned into the pNC-GBKT7 vector (bait vector) and confirmed by sequencing. The specific primers are listed in Supplementary Table S1. The bait vector and Arabidopsis yeast library plasmid DNA were co-transformed into competent yeast cells and positive clones were selected on a selective synthetic dropout (SD) medium at 30 °C using the Matchmaker Gold Yeast-Two-Hybrid Library Screening System (Clontech-TaKaRa). Positive clones were identified on SD/-Trp/-Leu/-His/-Ade media and sequenced. Candidate interactors were further analyzed. BD-p53 + AD-T and BD-lam + AD-T served as positive and negative controls, respectively.

    For the BiFC assay, MeFER4-NYFP, APX1-CYFP, and MeAPX3-CYFP were constructed according to the protocol of Guo et al.[2]. The coding sequences of MeFER4, APX1, and APX3 were cloned into pSPYNE-35S and pSPYCE-35S vectors, respectively. Agrobacterium tumefaciens strain LBA4404 harboring the BiFC constructs was cultured in LB medium supplemented with 50 mg/L rifampicin and 50 mg/L kanamycin at 28 °C overnight. Then, Agrobacterium carrying the vectors were infiltrated into Nicotiana benthamiana leaves and cultured in a greenhouse for 3 d at 28 °C with 16 h light/8 h dark. After 3 d, the fluorescence from the evaluated protein-YFP fusions and the nuclear marker (MebHLH122, a bHLH transcript factor) signal were detected by confocal microscopy (Leica TCS-SP8, Germany).

    The split-LUC assay was performed as previously described by Guo et al.[21]. To validate the interaction between MeFER4 and its target proteins, we performed a split-LUC complementation assay using a tobacco transient expression system. Recombinant plasmids harboring MeFER4-nLUC/cLUC-fusion constructs (cloned into the pCAMBIA vector) were co-infiltrated into young leaves of Nicotiana benthamiana via Agrobacterium tumefaciens (strain LBA4404)-mediated transformation. At 48 h post-infiltration (hpi), a 1 mM D-luciferin potassium salt solution (Solarbio, China) containing 0.01% Triton X-100 was injected into the abaxial leaf surface. Leaves were dark-adapted for 10 min to facilitate substrate permeabilization. Luminescence signals were captured using a cryogenic CCD imaging system (Night SHADE LB985, Berthold Technologies, Germany) at 22 °C with a 5-min exposure time. Photon flux quantification was conducted using Indigo 2.0 software. To minimize background noise, empty vector-infiltrated leaves were included as negative controls. The experiment included three independent biological replicates, each containing five technical replicates.

    The protein sequences of MeFER4, APX1, and APX3 were retrieved from the phytozome database (https://phytozome.jgi.doe.gov, M. esculenta v8.1 and TAIR 10) in FASTA format and preprocessed to ensure sequence quality by removing signal peptides or transmembrane regions.

    Protein structures were predicted using AlphaFold3 (https://golgi.sandbox.google.com), where single-chain models were first generated for each protein, followed by docking models for MeFER4 with APX1 and APX3 through multi-sequence alignment. The AlphaFold3 pipeline was run with de novo prediction settings (use_templates = False, and num_recycles = 3, model quality was assessed using pLDDT and PAE scores. The resulting structures were saved as individual and complex cif files for further analysis.

    The docking models were visualized in PyMOL (https://pymol.org) to identify interaction interfaces, with residues within 5 Å proximity of the binding partner highlighted. Key interaction residues were analyzed for hydrogen bonds, salt bridges, and hydrophobic interactions using PyMOL and Discovery Studio. Visualization included secondary structure representation and residue annotation, with MeFER4, APX1, and APX3 colored green, blue, and interacting residues magenta. Outputs included predicted structures, annotated interaction residues, high-resolution images.

    Subcellular localization analysis was performed as previously described by Guo et al.[14]. A full-length coding sequence of MeFER4 without a stop codon was amplified from SC124 cassava leaf cDNA using gene-specific primers. The fragment was cloned into the pG1300-GFP vector and confirmed by sequencing. The OsPHT4-mCherry plasmid, localized to the chloroplast, was used as a positive control for subcellular localization experiments[22]. Leaves from 6-week-old tobacco (Nicotiana benthamiana) plants were transformed by infiltration, using a 1 mL syringe without a needle, of Agrobacterium cells (OD600 = 1.0) harboring OsPHT4-mCherry plasmid, MeFER4-GFP plasmid, mCherry vector, and 35S:pG1300 vector, were mixed to 1:1, respectively. After 2 d, infiltrated tobacco leaves were examined for GFP and RFP fluorescence and imaged with a confocal laser scanning microscope (FluoView FV1100, Olympus, Japan).

    All experiments were performed with at least three biological replicates. Data were analyzed using one-way ANOVA followed by Tukey's test for multiple comparisons. Differences were considered statistically significant at p < 0.05.

    In this study, the MeFER4 gene was mapped to Chromosome 8, spanning a region from 25,031,300 to 25,033,800 bp (Fig. 1a). Structural analysis revealed conserved ferritin domains, including Euk-ferritin and Ftn, which are essential for iron storage and homeostasis (Fig. 1a). GWAS analysis linked MeFER4 to DTCs, including MDA, proline, and antioxidant enzymes (CAT, SOD, and peroxidase (POD)) across two years (Fig. 1b). Expression analysis demonstrated that MeFER4 was upregulated under drought stress in the cassava cultivar SC124 (Supplementary Fig. S1a) and in mature leaves of several cassava cultivars with different genotypes (Supplementary Fig. S1b). Subcellular localization confirmed that MeFER4 is localized in the chloroplast (Supplementary Fig. S1b). To further investigate its stress resistance function, we generated MeFER4 overexpression transgenic Arabidopsis lines. PCR results showed the presence of a specific 720 bp (eGFP) band in the OE-6, OE-7, and OE-10 lines (Supplementary Fig. S1c), and Western blotting detected the MeFER4-GFP fusion proteins (~50 kDa), with anti-Actin used as a loading control (Supplementary Fig. S1d). These findings confirm that MeFER4 is responsive to drought stress and that the overexpression lines have been successfully established.

    Figure 1.  MeFER4 is associated with drought-related physiological traits in cassava cultivars under drought stress. (a) Schematic diagram of the MeFER4 locus in the cassava genome (version 08). (b) SNPs in the MeFER4 Coding Sequence (CDS) region are correlated with drought-related trait coefficients, including MAD (MDA-L-2014, MDA-R-2014, MDA-L-2015, MDA-R-2015), proline (Proline-L-2014, Proline-R-2014, Proline-L-2015, Proline-R-2015), catalase (CAT-L-2014, CAT-R-2014), superoxide dismutase (SOD-L-2015), and peroxidase (POD-R-2015) in 100 cultivated cassava germplasms under drought stress. Horizontal lines represent significance thresholds at Y = −log10(0.01) and Y = −log10(0.05). (c) MeFER4 affects the water retention capacity of Arabidopsis leaves. (d) Water loss rate of detached leaves within 24 h. Asterisks indicate significant differences from wild-type plants, determined by Student's t-test (* p < 0.05).

    In the potted seedling drought stress experiment, the transgenic lines exhibited more severe wilting and senescence under drought conditions compared to the wild-type plants (Supplementary Fig. S2a). After 23 d of drought stress, their survival rate was significantly lower than that of the wild-type plants (Supplementary Fig. S2b). DAB staining analysis revealed significantly higher ROS accumulation in the transgenic lines compared to the wild-type plants under drought stress (Supplementary Fig. S2cd). The transgenic lines enhanced sensitivity to drought stress, as evidenced by severe leaf wilting after just 12 h of dehydration, in contrast to the wild-type plants (Fig. 1c). LWLR analysis showed significantly higher LWLR in MeFER4-overexpressing lines (OE-6, OE-7, OE-10) compared to the wild-type plants, indicating impaired water retention under drought conditions (Fig. 1d). These findings suggest that MeFER4 plays a role in drought stress responses and water retention, potentially through its involvement in regulating oxidative stress.

    Transgenic lines (OE-6, OE-7, OE-10) exhibited pronounced leaf yellowing compared to wild-type plants under ABA application (Fig. 2a). Moreover, DAB staining indicated higher ROS accumulation in transgenic lines under ABA treatment (Fig. 2a). Quantitative analysis of average optical density confirmed significantly elevated ROS levels in transgenic lines (Fig. 2b).

    Figure 2.  MeFEE4 transcription level enhances ABA sensitivity and regulates the expression of stress-responsive genes in Arabidopsis. (a) Phenotypic differences in wild-type and MeFER4-overexpressing Arabidopsis lines (OE-6, OE-7, OE-10) under control (CK), and ABA treatment conditions. Top: Leaf coloration and phenotype under CK and ABA treatment. Bottom: DAB staining for ROS accumulation in wild-type and transgenic lines, indicating oxidative stress under ABA treatment. Scale bar = 1 cm. (b) Quantification of ROS accumulation by average optical density in DAB-stained leaves under ABA treatment. Data represent means ± SD (n = 3). Asterisks indicate significant differences compared to wild-type plants (* p < 0.05, ** p < 0.01). (c) Relative expression levels of stress-responsive genes, including MPK11, SOD, CAT1, PER5, PER66, and APX3, in wild-type and MeFER4-overexpressing lines under ABA treatment. Data represent means ± SD (n = 3). Asterisks indicate significant differences compared to wild-type plants (* p < 0.05, ** p < 0.01).

    To investigate the molecular basis of ABA hypersensitivity in transgenic lines, we analyzed key stress-responsive genes in WT and transgenic lines via qRT-PCR (Fig. 2c). MPK11 was significantly upregulated in transgenic lines, with OE-7 showing the highest induction. Conversely, antioxidant genes were suppressed, as SOD, CAT1, and APX3 showed progressive downregulation, with OE-10 exhibiting the most severe reduction. Similarly, PER5 and PER66 were repressed in a line-dependent manner. These findings suggest that MeFER4 overexpression alters ABA signaling and ROS homeostasis under stress.

    Overexpression of MeFER4 in Arabidopsis increased the sensitivity to H2O2 treatment, as evidenced by more pronounced leaf yellowing in transgenic lines (OE-6, OE-7, OE-10) compared to wild-type plants following H2O2 treatment, indicating heightened susceptibility to oxidative stress (Fig. 3a). Elevated ROS levels in transgenic lines were corroborated by stronger DAB staining signals (Fig. 3a). Quantitative analysis of the average optical density of DAB staining further confirmed significantly higher ROS levels in the transgenic lines (Fig. 3b).

    Figure 3.  MeFEE4 transcription level enhances H2O2 sensitivity and regulates the expression of stress-responsive genes in Arabidopsis. (a) Phenotypic differences in wild-type and MeFER4-overexpressing Arabidopsis lines (OE-6, OE-7, OE-10) under control (CK), and H2O2 treatment conditions. Top: Leaf coloration and phenotype under CK and ABA treatment. Bottom: DAB staining for ROS accumulation in wild-type and transgenic lines, indicating oxidative stress under H2O2 treatment. Scale bar = 1 cm. (b) Quantification of ROS accumulation by average optical density in DAB-stained leaves under H2O2 treatment. Data represent means ± SD (n = 3). Asterisks indicate significant differences compared to wild-type plants (* p < 0.05, **p < 0.01). (c) Relative expression levels of stress-responsive genes, including WCRKC1, SOD, APX1, and APX3, in wild-type and MeFER4-overexpressing lines under H2O2 treatment. Data represent means ± SD (n = 3). Asterisks indicate significant differences compared to wild-type plants (* p < 0.05, ** p < 0.01).

    Transcriptional profiling of MeFER4-overexpressing lines revealed a dual regulatory mechanism influencing ROS homeostasis under stress conditions. Quantitative RT-PCR analysis demonstrated significant upregulation of WCRKC1, a kinase associated with oxidative signaling, across all transgenic lines, suggesting enhanced pro-oxidant signaling. Conversely, key antioxidant genes exhibited line-dependent suppression: SOD and APX1 expression decreased markedly in OE-6/OE-7, while APX3 was drastically repressed in OE-6/OE-7, but unaffected in OE-10 (Fig. 3c). This transcriptional reprogramming—elevated kinase activity coupled with compromised ROS scavenging—aligns with observed ROS accumulation patterns (Fig. 3a, b) and suggests that MeFER4 overexpression disrupts redox homeostasis by amplifying oxidative signals while attenuating antioxidant defenses. Notably, the differential suppression of APX3 between OE-10 and other lines may reflect isoform-specific regulatory compensation, highlighting the complexity of ROS metabolic networks.

    Transgenic lines exhibited more severe leaf chlorosis and elevated ROS levels compared to wild-type plants (Fig. 4a). This was demonstrated by intensified DAB staining, indicating increased ROS accumulation. Quantitative analysis of average optical density from DAB-stained leaves further confirmed significantly higher ROS levels in the MeFER4-overexpressing lines (Fig. 4b). Expression analysis revealed notable alterations in stress-responsive genes; for instance, genes such as SOD and APX were upregulated, while others like WRKY33 and DREB1B were downregulated under stress conditions (Fig. 4c).

    Figure 4.  MeFEE4 transcription level enhances MV sensitivity and regulates the expression of stress-responsive genes in Arabidopsis. (a) Phenotypic differences in wild-type and MeFER4-overexpressing Arabidopsis lines (OE-6, OE-7, OE-10) under control (CK), and MV treatment conditions. Top: Leaf coloration and phenotype under CK and MV treatment. Bottom: DAB staining for ROS accumulation in wild-type and transgenic lines, indicating oxidative stress under MV treatment. Scale bar = 1 cm. (b) Quantification of ROS accumulation by average optical density in DAB-stained leaves under MV treatment. Data represent means ± SD (n = 3). Asterisks indicate significant differences compared to wild-type plants (* p < 0.05). (c) Relative expression levels of stress-responsive genes, including SOD, CAT1, PER5, PER58, PER63, PER66, APX1, APX3, and APX5, in wild-type and MeFER4-overexpressing lines under MV treatment. Data represent means ± SD (n = 3). Asterisks indicate significant differences compared to wild-type plants (* p < 0.05, ** p < 0.01).

    Overall, these results highlight the role of MeFER4 in regulating oxidative stress responses and suggest that its overexpression in Arabidopsis enhances sensitivity to oxidative stress.

    Overexpression of MeFER4 in Arabidopsis heightened sensitivity to NaCl stress. Transgenic lines (OE-6, OE-7, OE-10) exhibited more severe leaf chlorosis and necrosis under NaCl treatment compared to wild-type plants (Fig. 5a), along with elevated ROS levels as indicated by intensified DAB staining (Fig. 5a). Expression analysis revealed significant downregulation of stress-responsive transcriptional regulators, such as MYB73, DREB1B, and WRKY33, while antioxidant defense genes, including SOD and APX, were upregulated (Fig. 5c).

    Figure 5.  MeFEE4 transcription level enhances Salinity sensitivity and regulates the expression of stress-responsive genes in Arabidopsis. (a) Phenotypic differences in wild-type and MeFER4-overexpressing Arabidopsis lines (OE-6, OE-7, OE-10) under control (CK), and NaCl treatment conditions. Top: Leaf coloration and phenotype under CK and NaCl treatment. Bottom: DAB staining for ROS accumulation in wild-type and transgenic lines, indicating oxidative stress under NaCl treatment. Scale bar = 1 cm. (b) Quantification of ROS accumulation by average optical density in DAB-stained leaves under NaCl treatment. Data represent means ± SD (n = 3). Asterisks indicate significant differences compared to wild-type plants (* p < 0.05, ** p < 0.01). (c) Relative expression levels of stress-responsive genes, including MYB73, DERB-1B, WRKY53, SOD, APX1, APX3, APX5, CHS, and P5CS, in wild-type and MeFER4-overexpressing lines under NaCl treatment. Data represent means ± SD (n = 3). Asterisks indicate significant differences compared to wild-type plants (* p < 0.05, ** p < 0.01).

    Under mannitol-induced osmotic stress, MeFER4-overexpressing lines demonstrated increased sensitivity, as evidenced by more pronounced leaf discoloration and damage relative to wild-type plants (Fig. 6a). Elevated ROS levels in the transgenic lines were confirmed by stronger DAB staining signals (Fig. 6b). Gene expression analysis showed downregulation of transcription factors such as WRKY53 and DREB1B, whereas antioxidant defense genes, including members of the APX family and P5CS, were upregulated, indicating an adaptive response to oxidative stress (Fig. 6c).

    Figure 6.  MeFEE4 transcription level enhances osmotic stress sensitivity and regulates the expression of stress-responsive genes in Arabidopsis. (a) Phenotypic differences in wild-type and MeFER4-overexpressing Arabidopsis lines (OE-6, OE-7, OE-10) under control (CK), and mannitol (MAN) treatment conditions. Top: Leaf coloration and phenotype under CK and MAN treatment. Bottom: DAB staining for ROS accumulation in wild-type and transgenic lines, indicating oxidative stress under MAN treatment. Scale bar = 1 cm. (b) Quantification of ROS accumulation by average optical density in DAB-stained leaves under MAN treatment. Data represent means ± SD (n = 3). Asterisks indicate significant differences compared to wild-type plants (* p < 0.05). (c) Relative expression levels of stress-responsive genes, including SOD, CAT1, PER5, PER58, PER63, PER66, APX1, APX3, and APX5, in wild-type and MeFER4-overexpressing lines under MAN treatment. Data represent means ± SD (n = 3). Asterisks indicate significant differences compared to wild-type plants (* p < 0.05, ** p < 0.01).

    In conclusion, these findings suggest that the overexpression of MeFER4 leads to altered stress responses under both salinity and osmotic stress conditions in Arabidopsis.

    Yeast two-hybrid (Y2H) screening identified ascorbate peroxidase 1 (APX1) and ascorbate peroxidase 3 (APX3) as interaction partners of MeFER4 (Fig. 7a). To further confirm these interactions, split-LUC assays were conducted. The split-LUC assay results indicated strong fluorescence signals in the presence of both APX1 and APX3, corroborating the Y2H findings and confirming the physical interaction between MeFER4 and these proteins (Fig. 5b).

    Figure 7.  Interaction analysis of MeFER4 with APX1 and APX3. (a) Yeast two-hybrid assay results showing the interaction between MeFER4 with APX1 and APX3. The positive and negative controls indicate the expected results. Growth on selective media SD/-Trp-Leu and SD/-Trp-Leu-His-Ade demonstrates the interactions between the proteins in APX1 + MeFER4 and APX3 + MeFER4. (b) Split-LUC assay results indicating the interaction between MeFER4 with APX1 and APX3. The left and right panels show the interaction of MeFER4 with APX1 and APX3 in tobacco leaves, respectively. The luminescence signal confirms the protein-protein interaction. (c) BiFC assay results illustrating the interaction between MeFER4 with APX1 and APX3. The GFP, YFP, and merged images demonstrate the fluorescence signal in tobacco leaf cells, further validating the protein interactions. Scale bar = 50 μm.

    Furthermore, BiFC assays were employed to validate the interactions in vivo. The results showed clear and distinct fluorescence signals when MeFER4 was co-expressed with either APX1 or APX3, demonstrating that MeFER4 forms complexes with both proteins in living cells (Fig. 5c). These in vivo interaction studies provide robust evidence that MeFER4 physically interacts with APX1 and APX3, suggesting a functional partnership in the regulation of ROS homeostasis.

    Collectively, these findings imply that MeFER4 may play a crucial role in modulating ROS levels and stress responses in plants through its interactions with key antioxidant enzymes, APX1 and APX3. The identification and validation of these interactions underscore the potential significance of MeFER4 in maintaining oxidative balance and enhancing plant resilience under stress conditions.

    In this study, we explored the role of MeFER4, a ferritin-like protein, in regulating oxidative stress responses and its potential involvement in stress tolerance in cassava. Our results suggest that MeFER4 plays a complex role in modulating ROS homeostasis, and its overexpression in Arabidopsis thaliana significantly affects the plant responses to various abiotic stresses, including drought, oxidative stress, salinity, and osmotic stress. These findings provide new insights into the role of ferritins in plant stress physiology and offer potential avenues for improving stress resilience in crops, particularly cassava.

    Previous studies have shown that ferritin plays an important role in enhancing iron content in plants, such as rice, pineapple, and banana[2325]. Ferritin not only stores iron but also helps mitigate oxidative stress-induced damage by regulating intracellular iron levels[6]. Nitric oxide (NO) can induce ferritin accumulation in barley, alleviating seedling damage under salt stress[26]. In maize, the mRNA abundance of ZmFER1 increases in response to H2O2 induction[27]. In white lupin, the ferritin gene FER1 has been shown to participate in antioxidant pathways[28]. Under drought stress, the transcriptional abundance of ferritin2 in Populus is upregulated[29]. Two rice ferritins, OsFER1 and OsFER2, are induced by paraquat, copper, and high iron levels, and it has been found that rice ferritins primarily defend against iron-mediated oxidative stress[30]. In Arabidopsis, ferritin can respond to short-term induction by MV[31,32]. As an important stress-response protein in Arabidopsis, AtFER4 collaborates with other ferritins to counteract oxidative stress caused by environmental stress[33].

    In this study, we found that the MeFER4 gene is closely associated with drought tolerance traits in cassava, particularly in terms of MDA, proline accumulation, and antioxidant enzyme activity (Fig. 1a, b). While MeFER4 was upregulated under drought stress in cassava (Supplementary Fig. S1a), which could suggest its role in mitigating oxidative damage by regulating ROS homeostasis, iron storage, and cellular protection. However, overexpression of MeFER4 in Arabidopsis showed heightened sensitivity to drought stress (Fig. 1c). This was evidenced by increased leaf wilting, higher leaf water loss rates, and impaired water retention under dehydration (Fig. 1d). These findings suggest that MeFER4 may play a more complex role in drought responses. Specifically, its overexpression could lead to an imbalance in ROS homeostasis, potentially overloading ROS scavenging mechanisms or interfering with the plant stress response system, thus impairing its ability to cope with drought. Overall, these results highlight the nuanced role of MeFER4 in drought tolerance, where the balance between ROS generation and scavenging is crucial for maintaining plant health under stress.

    To counteract ROS, plants have evolved enzyme systems, including SOD, CAT, and peroxidase (POD), as well as low molecular weight antioxidants such as ascorbic acid (ASA), carotenoids, and glutathione (GSH)[34]. The expression of ferritin is closely linked to the expression profile of enzymes related to oxidative stress resistance. An increase in ferritin gene expression is often accompanied by enhanced antioxidant enzyme activity. Oxidative stress positively regulates the expression of SOD1, CAT1, and FER1 in Arabidopsis to counteract the accumulation of H2O2. After 24 h of light exposure, the mRNA levels of FER1, SOD1, and CAT1 were elevated, likely due to ROS-induced signaling cascades that triggered ferritin activity[35]. Oxidative stress also induced an increase in the transcript levels of SOD1, CAT1, and FER1 in white lupin[27]. Our findings indicate that MeFER4 plays a significant role in plant responses to oxidative stress and ABA. Overexpression of MeFER4 in Arabidopsis resulted in heightened sensitivity to ABA, as shown by more pronounced leaf yellowing and increased ROS accumulation upon ABA treatment (Fig. 2a). ABA is a key phytohormone that regulates drought and oxidative stress responses, and MeFER4 appears to modulate ABA signaling pathways, potentially disrupting ROS balance. The upregulation of ROS-related genes such as MPK11 and PER63, and downregulation of PER5 and APX5 in transgenic lines, suggests that MeFER4 influences ROS homeostasis in response to ABA (Fig. 2c).

    Similarly, overexpression of MeFER4 increased sensitivity to oxidative stress induced by H2O2 and MV, as evidenced by more severe leaf chlorosis and higher ROS levels compared to wild-type plants (Figs 3a & 4a). These results imply that MeFER4 may regulate ROS detoxification but could also disrupt the balance between ROS production and scavenging, contributing to increased oxidative stress sensitivity.

    We further explored the impact of MeFER4 under salinity and osmotic stress conditions. Transgenic lines exhibited greater sensitivity to NaCl and mannitol treatments (Figs 5a & 6a), with more severe leaf chlorosis, necrosis, and higher ROS accumulation (Figs 5a, b, & 6a, b). This suggests that MeFER4 may influence a plant's ability to manage osmotic stress and salt tolerance, likely through its interaction with antioxidant defense systems. Despite the increased oxidative stress sensitivity, MeFER4 may still play a role in maintaining cellular integrity. The elevated ROS levels and altered gene expression patterns in transgenic lines indicate that MeFER4 may modulate oxidative signaling pathways (Figs 5c & 6c), but its overexpression could overwhelm the plant's ability to maintain ROS balance, making it more vulnerable to stress-induced oxidative damage.

    Additionally, we identified key antioxidant enzymes, APX1 and APX3, as interaction partners of MeFER4 through various assays (Fig. 7). Molecular docking revealed stable interaction interfaces between MeFER4 and APX1/APX3 mediated by hydrogen bonds and salt bridges. Key residues in MeFER4 (e.g., D110, K166, with APX1; E80, E98, with APX3) formed critical bonds with corresponding residues in APX1 (H179, K28) and APX3, ensuring structural stability and functional synergy of the complexes (Supplementary Fig. S3). These interactions suggest that MeFER4 works in concert with APX1 and APX3 to regulate ROS homeostasis, highlighting its role in balancing ROS production and scavenging, which is crucial for plant resilience under stress.

    The differential expression patterns of antioxidant enzymes under distinct stress conditions (ABA, H2O2, MV vs salinity/osmotic stress) may reflect the complexity of ROS signaling dynamics and the dual roles of antioxidant systems in stress adaptation. Under ABA and H2O2, the downregulation of key antioxidant genes (e.g., SOD, APX3) (Figs 2c & 3c) in MeFER4-OE lines suggests an overload of ROS scavenging capacity or disrupted coordination between ROS production and detoxification. ABA, as a central regulator of stress responses, enhances ROS production as a signaling molecule, but excessive ROS accumulation under MeFER4 overexpression may overwhelm the antioxidant system, leading to feedback inhibition of genes like SOD and APX3[36,37]. Similarly, MV generates superoxide radicals via electron leakage in chloroplasts, which may directly impair antioxidant enzyme stability or transcription, exacerbating oxidative damage.

    In contrast, under salinity and osmotic stress, the upregulation of SOD and APX (Figs 5c & 6c) in transgenic lines implies a compensatory mechanism to counteract stress-specific ROS sources. Salt stress induces ionic imbalance and osmotic stress triggers water deficit, both of which activate calcium signaling and MAPK cascades that stimulate antioxidant gene expression independently of ABA[37]. For instance, the Br14-3-3 gene in Brassica rapa is upregulated under salt and osmotic stress to enhance ROS scavenging, highlighting conserved stress-specific regulatory networks[37]. Additionally, osmotic stress often induces proline accumulation, which stabilizes antioxidant enzymes and mitigates ROS toxicity, potentially buffering the system against MeFER4-induced dysregulation[38].

    The interaction of MeFER4 with APX1/3 further complicates this balance. While APX1/APX3 are critical for H2O2 detoxification, their physical association with MeFER4 may alter enzyme activity or substrate availability under specific stresses. For example, in wheat roots, exogenous ferulic acid enhances APX activity under boron toxicity but fails to restore glutathione reductase, illustrating how stress context dictates antioxidant responses[38]. Similarly, MeFER4-OE plants may disrupt APX1/APX3 function under ABA or MV stress but permit their activation under salinity/osmotic conditions due to alternative signaling pathways.

    In MeFER4-overexpressing transgenic lines, the expression of MeFER4 leads to a significant downregulation of key antioxidant genes such as SOD, APX, CAT, and POD, which are crucial for mitigating oxidative stress. This downregulation disrupts the normal antioxidant defense mechanisms in the plants. Furthermore, MeFER4 interacts with the antioxidant enzymes APX1 and APX3, which exacerbates the imbalance in the oxidative homeostasis of the plants. As a result, this interference promotes the accumulation of ROS in the cells. The increased ROS levels eventually make the transgenic plants more sensitive to abiotic stress factors, such as drought, oxidative stress, salinity, and osmotic stress (Fig. 8).

    Figure 8.  The mechanism by which MeFER4 promotes ROS accumulation in Arabidopsis under abiotic stress. In MeFER4-overexpressing transgenic lines, the presence of MeFER4 leads to the downregulation of antioxidant genes such as SOD, APX, CAT, and POD, and interacts with APX1 and APX3, ultimately promoting ROS accumulation and increasing sensitivity to abiotic stress. In contrast, in wild-type plants, the absence of MeFER4 allows the normal expression of antioxidant enzyme genes, resulting in higher resistance to abiotic stress.

    In contrast, in wild-type plants, the absence of MeFER4 allows the proper expression of antioxidant enzyme genes. This leads to a robust antioxidant defense system, enabling the plants to better cope with abiotic stress. The normal function of these enzymes helps maintain the ROS balance within the cells, contributing to enhanced protection against the damaging effects of abiotic stress. Consequently, wild-type plants exhibit a higher resistance to such stresses compared to the MeFER4-overexpressing lines (Fig. 8).

    The findings from this study have important implications for crop improvement strategies, particularly in the context of developing drought-tolerant and oxidative stress-resistant varieties. While MeFER4 appears to play a vital role in regulating stress responses, its overexpression in Arabidopsis resulted in heightened sensitivity to drought and oxidative stress, indicating that a careful balance must be struck between activating stress-related genes and maintaining cellular homeostasis. Further studies are needed to explore the potential of MeFER4 in cassava and other crops for improving drought tolerance and stress resilience. Moreover, genetic manipulation of MeFER4 expression levels in crops could be fine-tuned to optimize its role in stress tolerance without compromising plant growth and productivity.

    In conclusion, our results demonstrate that MeFER4 is an important regulator of oxidative stress responses in plants. By modulating ROS homeostasis and interacting with key antioxidant enzymes, MeFER4 plays a central role in mediating plant responses to drought, oxidative, and osmotic stress. The findings of this study provide a foundation for further research into the potential applications of MeFER4 in improving stress tolerance in crops, especially in regions where drought and oxidative stress are significant constraints on crop productivity. Further investigation into the molecular mechanisms underlying MeFER4-mediated stress tolerance will be critical for harnessing its full potential in agricultural applications.

  • The authors confirm contribution to the paper as follows: study conception and design: Guo X, Wang W, Yu X, Peng M; data collection: Li L, Zheng M, Lin C, Wang B, Yu F, Xie X; analysis and interpretation of results: Guo X, Zhao P, Li J, Zheng M, Wang W, Yu X, Si C, Chen F; draft manuscript preparation: Guo X. All authors reviewed the results and approved the final version of the manuscript.

  • The datasets generated during and/or analyzed during the current study are available from the corresponding author on reasonable request.

  • We thank Dr. Mengbin Ruan and Dr. Pu Yan for sharing vector plasmids. This research was supported by the Hainan Provincial Natural Science Foundation of China (324MS122), the National Natural Science Foundation of China (32360458), the startup funds for the Hainan University E-class Talents (XJ2300007513), and the China Agriculture Research System (CARS-11-HNCYH), both of which made this research possible.

  • The authors declare that they have no conflict of interest.

  • Supplementary Table S1 Main information of 53 materials.
    Supplementary Table S2 Phenotypic genetic diversity of 53 Phalaenopsis cultivars.
    Supplementary Table S3 Indicators and criteria of phenotypic diversity of Phalaenopsis.
    Supplementary Table S4 Information of Core SNPs.
    Supplementary Fig. S1 The significance of 19 quantitative characters was analyzed according to flower type classification.
    Supplementary Fig. S2 Phalaenopsis fingerprint two-dimensional code.
  • [1]

    Chen H, Lv F, Li Z, Xiao W. 2022. Advances in intergenus hybridization breeding of Phalaenopsis. Journal of China Agricultural University 27:125−35

    doi: 10.11841/j.issn.1007-4333.2022.09.12

    CrossRef   Google Scholar

    [2]

    Xia K, Zhang D, Xu X, Liu G, Yang Y, et al. 2022. Protoplast technology enables the identification of efficient multiplex genome editing tools in Phalaenopsis. Plant Science 322:111368−68

    doi: 10.1016/j.plantsci.2022.111368

    CrossRef   Google Scholar

    [3]

    Wang R, Mao C, Ming F. 2022. PeMYB4L interacts with PeMYC4 to regulate anthocyanin biosynthesis in Phalaenopsis orchid. Plant Science 324:111423

    doi: 10.1016/j.plantsci.2022.111423

    CrossRef   Google Scholar

    [4]

    Zhang H, Dong X, Wang L, Zhang J, Meng Y, et al. 2016. Construction of a genetic transformation system using the protocorm of Phalaenopsis seed germination as receptor. Journal of Henan Agricultural Sciences 45:107−111,124

    doi: 10.15933/j.cnki.1004-3268.2016.08.020

    CrossRef   Google Scholar

    [5]

    Chen J, Zhu X, Zheng R, Tong Y, Peng Y, et al. 2024. Orchestrating of native Phalaenopsis flower scents lighted the way through artificial selective breeding partiality in the current resource utilization. Industrial Crops and Products 217:118850

    doi: 10.1016/j.indcrop.2024.118850

    CrossRef   Google Scholar

    [6]

    Cai J, Liu X, Vanneste K, Proost S, Tsai WC, et al. 2015. The genome sequence of the orchid Phalaenopsis equestris. Nature Genetics 47:65−72

    doi: 10.1038/ng.3149

    CrossRef   Google Scholar

    [7]

    Hsiao YY, Tsai WC, Kuoh CS, Huang TH, Wang HC, et al. 2006. Comparison of transcripts in Phalaenopsis bellina and Phalaenopsis equestris (Orchidaceae) flowers to deduce monoterpene biosynthesis pathway. BMC Plant Biology 6:14

    doi: 10.1186/1471-2229-6-14

    CrossRef   Google Scholar

    [8]

    Zhang H, Lin P, Liu Y, Huang C, Huang G, et al. 2022. Development of SLAF-sequence and multiplex SNaPshot panels for population genetic diversity analysis and construction of DNA fingerprints for sugarcane. Genes 13:1477

    doi: 10.3390/genes13081477

    CrossRef   Google Scholar

    [9]

    Wang Y, Lv H, Xiang X, Yang A, Feng Q, et al. 2021. Construction of a SNP fingerprinting database and population genetic analysis of cigar tobacco germplasm resources in China. Frontiers in Plant Science 12:618133

    doi: 10.3389/fpls.2021.618133

    CrossRef   Google Scholar

    [10]

    Zhao X, Li S, Guo R, Zeng X, Wen J, et al. 2018. DNA fingerprinting of Chinese Brassica napus was constructed by using SNP chip. Acta Agronomica Sinica 44:956−65

    doi: 10.3724/SP.J.1006.2018.00956

    CrossRef   Google Scholar

    [11]

    Zhang J, Yang J, Fu S, Ren J, Zhang X, et al. 2022. Comparison of DUS testing and SNP fingerprinting for variety identification in cucumber. Horticultural Plant Journal 8:575−82

    doi: 10.1016/j.hpj.2022.07.002

    CrossRef   Google Scholar

    [12]

    Rasheed A, Wen W, Gao F, Zhai S, Jin H, et al. 2016. Development and validation of KASP assays for genes underpinning key economic traits in bread wheat. Theoretical and Applied Genetics 129:1843−60

    doi: 10.1007/s00122-016-2743-x

    CrossRef   Google Scholar

    [13]

    Yang G, Chen S, Chen L, Sun K, Huang C, et al. 2019. Development of a core SNP arrays based on the KASP method for molecular breeding of rice. Rice 12:21

    doi: 10.1186/s12284-019-0272-3

    CrossRef   Google Scholar

    [14]

    Chen H, Xie W, He H, Yu H, Chen W, et al. 2014. A high-density SNP genotyping array for rice biology and molecular breeding. Molecular Plant 7:541−53

    doi: 10.1093/mp/sst135

    CrossRef   Google Scholar

    [15]

    Byers RL, Harker DB, Yourstone SM, Maughan PJ, Udall JA. 2012. Development and mapping of SNP assays in allotetraploid cotton. Theoretical and Applied Genetics 124:1201−14

    doi: 10.1007/s00122-011-1780-8

    CrossRef   Google Scholar

    [16]

    Shen Y, Wang J, Shaw RK, Yu H, Sheng X, et al. 2021. Development of GBTS and KASP panels for genetic diversity, population structure, and fingerprinting of a large collection of broccoli (Brassica oleracea L. var. italica) in China. Frontiers in Plant Science 12:655254

    doi: 10.3389/fpls.2021.655254

    CrossRef   Google Scholar

    [17]

    Zhang P, Guan JJ, Huang QM, Liu YF, Zhang JH. 2016. Phenotypic diversity of phalaenopsis based on statistic analysis and data mining. the Netherlands: IOS Press. Volume 281. pp. 486−93. doi: 10.3233/978-1-61499-619-4-486

    [18]

    Feng X, Zhao X, Yue L, Wu H, Li D. 2021. Cross-compatibility analysis of 29 Phalaenopsis cultivars. Molecular Plant Breeding 19:4752−58

    Google Scholar

    [19]

    Hu J, Zhu J, Xu HM. 2000. Methods of constructing core collections by stepwise clustering with three sampling strategies based on the genotypic values of crops. Theoretical and Applied Genetics 101:264−68

    doi: 10.1007/s001220051478

    CrossRef   Google Scholar

    [20]

    Yin S, Li C, Huang X, Li S, Cheng X. 2022. Study on floral traits and phenotypic diversity of Chinese rose. Journal of Southwest Forestry University: Natural Science 42:38−47

    doi: 10.11929/j.swfu.202105060

    CrossRef   Google Scholar

    [21]

    Celik I, Gurbuz N, Uncu AT, Frary A, Doganlar S. 2017. Genome-wide SNP discovery and QTL mapping for fruit quality traits in inbred backcross lines (IBLs) of solanum pimpinellifolium using genotyping by sequencing. BMC Genomics 18:1

    doi: 10.1186/s12864-016-3406-7

    CrossRef   Google Scholar

    [22]

    Lek M, Karczewski KJ, Minikel EV, Samocha KE, Banks E, et al. 2016. Analysis of protein-coding genetic variation in 60,706 humans. Nature 536:285−91

    doi: 10.1038/nature19057

    CrossRef   Google Scholar

    [23]

    Jia H, Jiao Y, Wang G, Li Y, Jia H, et al. 2015. Genetic diversity of male and female Chinese bayberry (Myrica rubra) populations and identification of sex-associated markers. BMC Genomics 16:394

    doi: 10.1186/s12864-015-1602-5

    CrossRef   Google Scholar

    [24]

    Panigrahi P, Panigrahi KK, Bhattacharya S. 2018. SSR marker based DNA fingerprinting and diversity studies in mustard (Brassica juncea). Electronic Journal of Plant Breeding 9:25−37

    doi: 10.5958/0975-928X.2018.00004.2

    CrossRef   Google Scholar

    [25]

    Xu Y, Wang B, Zhang J, Zhang J, Li J. 2022. Application of molecular marker technology to improve crop variety protection and supervision. Acta Agronomica Sinica 48:1853−70

    Google Scholar

    [26]

    Zhou Z, Jiang Y, Wang Z, Gou Z, Lyu J, et al. 2016. Resequencing 302 wild and cultivated accessions identifies genes related to domestication and improvement in soybean. Nature Biotechnology 34:408−41

    doi: 10.1038/nbt.3096

    CrossRef   Google Scholar

    [27]

    Lu Y, Yan J, Guimarães CT, Taba S, Hao Z, et al. 2009. Molecular characterization of global maize breeding germplasm based on genome-wide single nucleotide polymorphisms. Theoretical and Applied Genetics 120:93−115

    doi: 10.1007/s00122-009-1162-7

    CrossRef   Google Scholar

    [28]

    Guo S, Zhao S, Sun H, Wang X, Wu S, et al. 2019. Resequencing of 414 cultivated and wild watermelon accessions identifies selection for fruit quality traits. Nature Genetics 51:1616−23

    doi: 10.1038/s41588-019-0518-4

    CrossRef   Google Scholar

    [29]

    Ye C, Tang W, Wu D, Jia L, Qiu J, et al. 2019. Genomic evidence of human selection on Vavilovian mimicry. Nature Ecology & Evolution 3:1474−82

    doi: 10.1038/s41559-019-0976-1

    CrossRef   Google Scholar

    [30]

    Tamura K, Stecher G, Kumar S. 2021. MEGA11: Molecular Evolutionary Genetics Analysis Version 11. Molecular Biology and Evolution 38:3022−27

    doi: 10.1093/molbev/msab120

    CrossRef   Google Scholar

    [31]

    Jeong KS, Shin H, Lee SJ, Kim HS, Kim JY, et al. 2018. Genetic characteristics of Y-chromosome short tandem repeat haplotypes from cigarette butt samples presumed to be smoked by North Korean men. Genes & Genomics 40:819−24

    doi: 10.1007/s13258-018-0701-5

    CrossRef   Google Scholar

    [32]

    van Tongerlo E, van Ieperen W, Dieleman JA, Marcelis LFM. 2021. Vegetative traits can predict flowering quality in Phalaenopsis orchids despite large genotypic variation in response to light and temperature. PLoS ONE 16:e0251405

    doi: 10.1371/journal.pone.0251405

    CrossRef   Google Scholar

    [33]

    Wen X. 2015. Bayesian model comparison in genetic association analysis: linear mixed modeling and SNP set testing. Biostatistics 16:701−12

    doi: 10.1093/biostatistics/kxv009

    CrossRef   Google Scholar

    [34]

    Hemmings SJ, Rhodes JL, Fisher MC. 2023. Long-read sequencing and de novo genome assembly of three Aspergillus fumigatus genomes. Mycopathologia 188:409−12

    doi: 10.1007/s11046-023-00740-2

    CrossRef   Google Scholar

    [35]

    Yu J, Pressoir G, Briggs WH, Bi IV, Yamasaki M, et al. 2006. A unified mixed-model method for association mapping that accounts for multiple levels of relatedness. Nature Genetics 38:203−08

    doi: 10.1038/ng1702

    CrossRef   Google Scholar

    [36]

    Chang CC, Lin HC, Lin IP, Chow TY, Chen HH, et al. 2006. The chloroplast genome of Phalaenopsis aphrodite (Orchidaceae): comparative analysis of evolutionary rate with that of grasses and its phylogenetic implications. Molecular Biology and Evolution 23:279−91

    doi: 10.1093/molbev/msj029

    CrossRef   Google Scholar

    [37]

    Hsu CC, Chung YL, Chen TC, Lee YL, Kuo YT, et al. 2011. An overview of the Phalaenopsis orchid genome through BAC end sequence analysis. BMC Plant Biology 11:3

    doi: 10.1186/1471-2229-11-3

    CrossRef   Google Scholar

  • Cite this article

    Chen X, Wang Q, Wang F, Wu X, Pan Y, et al. 2025. SNP fingerprint database and makers screening for current Phalaenopsis cultivars. Ornamental Plant Research 5: e011 doi: 10.48130/opr-0025-0005
    Chen X, Wang Q, Wang F, Wu X, Pan Y, et al. 2025. SNP fingerprint database and makers screening for current Phalaenopsis cultivars. Ornamental Plant Research 5: e011 doi: 10.48130/opr-0025-0005

Figures(7)  /  Tables(1)

Article Metrics

Article views(378) PDF downloads(95)

ARTICLE   Open Access    

SNP fingerprint database and makers screening for current Phalaenopsis cultivars

Ornamental Plant Research  5 Article number: e011  (2025)  |  Cite this article

Abstract: The Moth orchid is globally recognized as one of the most popular and important ornamental species. However, due to the complicated history of hybridization, long growth cycles, and industrial vegetative propagation, there are huge challenges in cultivar identification and protection leading to market issues. Consequently, it is important to develop effective and stable markers to identify and preserve core Phalaenopsis cultivar resources. In this study, we collected 53 commercially prevalent Phalaenopsis cultivars in China. Through detailed phenotypic observations, morphological genetic diversity was measured in 19 quantitative and 15 qualitative traits. By genome skimming and the subsequent SNP calling pipeline, we discovered 5,984 high-quality single nucleotide polymorphisms (SNPs) and constructed a comprehensive Phalaenopsis SNP database of cultivars. These SNPs got a high correlation with variation for quantitative traits ranging from 16.09% to 154.60%, while those for qualitative traits spanned from 20.54% to 130.81%. This database demonstrated a high degree of genetic diversity and a robust capacity for identifying polymorphisms and distinguishing among current varieties. These discovered SNPs consist of 12 types, C/T (23.86%), G/A (22.31%), A/G (8.89%), and T/C (7.84%). The ratio of transition to transversion was approximately 1.70. 70.91% of the SNP loci were in intergenic regions, 9.61% in upstream regions, and 9.37% within intronic regions. Fifty three cultivar PCAs could serve as three groups, which was matched with trait clusters. Based on 5,984 SNP sites, we conducted secondary screening and screened out 14 core sites. The clustering results of the NJ tree based on 14 core SNP loci and the NJ tree based on 5,984 whole genome SNP loci were consistent among 53 Phalaenopsis cultivars. Besides, each variety was then encoded with a unique barcode by 14 core SNP markers. This preliminary approach offers a putative and effective tool for variety identification, genetic analysis, and further development of Phalaenopsis germplasm resources.

    • Phalaenopsis is perennial in Orchidaceae, which is one of the four major ornamental orchids (Phalaenopsis spp., Dendrobium spp., Cattleya spp., and Oncidium spp.) in the world[1]. It is named after its special butterfly-like flowers, is gorgeous in color, and has a long flowering period. With the improvement of orchid breeding technology, the Phalaenopsis industry has been rapidly developed, and the number of varieties registered in the Royal Horticultural Society (RHS) has reached nearly 40,000[24]. The diverse Phalaenopsis hybrids are highly sought after for their vibrant flower colors, captivating form, and plant morphologies[5].

      In recent years, propelled by advancements in high-throughput sequencing technology, several research teams have successfully completed the whole genome sequencing of various Phalaenopsis species, including Phalaenopsis equestris and Phalaenopsis aphrodita[6,7]. These high-quality genome assemblies and annotations have not only elucidated the structural and functional intricacies of the Phalaenopsis orchid genome but have also laid a solid foundation for subsequent gene function research and varietal improvement. Concurrently, the development and implementation of molecular markers have enabled the construction of genetic maps for Phalaenopsis. These genetic maps are pivotal for conducting genetic linkage analysis, quantitative trait locus (QTL) mapping, and marker-assisted breeding. Among the molecular markers, single nucleotide polymorphism (SNP) markers have gradually ascended as the most favored option due to their relatively low cost, high throughput, excellent stability and reproducibility, uniform genomic distribution, and ease of documentation.

      SNP markers have been widely used in cultivar recognition, such as Sugarcane[8], Cigar tobacco[9], Brassica napus[10], cucumber[11], wheat[6,12], rice[13,14], cotton[15], and broccoli[16]. Due to the large number of varieties and the small differences in phenotypic traits between varieties, some Phalaenopsis varieties have been identified incorrectly, which has caused great difficulties in the collection, cataloging, preservation, and breeding of new varieties of Phalaenopsis[1,17,18]. Therefore, an efficient, accurate, and economical method is urgently needed to support the breeding work of Phalaenopsis and protect the variety rights. By using SNP fingerprints, breeders can systematically identify and evaluate the germplasm resources and important varieties.

      In this study, an SNP database of the Phalaenopsis orchid was developed based on the re-sequencing data to construct the DNA fingerprint map. Through whole genome re-sequencing and variation detection of the Phalaenopsis orchid population, the genetic diversity parameters of Phalaenopsis orchid populations were determined based on SNP data, and the genetic relationship and population structure of Phalaenopsis orchid varieties were further analyzed and confirmed to enrich the genetic variation information. In addition, genetic analysis and variety identification of all germplasm were carried out combined with morphological markers to reveal the rich genetic diversity of Phalaenopsis orchid germplasm. Then the benefits of SNP molecular markers in the study of Phalaenopsis orchid genetic diversity were explored, which provided a reference for the design of molecular marker primers of Phalaenopsis orchid in the future.

    • Fifty-three Phalaenopsis accessions were obtained through collaboration between the Straits Orchid Conservation Center of Fujian Agriculture and Forestry University and Zhangzhou Jubao Biotechnology Company. These accessions were subsequently cultivated in the germplasm resource nursery at the Straits Orchid Conservation Center of Fujian Agriculture and Forestry University (Supplementary Tables S1 & S2), the relevant varieties are used for scientific research purposes and are supported by relevant policies and enterprises. Cultivars were identified by experts in our local lab to obtain accurate characterizations. Young leaves from all samples were carefully selected, promptly frozen using liquid nitrogen, and then preserved in a −80 °C refrigerator to facilitate genomic DNA extraction[19].

    • Considering the ornamental characteristics of Phalaenopsis spp., a study was conducted on 34 phenotypic traits related to leaf, peduncle, and floral organs. Each trait was measured in triplicate to ensure accuracy, and mean values and coefficients of variation (CV) were calculated. The investigation utilized the Royal Garden Society plant colorimetric card, Vernier calipers, steel tape measures, and rulers, identifying 19 quantitative traits and 15 qualitative traits. Phenotypic traits of Phalaenopsis were assessed during the flowering stage, with three biological replicates established. Flower-types are categorized based on their diameters: large flowers exceed 10 cm, medium flowers range from 6 to 10 cm, and small flowers measure less than 6 cm in diameter. For quantitative traits, measurements were averaged, while qualitative traits were described, counted using population observation methods, and assigned corresponding values (Supplementary Table S3).

    • The data were processed to calculate the coefficient of variation for each trait. Factor analysis was then applied to perform the primary classification of the 34 traits[20]. Finally, SPSS 26 was used to conduct Q-type cluster analysis of Phalaenopsis varieties.

    • The sample leaves were mashed with liquid nitrogen in a mortar. DNA was extracted by the modified cetyltrimethyl ammonium bromide (CTAB) method, and DNA concentration, integrity and purity were detected by agarose gel electrophoresis, Qubit Fluorometer and enzyme labelometer[21].

    • The qualified DNA was randomly fragmented using a Covaris ultrasonic disruptor. Large DNA fragments were enriched and purified with magnetic beads, followed by end repair and A-tailing. Circular sequencing adapters were then ligated to both ends of the DNA fragments, and unligated fragments were removed with exonuclease to construct a DNA library. After PCR amplification and library quality assessment, sequencing was performed on the DNBSEQ-T7 platform. The resulting primary image data were converted into raw data. Sequencing adaptors and low-quality reads were filtered out using fastp (v0.23.2), which excluded low-quality reads, reads containing adapters or primer sequences, and reads where either single-end read contained more than 10% 'N' bases or more than 20% low-quality bases (Q ≤ 5); in such cases, the entire paired read was discarded[22]. FastQC (v0.11.8) was then used for quality control, analyzing GC content, base quality, and sequence duplication levels in the filtered data. The final high-quality reads were retained for downstream analyses.

      The filtered reads were aligned to the modified reference genome of Phalaenopsis aphrodita, downloaded from the Orchidstra2 database (https://orchidstra2.abrc.sinica.edu.tw/orchidstra2/index.php) using BWA software (v.0.7.17) with default settings[23,24]. Duplicate reads were marked and removed using the GATK MarkDuplicates function (v4.0.10.0)[25]. SNPs were filtered using a sliding window approach, removing SNPs where five or more appeared within a 10 bp window. Additional quality filtering criteria for SNPs included: QD < 2.0, MQ < 40.0, FS > 60.0, SOR > 3.0, MQRankSum < −12.5, or ReadPosRankSum < −8.0[26]. The filtered SNPs were annotated using SnpEff (v5.1). Further filtering of the VCF files excluded loci with a missing data rate greater than 50% and those with a minor allele frequency (MAF) below 0.1; the remaining loci were used for genetic diversity analysis[27]. Additionally, VCFtools was used to analyze SNP markers, calculating metrics such as Minor Allele Frequency (MAF), Polymorphism Information Content (PIC), and Nucleotide Diversity Index (Pi).

    • For reference, plink (v1.90b6.21) was utilized for LD filtering of SNPs data, removal of SNPs with a deletion rate exceeding 10% minor allele frequency impacting accuracy in population samples, and retention of secondary loci[28]. Subsequently, plink was employed for SNP filtering (with individuals within each subpopulation required to adhere to Hardy-Weinberg equilibrium and each SNP site being independent and unlinked)[29]. The processed data was then filtered using plink for PCA analysis. Population PCA analysis scatter plots were generated using the ggplot2 package in R (www.r-project.org). For population structure analysis, admixture software (v1.3.0) was used to define multiple population subgroups or ancestral numbers (K = 1~15), calculate error rates of sample coefficient variation under different K values, visualize results in R, and generate distribution maps of CV errors. The optimal K value is determined as the one with the lowest cross-validation error rate, and genetic structure mapping is conducted using the ggplot2 package in R under this K value setting. The format of SNPs data was converted using phylip (v3.697) (converting .vcf files into .fa files), followed by comparison using MEGA11 and construction of a phylogenetic tree utilizing the NJ method[30], with Bootstrap testing support rates for each branch set at 1,000 repeats. Finally, ITOL (https://itol.embl.de/) was utilized to enhance the visual presentation of the tree structure[31].

    • The 53 Phalaenopsis germplasm were genotyped using the SNP loci obtained from the screening and DNA fingerprinting was performed based on the nucleotide sequence information. Each variety was then encoded with a unique barcode generated by an online software (http://qr-batch.com/). The variety name and fingerprint code information of each germplasm were input to generate a two-dimensional code for each variety.

    • Genetic diversity analysis was conducted on 19 quantitative and 15 qualitative traits across 53 Phalaenopsis cultivars (Fig. 1b, c). The CV for quantitative traits ranged from 16.09% to 154.60%, with an average of 37.35%, indicating substantial phenotypic variability among cultivars. Notably, traits with the highest CVs—such as the number of lateral branches on the flower stalk and the number of flowers per inflorescence—highlight significant morphological diversity, although these traits alone do not fully support a conclusion of low trait stability across all cultivars. For qualitative traits, the CV ranged from 20.54% to 130.81%, averaging 50.59%, which reflects considerable variability in quality traits, particularly for characteristics like sepal margin waviness and flower fragrance. Together, the broad CV ranges observed in both quantitative and qualitative traits suggest high morphological diversity.
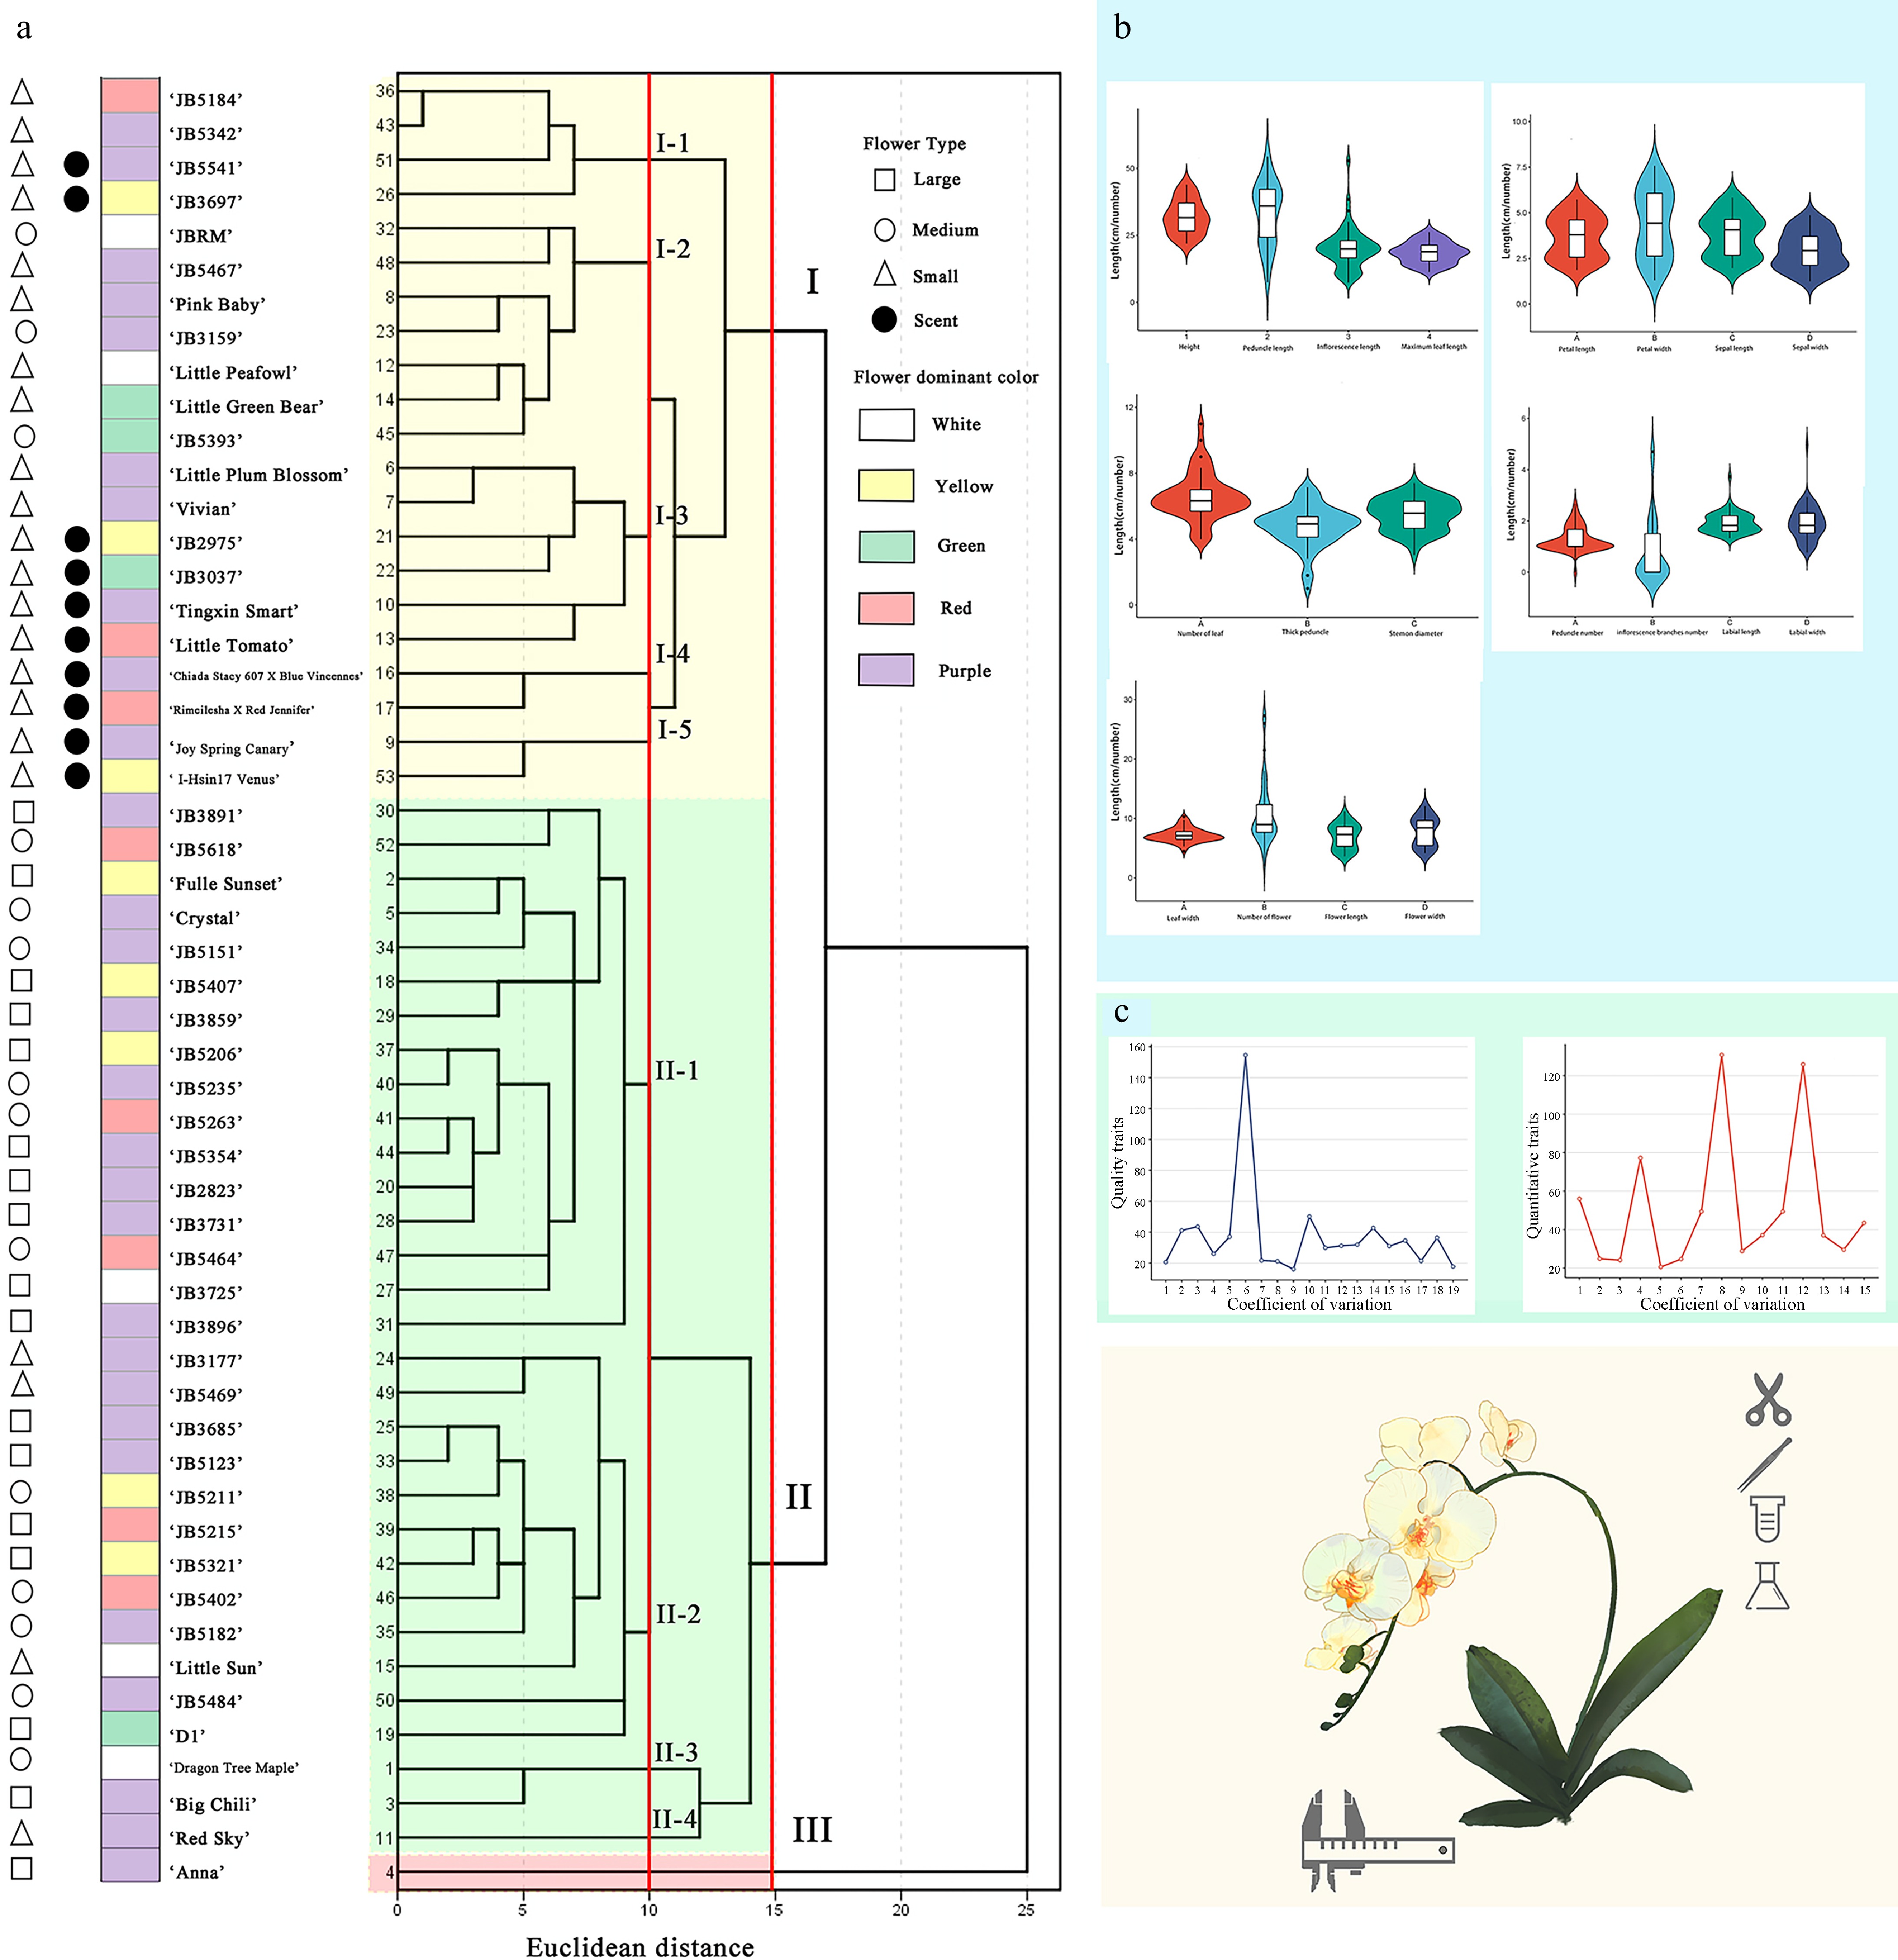
      Figure 1. 

      (a) Q-type cluster analysis of the 53 Phalaenopsis cultivars revealed genetic distances ranging from 1 to 25; (b) The mean value of 19 quantitative traits; (c) Coefficient of variation of 19 quantitative traits and 15 quality traits. (For specific trait characteristics, see Supplementary Table S2).

      A Q-type cluster analysis of the 53 Phalaenopsis cultivars revealed genetic distances ranging from 1 to 25 (Fig. 1a). At a Euclidean distance of 15, the cultivars were grouped into three main clusters, demonstrating significant genetic diversity within the tested Phalaenopsis collection. Group I comprised 21 cultivars, Group II included 31 cultivars, and Group III contained only the 'Anna' cultivar. Notably, none of the other 52 cultivars were the direct progeny of 'Anna'. The results suggested that greater phenotypic and genetic differences among parent cultivars yield more genetically diverse progeny, a desirable trait for cultivar improvement. Additionally, Group I predominantly comprised small and medium-flowered types, while subgroups II-1 and II-3 included large and medium-flowered types[32]. Subgroups I-4 and I-5 contained fragrant-flowered cultivars. Interestingly, large and small-flowered cultivars rarely appeared in the same subgroup, indicating a correlation between flower size and clustering. Fragrant cultivars were all found in subgroup I, suggesting a potential link between fragrance and cluster branching. However, flower color was not strongly correlated with cluster structure, as multiple colors (e.g., reddish-purple, red, yellow, white, and green) were present within subgroups I and II.

      Significance analysis of the 19 quantitative traits by flower type revealed that traits associated with floral organs exhibited strong significance, indicating that the main differences among the tested Phalaenopsis are concentrated in floral morphology, with weaker correlations to leaf traits (Supplementary Fig. S1). Based on the Q-type clustering results at a Euclidean distance of 15, a principal component analysis (PCA) was performed on the 53 samples divided into three groups (Fig. 2a). The first two principal components accounted for 38.4% and 8.1% of the total genetic variance, respectively. Samples exhibited significant inter-group differences on PC1, while PC2 contributed less. The confidence ellipses of groups A and B were distinctly separated, indicating clear group characteristics. In PC1, traits with high information loadings were flower length (0.938), flower width (0.978), petal length (0.971), petal width (0.964), sepal length (0.956), and sepal width (0.935), suggesting that the first principal component is primarily associated with floral organ traits. In PC2, traits with high loadings were leaf tip symmetry (0.622), leaf surface type (0.524), and flower surface waxiness (0.702), indicating that leaf-related traits played a major role. PCA by flower type showed that the confidence ellipses of groups A and C had almost no overlap, demonstrating significant differences in the principal component characteristics between these two groups (Fig. 2b). The confidence ellipse of group B partially overlapped with those of groups A and C, indicating a greater diversity in the principal component characteristics of group B, suggesting that medium-flowered Phalaenopsis may have undergone more extensive genetic exchange.
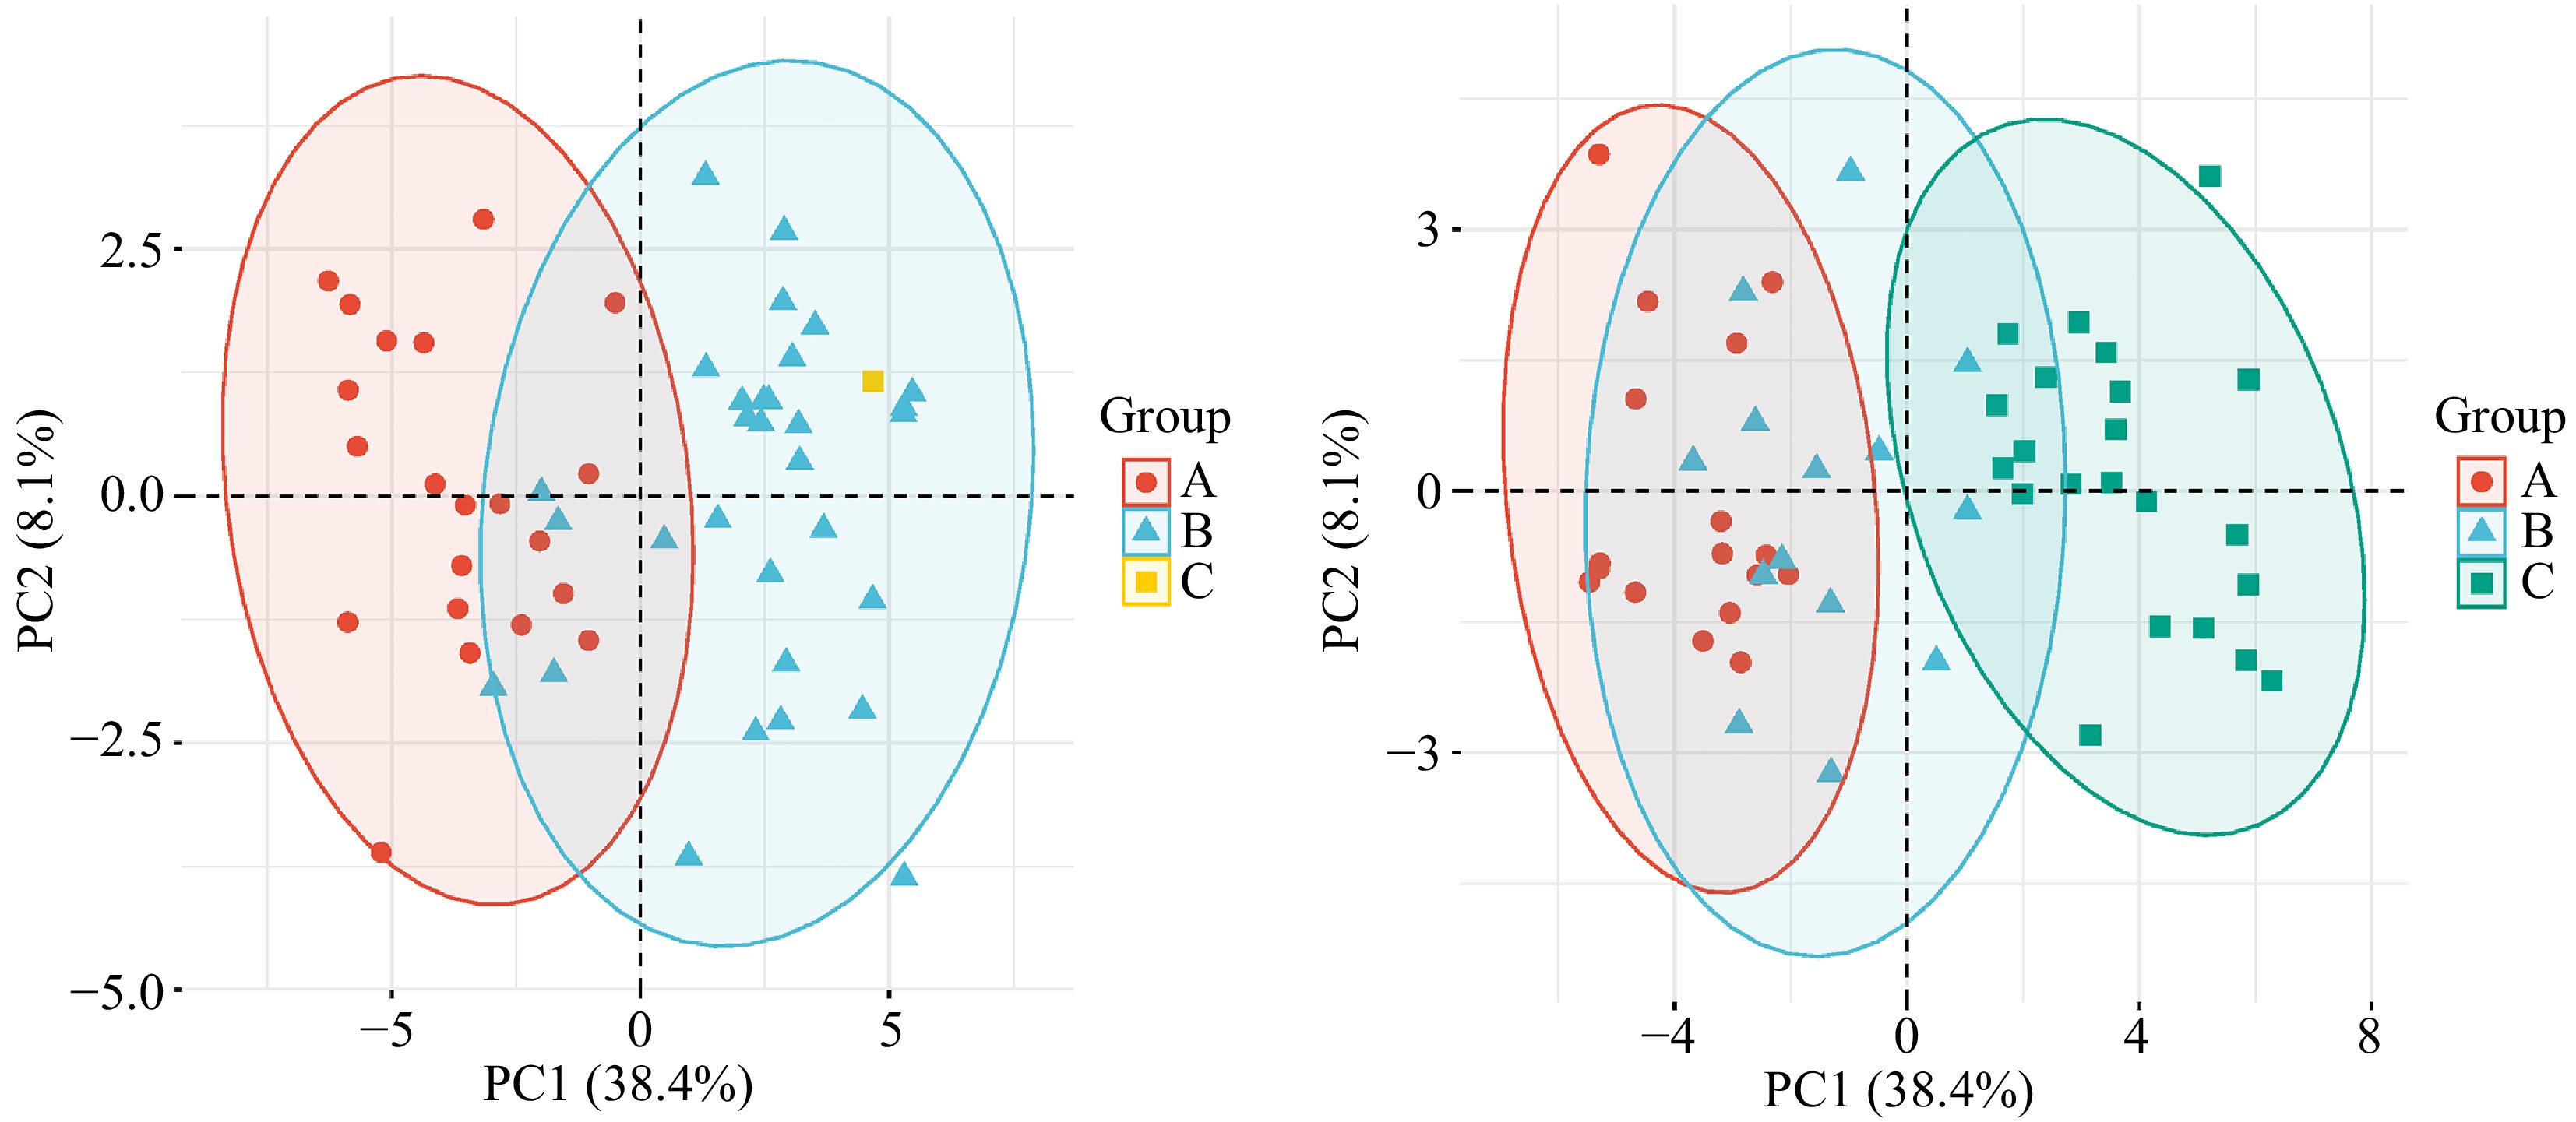
      Figure 2. 

      Based on 34 phenotypic traits, PCA analysis of 53 species of Phalaenopsis.

    • These high-quality SNPs were uniformly distributed across the Phalaenopsis genome, except in the centromere regions (Fig. 3a). The statistical analysis of variant types identified 12 distinct types, with C/T (23.86%), G/A (22.31%), A/G (8.89%), and T/C (7.84%) being the most prevalent. The transition to transversion ratio was approximately 1.70. Furthermore, the analysis revealed that 70.91% of the SNP loci are situated in intergenic regions, 9.61% in upstream regions, and 9.37% within intronic regions. Notably, only 1.31% of the SNP loci are located in exonic regions, with a mere 0.03% in splicing regions.
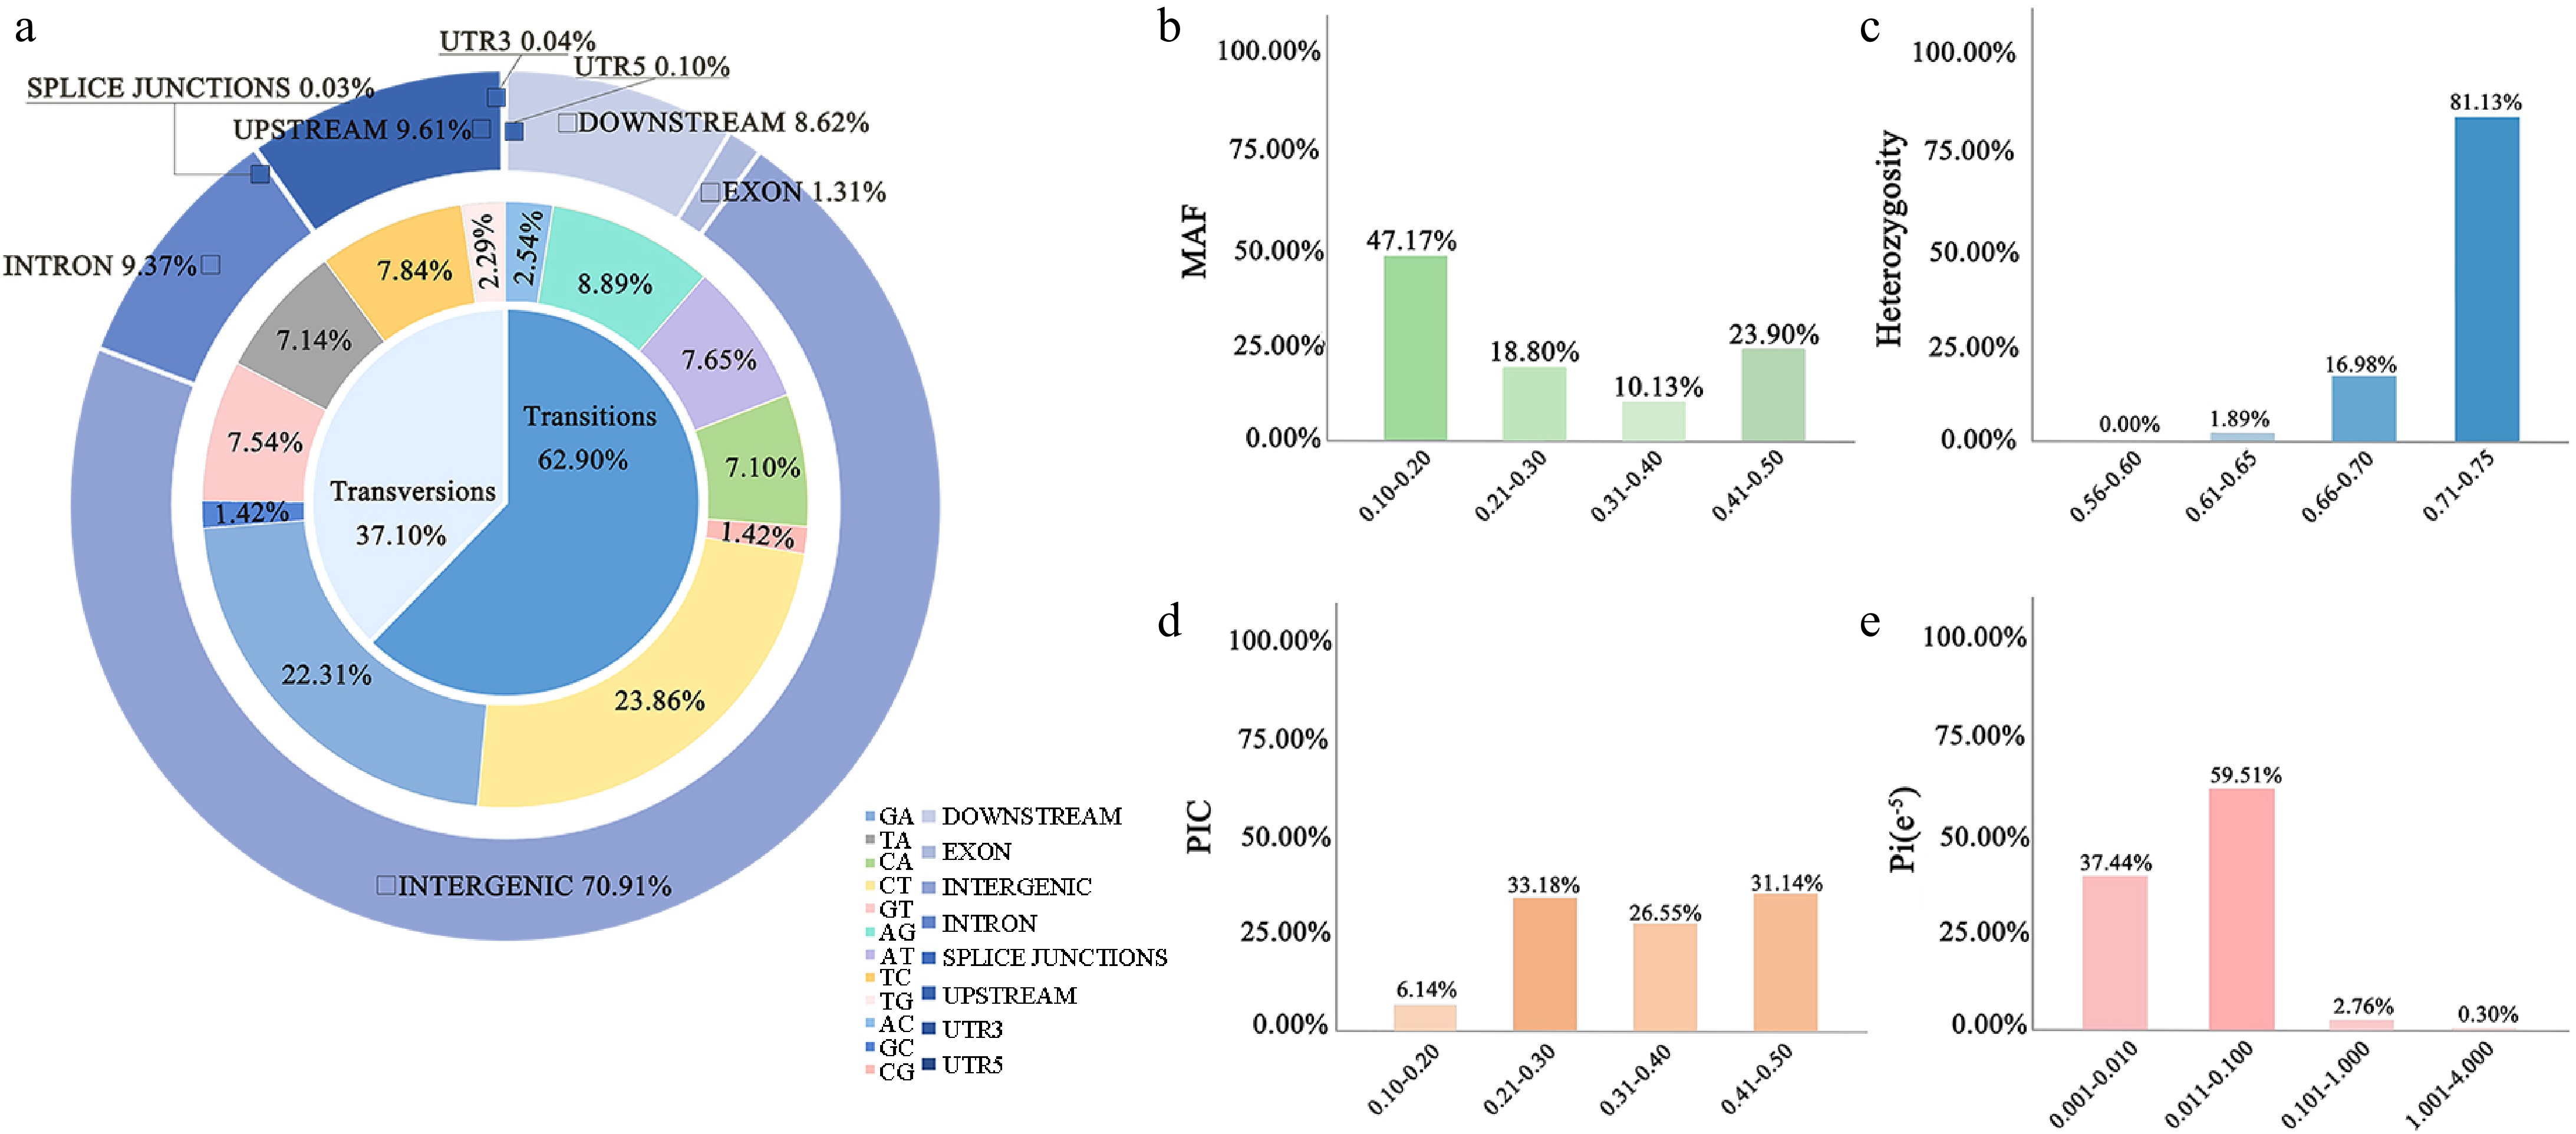
      Figure 3. 

      SNP screening and statistics. (a) The positions of the SNPs in the gene structures. Genotype statistics for the six most commonly identified variants. Genetic information content of 5,984 high-quality markers in 53 cultivars including (b) MAF, (c) heterozygosity rate, (d) PIC, and (e) nucleotide diversity.

      We assessed the quality of the 5,984 SNPs by calculating their PIC, MAF, heterozygosity, and nucleotide diversity. The MAF values ranged from 0.105 to 0.500, with an average of 0.272. The PIC values ranged from 0.188 to 0.500, averaging 0.355. Heterozygosity had a mean value of 0.714, ranging from 0.645 to 0.740. Nucleotide diversity averaged 1.103e-6, ranging from 8.99e-9 to 4.70e-5 (Fig. 3). These results indicate that the 5,984 SNPs exhibit high polymorphism and are suitable for DNA fingerprinting analysis in Phalaenopsis.

    • In this study, we conducted an in-depth analysis of the population structure of 53 Phalaenopsis cultivars from diverse geographical regions using Bayesian analysis[33] . The effective population size was estimated through cross-validation of the coefficient of variation (CV error), identifying the lowest CV error at K = 2 (Fig. 4a), which resulted in the samples being subdivided into two distinct categories. Our genetic analysis revealed consistently low mutation rates across K values from 2 to 15 (Fig. 4b). When K = 3, further subdivisions emerged, with genetic components beginning to intermingle, suggesting notable intra-population genetic diversity. As K increased beyond 3, the genetic structure became increasingly complex, likely reflecting contributions from multiple ancestral sources.
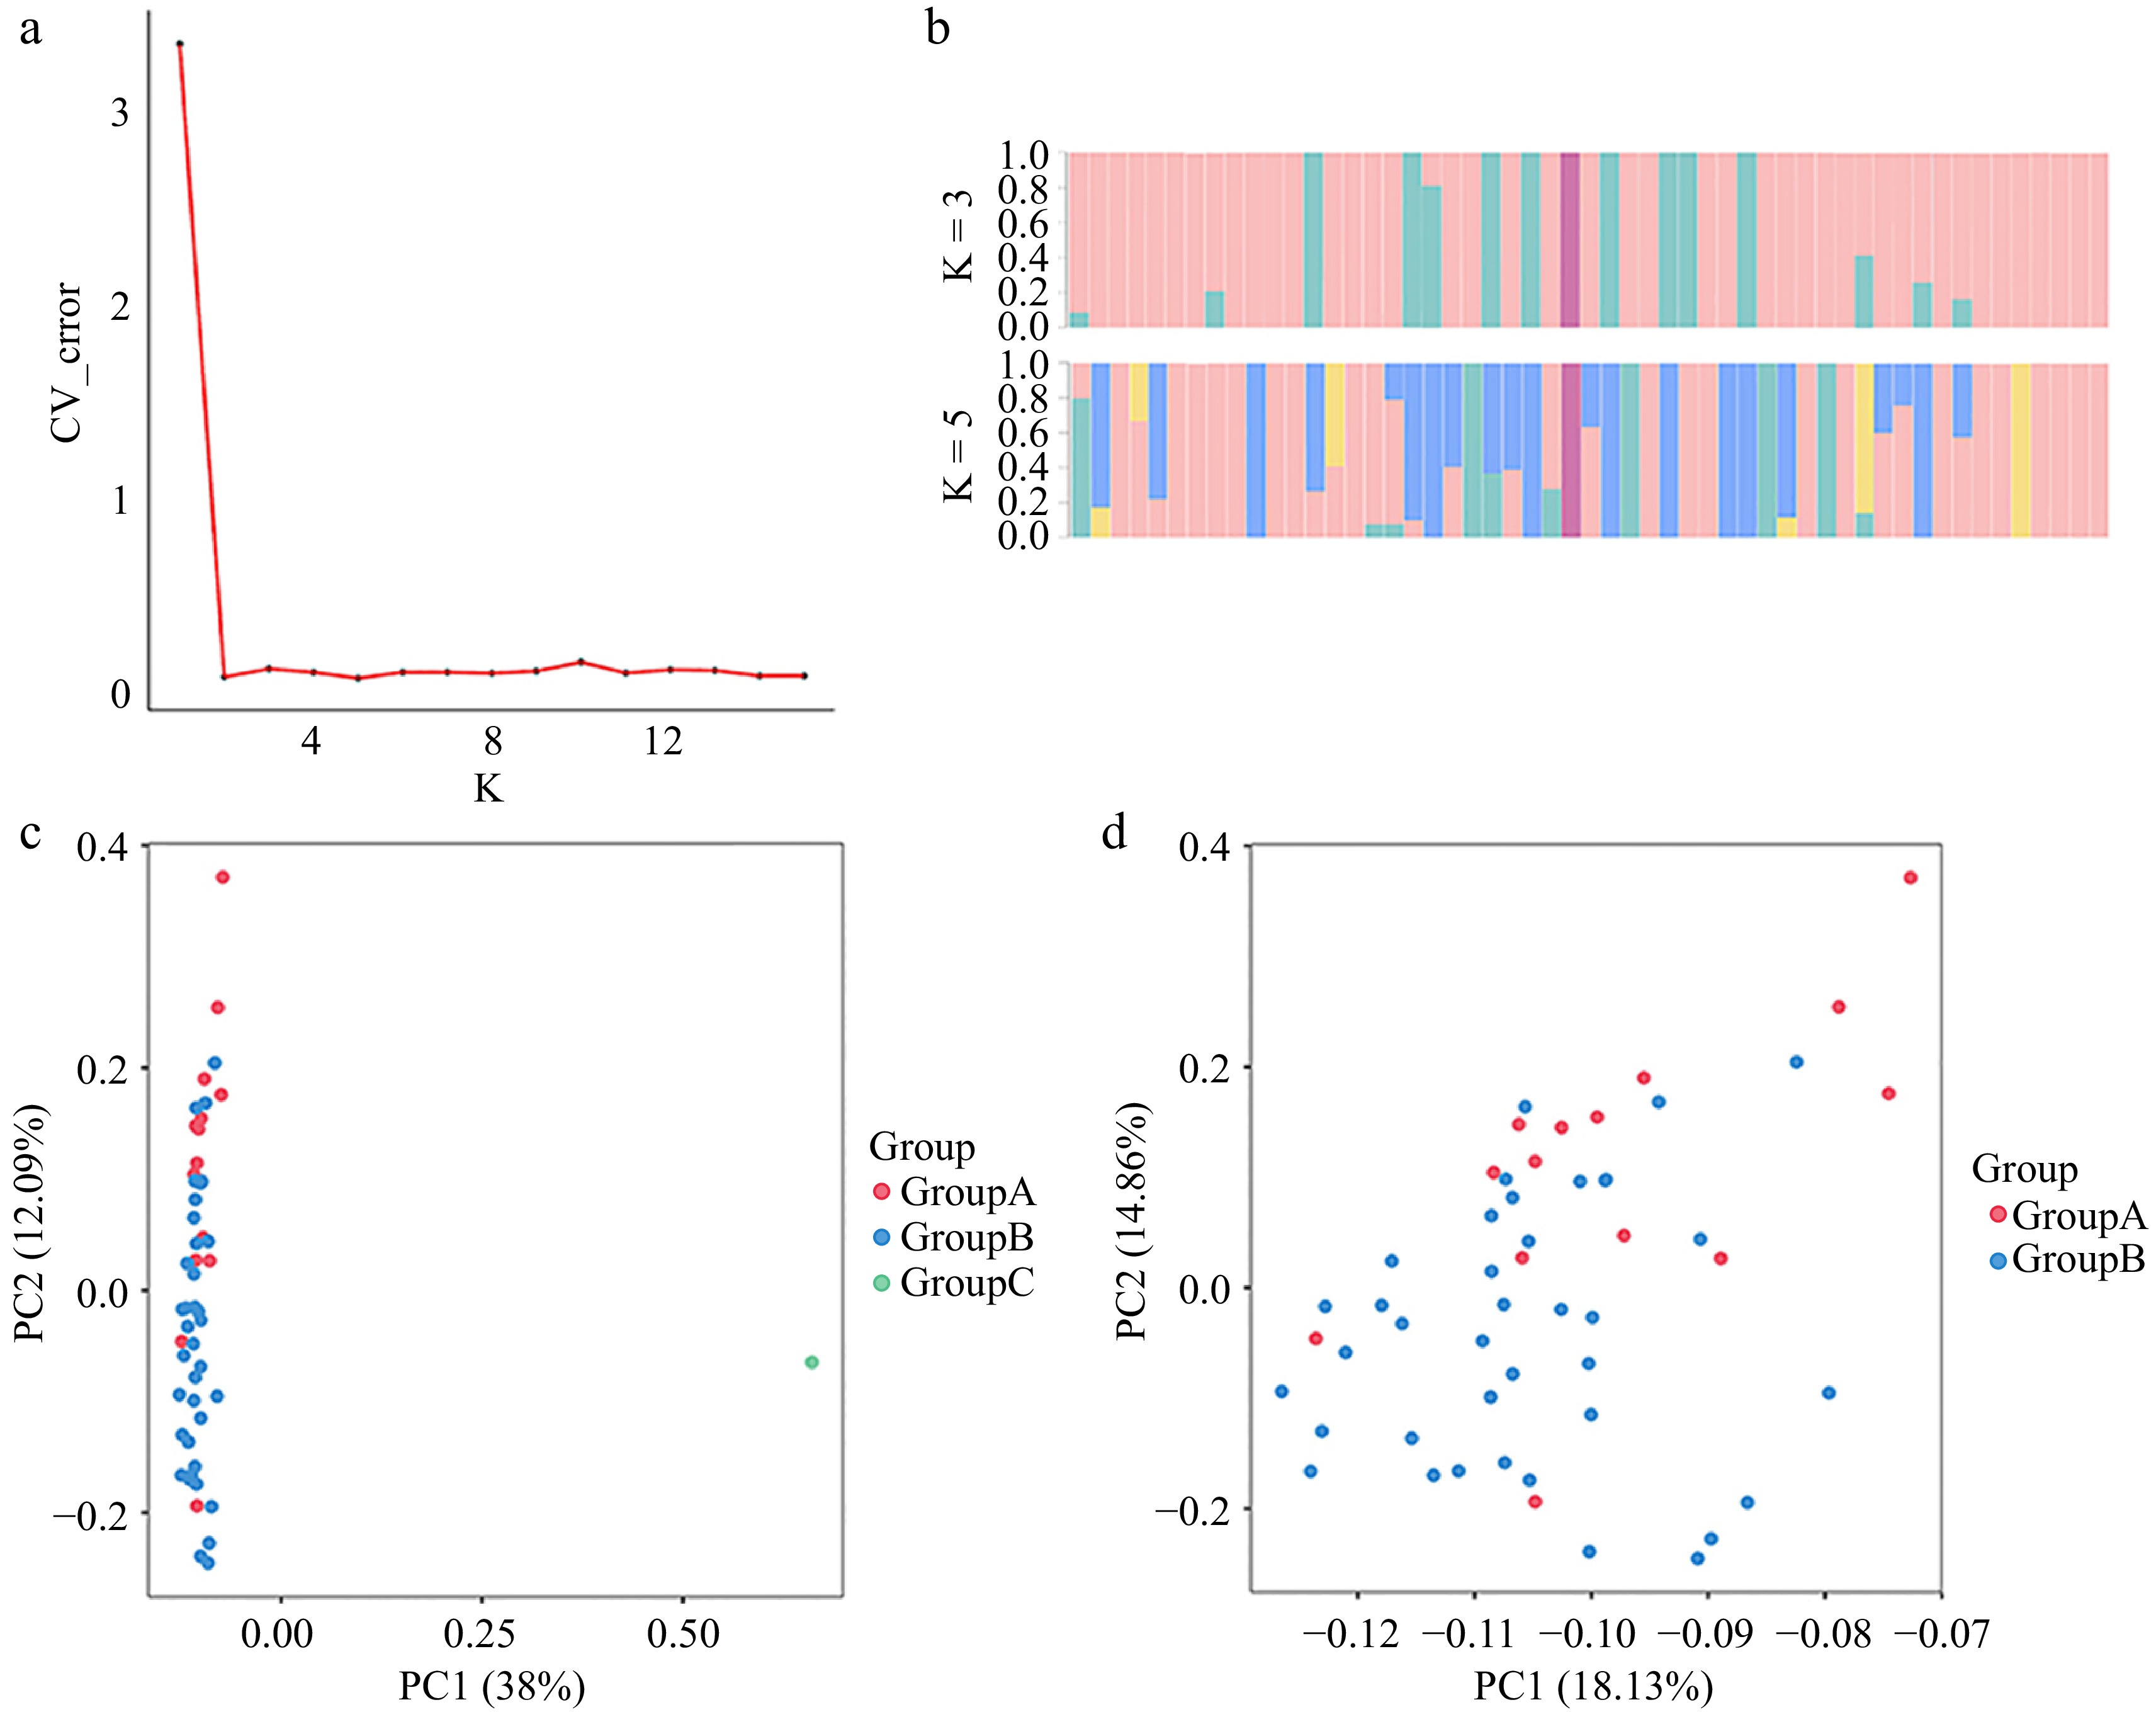
      Figure 4. 

      Genetic diversity analysis. (a) DK values corresponding to different K measurements. (b) Population structure of the 53 germplasm resources at different values of K. (c) Principal component analysis of 53 Phalaenopsis materials. (d) Principal component analysis of 52 Phalaenopsis materials.

      Additionally, referring to SNP markers, we conducted Principal Component Analysis (PCA). The optimal K value, determined by the inflection point where the error sharply declined and stabilized, was identified around K = 3. This value was selected as the basis for grouping in PCA. Our analysis categorized the 53 materials into three distinct populations: Group A, Group B, and Group C. Principal components PC1 and PC2 explained 38% and 12.09% of the total genetic variance, respectively. Visualization of the PCA two-dimensional plot illustrated 'JBRM' as an outlier distinctly separate from the main cluster (Fig. 4c). Upon removing 'JBRM', Group A and Group B showed minimal genetic differentiation, suggesting some degree of genetic similarity between these two groups.

      To provide a clearer illustration of the genetic relationships among these cultivars, a phylogenetic tree constructed from the 5,984 SNPs offers valuable insights into their evolutionary connections and genetic distinctiveness. Although some branches displayed low support values, the main branches achieved a support rate of approximately 70%, underscoring reliable grouping among the major lineages (Fig. 5). This indicates that SNP data can be effectively utilized to elucidate the genetic relationships within the Phalaenopsis germplasm. The genetic structure divided 53 varieties into five distinct groups, with only one variety present in each of groups II, III, IV, and V. Group I included a larger number of germplasms and was further subdivided into 15 subgroups. Notably, subgroup I-1 contained seven germplasms such as 'Tingxin Smart' and 'Little Tomato', which exhibited fragrant flower characteristics, suggesting an association between the genetic makeup of Phalaenopsis orchids and floral fragrance. Similarly, subgroup I-7 consisted of five germplasms, including 'JB3697', characterized by small flowers, while subgroup I-14 comprised three germplasms, including 'JB3685', with large flowers, indicating a correlation between the genetic relationships of butterfly orchids and flower type.
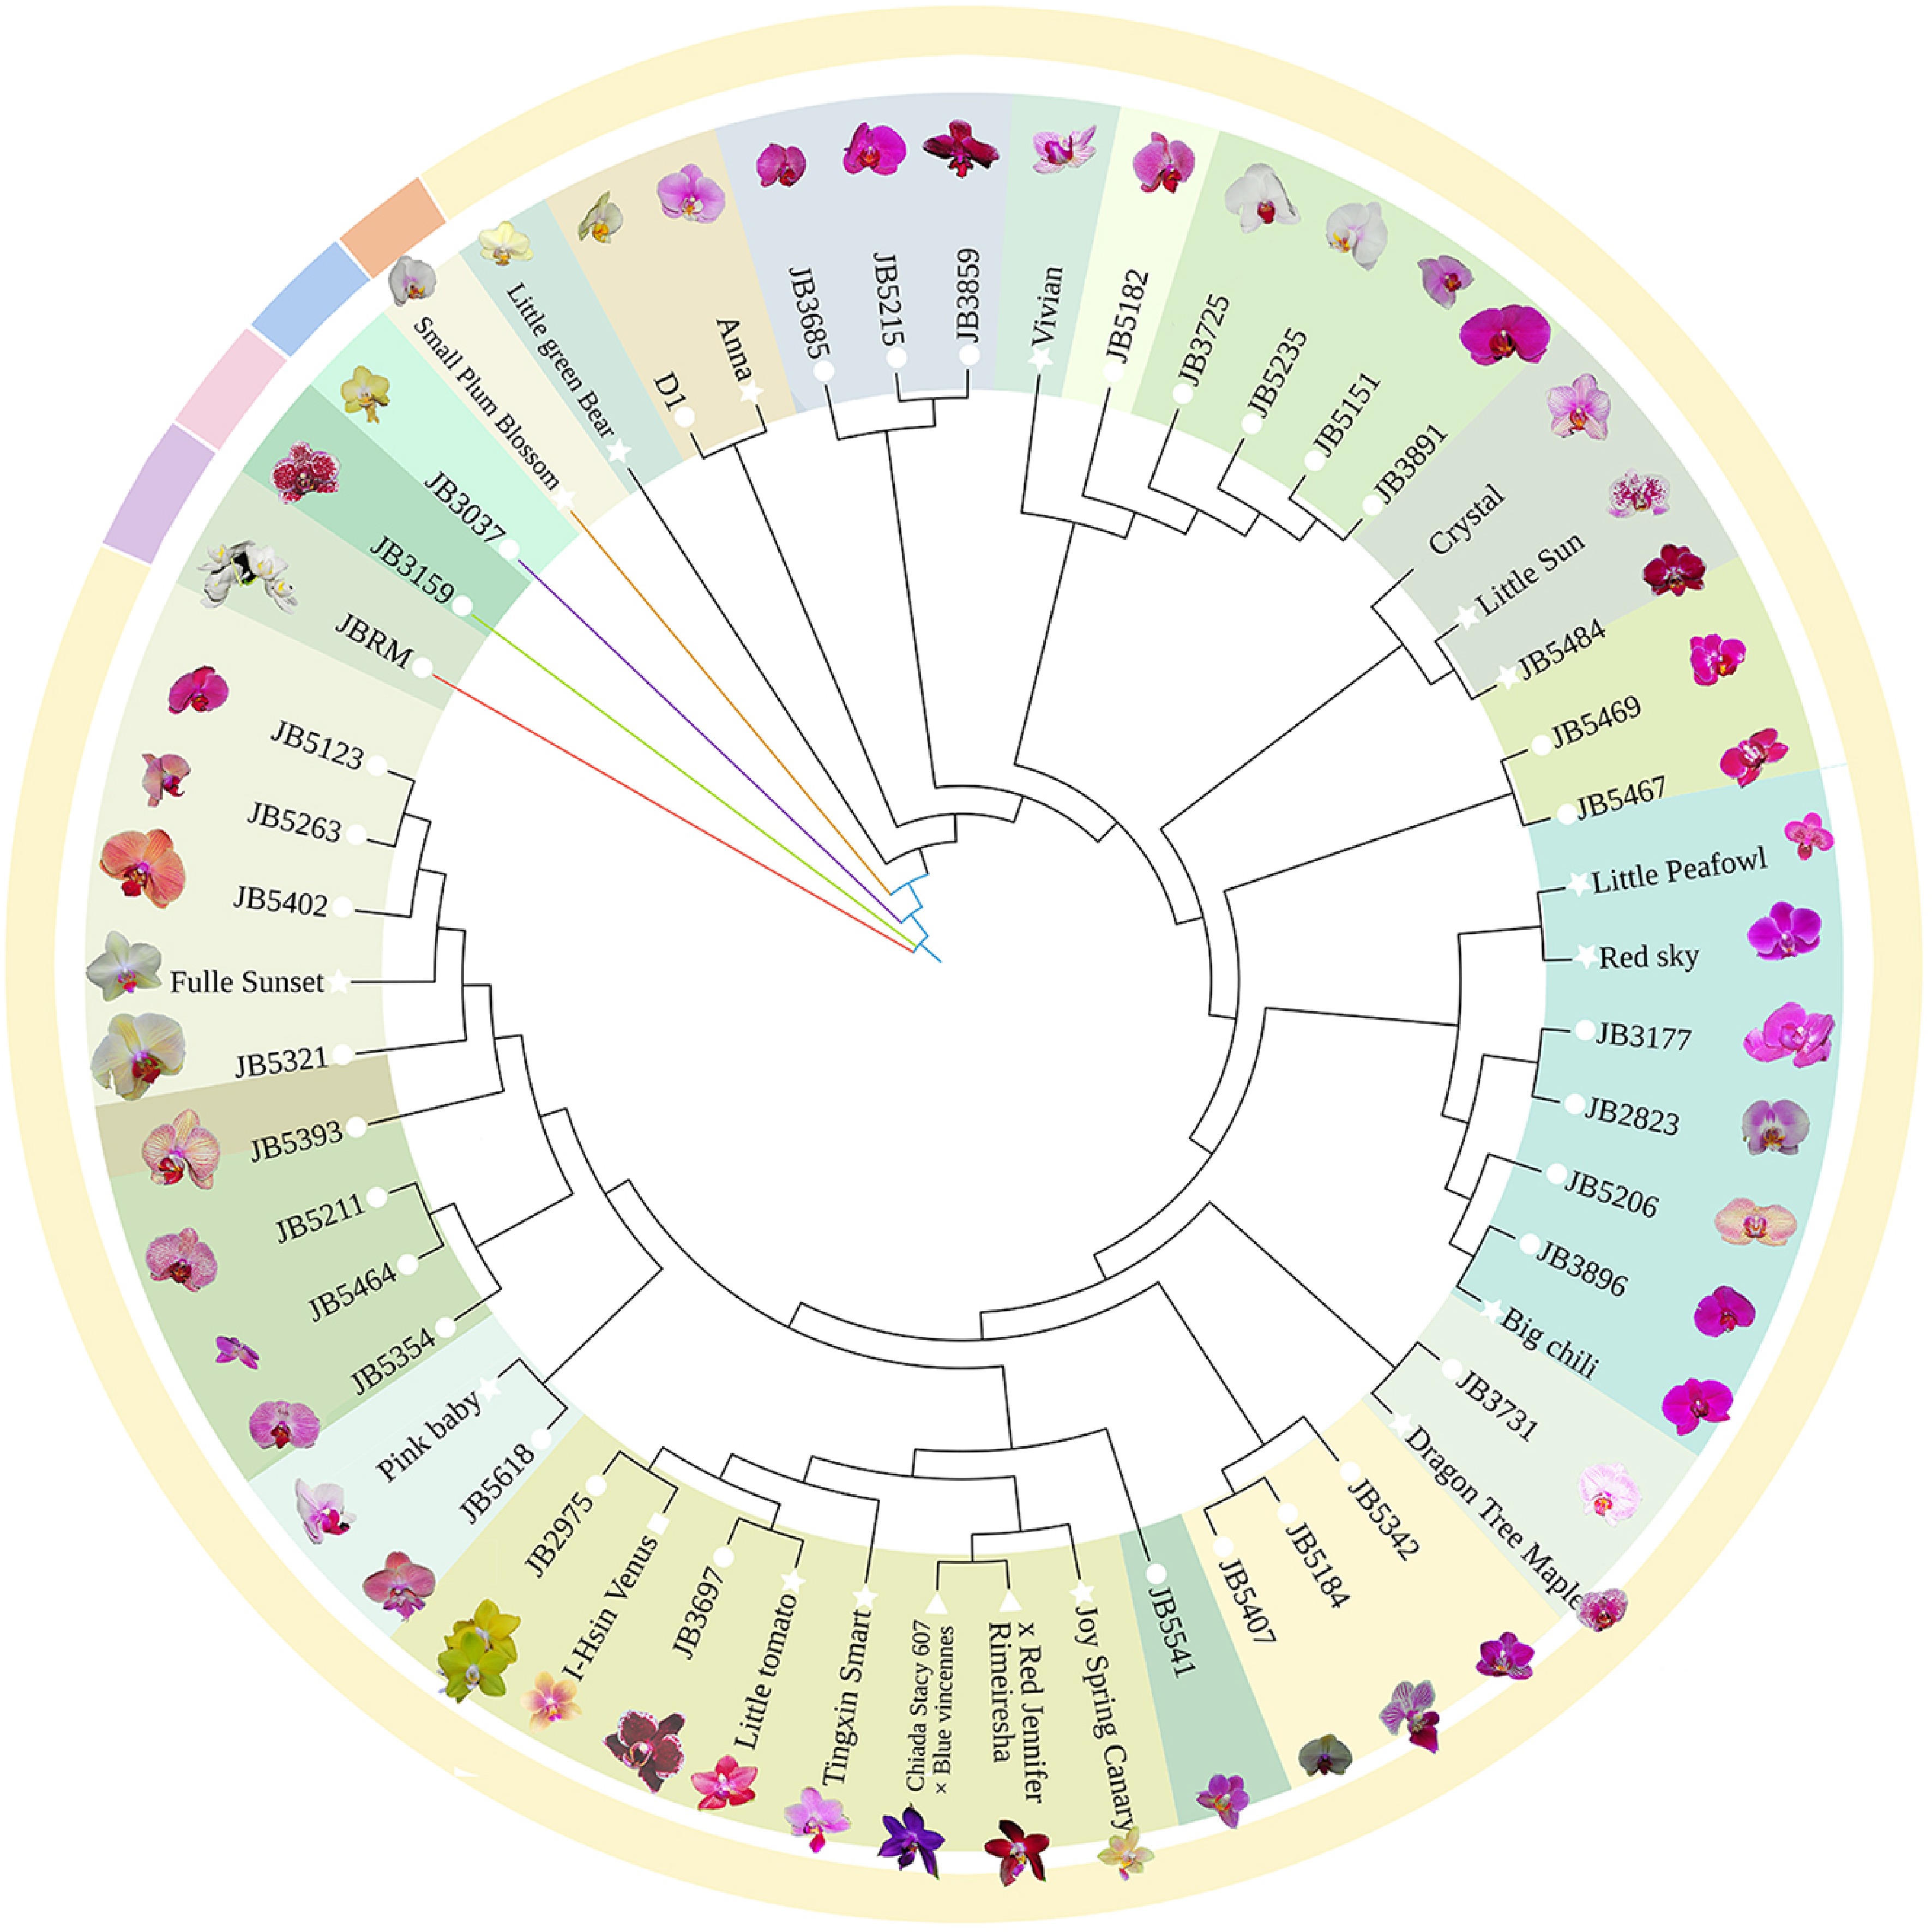
      Figure 5. 

      Phylogenetic tree of 53 cultivars constructed with 5,984 SNP markers.

      It is important to note that there was a weaker correlation among homologous flower clusters compared to fragrant flower types; many homologous germplasms exhibited cross-clustering. Additionally, the examination of the evolutionary tree revealed both closely related and distant germplasms within the samples from Zhangzhou. Germplasms from the same source were not entirely clustered together but were instead distributed across different branches. These findings align with the results obtained from principal component analysis, which suggest potential gene exchange among Phalaenopsis varieties.

    • Based on 5,984 high-quality SNP loci, we conducted a secondary screening with the parameters (Fig. 6a): MAF 0.1, max-missing 0.8, min-meanDP 3, and hwe 0.01. This process resulted in the identification of 14 core SNP loci, which were evenly distributed across the genome and demonstrated good representation. An NJ tree was constructed based on these 14 core SNP sites (Fig. 6b), and genetic diversity metrics such as PIC values were calculated (Table 1). The NJ tree constructed from the 14 core SNP loci and the tree based on the full set of 5,984 genome-wide SNP loci revealed consistent clustering results among the 53 Phalaenopsis cultivars, highlighting the efficacy of the core loci in capturing essential genetic structure. The tree from 5,984 SNP loci, divided the cultivars into five groups, with Group I further subdivided into 15 subgroups. This detailed subdivision allowed for associations between specific genetic clusters and phenotypic traits, such as fragrance in subgroup I-1 and flower size in subgroups I-7 and I-14. In contrast, the NJ tree based on the 14 core SNP loci produced a comparable but slightly broader clustering, dividing the cultivars into four main populations. Despite the reduced SNP count, the core loci tree preserved key genetic relationships and diversity metrics, with PIC values closely aligned with those obtained from the full SNP dataset. This similarity indicates that the 14 core SNP loci provide a representative framework for distinguishing between the Phalaenopsis cultivars, thus offering a reliable and efficient alternative for genetic analysis in this genus.
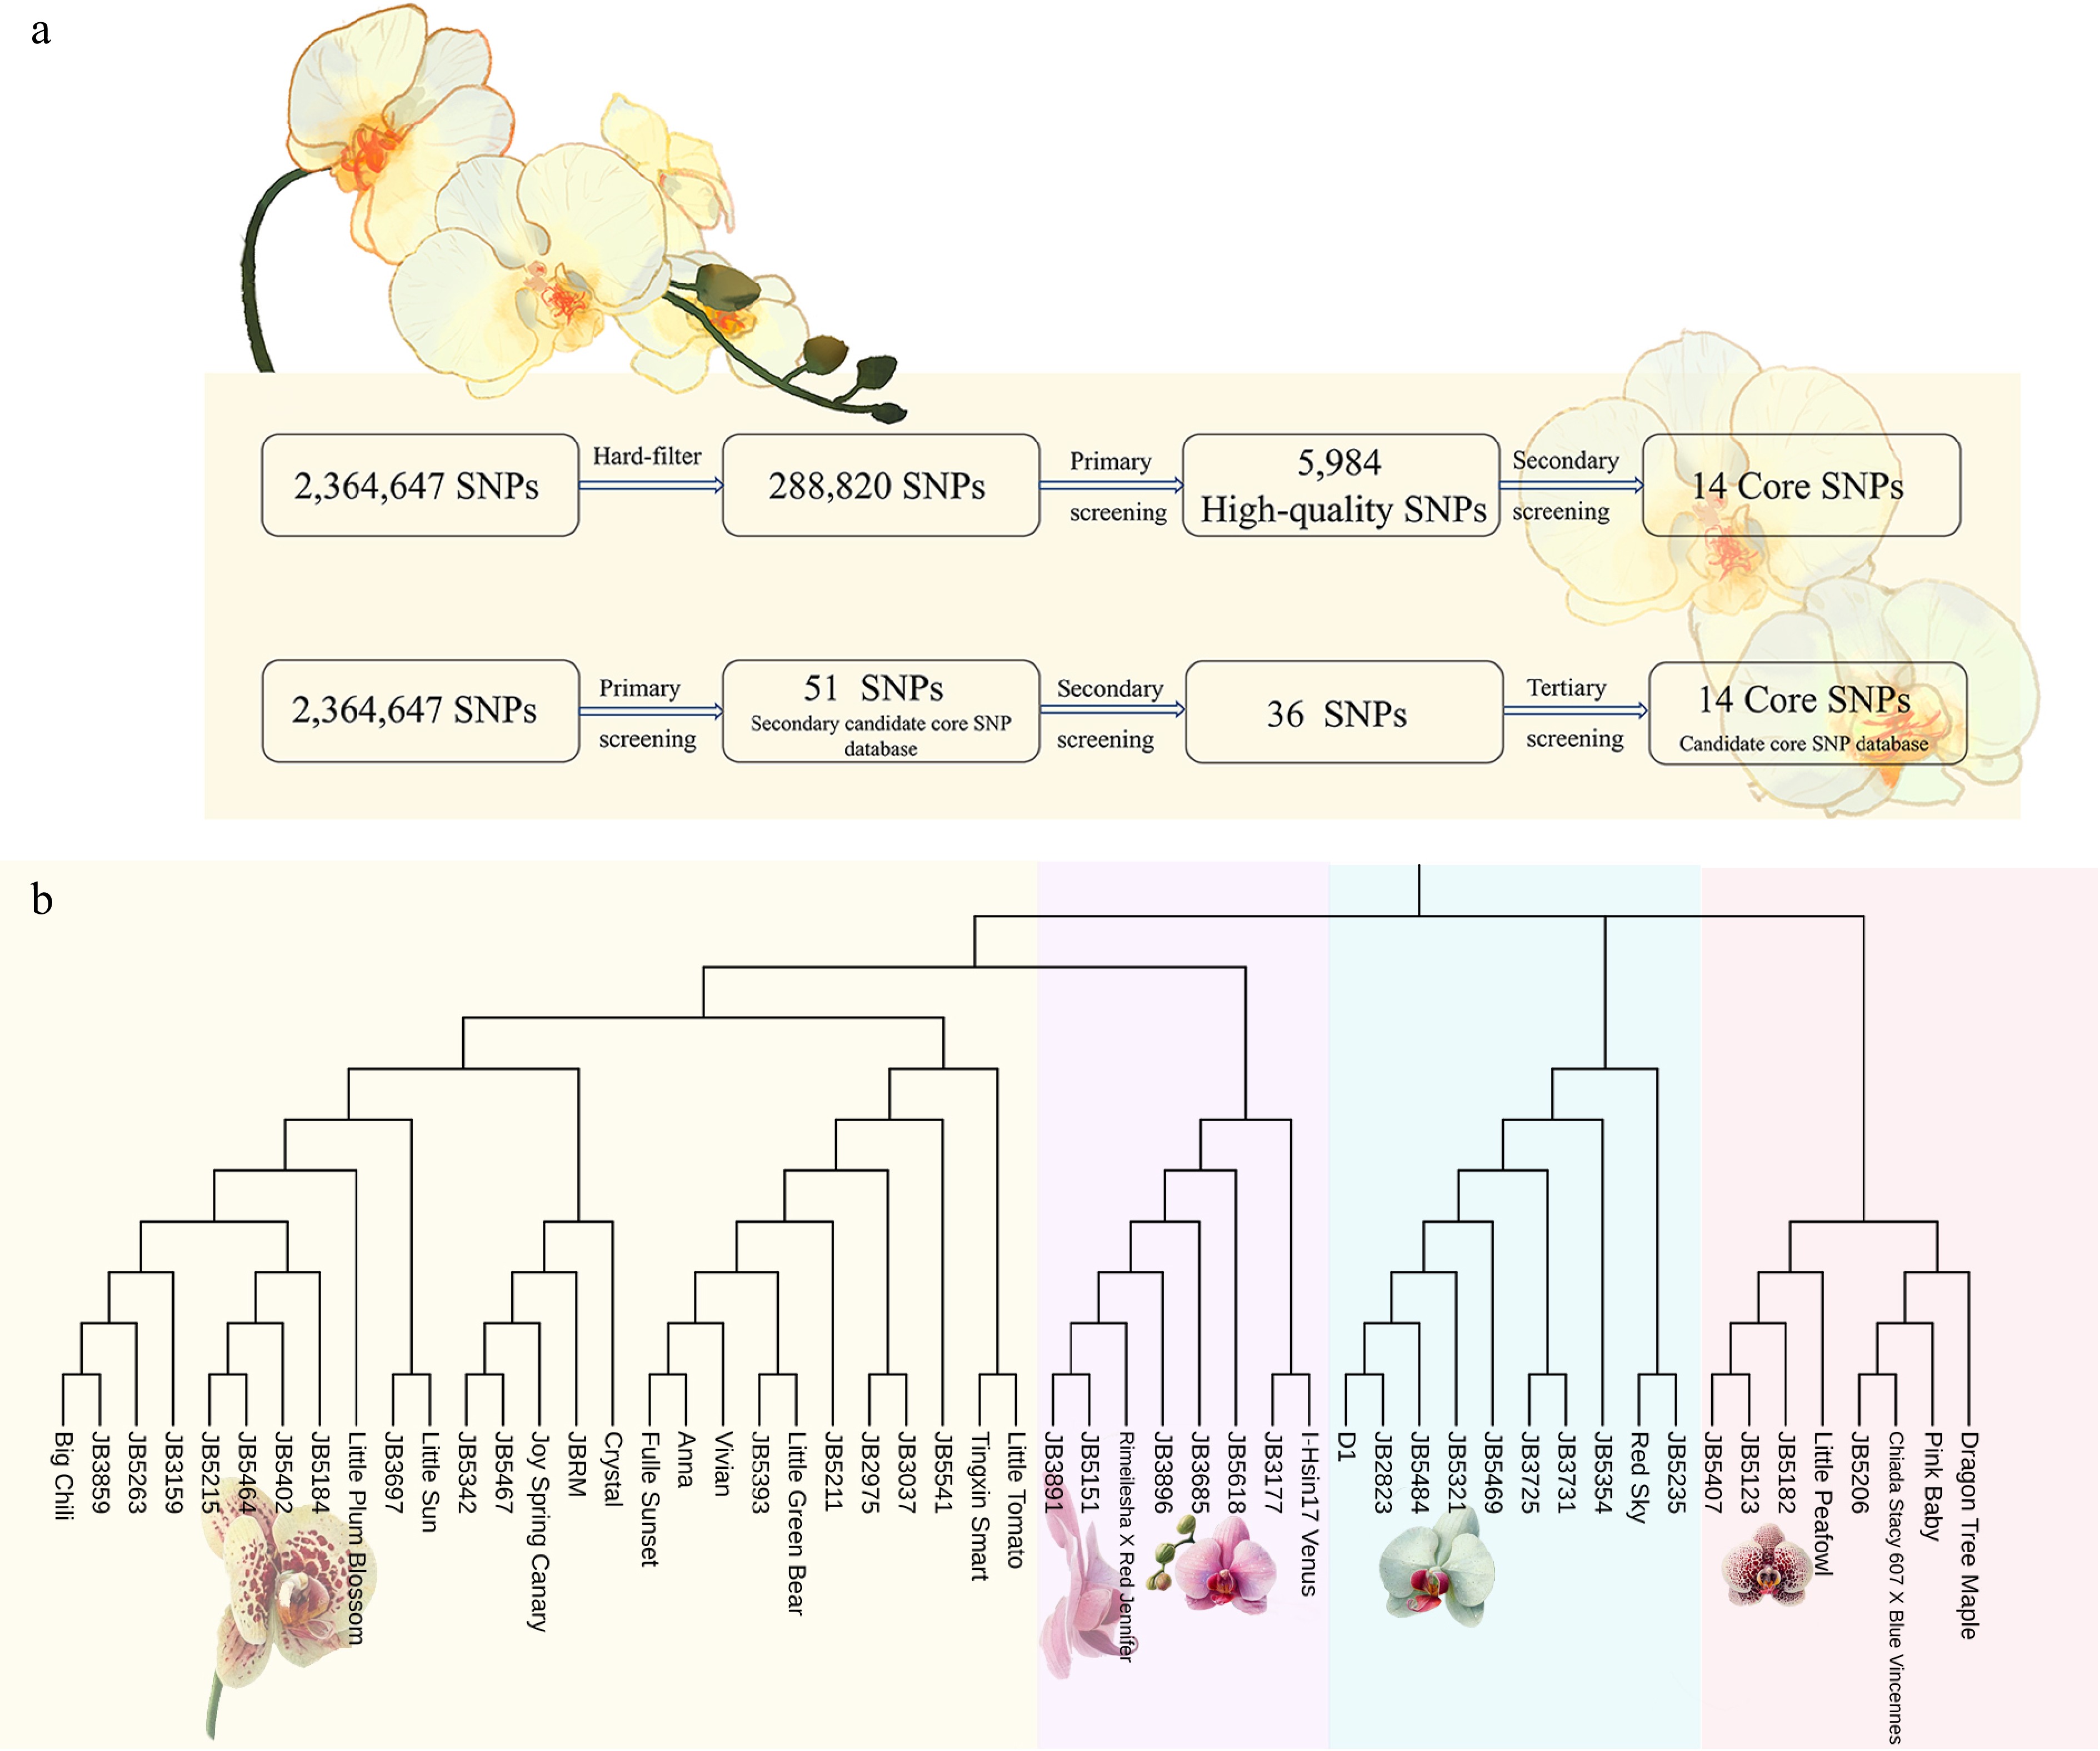
      Figure 6. 

      (a) Flow chart of candidate SNP site screening. (b) NJ tree was constructed based on 14 core SNP sites.

      Table 1.  Genetic diversity parameter of core SNPs.

      Chr Variation type MAF PIC Pi
      scaffold3 T/C 0.18 0.29 1.36E-04
      scaffold17 C/T 0.16 0.27 1.33E-04
      scaffold87 T/A 0.12 0.21 9.27E-05
      scaffold98 C/A 0.11 0.19 9.19E-05
      scaffold138 C/A 0.35 0.45 2.29E-04
      scaffold142 G/T 0.19 0.31 1.23E-04
      scaffold214 G/T 0.27 0.40 1.86E-04
      scaffold260 A/G 0.24 0.36 1.68E-04
      scaffold480 A/C 0.15 0.26 1.27E-04
      scaffold480 T/A 0.50 0.50 3.01E-04
      scaffold562 G/T 0.12 0.20 9.92E-05
      scaffold943 C/G 0.28 0.40 1.81E-04
      scaffold1243 A/G 0.13 0.22 1.04E-04
      scaffold4495 T/A 0.23 0.35 1.77E-04

      We propose that these 14 markers serve as suitable core selections for constructing distinct genetic fingerprints for the identified 53 Phalaenopsis varieties (Supplementary Fig. S2). For the analysis, genotypes identified by the aforementioned core markers were converted into numerical codes (Fig. 7): pure genotypes AA = 1 = yellow, CC = 2 = green, GG = 3 = blue, and TT = 4 = pink; heterozygous genotypes were coded as '5' representing orange; and no call genotypes were represented by NA = 6 = white. Subsequently, fingerprinting was conducted using R software, where individual rows represented specific samples and columns represented SNP marker data (Supplementary Table S4).
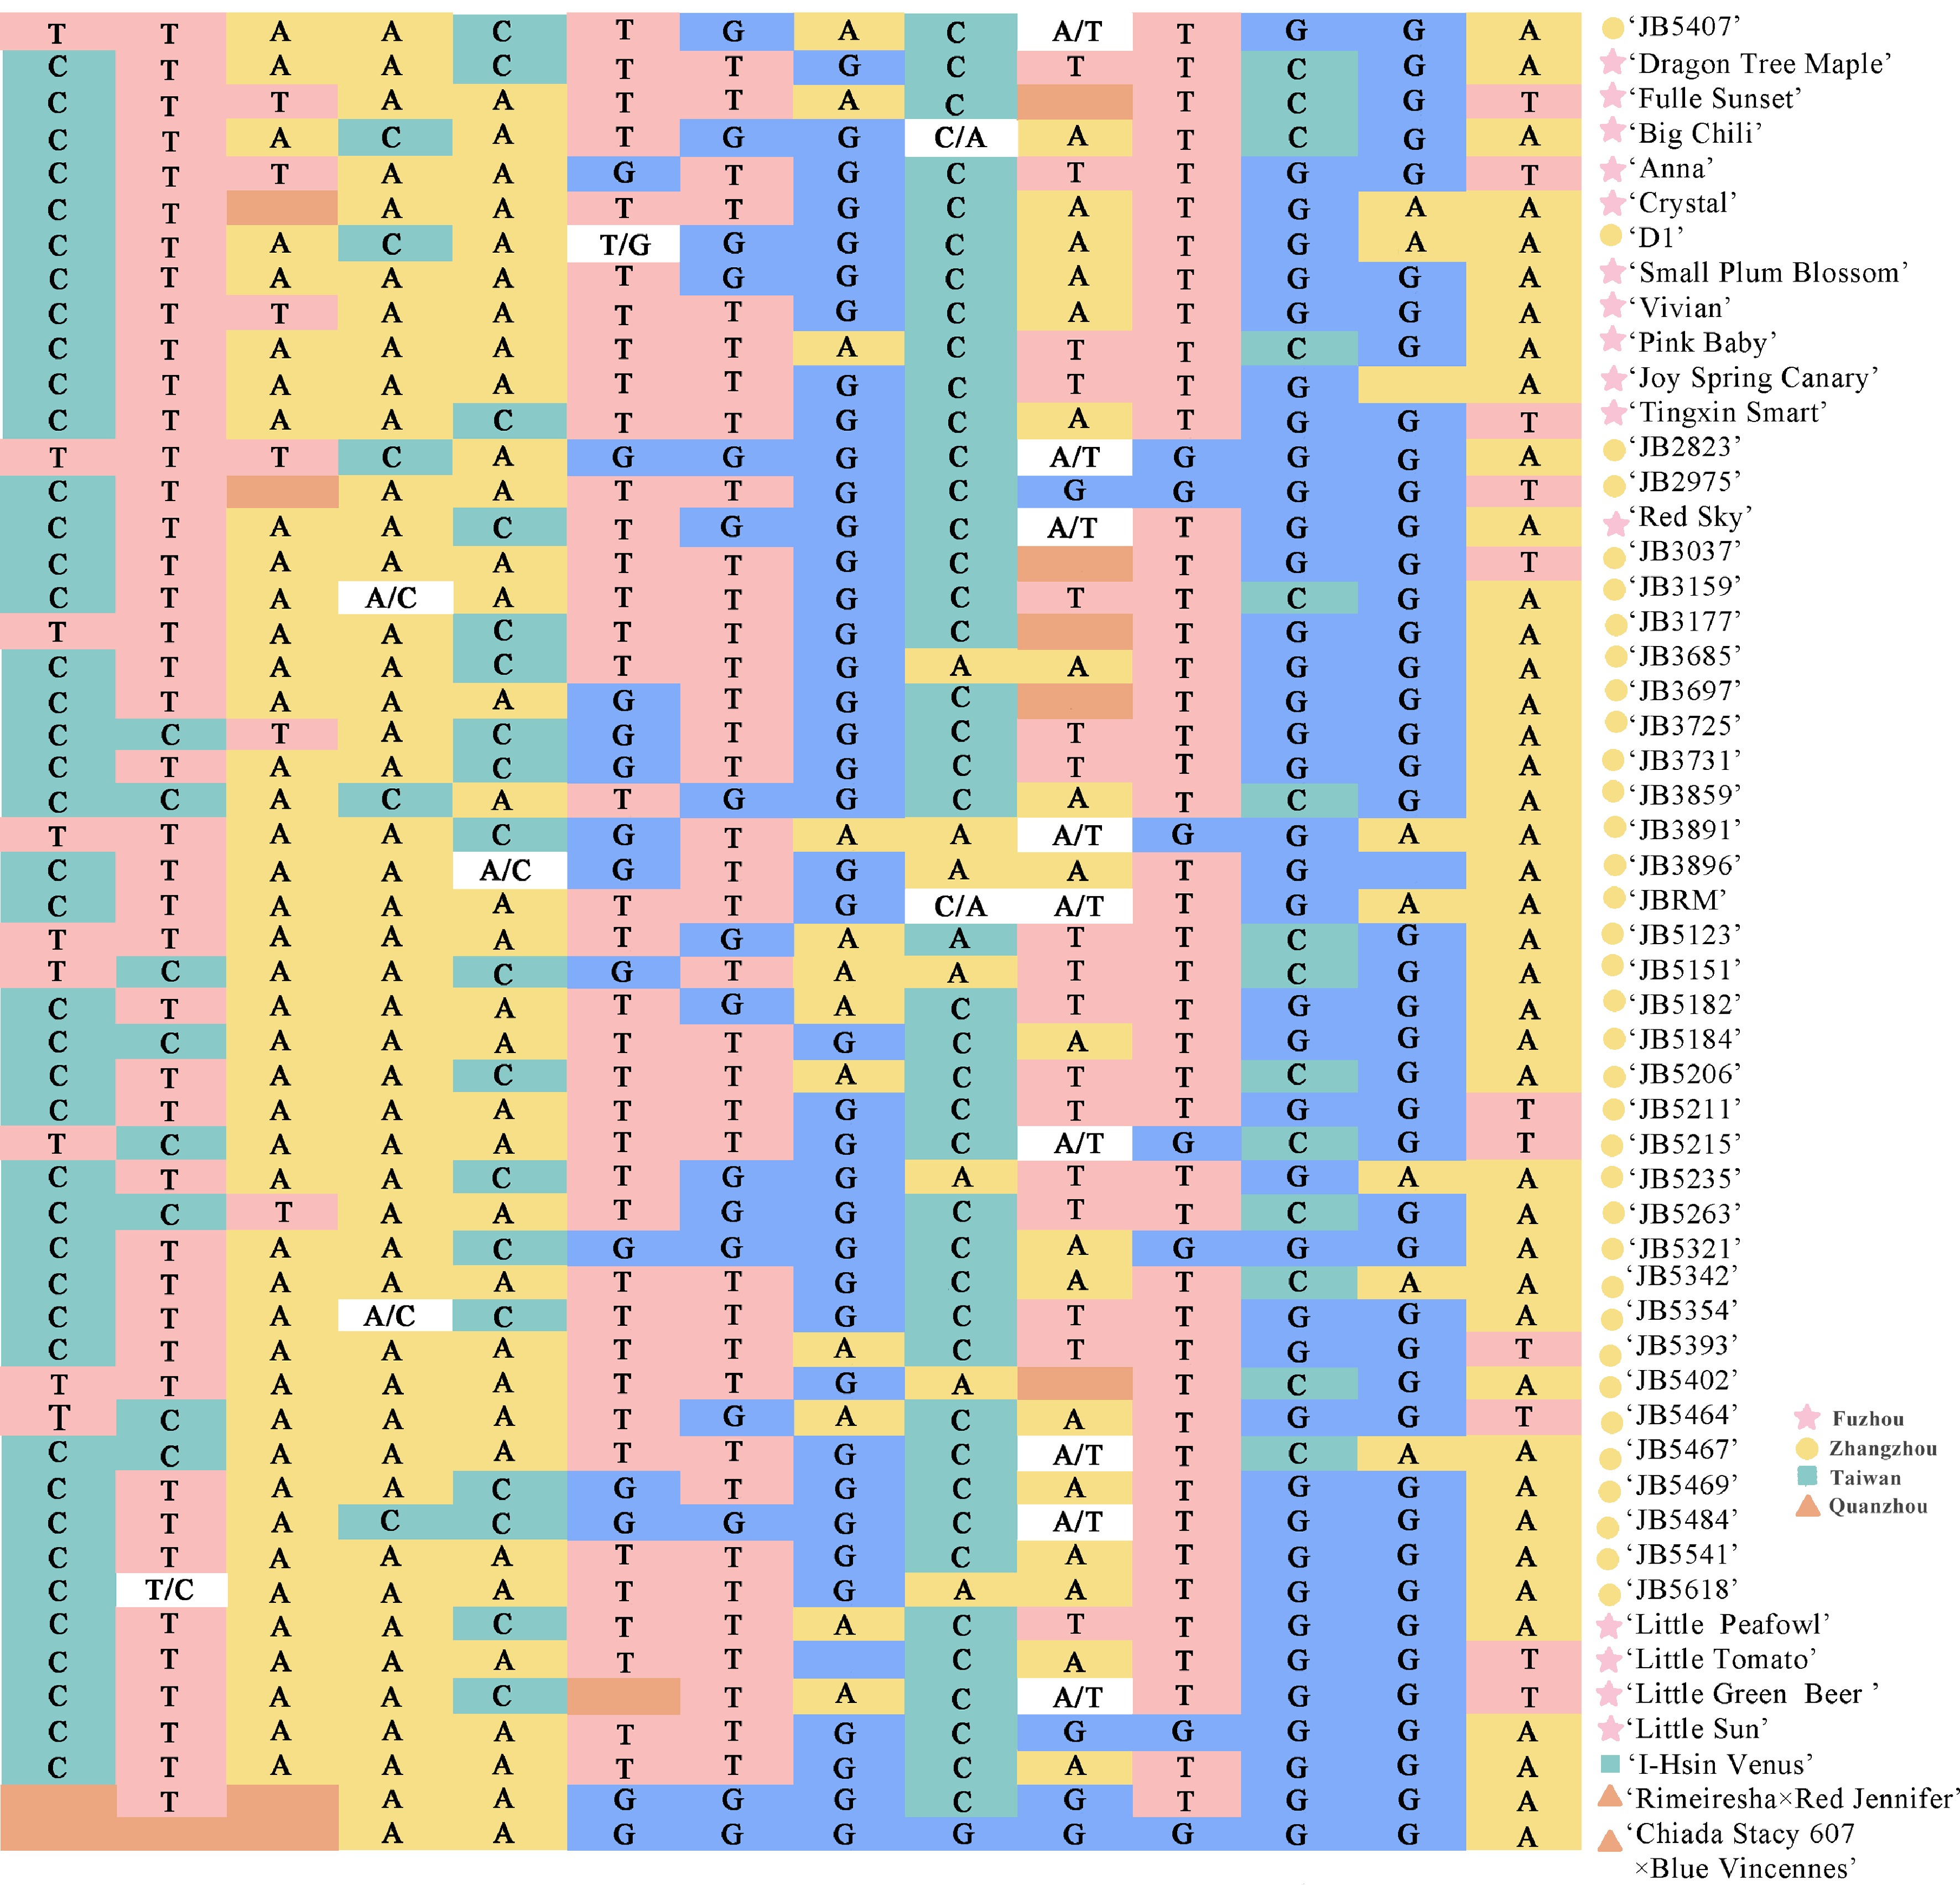
      Figure 7. 

      Fingerprint analysis of 53 Phalaenopsis varieties. Each row represents a sample and each column represents a genome. Pure genotypes are AA = yellow, CC = green, GG = blue, TT = pink; heterozygous genotypes are orange; no call genotypes are white.

    • In previous studies, the identification and genetic diversity of Phalaenopsis species primarily relied on first- or second-generation molecular marker technologies such as RAPD, SSR, SRAP, and ISSR. However, the limited number of genetic marker sites obtained or used constrained the comprehensive exploration of polymorphic sites and genetic information at the whole-genome level. In contrast, SNP markers, as third-generation molecular markers, offer advantages including high stability, precision, an abundance of sites, and direct relevance to phenotypic traits, surpassing other types of molecular markers.

      Based on our research, we selected 53 popular market varieties for whole-genome resequencing to efficiently and accurately obtain genetic information and polymorphism loci of Phalaenopsis species. The effectiveness of phenotypic association analysis depends on large scale, high-quality phenotypic data, and highly diverse population backgrounds[34]. In addition, in the specific phenotypic characteristics of Phalaenopsis, the performance of floral fragrances, flower patterns and other traits are usually affected by complex genetic regulation and environmental factors, and large-scale population and environmental repeated experiments are needed to reduce errors caused by environmental changes[35,36]. Therefore phenotypic association analysis was not employed. With the limited sample population size, core SNP screening was conducted based on the screening parameters suggested in previous literature. Although phenotypic association analysis can provide more targeted character-specific SNPs, core SNP screening methods based on the previous research can still generate representative sets of SNPs for germplasm resource identification and genetic diversity analysis under resource constraints. Furthermore, the preliminary results of this study show that the NJ tree of 14 core SNPs is highly consistent with the clustering results based on 5,984 genome-wide SNPs, further demonstrating the validity and representatives of the set of SNPs produced by these screening parameters in reflecting population structure and genetic diversity. Also, in the future, it is possible to combine large-scale phenotypic data to further apply character-based phenotypic-genotype association analysis methods to identify SNPs associated with specific traits (such as flower type, and aroma) and create more accurate fingerprints for each variety. This approach will be more helpful in digging deeper into the genetic basis of the specific phenotype of Phalaenopsis.

      Most of the SNP variation sites were located in intergenic regions, with a certain degree of distribution observed in intronic, upstream, and downstream regions, likely due to close interspecific hybridization and frequent gene exchange. This hypothesis was supported by statistical analysis and subsequent principal component analysis (PCA) of phenotypic traits, as well as the construction of evolutionary trees. PCA indicated gene exchange, while genetic structure analysis based on Admixture revealed no significant population structure within the tested Phalaenopsis population. The discovery that core SNPs are distributed across multiple scaffolds may be attributed to the incomplete chromosome-level assembly of the P. aphrodite genome. During sequencing, the genome is typically fragmented into contigs or scaffolds, which are then aligned to form larger assemblies. If gaps exist within the assembly, scaffolds may remain unanchored to specific chromosomes. Consequently, in the absence of chromosome-level resolution, SNPs may be dispersed across various scaffolds rather than being accurately localized to distinct chromosomal regions[36]. At the same time, the loss of centromere regions may also be due to the lack of accurate labeling of these regions in the reference genome itself, which affects mutation detection and SNP localization, resulting in a lack of detailed centromere information in the final genome[37].

      The NJ evolutionary tree was established based on 5,984 SNP loci. Clustering divided the 53 germplasms into 19 subgroups, with several relatively independent clusters. Studies suggest that asexual breeding and artificial selection may lead to an accumulation of genetic variation in germplasm, increasing genetic distance, and forming multiple relatively independent clusters. Tissue culture, the primary breeding method in the Phalaenopsis industry, is asexual and follows a stable breeding strategy. It can be inferred that this unique reproduction mode is a significant reason for the indistinct population structure observed. The genetic structure analysis from this study showed that most Phalaenopsis germplasms were aggregated, except for some from Zhangzhou, which were distant from the main cluster. Therefore, these highly heterozygous Phalaenopsis varieties exhibit common inheritance patterns, suggesting complex multiple crosses among their parents. Although this study is limited by sample size, the results accurately reflect the genetic background of Phalaenopsis varieties to some extent and hold substantial reference value.

    • In this study, genome skimming was employed to develop SNP markers. From 2,364,647 potential sites, 5,984 high-quality SNP sites were identified, leading to the establishment of a high-quality SNP database for Phalaenopsis cultivars. Among these, 14 core SNPs were selected for generating related DNA fingerprint codes for 53 Phalaenopsis cultivars various commercial varieties available in the market. The construction of Phalaenopsis DNA fingerprints provides technical support and promotes the development of molecular plant breeding for variety identification, relatedness delineation, and the collection and conservation of germplasm resources.

      • This work was supported by the National Key Research and Development Program of China (2023YFD1600504), Fujian Provincial Natural Science Foundation of China (2023J01283), and the Key Research and Development Program of Ningxia Hui Autonomous Region (2022BBF02041).

      • The authors confirm contribution to the paper as follows: study conception and methodology: Peng D, Zhou Y, Zhao K; data curation, writing-original draft preparation: Chen X, Wang Q; writing-reviewing and editing: Wang F, Wu X, Guan Y; software: Chen X, Pan Y; formatting, correction: Xue L, Duan Y; charting: Chen X, Wang S. All authors reviewed the results and approved the final version of the manuscript.

      • The raw resequencing data have been deposited in Genome Sequence Archive of National Genomics Data Center under the following accession: CRA020415. All data generated or analyzed during this study are included in this published article and its supplementary information files, and also available from the corresponding author on reasonable request.

      • The authors declare that they have no conflict of interest.

      • Copyright: © 2025 by the author(s). Published by Maximum Academic Press, Fayetteville, GA. This article is an open access article distributed under Creative Commons Attribution License (CC BY 4.0), visit https://creativecommons.org/licenses/by/4.0/.
    Figure (7)  Table (1) References (37)
  • About this article
    Cite this article
    Chen X, Wang Q, Wang F, Wu X, Pan Y, et al. 2025. SNP fingerprint database and makers screening for current Phalaenopsis cultivars. Ornamental Plant Research 5: e011 doi: 10.48130/opr-0025-0005
    Chen X, Wang Q, Wang F, Wu X, Pan Y, et al. 2025. SNP fingerprint database and makers screening for current Phalaenopsis cultivars. Ornamental Plant Research 5: e011 doi: 10.48130/opr-0025-0005

Catalog

  • About this article

/

DownLoad:  Full-Size Img  PowerPoint
Return
Return