-
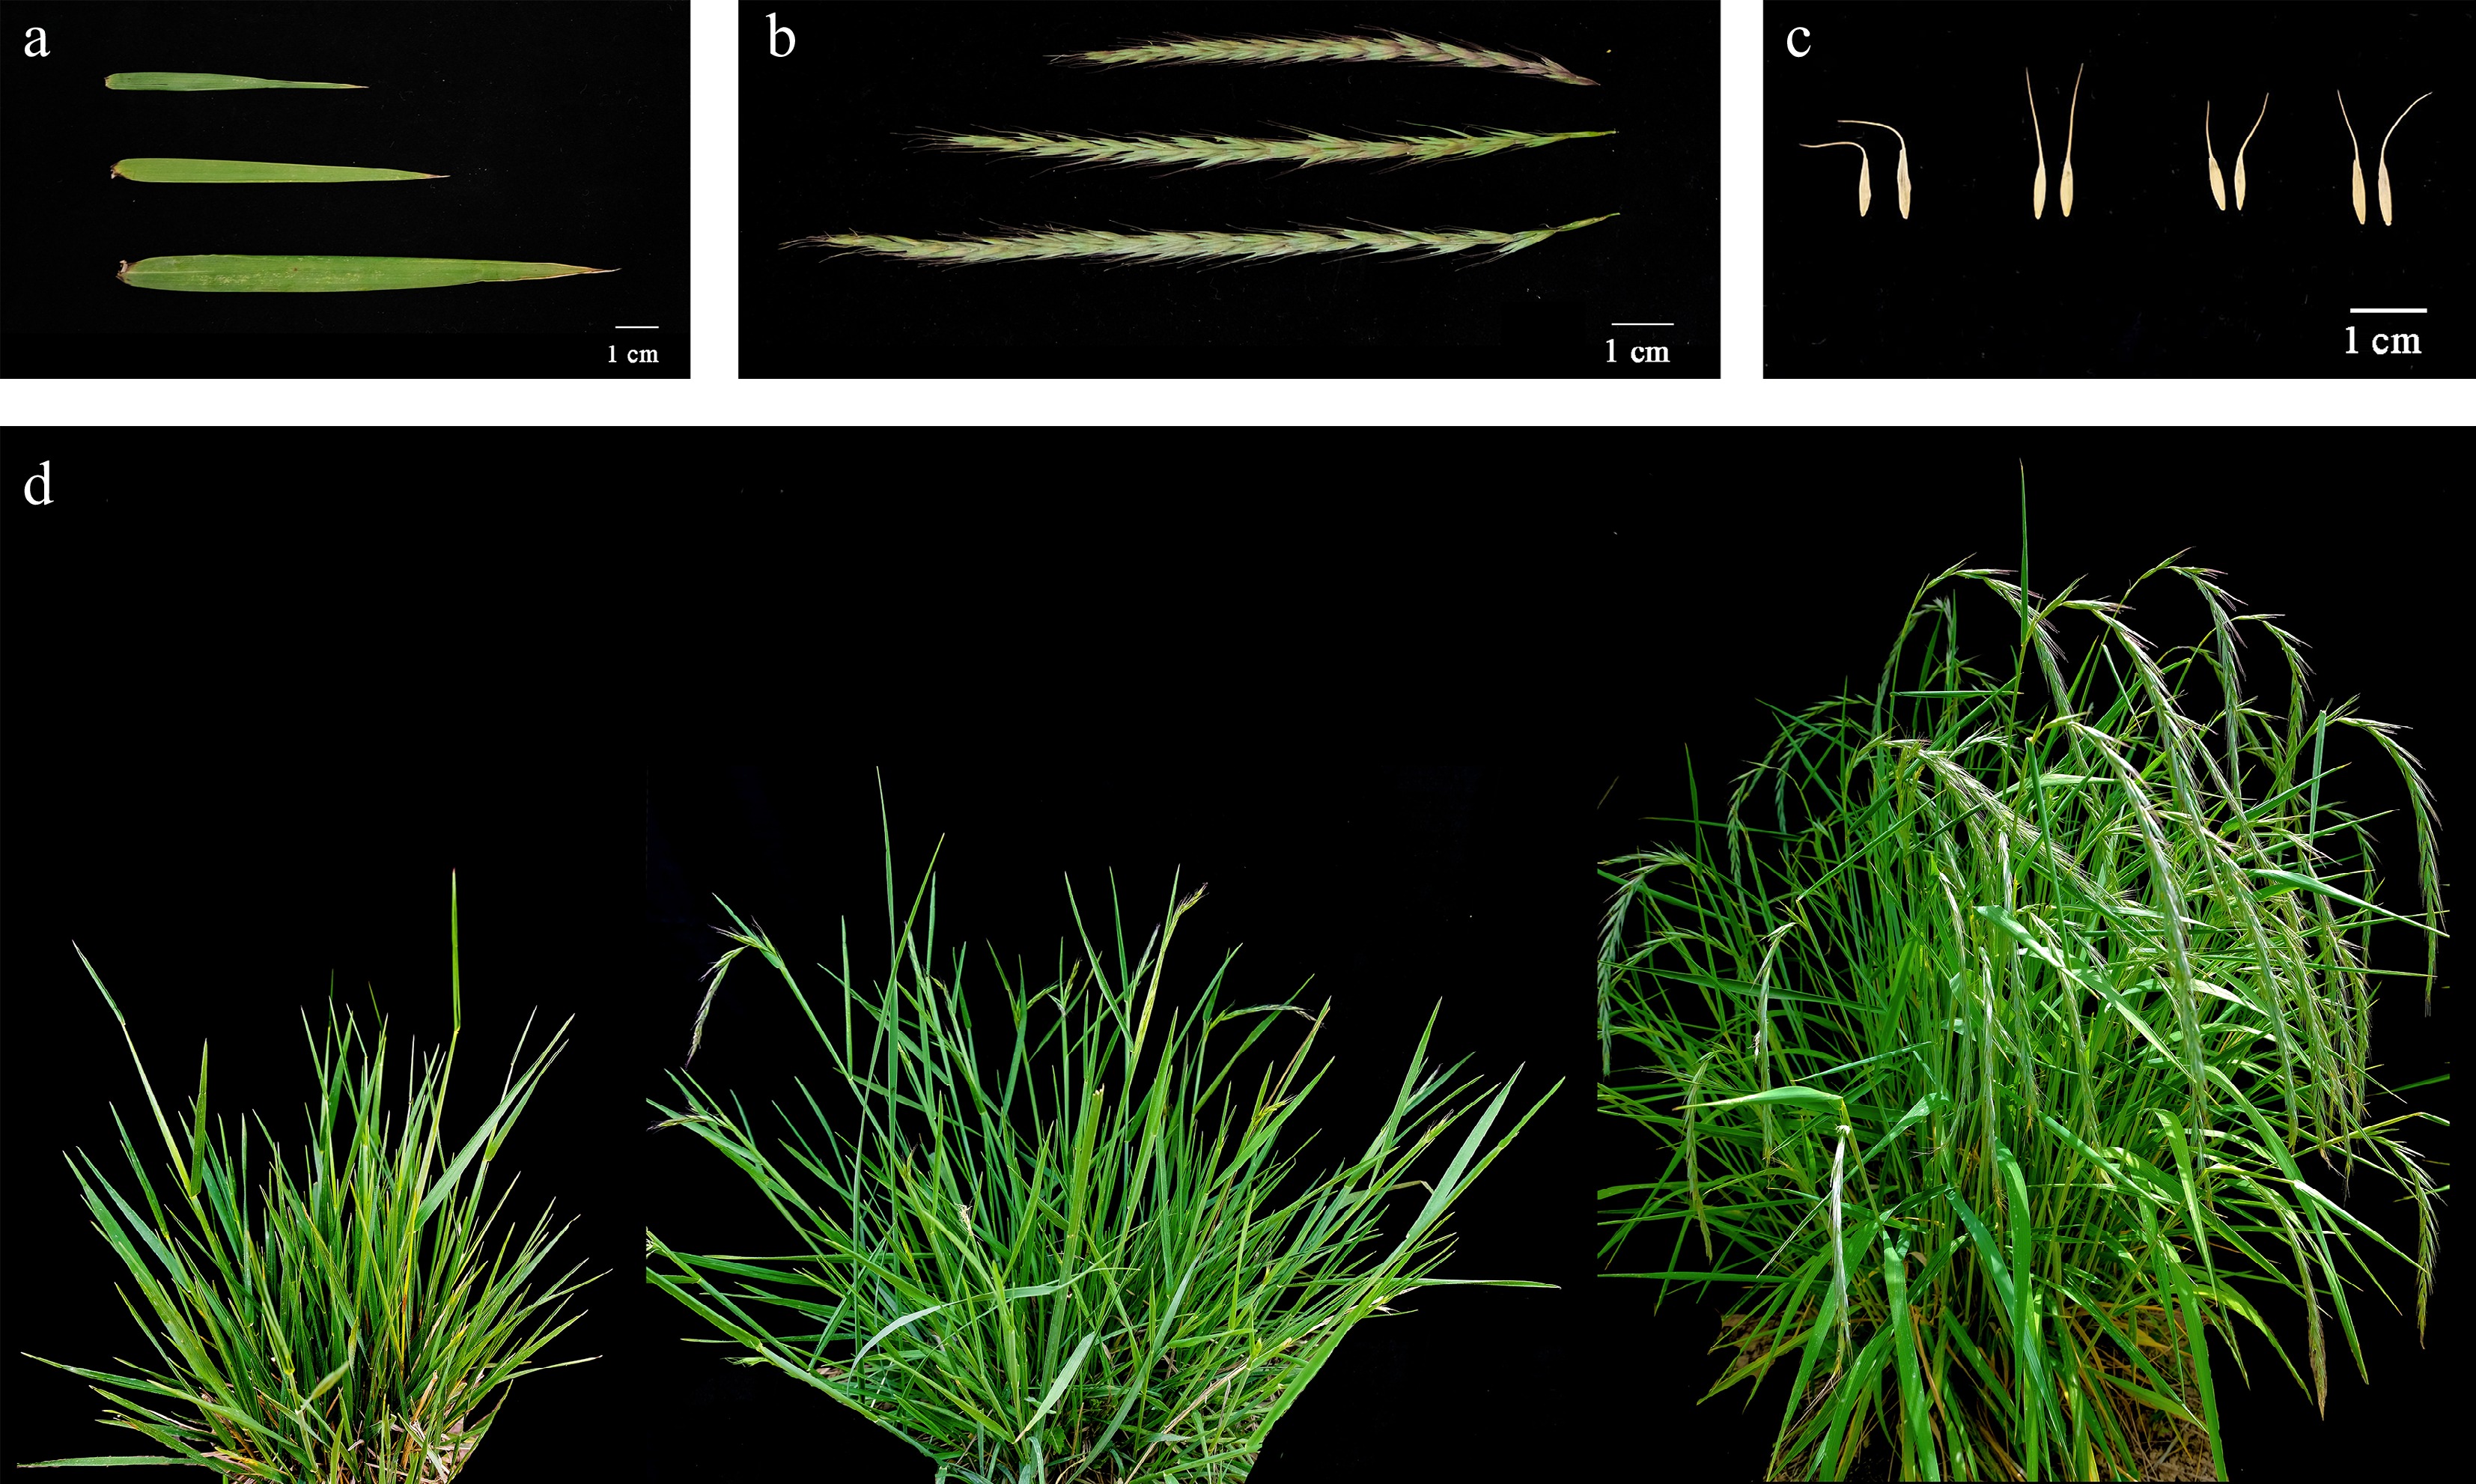
Figure 1.
Variation on morphologic traits of E. sibiricus. (a) Leaf, (b) spike, (c) seed, (d) development time.
-
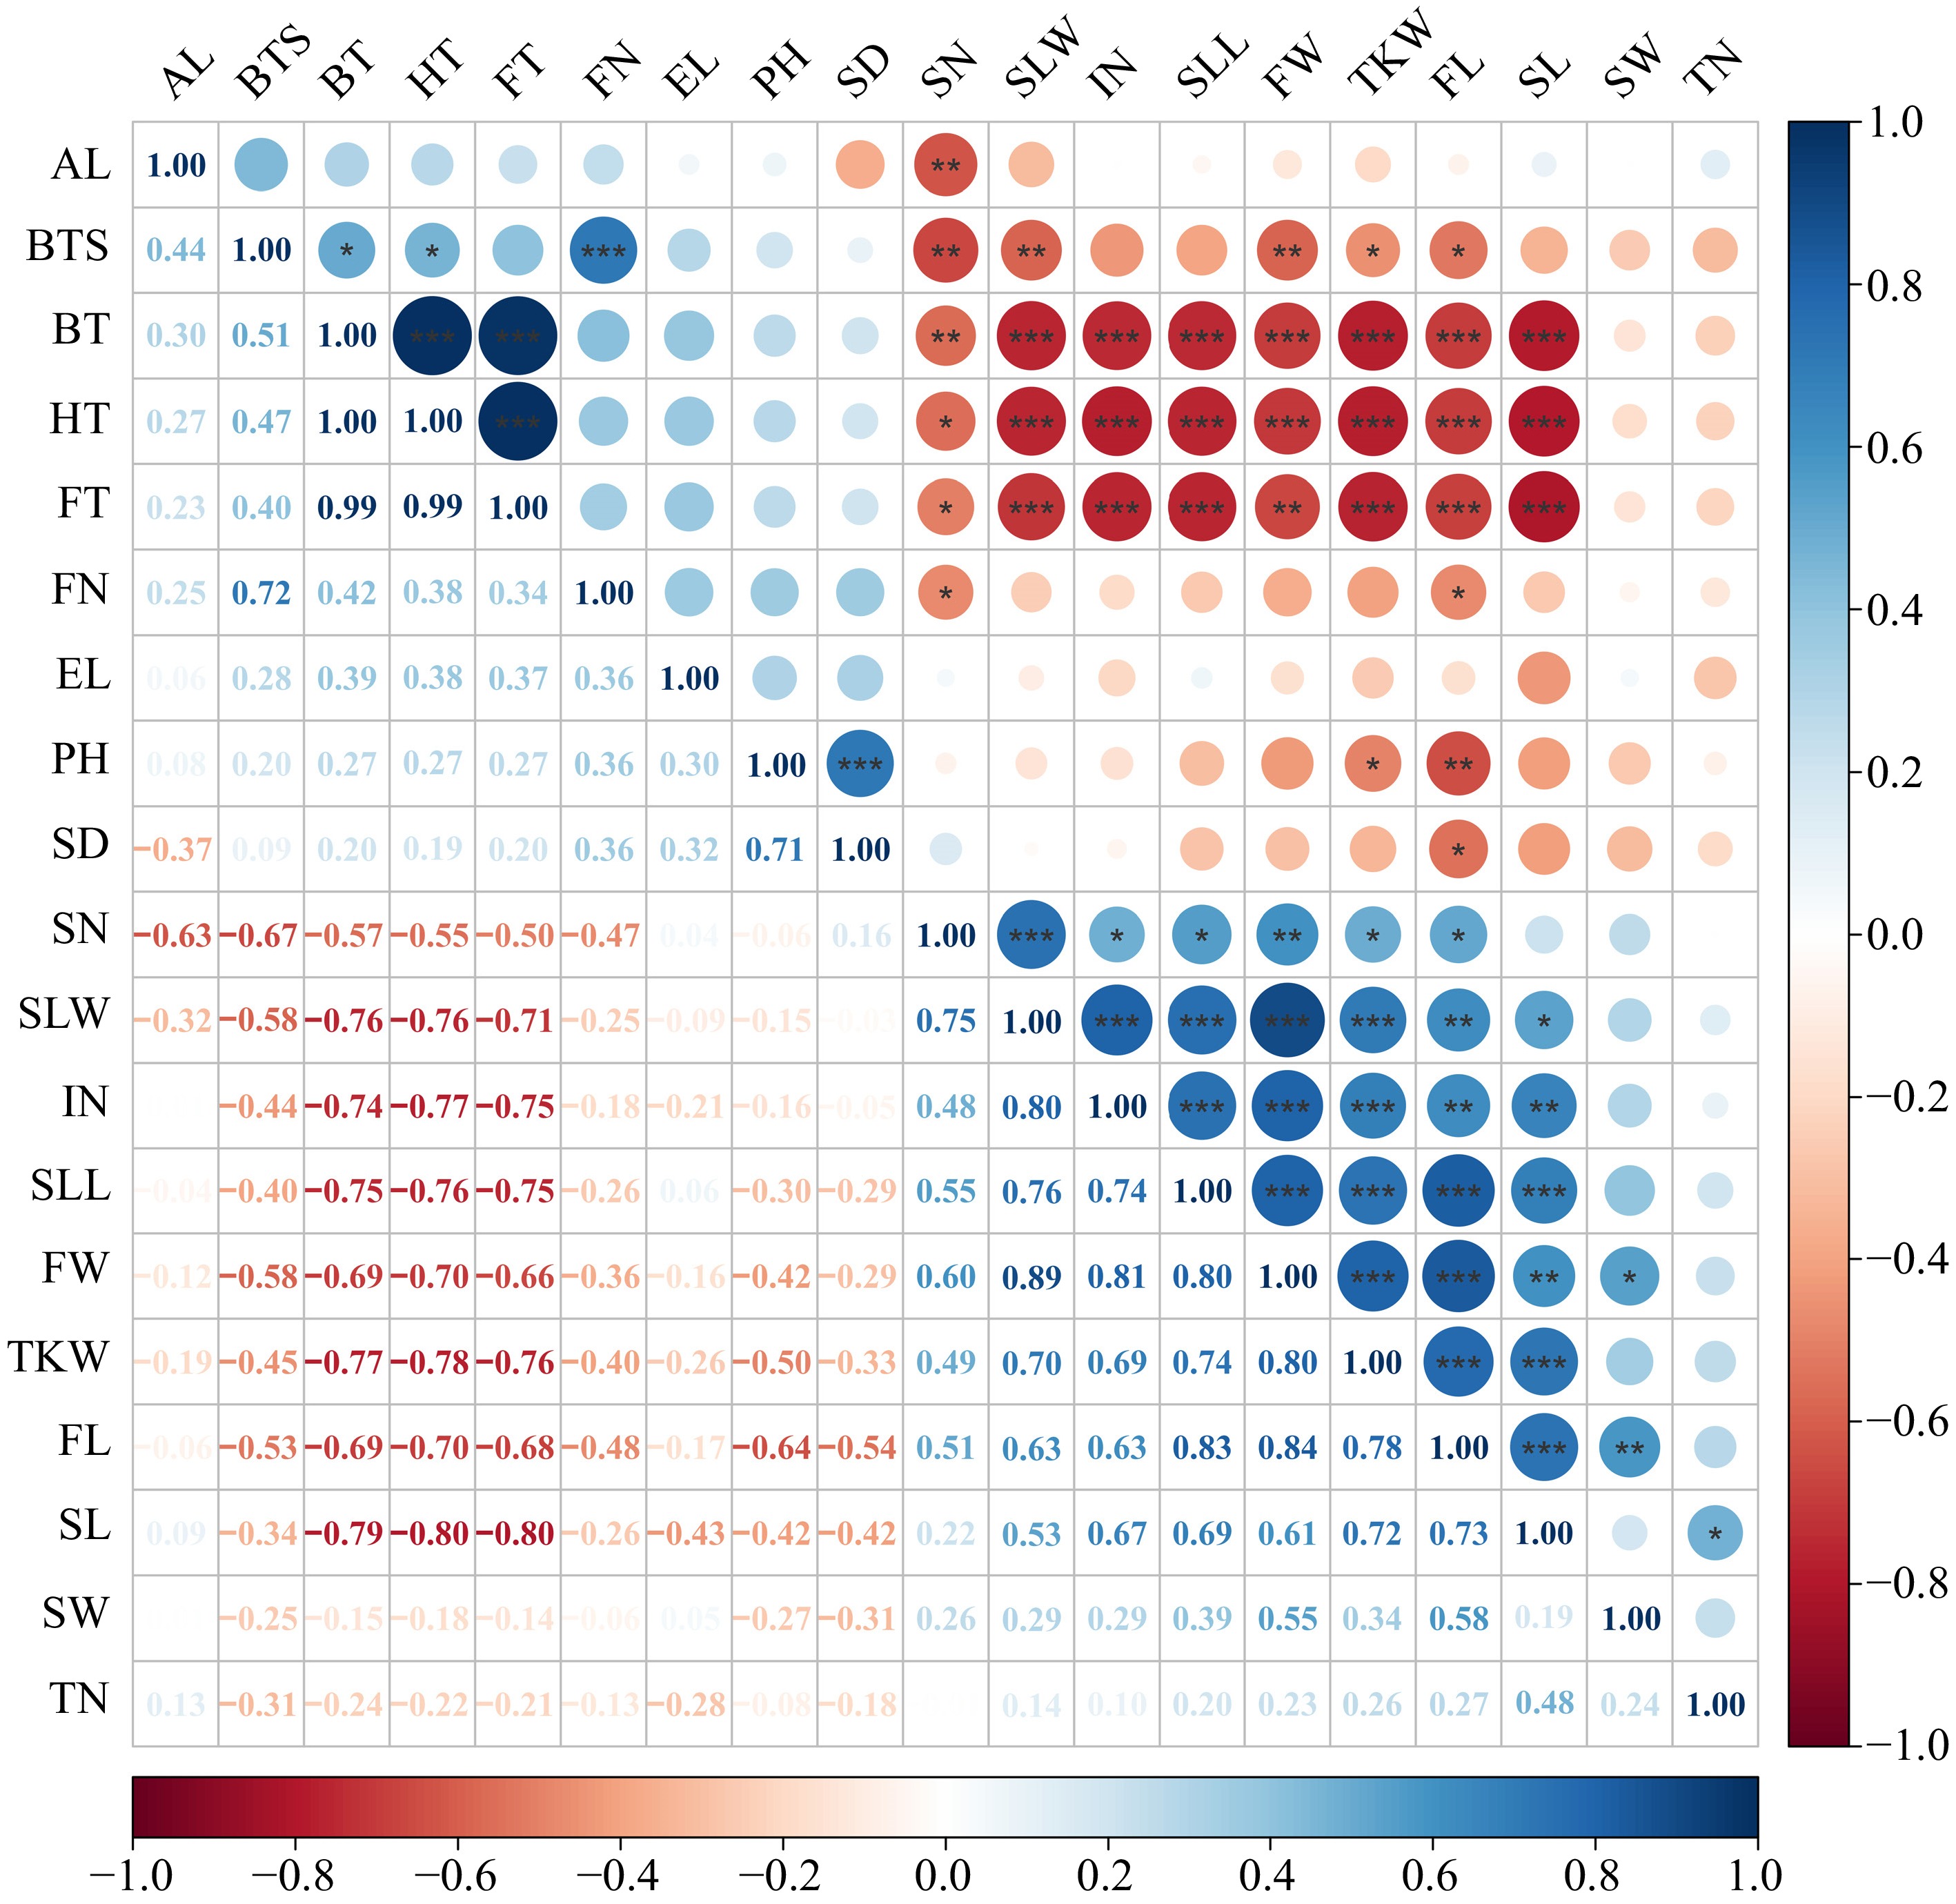
Figure 2.
Correlation analysis of phenotypic traits of E. sibiricus in the margin of NEQTP. In the legend, a darker color indicates a stronger correlation, whereas a lighter color implies a weaker one. Flag leaf length (FL), Flag leaf width (FW), Second leaf length (SLL), Second leaf width (SLW), Stem diameter (SD), Internodes number (IN), Spikelet number per branches (SN), Florets number per spikelet (FN), Ear length (EL), Plant height (PH), Tiller number (TN), Breaking tensile strength (BTS), Seed length (SL), Seed width (SW), Awn length (AL), Thousand kernel weight (TKW), Booting time (BT), Heading time (HT), Flowering time (FT).
-
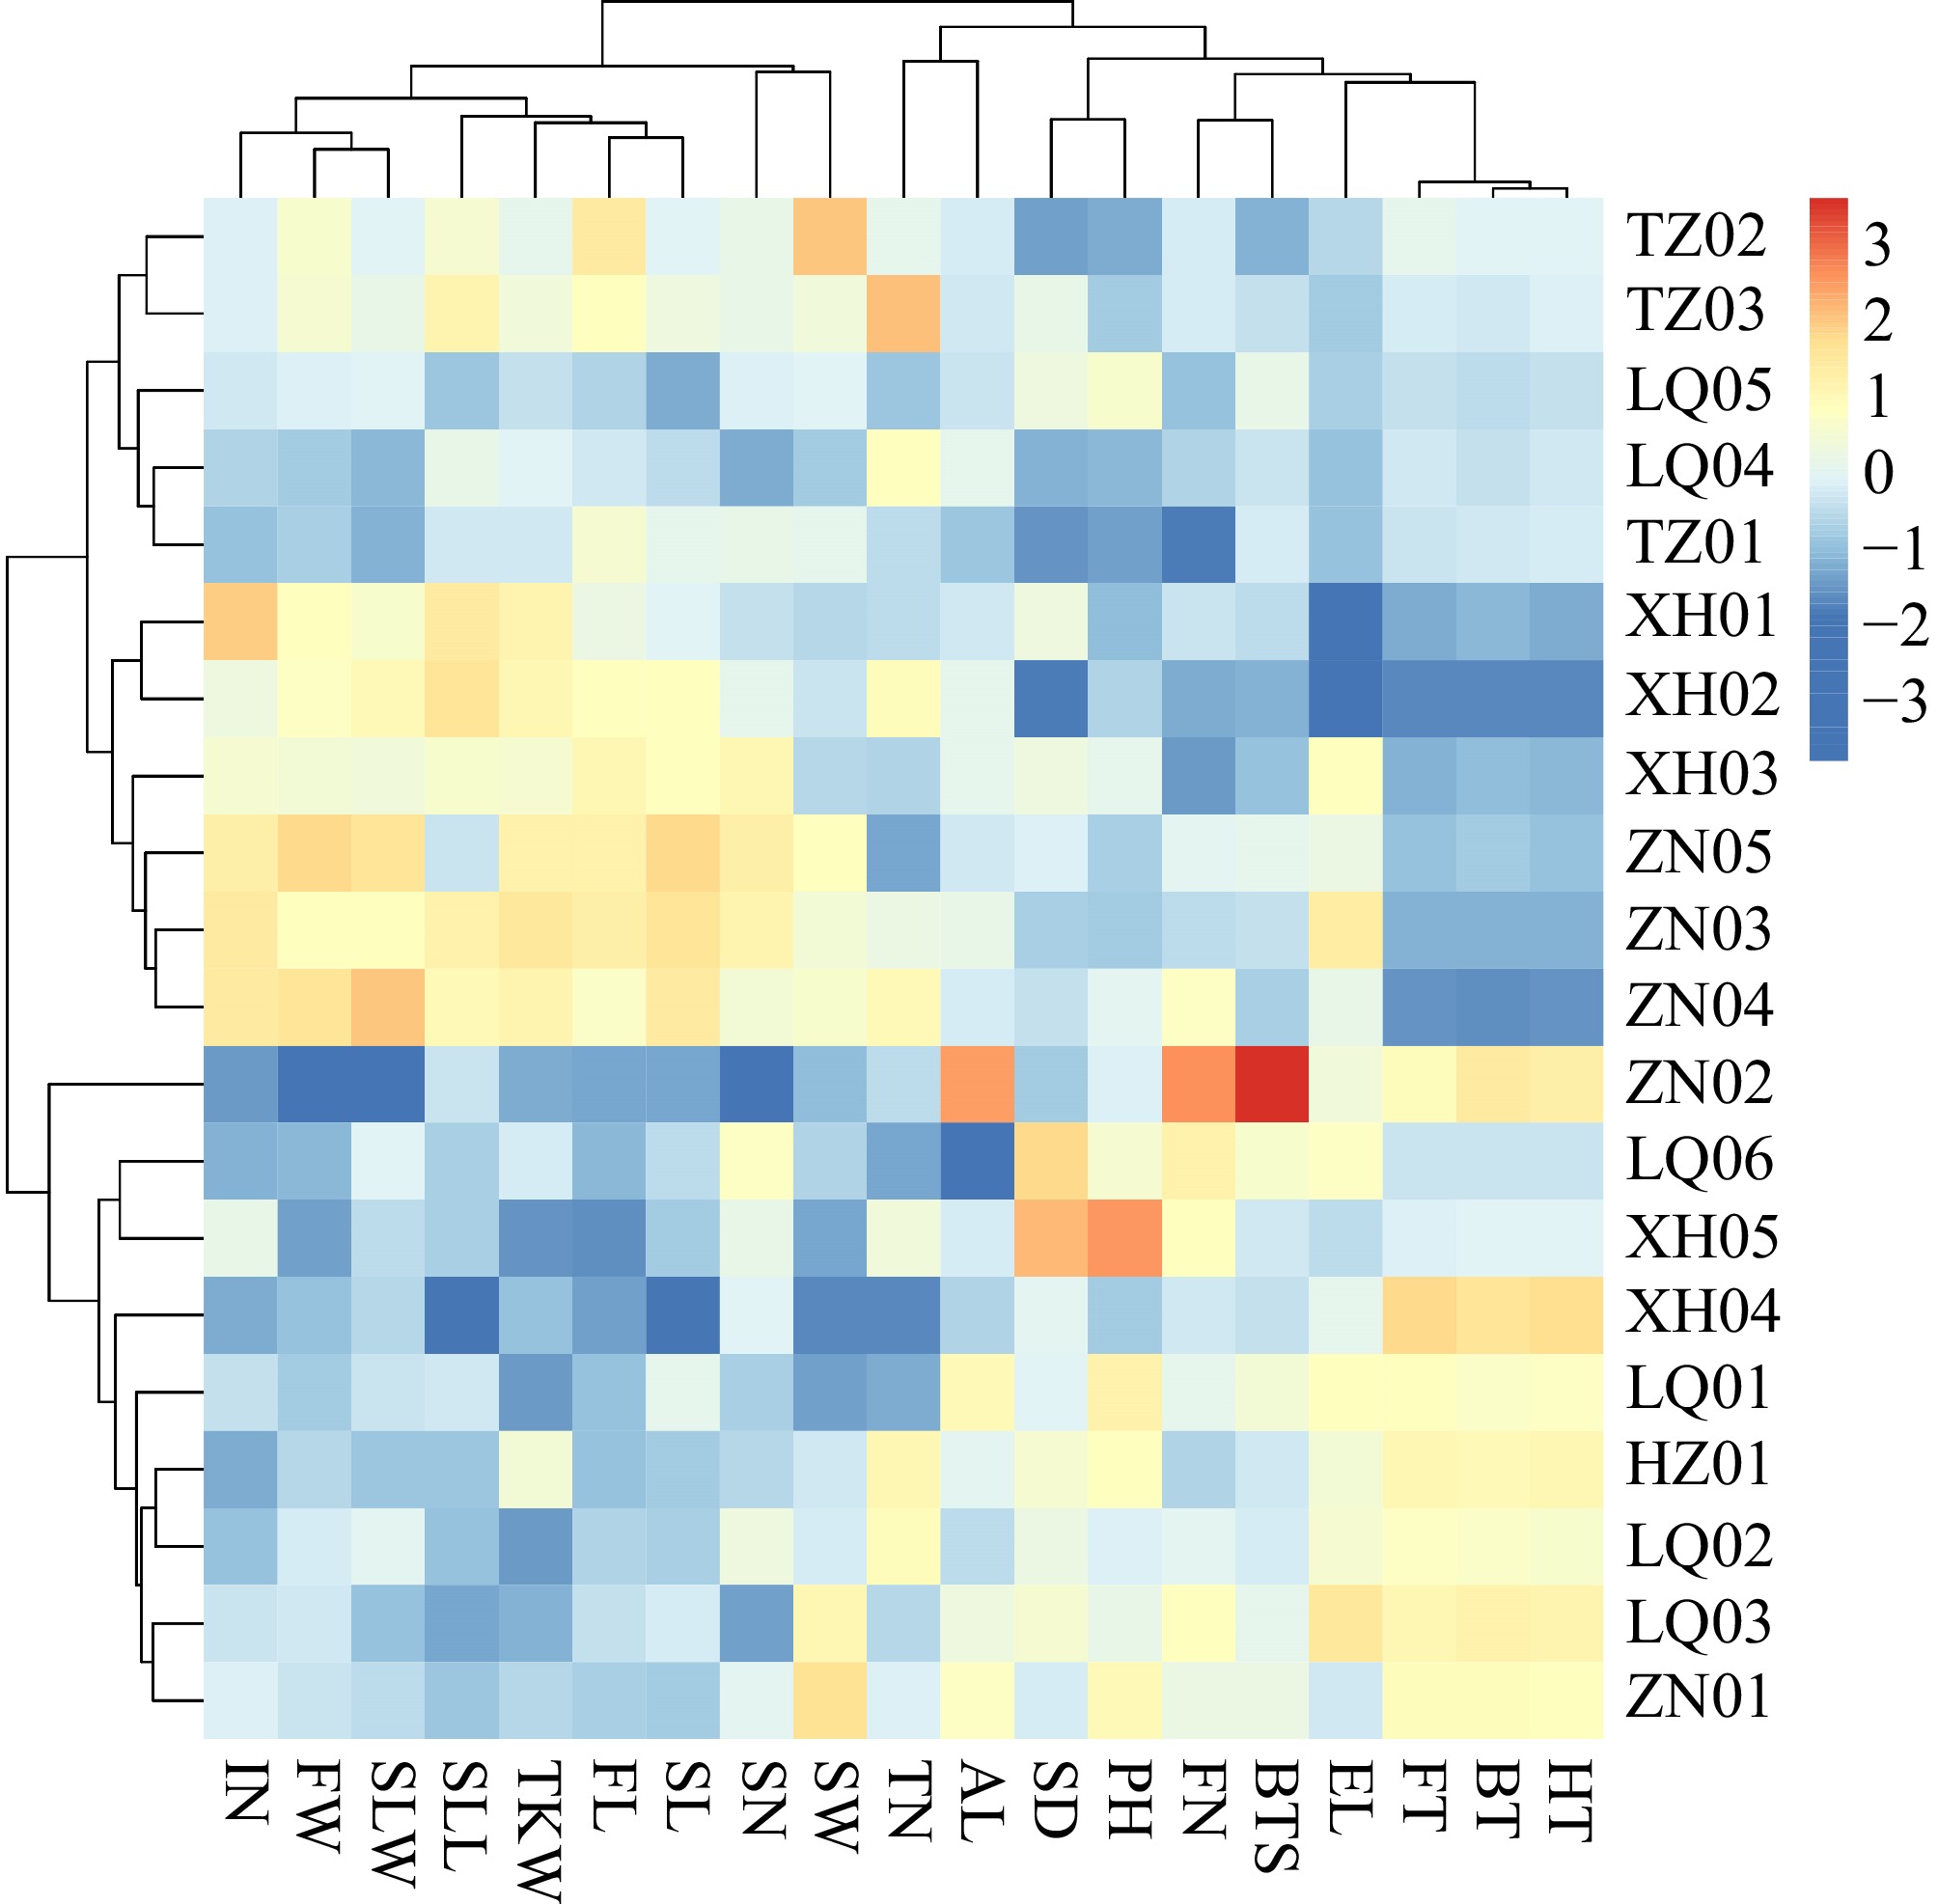
Figure 3.
The clustering heat map of genotypic traits in the populations of E. sibiricus. Flag leaf length (FL), Flag leaf width (FW), Second leaf length (SLL), Second leaf width (SLW), Stem diameter (SD), Internodes number (IN), Spikelet number per branches (SN), Florets number per spikelet (FN), Ear length (EL), Plant height (PH), Tiller number (TN), Breaking tensile strength (BTS), Seed length (SL), Seed width (SW), Awn length (AL), Thousand kernel Weight (TKW).
-
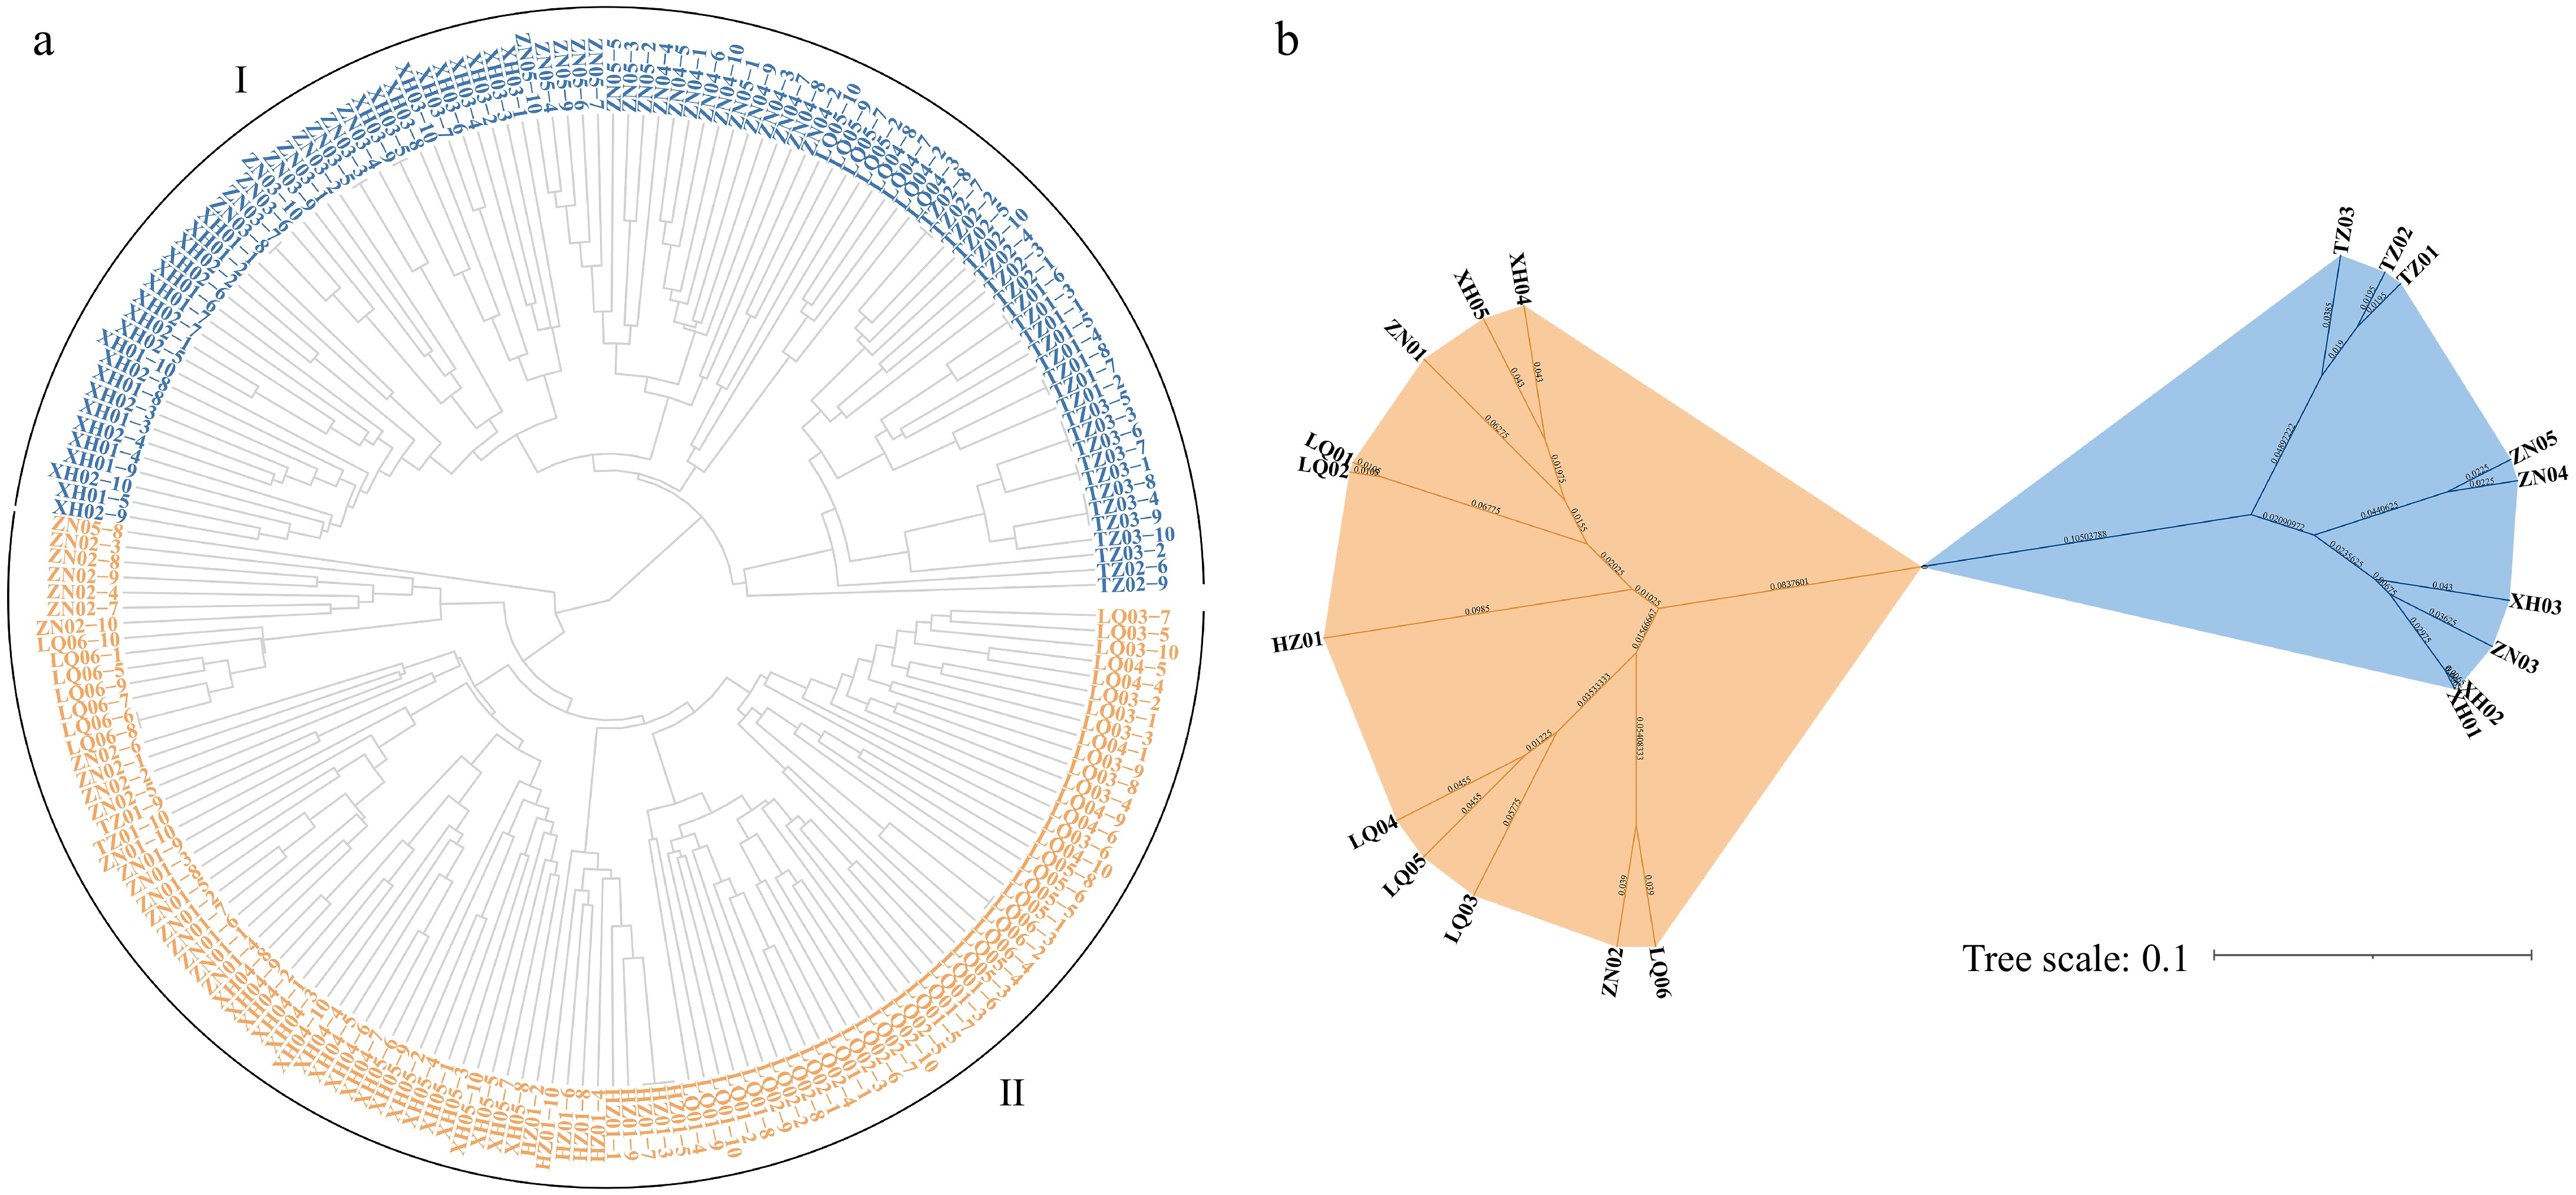
Figure 4.
Cluster analysis of E. sibiricus in the margin of NEQTP (a) based on individual plants, (b) based on populations.
-
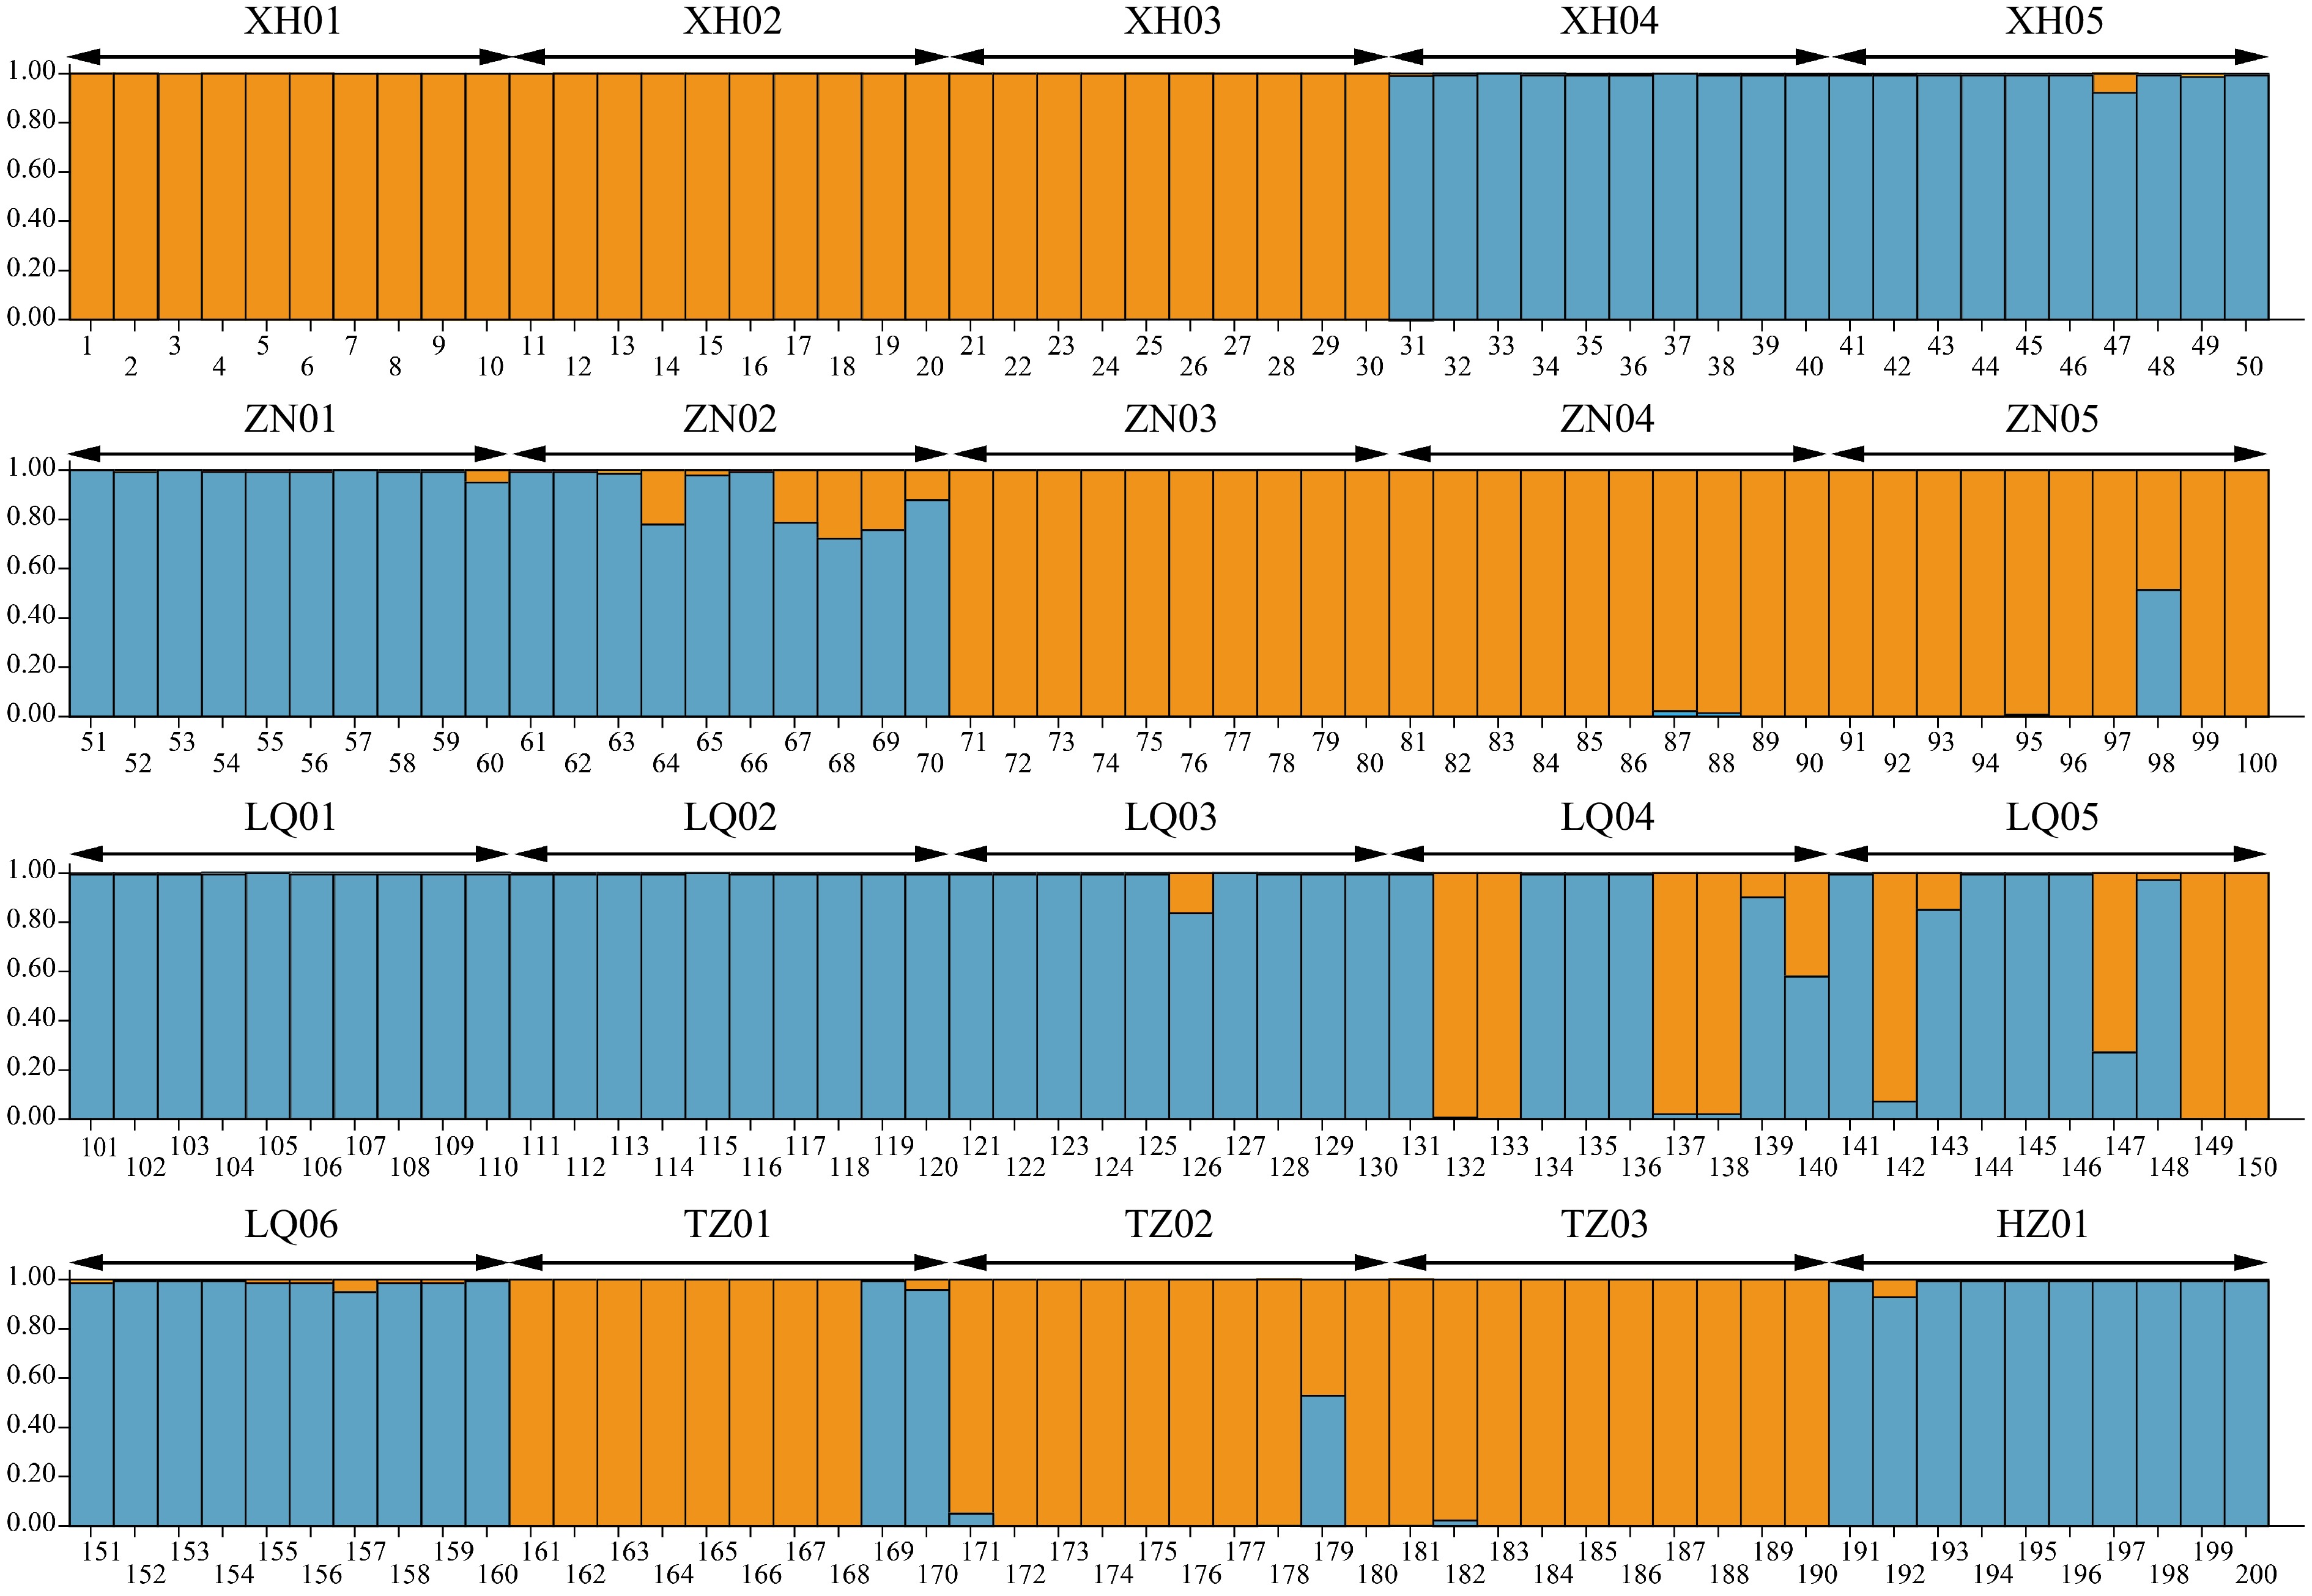
Figure 5.
The STRUCTURE analysis of E. sibiricus populations in NEQTP.
-
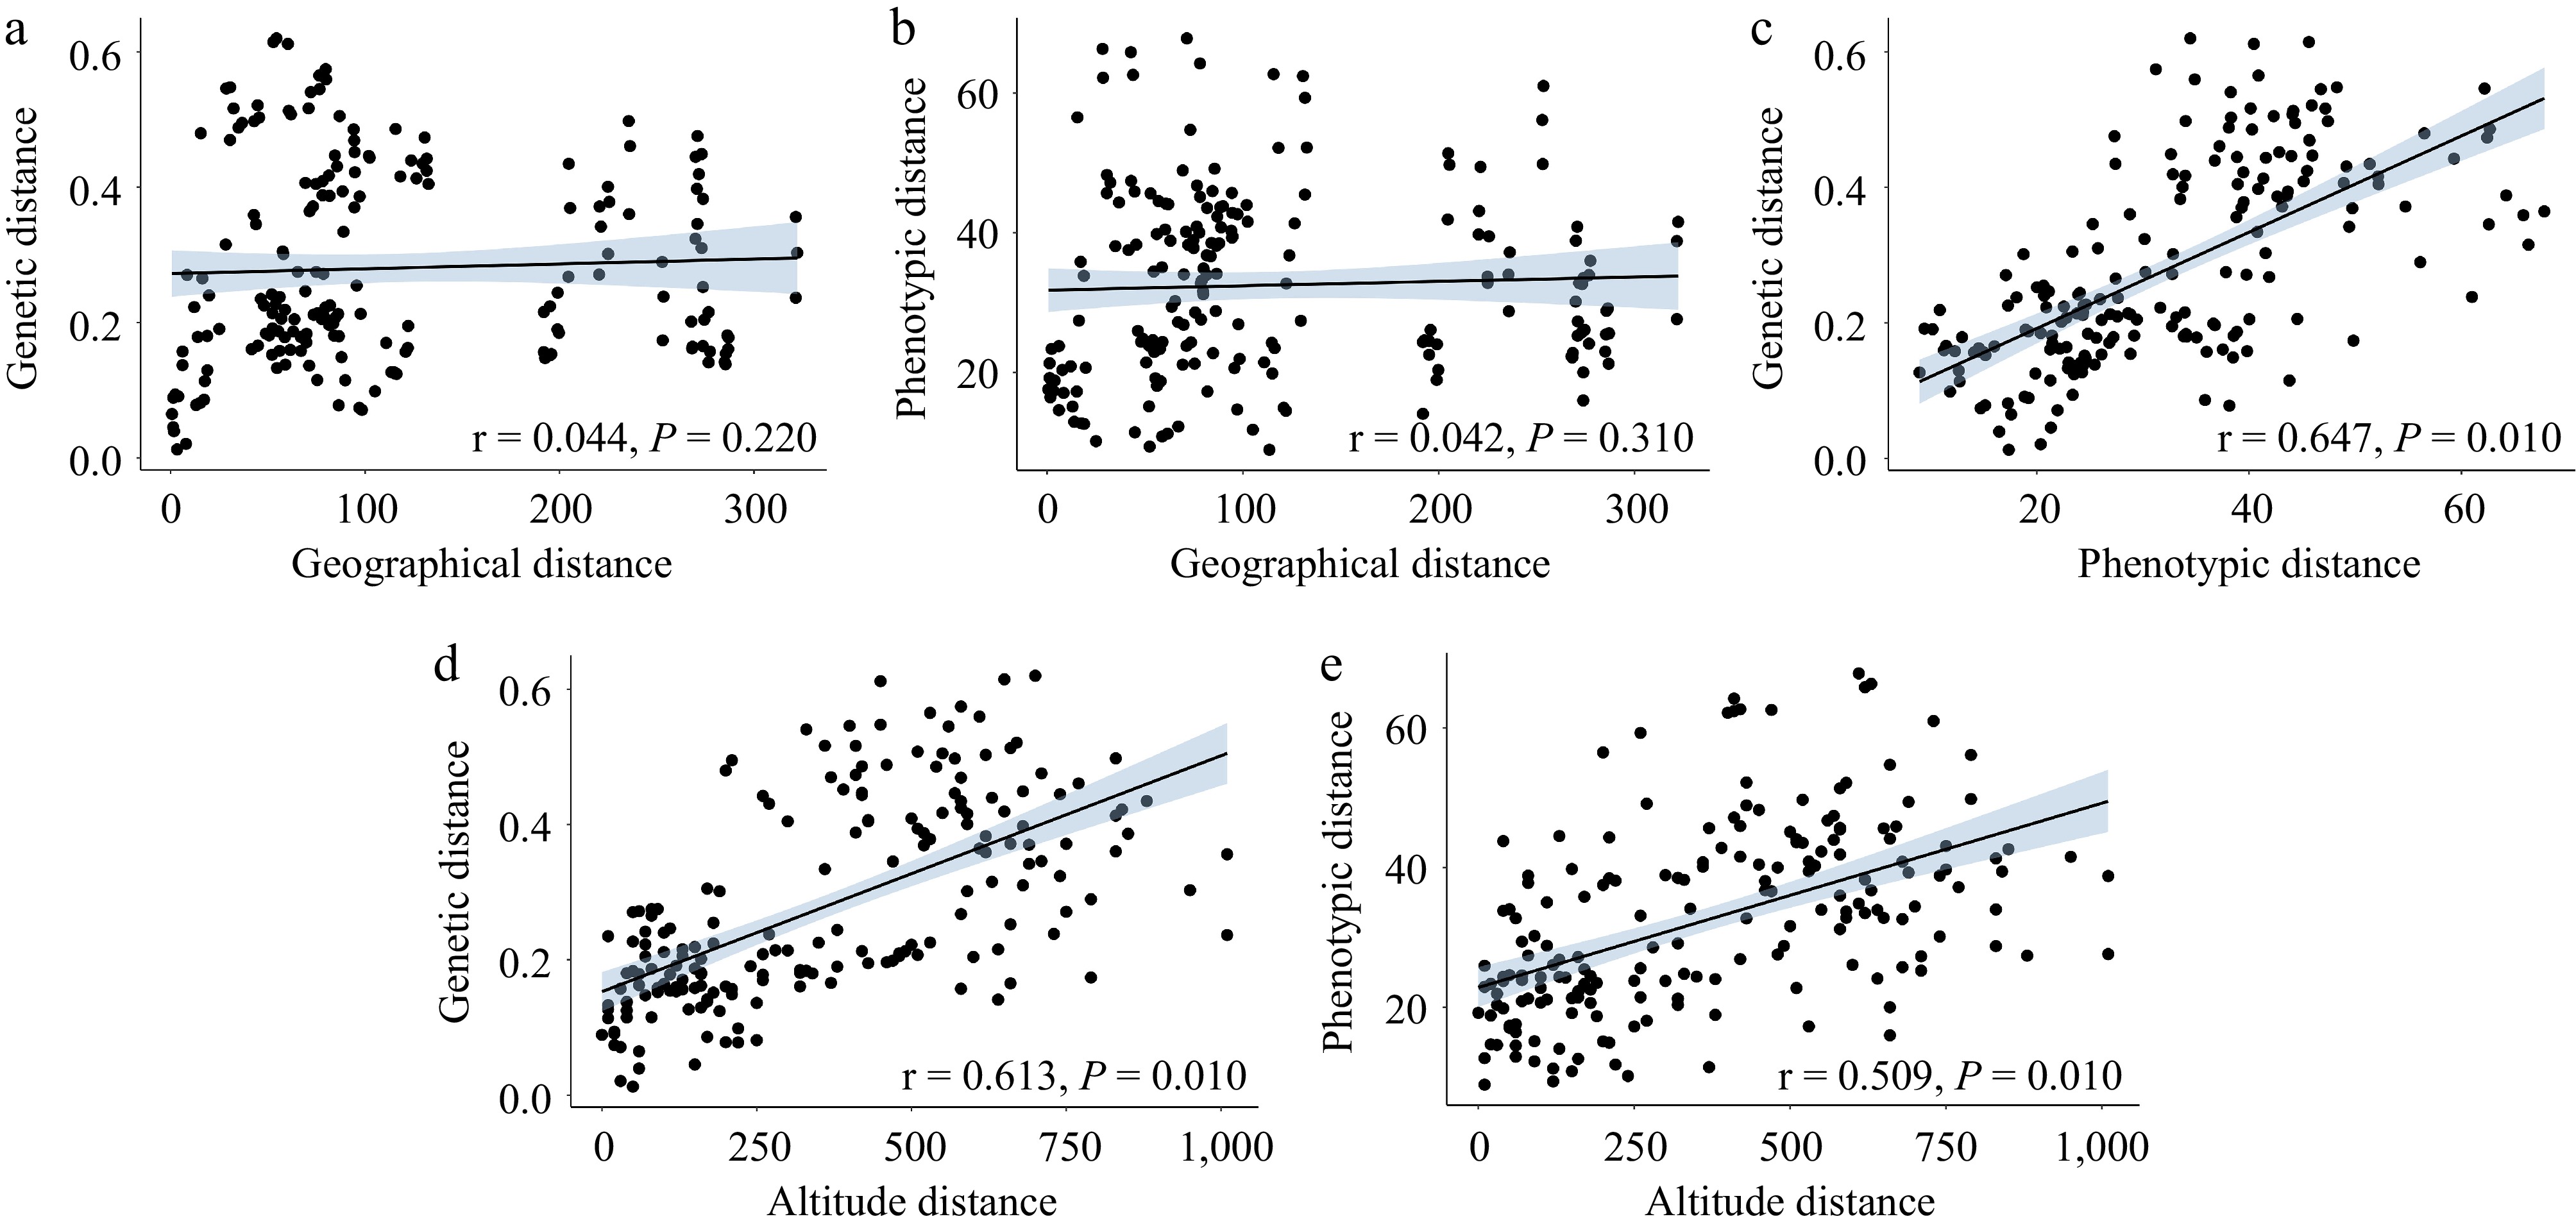
Figure 6.
Correlation analysis of the geographical, genetic, phenotypic, and altitude distance of E. sibiricus in the margin of NEQTP (a) regression of geographical distance and genetic distance (b) regression of geographical distance and phenotypic distance (c) regression of genetic distance and phenotypic distance (d) regression of altitude distance and genetic distance (e) regression of altitude distance and phenotypic distance.
-
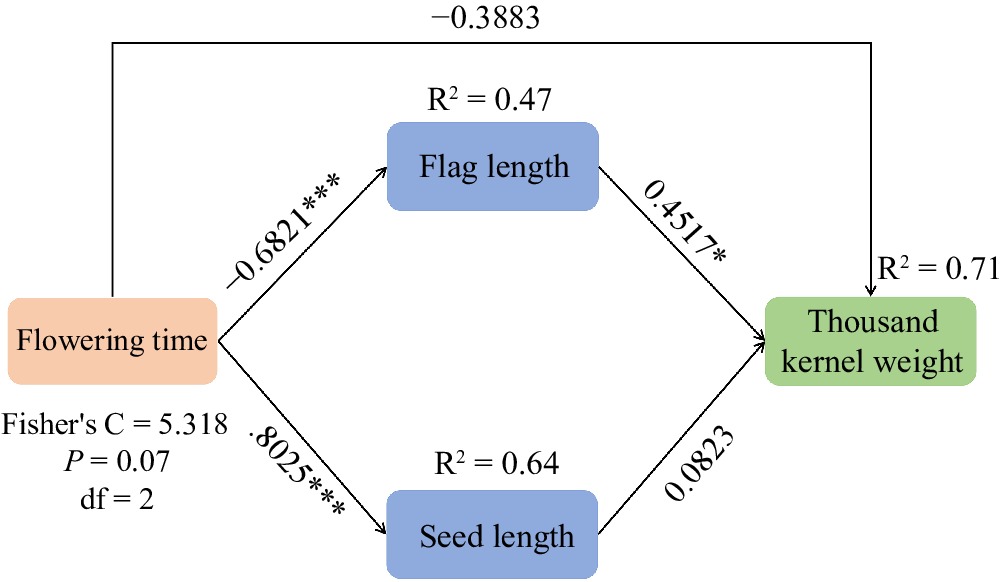
Figure 7.
A structural equation model of treatment effects on the thousand kernel weight (TKW), including direct effects of flowering time on TKW and indirect effect of flag length and seed length on TKW in E. sibiricus.
-
Populations Location Latitude (N) Longitude (E) Altitude (m) XH01 Xiahe, Gansu, China 35.25° 102.83° 2,500 XH02 Xiahe, Gansu, China 35.22° 102.82° 2,550 XH03 Xiahe, Gansu, China 35.21° 102.67° 2,750 XH04 Xiahe, Gansu, China 35.19° 102.51° 2,950 XH05 Xiahe, Gansu, China 35.07° 102.38° 3,120 ZN01 Zhuoni, Gansu, China 34.84° 103.16° 3,200 ZN02 Zhuoni, Gansu, China 34.68° 103.25° 3,160 ZN03 Zhuoni, Gansu, China 34.57° 103.52° 2,530 ZN04 Zhuoni, Gansu, China 34.42° 103.59° 2,540 ZN05 Zhuoni, Gansu, China 34.41° 103.59° 2,690 LQ01 Luqu, Gansu, China 34.59° 102.49° 3,110 LQ02 Luqu, Gansu, China 34.56° 102.57° 3,080 LQ03 Luqu, Gansu, China 34.53° 102.63° 3,050 LQ04 Luqu, Gansu, China 34.53° 102.66° 3,030 LQ05 Luqu, Gansu, China 34.50° 102.68° 3,010 LQ06 Luqu, Gansu, China 34.09° 102.63° 3,380 TZ01 Tianzhu, Gansu, China 36.95° 103.13° 2,370 TZ02 Tianzhu, Gansu, China 36.96° 103.15° 2,430 TZ03 Tianzhu, Gansu, China 36.96° 103.14° 2,370 HZ01 Hezuo, Gansu, China 34.94° 102.92° 2,960 Table 1.
Collection sites, longitudes, latitudes, and altitudes of E. sibiricus.
-
Traits Variance portion Percent of variance portion (%) Pst (%) AP (σ2t/s) WP (σ2s) AP (σ2t/s) WP (σ2s) FL 2.76 0.49 27.78 4.95 84.88 FW 1.49 0.16 30.06 3.20 90.38 SLL 2.61 0.35 15.60 2.11 88.08 SLW 1.32 0.00 26.92 0.00 100.00 SD 0.04 0.01 14.63 2.92 83.35 IN 0.16 0.00 20.91 0.00 100.00 SN 21.36 1.89 18.32 1.62 91.86 FN 0.13 0.12 4.51 4.39 50.71 EL 1.15 1.68 5.42 7.91 40.65 PH 43.01 17.62 13.56 5.55 70.94 TN 46.96 0.00 8.64 0.00 100.00 BTS 5.00 6.08 2.07 2.52 45.10 SL 0.91 0.00 13.74 0.00 100.00 SW 0.01 0.00 7.41 2.55 74.38 AL 1.65 0.46 13.07 3.66 78.14 TKW 0.19 0.07 23.33 8.88 72.43 BT 6,473.23 18.66 94.50 0.27 99.71 HT 5,409.90 0.00 93.91 0.00 100.00 FT 7,828.14 0.00 94.23 0.00 100.00 Average 27.82 2.66 82.66 Flag leaf length (FL), Flag leaf width (FW), Second leaf length (SLL), Second leaf width (SLW), Stem diameter (SD), Internodes number (IN), Spikelet number per branches (SN), Florets number per spikelet (FN), Ear length (EL), Plant height (PH), Tiller number (TN), Breaking tensile strength (BTS), Seed length (SL), Seed width (SW), Awn length (AL), Thousand kernel weight (TKW), Booting time (BT), Heading time (HT), Flowering time (FT), Among populations (AP), Within populations (WP). Table 2.
Variance component and phenotype differentiation coefficient of agronomic traits among and within populations in E. sibiricus.
-
Source Fegree of
freedom
(df)Sum of
squared
difference (SS)Variance
of mean
(MS)Variant
component
(Est. Var.)Percentage
of variationAmong
populations19 2,284.86 120.26 11.47 67 Within
populations180 1,008.70 5.60 5.60 33 Total 199 3,293.56 17.07 100 Table 3.
Molecular Variance Analysis (AMONA) of 20 E. sibiricus populations in the margin of NEQTP.
-
Trait Marker P Marker_R2 Trait Marker P Marker_R2 FL Elw3592s195-loci4 2.11 × 10⁻⁴ 0.04127 BTS Ps3447-loci4 2.09 × 10⁻⁴ 0.05866 FW Elw3592s195-loci5 1.71 × 10⁻⁸ 0.10105 SL Elw5627s404-loci2 0.00919 0.02452 SLL Ltc0157-loci7 0.00119 0.04723 AL Ps3447-loci1 5.21 × 10⁻¹⁹ 0.33191 SLW Ltc0157-loci3 2.09 × 10⁻⁷ 0.10462 AL Ps3447-loci2 5.21 × 10⁻¹⁹ 0.33191 SD Elw1420s081-loci1 7.40 × 10⁻⁴ 0.04992 TKW Ltc0121-loci3 0.00121 0.03274 IN Ps433-loci7 6.24 × 10⁻⁷ 0.08686 TKW Ltc0121-loci4 0.00121 0.03274 SN Ps433-loci3 2.17 × 10⁻⁵ 0.08173 BT Ltc0121-loci3 9.50 × 10⁻⁵ 0.04213 FN Ps569-loci7 5.99 × 10⁻⁴ 0.05533 BT Ltc0121-loci4 9.50 × 10⁻⁵ 0.04213 FN Ps569-loci8 5.99 × 10⁻⁴ 0.05533 HT Ltc0121-loci3 1.32 × 10⁻⁵ 0.05129 EL Ltc0129-loci2 1.08 × 10⁻⁵ 0.08931 HT Ltc0121-loci4 1.32 × 10⁻⁵ 0.05129 PH Ltc0129-loci4 7.87 × 10⁻⁴ 0.04798 FT Ltc0121-loci3 7.61 × 10⁻⁶ 0.05388 TN Ltc0157-loci4 9.15 × 10⁻⁵ 0.07315 FT Ltc0121-loci4 7.61 × 10⁻⁶ 0.05388 Table 4.
Association analysis for phenotypic traits in the 200 E. sibiricus individuals using the GLM model.
Figures
(7)
Tables
(4)