


-
The Qinghai-Tibet Plateau (QTP) serves as a vital ecological barrier and represents the largest grassland pastoral area in China, boasting rich biodiversity[1]. The rapid and extensive uplift of the QTP is widely regarded as a key factor in fostering biodiversity, while concurrently creating geographical barriers that impede gene flow among populations[2]. At present, the northeast margin is the most intense area of crustal deformation and thickening in the QTP[3]. The main vegetation type on the margin of northeastern QTP (NEQTP) was alpine meadows[4,5]. Nonetheless, overgrazing has precipitated varying degrees of grassland degradation, which in turn has resulted in weakened ecological functions, decreased productivity, and increased conflicts between livestock and grassland resources[6,7]. Such alterations are likely to have profound effects on the water supply in the upper reaches of the Yellow River[8], while the carbon emissions originating from this area could potentially influence the global carbon cycle[9]. Moreover, it may affect the economic and social stability of this multi-ethnic convergence area. In response to these challenges, strategies such as the collection, preservation, evaluation, and identification of forage grass germplasm resources, alongside innovations in variety utilization, are essential for mitigating the situation.
Elymus sibiricus, a model species within the Elymus genus of the Triticeae tribe in the Poaceae family, stands out as one of the most dominant native grasses in the alpine meadows of QTP[10]. This species thrives in a variety of habitats, including wet grasslands, sandy riverbanks, open forests, and sunny or semi-shaded hillsides and valleys, typically at elevations ranging from 1,000 to 4,000 meters above sea level[11]. E. sibiricus is of significant value for the reseeding of degraded grasslands and the advancement of the animal husbandry and dairy industries, owing to its strong adaptability, excellent drought and cold resistance, high crude protein content, and palatability. In previous E. sibiricus diversity studies of the NEQTP margin, wild seeds were usually collected from Gannan grassland which was the alpine meadow ecosystem with high primary productivity and species diversity[12−14]. However, wild E. sibiricus germplasms of Tianzhu County grassland have never been comprehensively evaluated. Situated at the western terminus of the Hexi Corridor, Tianzhu County is an essential ecological barrier for the Qilian Mountains. The area is also home to the endemic Tianzhu white yak, which primarily feeds on grasses from the Gramineae family[15]. Notably, research on the germplasm of Tianzhu County has focused exclusively on Elymus nutans to date[16].
Understanding the genetic diversity of species is of great significance for species evolution and conservation[17]. Genetic diversity is examined at the morphological level, cytological (chromosome) level, physiological and biochemical level, and molecular level to reveal genetic variation. Phenotype is a combination of various forms and a representation of genetic variation. Phenotype variation is an important part of genetic variation research and is the result of the joint action of genotype and environmental factors, which is more comprehensive and practical[18]. Research on the molecular level can provide very precise genetic information and contribute to a more accurate understanding of the genetic structure of species. Molecular markers can be used to track and quantify genetic loci that may be associated with specific genes or traits of interest in a population[19]. Previous studies have usually focused on the molecular level, the genetics of E. sibiricus have been studied using makers including random amplified polymorphic DNA (RAPD)[20], Start Codon Targeted (SCoT)[21], expressed sequenced tag-simple sequence repeats (EST-SSR)[10,12], chloroplast SSR (cpSSR)[14], and single nucleotide polymorphism (SNP)[13]. At the morphological level, only one trait or one character in E. sibiricus was usually detailed, such as awn length[22], seed shattering[10], and yield-related[12]. Moreover, the survey of E. sibiricus development stages are of lack, especially flowering time variations. Understanding how flowering phenology changes is necessary for resource utilization on the QTP. Optimizing flowering time not only enables the plant to avoid the detrimental effects of extreme environmental conditions but also ensures the continuity of its growth cycle[23]. Moreover, the regulation of flowering time by environmental factors played a significant role in the evolutionary dynamics of species, both within and across populations[24]. Hence, there is an urgent need for a comprehensive evaluation of multiple traits, with particular emphasis on the definition of flowering time, as well as the dual assessment of phenotypic and molecular traits in E. sibiricus populations.
In this study, we evaluated 200 E. sibiricus germplasms of 20 populations from the margin of NEQTP. We have gathered a wealth of morphological data, which included development time, inflorescence, leaf, stem, and seed traits, among others. A total of 14 EST-SSR (expressed sequence tag-simple sequence repeat) polymorphism markers were used in analyzing genetic diversity and population structure. These markers are known for their ability to tightly link with functional genes, which can be particularly useful in understanding the genetic basis of complex traits and in selecting plants with desired characteristics for breeding programs. The findings of this study not only offer essential resources for breeders aiming to develop improved E. sibiricus varieties but also carry significant implications for grassland ecology and the livestock sector. The enhancement of E. sibiricus varieties could play a crucial role in promoting sustainable grazing systems, enhancing soil conservation, and improving forage quality-factors that are vital for the ecological restoration of grasslands.
-
Two hundred E. sibiricus wild germplasms were collected from Xiahe, Zhuoni, Luqu, Tianzhu, and Hezuo of Gansu Province, China. The materials were derived from 20 populations according to the geographical information of the collection sites, and each group contained 10 germplasms (Table 1). To ensure genetic diversity, a minimum distance of 100 m was maintained between each individual, thus minimizing the possibility of sampling similar genotypes. Following collection, the germplasms were planted to construct a germplasm resource nursery at Yuzhong experimental station, Lanzhou University, Gansu, China. The experimental station was located at 35°56'57" N and 104°9'13" E, with an altitude of 1,720 m and a temperate semi-arid climate with an average annual temperature of 6.7 °C. The terrain of the experimental station was flat and the soil fertility was uniform. A random block design was adopted and three replicates were set up. A total of 60 plots with row spacing of 0.5 m and plant spacing of 0.5 m.
Table 1. Collection sites, longitudes, latitudes, and altitudes of E. sibiricus.
Populations Location Latitude (N) Longitude (E) Altitude (m) XH01 Xiahe, Gansu, China 35.25° 102.83° 2,500 XH02 Xiahe, Gansu, China 35.22° 102.82° 2,550 XH03 Xiahe, Gansu, China 35.21° 102.67° 2,750 XH04 Xiahe, Gansu, China 35.19° 102.51° 2,950 XH05 Xiahe, Gansu, China 35.07° 102.38° 3,120 ZN01 Zhuoni, Gansu, China 34.84° 103.16° 3,200 ZN02 Zhuoni, Gansu, China 34.68° 103.25° 3,160 ZN03 Zhuoni, Gansu, China 34.57° 103.52° 2,530 ZN04 Zhuoni, Gansu, China 34.42° 103.59° 2,540 ZN05 Zhuoni, Gansu, China 34.41° 103.59° 2,690 LQ01 Luqu, Gansu, China 34.59° 102.49° 3,110 LQ02 Luqu, Gansu, China 34.56° 102.57° 3,080 LQ03 Luqu, Gansu, China 34.53° 102.63° 3,050 LQ04 Luqu, Gansu, China 34.53° 102.66° 3,030 LQ05 Luqu, Gansu, China 34.50° 102.68° 3,010 LQ06 Luqu, Gansu, China 34.09° 102.63° 3,380 TZ01 Tianzhu, Gansu, China 36.95° 103.13° 2,370 TZ02 Tianzhu, Gansu, China 36.96° 103.15° 2,430 TZ03 Tianzhu, Gansu, China 36.96° 103.14° 2,370 HZ01 Hezuo, Gansu, China 34.94° 102.92° 2,960 Observation of phenotypic traits in E. sibiricus
-
Twenty populations with three replicates including 600 individual plants of E. sibiricus were observed in 2019 and 2020. The study aimed to assess a range of quantitative traits, such as developmental time, leaf and stem characteristics, panicle features, and seed traits. The stage at which the first leaf sheath began to expand was recorded as the booting stage. Subsequently, the moment when the first inflorescence protruded from the leaf sheath was noted as the heading stage, and finally, the time point when the first inflorescence started to flower was documented as the flowering stage. The number of days from January 1 of the current year to the record date was defined as booting time, heading time, and flowering time. During the flowering stage, key traits such as flag leaf length (FL), flag leaf width (FW), second leaf length (SLL), second leaf width (SLW), stem diameter (SD), internodes number (IN), florets number per spikelet (FN), and plant height (PH) measured. Ear length (EL) and spikelet number per branch (SN) were measured at the milk stage. Breaking tensile strength (BTS) was gained at 28 d after flowering which was a method used to assess seed shattering performed by reference to Zhang et al.[22]. In the full ripening stage, awn length (AL) was measured using a digital caliper. In the withering stage, the tiller number (TN) was counted. After harvest, seed length (SL), seed width (SW), and thousand kernel weight (TKW) were determined. The above quantitative traits were determined with five replicates per individual plant.
DNA extraction and genotyping
-
Genomic DNA was extracted from fresh leaves of E. sibiricus using a plant genomic DNA kit (Tiangen Biotech, Beijing, China). The quality of DNA was determined using NanoDrop ND1000 spectrophotometer (Thermo Scientific, Waltham, MA, USA). Subsequently, the DNA was diluted to 25 ng/μL and stored at −20 °C for future use. A total of 14 EST-SSR polymorphic markers were designed and verified in previous studies of E. sibiricus to conduct genetic diversity analysis, especially 28366 was a marker that can distinguish between early- and late-flowering germplasms[10,25]. The details of these EST-SSR primers were shown in Supplementary Table S1. PCR volume was 15 μL, including 7.5 μL 2×Reaction Mix, 0.2 μL Golden DNA polymerase (Tiangen Biotech, Beijing, China), 0.5 μL forward primer, 0.5 μL reverse primer, 4.3 μL ddH2O, and 2 μL genomic DNA. PCR products were detected by 6% non-denatured polyacrylamide gel electrophoresis and photographed. The procedure of PCR amplification and gel electrophoresis referred to the method described by Xie et al.[10].
Data processing
-
For the analysis of phenotypic diversity, EXCEL 2021 was directly used to calculate the mean, and standard deviation of traits, and then calculated the coefficient of variation and Shannon index. The boxplots of development time were constructed by Origin 9. All morphologic differentiation coefficients were calculated using the SAS University edition. The cumulative contribution rate of the principal component of each trait was calculated using SPSS v26. The correlation analysis of 19 traits and data visualization were performed using R version 4.3.3. The 19 traits were normalized, and the cluster and heatmap was performed using BMKCloud (
www.biocloud.net ). To analyze primer sequences, DNAMAN 7 was employed, allowing for precise comparisons. The genotypic data matrix of 14 primers of 200 individual plants was obtained by statistical analysis of the bands with good repeatability and easy to distinguish according to the principle of presence (1) or absence (0). The analysis of the genetic relationship of EST-SSR locus and the calculation of observed heterozygosity (Ho), expected heterozygosity (He), and polymorphic information content (PIC) were referred to the method described by Zheng et al.[25].The genetic diversity of all loci and various germplasms was calculated using both EXCEL 2021 and GenAlex6.51, including the number of alleles (Na), the number of effective alleles (Ne), and Shannon's information index (I) were carried out. Nei's genetic diversity index (H) was calculated by POPGENE 32. EXCEL 2021 and GenAlex6.51 were also used for molecular analysis of variance (AMOVA) to calculate the inter-population and intra-population components of the genetic variance of E. sibiricus[26]. STRUCTURE v2.3.2 software was used to subdivide individuals into different groups for structure analysis. The hierarchical cluster was constructed with R version 4.3.3, and the rootless tree was visualized with iTOL (itol.embl.de)[27]. The data matrix of Nei's genetic distance and geographical distance were performed by GenAlex6.51. The Euclidean distance of phenotypic traits and altitude among each population was calculated by R version 4.3.3. The associations between the EST-SSRs and the phenotypic traits were analyzed through a general linear model (GLM) implemented in Tassel software 5.0. The Mantel test was used to detect the association between genetic, phenotypic, altitude, and geographical distance. Regression analysis visualized by the OmicStudio tools (
www.omicstudio.cn/tool ). The structural equation model (SEM) was constructed by using the 'piecewiseSEM' function in the R package. We first considered a full model that included all possible pathways and then performed model screening in R to improve the model's reliability. -
Based on the observed data of two years, the E. sibiricus germplasms collection had a relatively higher diversity among the investigated traits (Fig. 1; Supplementary Table S2). Notably, both the variation coefficient (CV) and Shannon diversity index revealed substantial variation in the traits. The average CV for the nineteen phenotypic traits was 15.66% across the two years, with a range from 2.97% to 55.13%. Among these traits, BTS exhibited the highest variation, with a CV of 45.19%, followed by TN (33.19%) and TKW (20.21%). In contrast, the CV values for BT (4.04%), HT (4.00%), and FT (3.65%) were the lowest among all the morphological traits, which suggests a high level of genetic stability in the development timing of E. sibiricus. Regarding the Shannon diversity index, the average value for the nineteen traits was 1.61 over the two years, ranging from 1.01 to 2.04. FW exhibited the highest diversity index (1.89), followed by BT (1.78) and SLW (1.78) (Supplementary Table S2).
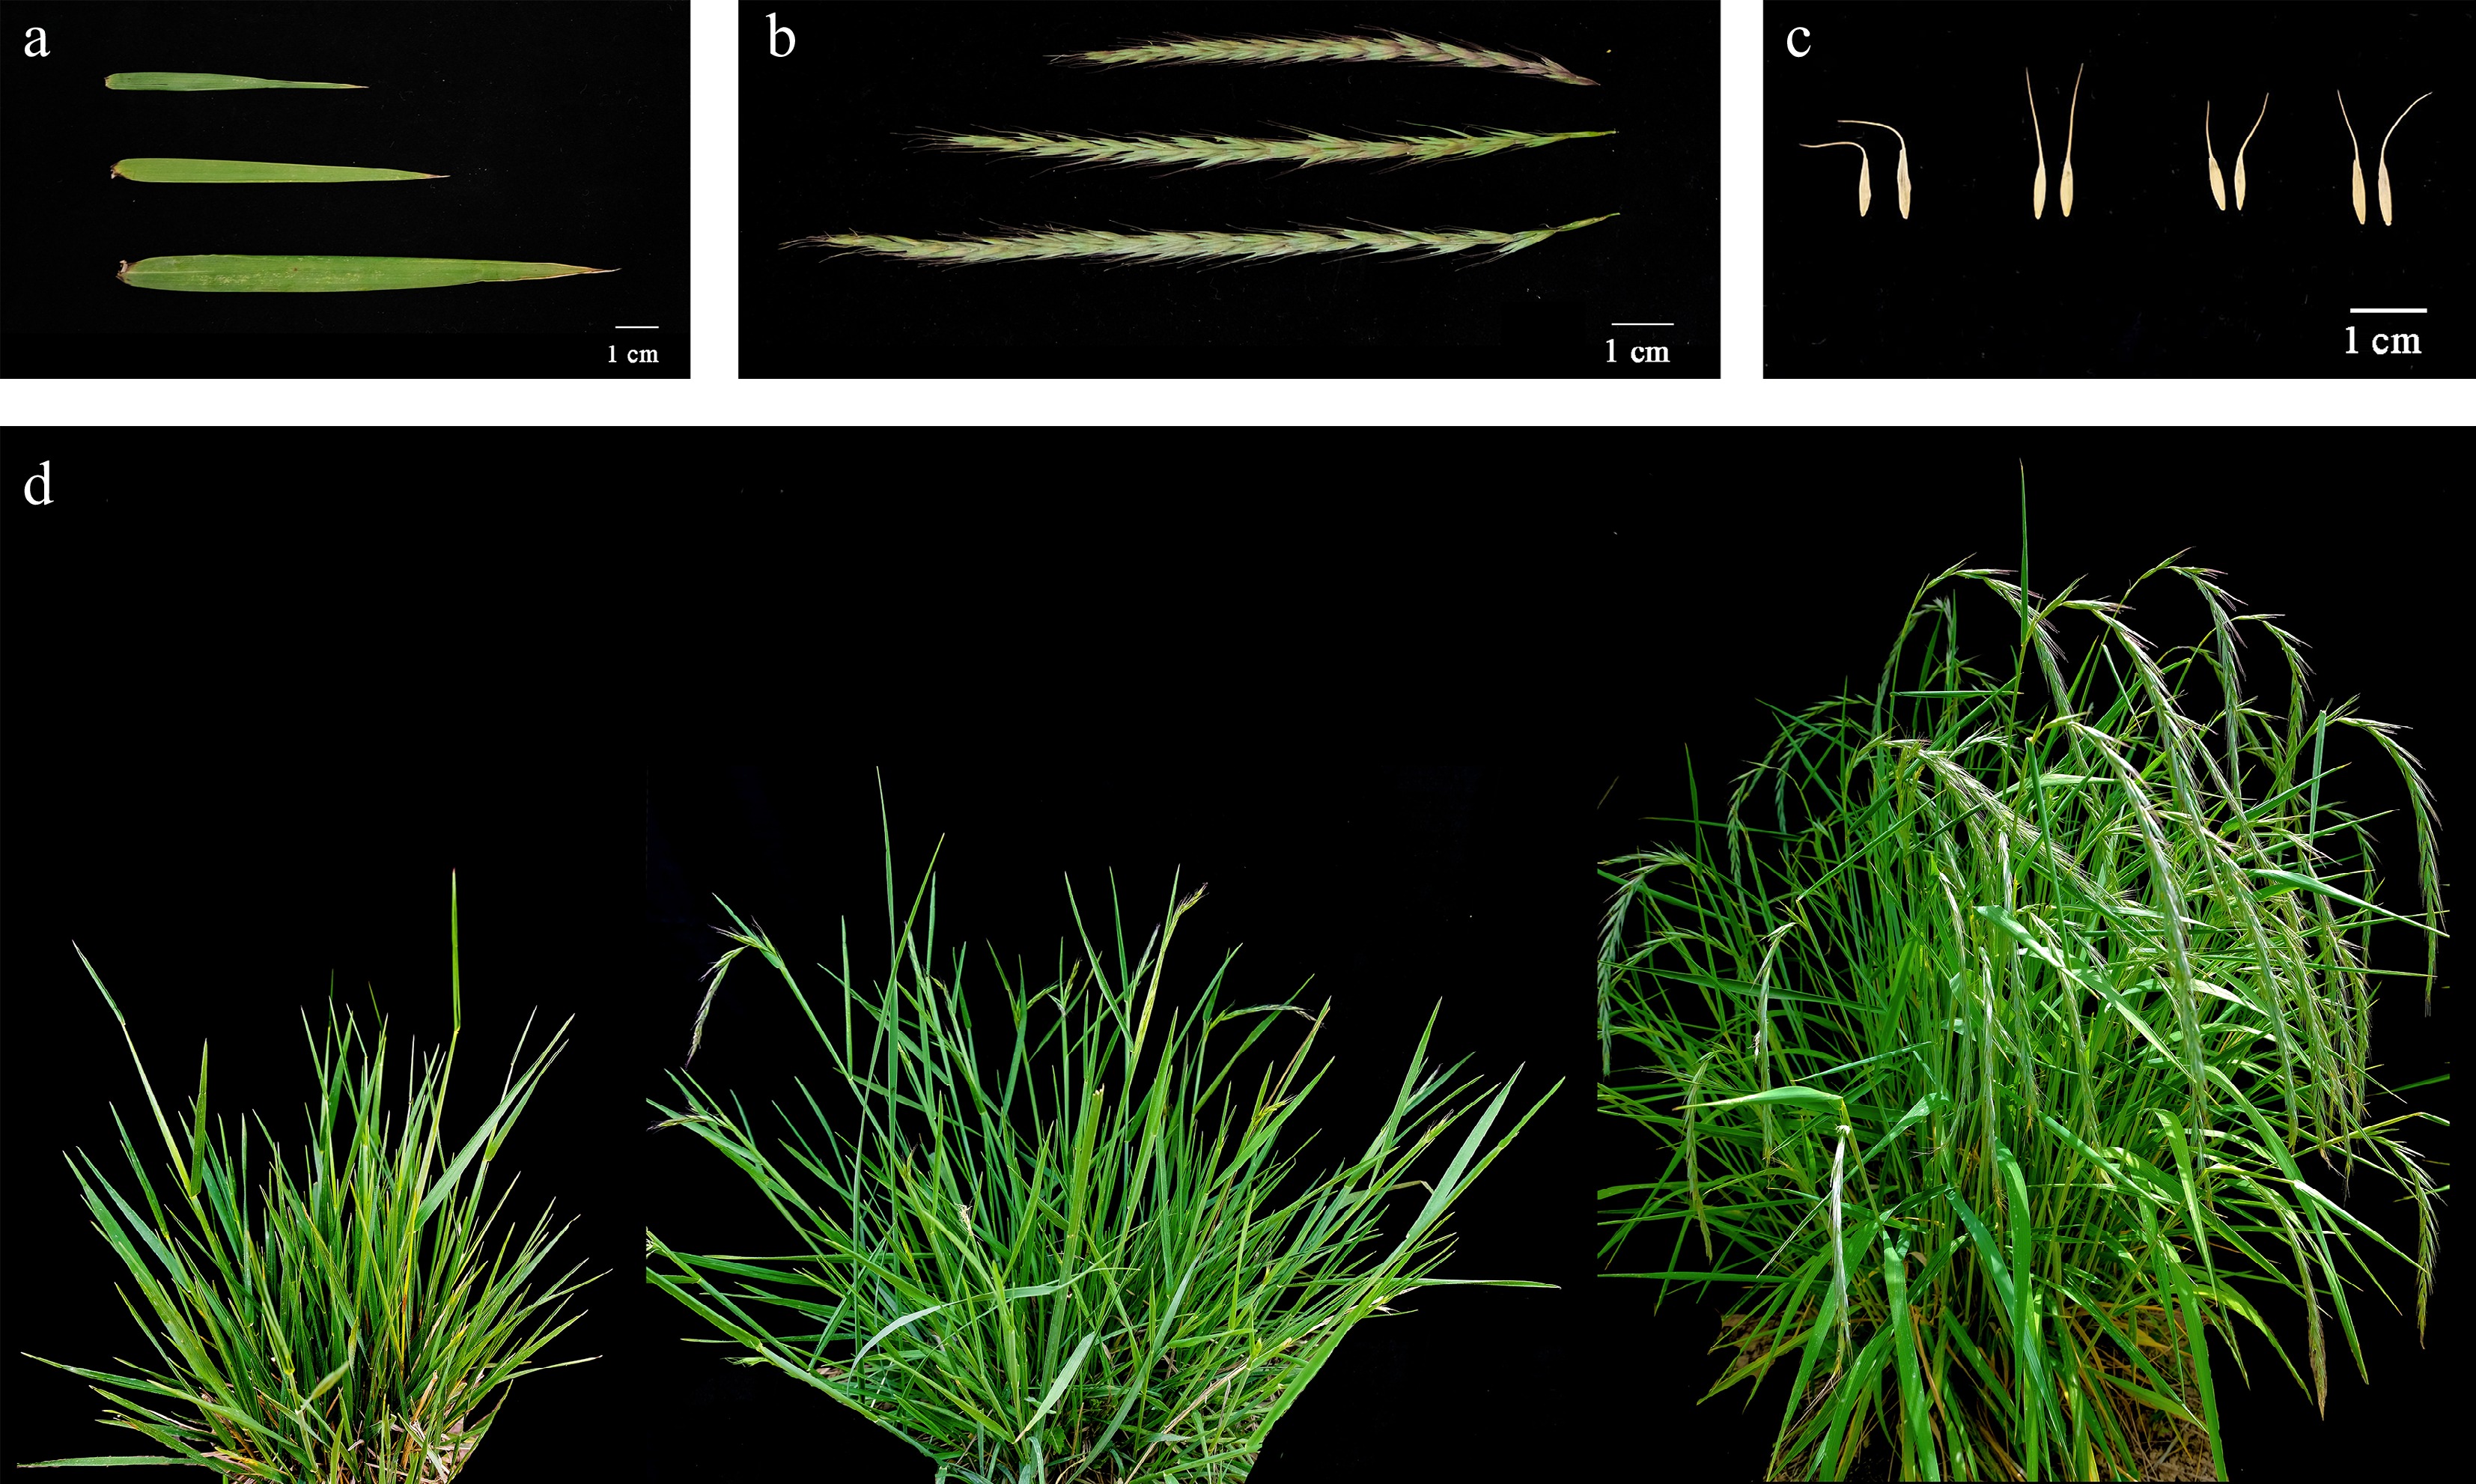
Figure 1.
Variation on morphologic traits of E. sibiricus. (a) Leaf, (b) spike, (c) seed, (d) development time.
Interannual variation, population difference, and individual difference were present in the development time of E. sibiricus (Supplementary Fig. S1). In 2019, the XH02 population exhibited the earliest booting, heading, and flowering. Conversely, ZN02, also from 2019, demonstrated the latest booting and heading. Among the populations, LQ03 was the last to flower in 2019, followed sequentially by LQ02, HZ01, and ZN02. In 2020, ZN04 achieved the earliest booting and heading, whereas XH02 once again flowered first. The population that flowered the latest in 2020 was XH04. Overall, the development of XH02 exhibited remarkable stability with minimal interannual variation. The average developmental times across the two years revealed that XH02 consistently showed the earliest development: it initiated booting at an average of 162 d, heading at 167 d, and flowering at 174 d. In contrast, XH04 exhibited the latest developmental stages, with an average booting time of 187 d, heading at 194 d, and flowering at 201 d. When considering individual variation, the flowering times of the earliest and latest flowering individuals differed by 62 d among a sample of 200 individual plants.
The average variance components for the nineteen phenotypic traits, both within and among populations, were 2.66% and 27.82%, respectively. This suggests that the degree of differentiation within populations was notably lower than that observed among populations. At the margin of the NEQTP, the average phenotypic differentiation coefficient (Pst) for E. sibiricus was 82.66%, which indicates that phenotypic variation in E. sibiricus was predominantly influenced by the differentiation between populations (Table 2). The phenotypic differentiation coefficients for the 19 morphological traits ranged from 40.65% to 100%. Among them, EL exhibited the lowest coefficient, at 40.65%. Conversely, the phenotypic differentiation coefficients for traits such as FW, SLW, IN, SN, TN, SL, BT, HT, and FT were all above 90%, signifying that these traits tended to be consistent within populations.
Table 2. Variance component and phenotype differentiation coefficient of agronomic traits among and within populations in E. sibiricus.
Traits Variance portion Percent of variance portion (%) Pst (%) AP (σ2t/s) WP (σ2s) AP (σ2t/s) WP (σ2s) FL 2.76 0.49 27.78 4.95 84.88 FW 1.49 0.16 30.06 3.20 90.38 SLL 2.61 0.35 15.60 2.11 88.08 SLW 1.32 0.00 26.92 0.00 100.00 SD 0.04 0.01 14.63 2.92 83.35 IN 0.16 0.00 20.91 0.00 100.00 SN 21.36 1.89 18.32 1.62 91.86 FN 0.13 0.12 4.51 4.39 50.71 EL 1.15 1.68 5.42 7.91 40.65 PH 43.01 17.62 13.56 5.55 70.94 TN 46.96 0.00 8.64 0.00 100.00 BTS 5.00 6.08 2.07 2.52 45.10 SL 0.91 0.00 13.74 0.00 100.00 SW 0.01 0.00 7.41 2.55 74.38 AL 1.65 0.46 13.07 3.66 78.14 TKW 0.19 0.07 23.33 8.88 72.43 BT 6,473.23 18.66 94.50 0.27 99.71 HT 5,409.90 0.00 93.91 0.00 100.00 FT 7,828.14 0.00 94.23 0.00 100.00 Average 27.82 2.66 82.66 Flag leaf length (FL), Flag leaf width (FW), Second leaf length (SLL), Second leaf width (SLW), Stem diameter (SD), Internodes number (IN), Spikelet number per branches (SN), Florets number per spikelet (FN), Ear length (EL), Plant height (PH), Tiller number (TN), Breaking tensile strength (BTS), Seed length (SL), Seed width (SW), Awn length (AL), Thousand kernel weight (TKW), Booting time (BT), Heading time (HT), Flowering time (FT), Among populations (AP), Within populations (WP). Correlation analysis, principal component analysis, and cluster analysis based on phenotypic traits of E. sibiricus in the margin of NEQTP
-
Pearson correlation analysis was conducted on nineteen phenotypic traits of E. sibiricus in the margin of NEQTP (Fig. 2). Significant positive correlations were observed among various development times, whereas traits related to seed and leaf characteristics showed notable negative correlations with development time. This suggests that earlier flowering can confer a considerable advantage in terms of both seed and grass yield for E. sibiricus in this region. A total of seven traits, SN, SLW, IN, SLL, FW, FL, and SL, were significantly positive correlated with TKW. Among them, the correlation coefficients of FW (0.80) and FL (0.78) with TKW were the highest, implying that leaf area might play a key role in influencing seed yield. Moreover, PH was positively correlated with SD but negatively correlated with both TKW and FL. This suggests that reducing plant height could potentially enhance and stabilize yield. Finally, BTS exhibited a significant positive correlation with BT, HT, and FN, but showed negative correlations with SN, SLW, FW, TKW, and FL.
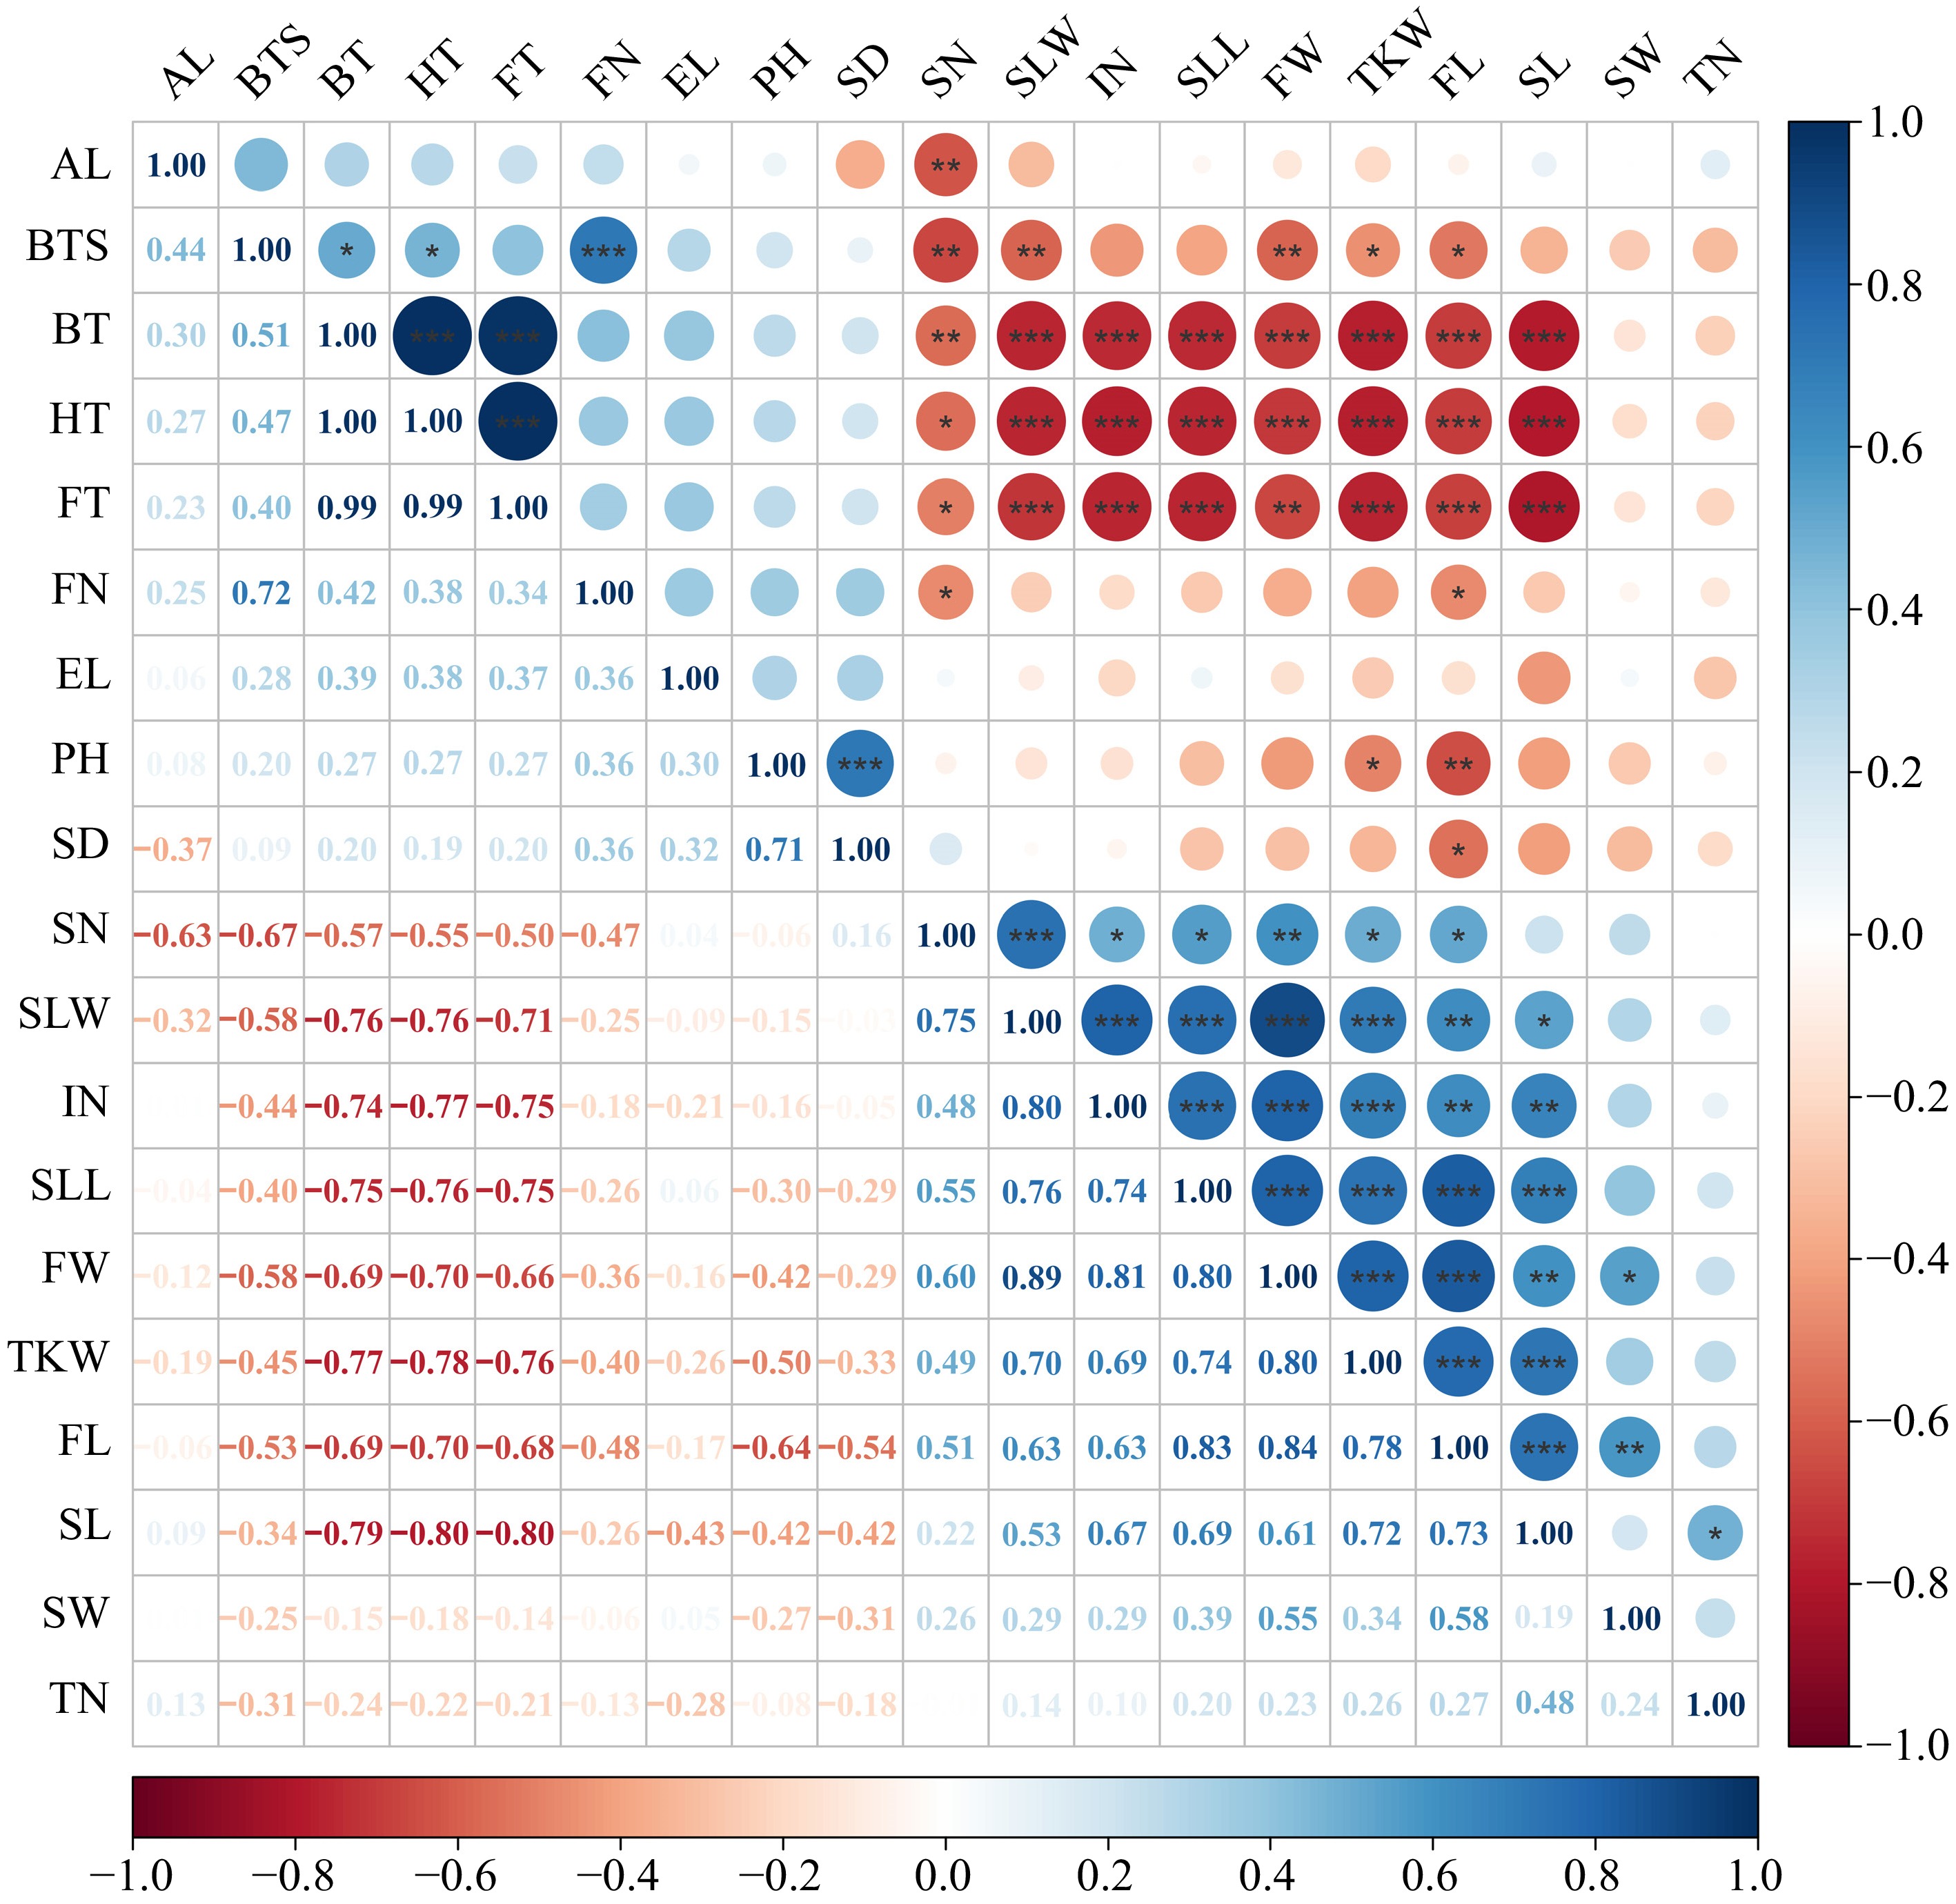
Figure 2.
Correlation analysis of phenotypic traits of E. sibiricus in the margin of NEQTP. In the legend, a darker color indicates a stronger correlation, whereas a lighter color implies a weaker one. Flag leaf length (FL), Flag leaf width (FW), Second leaf length (SLL), Second leaf width (SLW), Stem diameter (SD), Internodes number (IN), Spikelet number per branches (SN), Florets number per spikelet (FN), Ear length (EL), Plant height (PH), Tiller number (TN), Breaking tensile strength (BTS), Seed length (SL), Seed width (SW), Awn length (AL), Thousand kernel weight (TKW), Booting time (BT), Heading time (HT), Flowering time (FT).
The eigenvalues of the first five principal components were all greater than 1, and the cumulative contribution rate was 85.56%. It indicated that the first five principal components could reflect most information on the phenotypic traits in E. sibiricus (Supplementary Table S3). The first principal component accounted for 49.31% of the variance. The largest eigenvector values were observed for development time (0.91, 0.91, 0.89) and leaf traits (0.89, 0.90, 0.85, 0.84), suggesting that this component primarily reflects the development of flowers and leaves in E. sibiricus. The second principal component explained 12.87% of the variance, with the highest eigenvector associated with stem diameter (0.81), indicating that it predominantly represents overall stem traits. The third principal component accounted for 9.16% of the total variance, with the number of florets per spikelet having the greatest influence, suggesting that this component is related to the inflorescence characteristics. The fourth principal component explained 8.44% of the variance, with the highest eigenvector values for ear length (0.57) and seed width (0.66), pointing to the fact that it mainly reflects seed-related traits. Finally, the fifth principal component contributed 5.79%, with the greatest influence from tiller number and plant height, suggesting that this component represents a composite factor of plant morphology.
The results of the cluster analysis indicated that the 20 populations could be primarily classified into two distinct groups (Fig. 3). The first group comprised 11 populations: TZ02, TZ03, LQ05, LQ04, TZ01, XH01, XH02, XH03, ZN05, ZN03, and ZN04. Notably, this group was further divided into two sub-groups: the mid-flowering sub-group and the early-flowering sub-group. Populations within the early-flowering sub-group, including XH01, XH02, XH03, ZN05, ZN03, and ZN04, were characterized by several distinct traits, such as longer and wider leaves, a greater number of stem nodes, larger seeds, and higher TKW. In contrast, the second group, consisting of nine populations (ZN02, LQ06, XH05, XH04, LQ01, HZ01, LQ02, LQ03, and ZN01), exhibited a late-flowering phenotype, characterized by features like shorter and narrower leaves, fewer spikelets, fewer tillers, and a lower TKW.
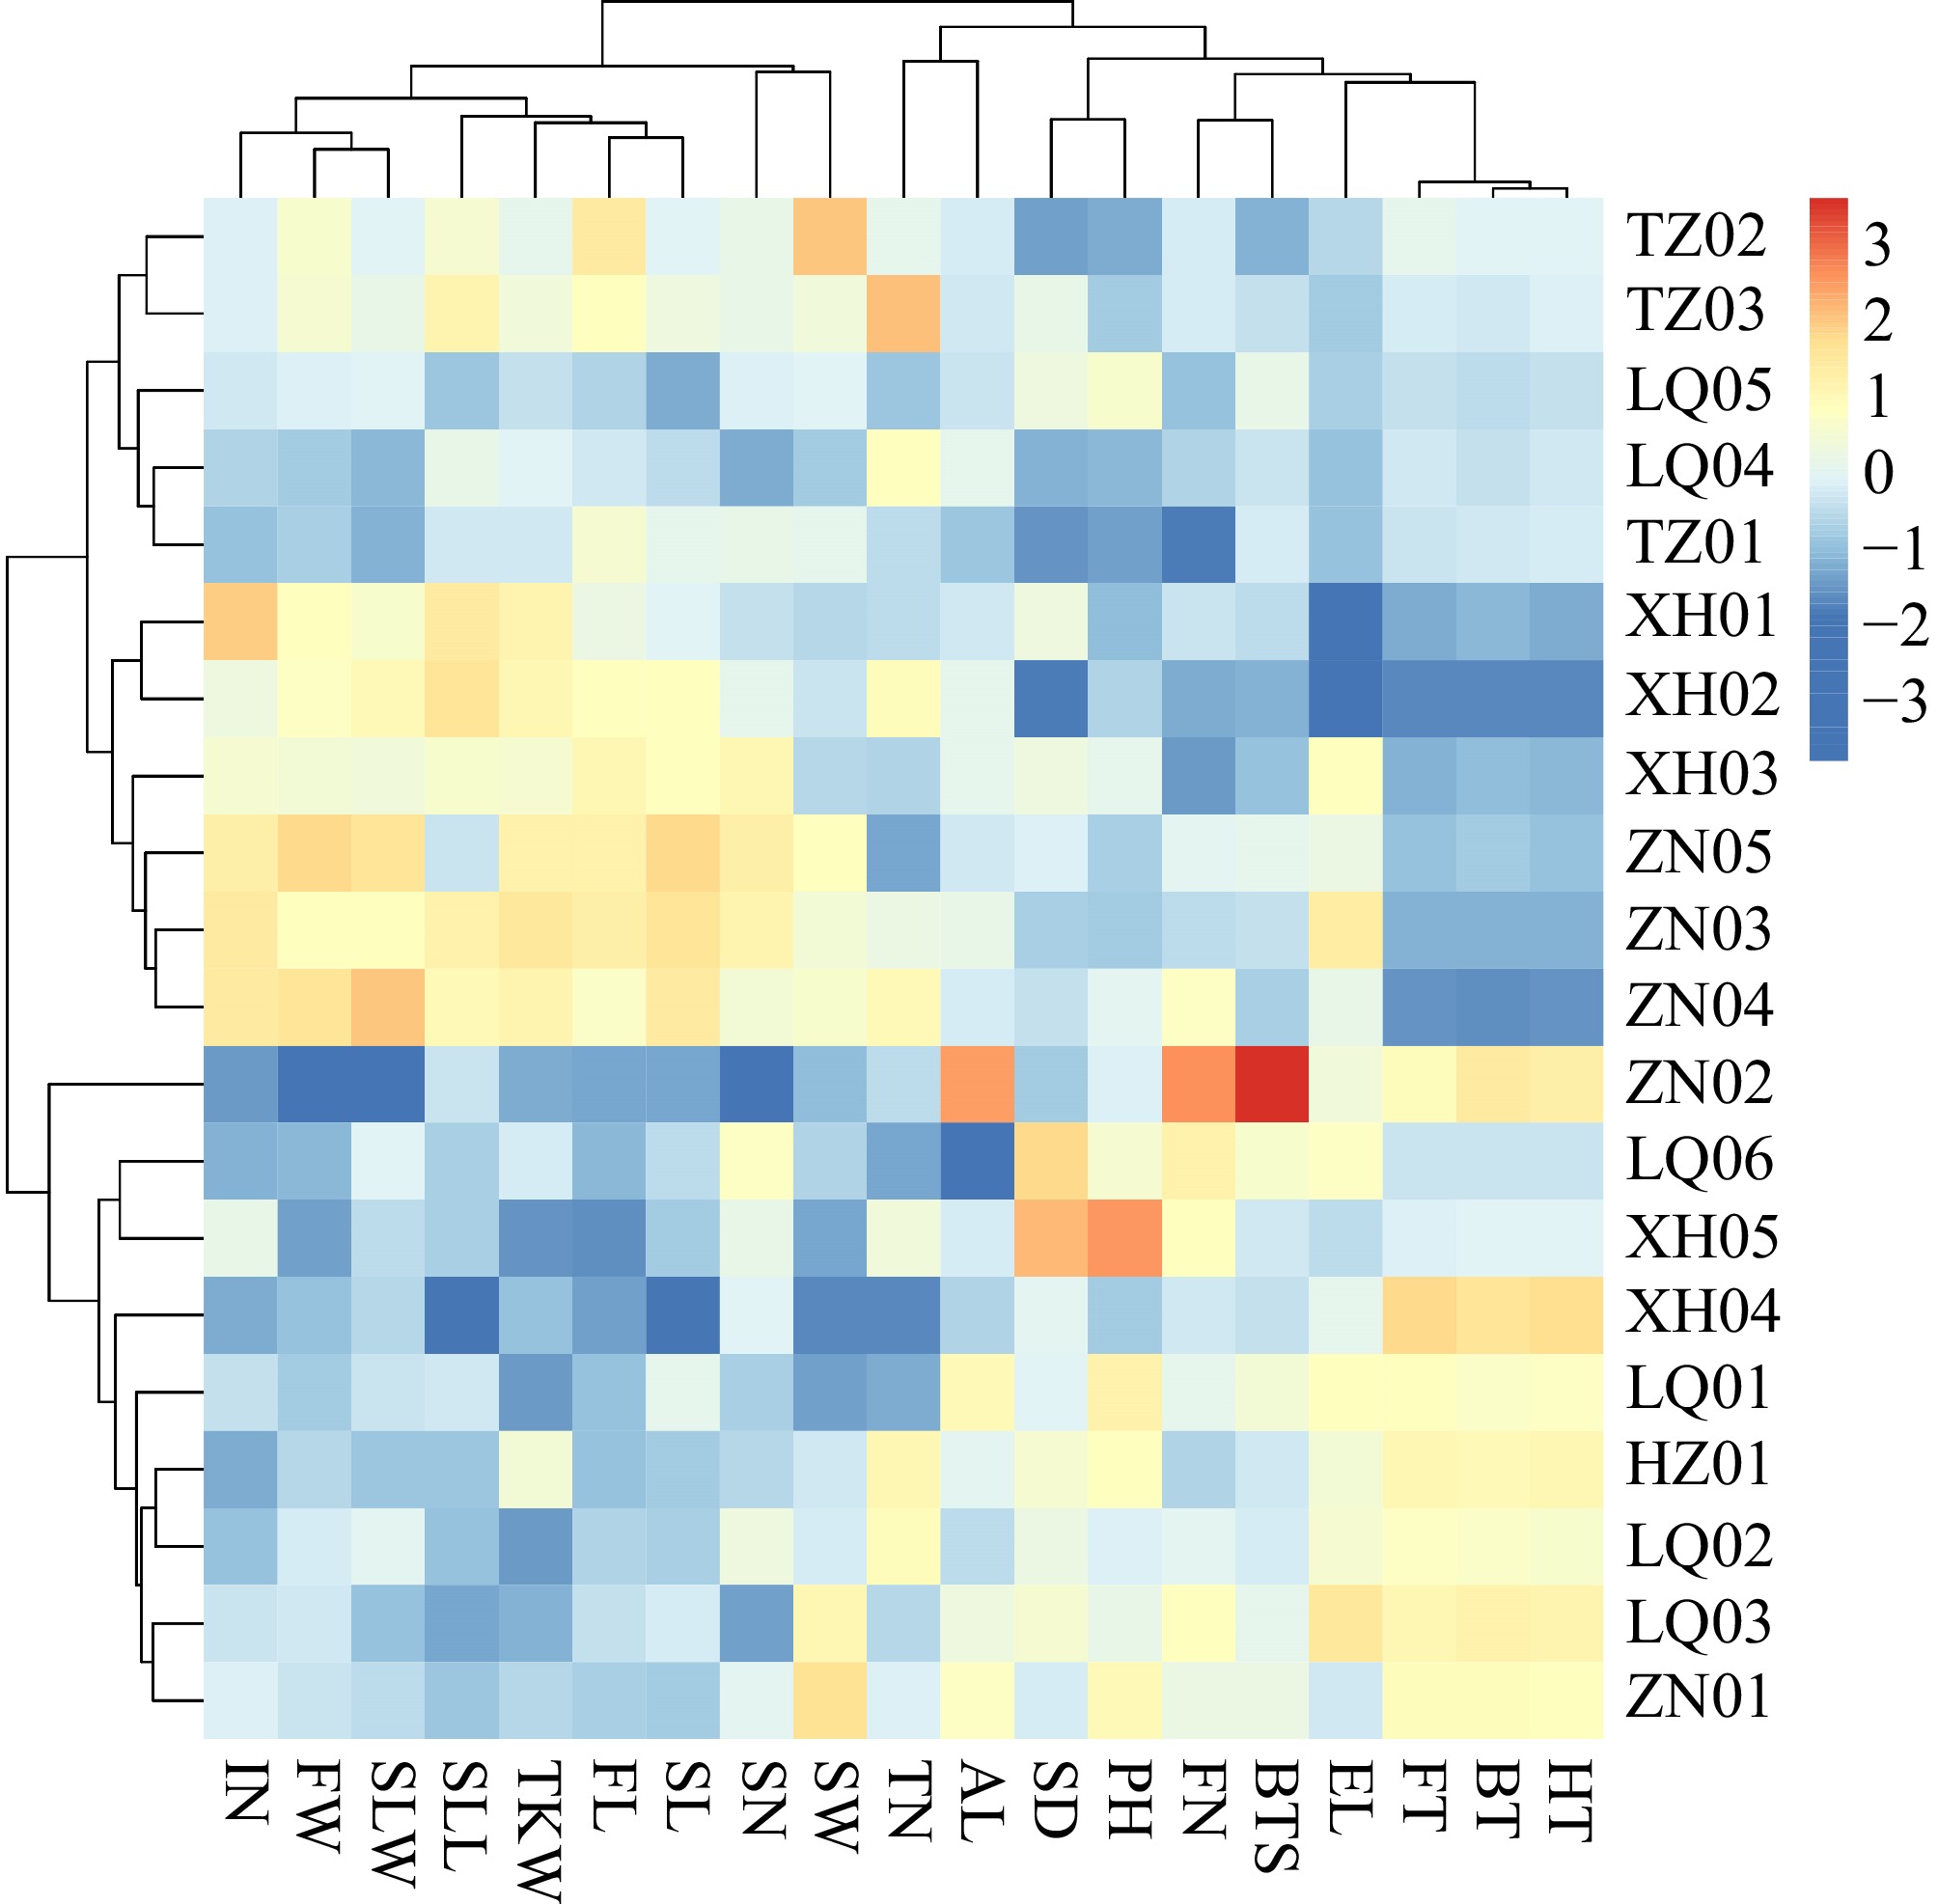
Figure 3.
The clustering heat map of genotypic traits in the populations of E. sibiricus. Flag leaf length (FL), Flag leaf width (FW), Second leaf length (SLL), Second leaf width (SLW), Stem diameter (SD), Internodes number (IN), Spikelet number per branches (SN), Florets number per spikelet (FN), Ear length (EL), Plant height (PH), Tiller number (TN), Breaking tensile strength (BTS), Seed length (SL), Seed width (SW), Awn length (AL), Thousand kernel Weight (TKW).
Genetic diversity and differentiation of the E. sibiricus population in the margin of NEQTP
-
A total of 105 loci were amplified by fourteen EST-SSR primers, ranging from 3 (28366) to 14 (Elw5627s404) with 7.5 loci in the average. Among the loci, polymorphic bands constituted 88.83% of the total. The expected heterozygosity (He) was 0.32 (28366) to 0.91 (Elw5627s404), with an average of 0.77. The observed heterozygosity (Ho) varied from 0.23 (28366) to 1 (Ps938, Ps3447, Ps569, Ps3577, Ltc0121, and Ltc0157), averaging at 0.84. The value of polymorphism information content (PIC) ranged from 0.13 (28366) to 0.41 (Ps938), with an overall mean value of 0.30 (Supplementary Table S4). The number of alleles per locus (Na) varied from 0.51 to 1.20 in 20 populations. Among them, the Na of more than 1 were XH05, ZN02, LQ04, LQ05, and TZ01. For the number of effective alleles (Ne), it fluctuated between 1.03 and 1.29, with an average value of 1.15. The Shannon information polymorphism index (I) ranged from 0.03 to 0.26 and was greater than 0.1 in all populations except TZ03 and HZ01. Regarding Nei's genetic diversity index (H), the range was from 0.02 to 0.17, with an average of 0.09. The percentage of polymorphic loci (PP) showed a wide range, from 7.62% to 49.52%, with an average of 26.95%. In conclusion, the genetic diversity of LQ05 was the highest (Na = 1.20, Ne = 1.29, I = 0.26, H = 0.17, PP = 49.52%), followed by the LQ04 population (Na = 1.09, Ne = 1.25, I = 0.22, H = 0.15, PP = 41.90%), and the ZN02 population (Na = 1.08, Ne = 1.08, I = 0.20, H = 0.13, PP = 40.00%). Conversely, the TZ03 population exhibited the lowest genetic diversity (Na = 0.505, Ne = 1.027, I = 0.029, H = 0.018, PP = 7.62%) (Supplementary Table S5).
The results of the AMOVA analysis revealed that the mean variance (MS) between the 20 E. sibiricus populations located at the edge of the NEQTP was 120.26, whereas the MS within populations was 5.60. The variation among populations accounted for 67% and the variation within populations accounted for 33% of the total variation (Table 3). The Nei's genetic distance varied from 0.013 (between XH01 and XH02) to 0.620 (between XH01 and ZN01), and the genetic identity ranged from 0.538 (between XH01 and ZN01) to 0.987 (between XH01 and XH02) (Supplementary Table S6). Consequently, the smallest genetic differentiation was observed between XH01 and XH02, while the largest differentiation occurred between XH01 and ZN01.
Table 3. Molecular Variance Analysis (AMONA) of 20 E. sibiricus populations in the margin of NEQTP.
Source Fegree of
freedom
(df)Sum of
squared
difference (SS)Variance
of mean
(MS)Variant
component
(Est. Var.)Percentage
of variationAmong
populations19 2,284.86 120.26 11.47 67 Within
populations180 1,008.70 5.60 5.60 33 Total 199 3,293.56 17.07 100 Genetic structure of the E. sibiricus population in the margin of NEQTP
-
Supporting evidence for this division came from the Euclidean distance clustering algorithm, which classified the 20 populations into two distinct clusters. Cluster I comprised seven fully represented populations (XH01, XH02, XH03, ZN03, ZN04, ZN05, and TZ03), along with specific individuals from several other populations: individuals 1−8 from TZ01, individuals 1−8 and 10 from TZ02, individuals 2, 3, 7, and 8 from LQ04, and individuals 2, 7, 9, and 10 from LQ05. These individuals corresponded to the early-flowering phenotype. Cluster II, on the other hand, included all individual plants from nine populations (XH04, XH05, ZN01, ZN02, LQ01, LQ02, LQ03, LQ06, and HZ01), as well as the remaining individuals from the LQ04, LQ05, TZ01, and TZ02 populations, which exhibited the late-flowering phenotype (Fig. 4a). When examined by population, the clustering revealed a distinction between two groups: one comprising TZ01, TZ02, TZ03, XH01, XH02, XH03, ZN03, ZN04, and ZN05, and the other containing LQ01, LQ02, LQ03, LQ04, LQ05, LQ06, XH04, XH05, and HZ01 (Fig. 4b). This suggests significant gene flow between individuals from the LQ04 and LQ05 populations and those from other populations.
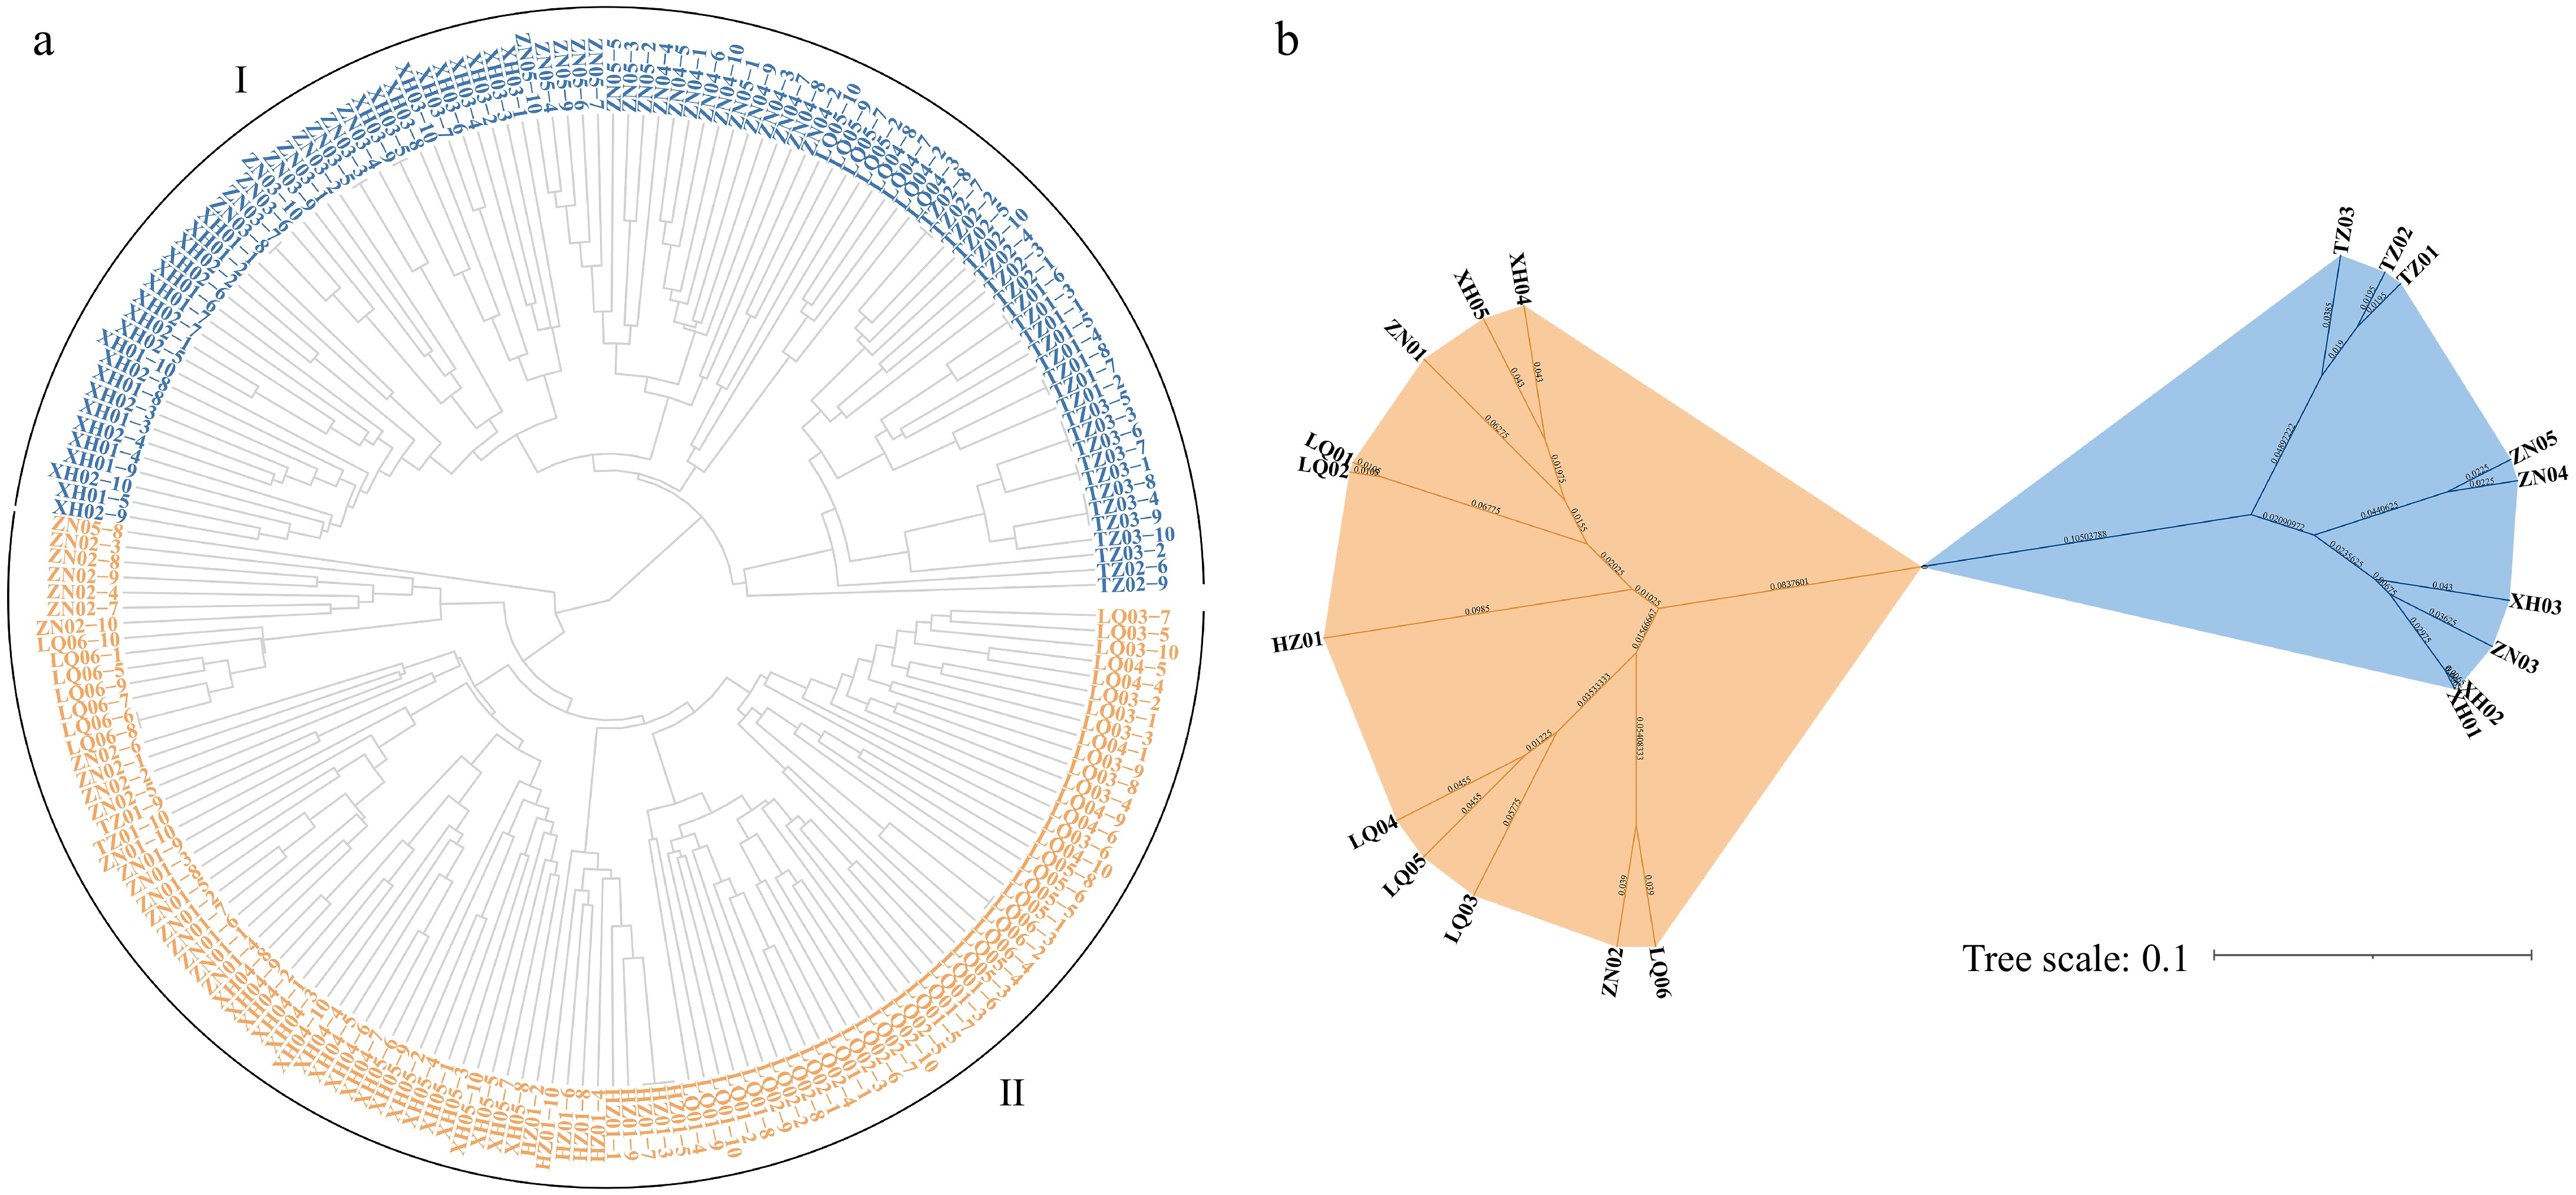
Figure 4.
Cluster analysis of E. sibiricus in the margin of NEQTP (a) based on individual plants, (b) based on populations.
Furthermore, STRUCTURE analysis also demonstrated the gene flow that existed in some populations. The optimal K value was determined to be 2, which led to the division of the 20 populations into two groups, consistent with the clustering results. The first group, primarily represented in orange, consisted of nine populations (XH01, XH02, XH03, ZN03, ZN04, ZN05, TZ01, TZ02, and TZ03), while the second group, primarily in blue, included 11 populations (XH04, XH05, ZN01, ZN02, LQ01, LQ02, LQ03, LQ04, LQ05, LQ06, and HZ01). The genetic background of each individual plant was visually represented by the proportions of the colors. This analysis not only highlighted the gene flow between individuals from LQ04, LQ05, TZ01, and TZ02 populations, but also revealed gene flow and genetic differentiation in individuals from XH05, ZN01, ZN02, ZN04, ZN05, LQ03, LQ06, TZ03, and HZ01 populations (Fig. 5).
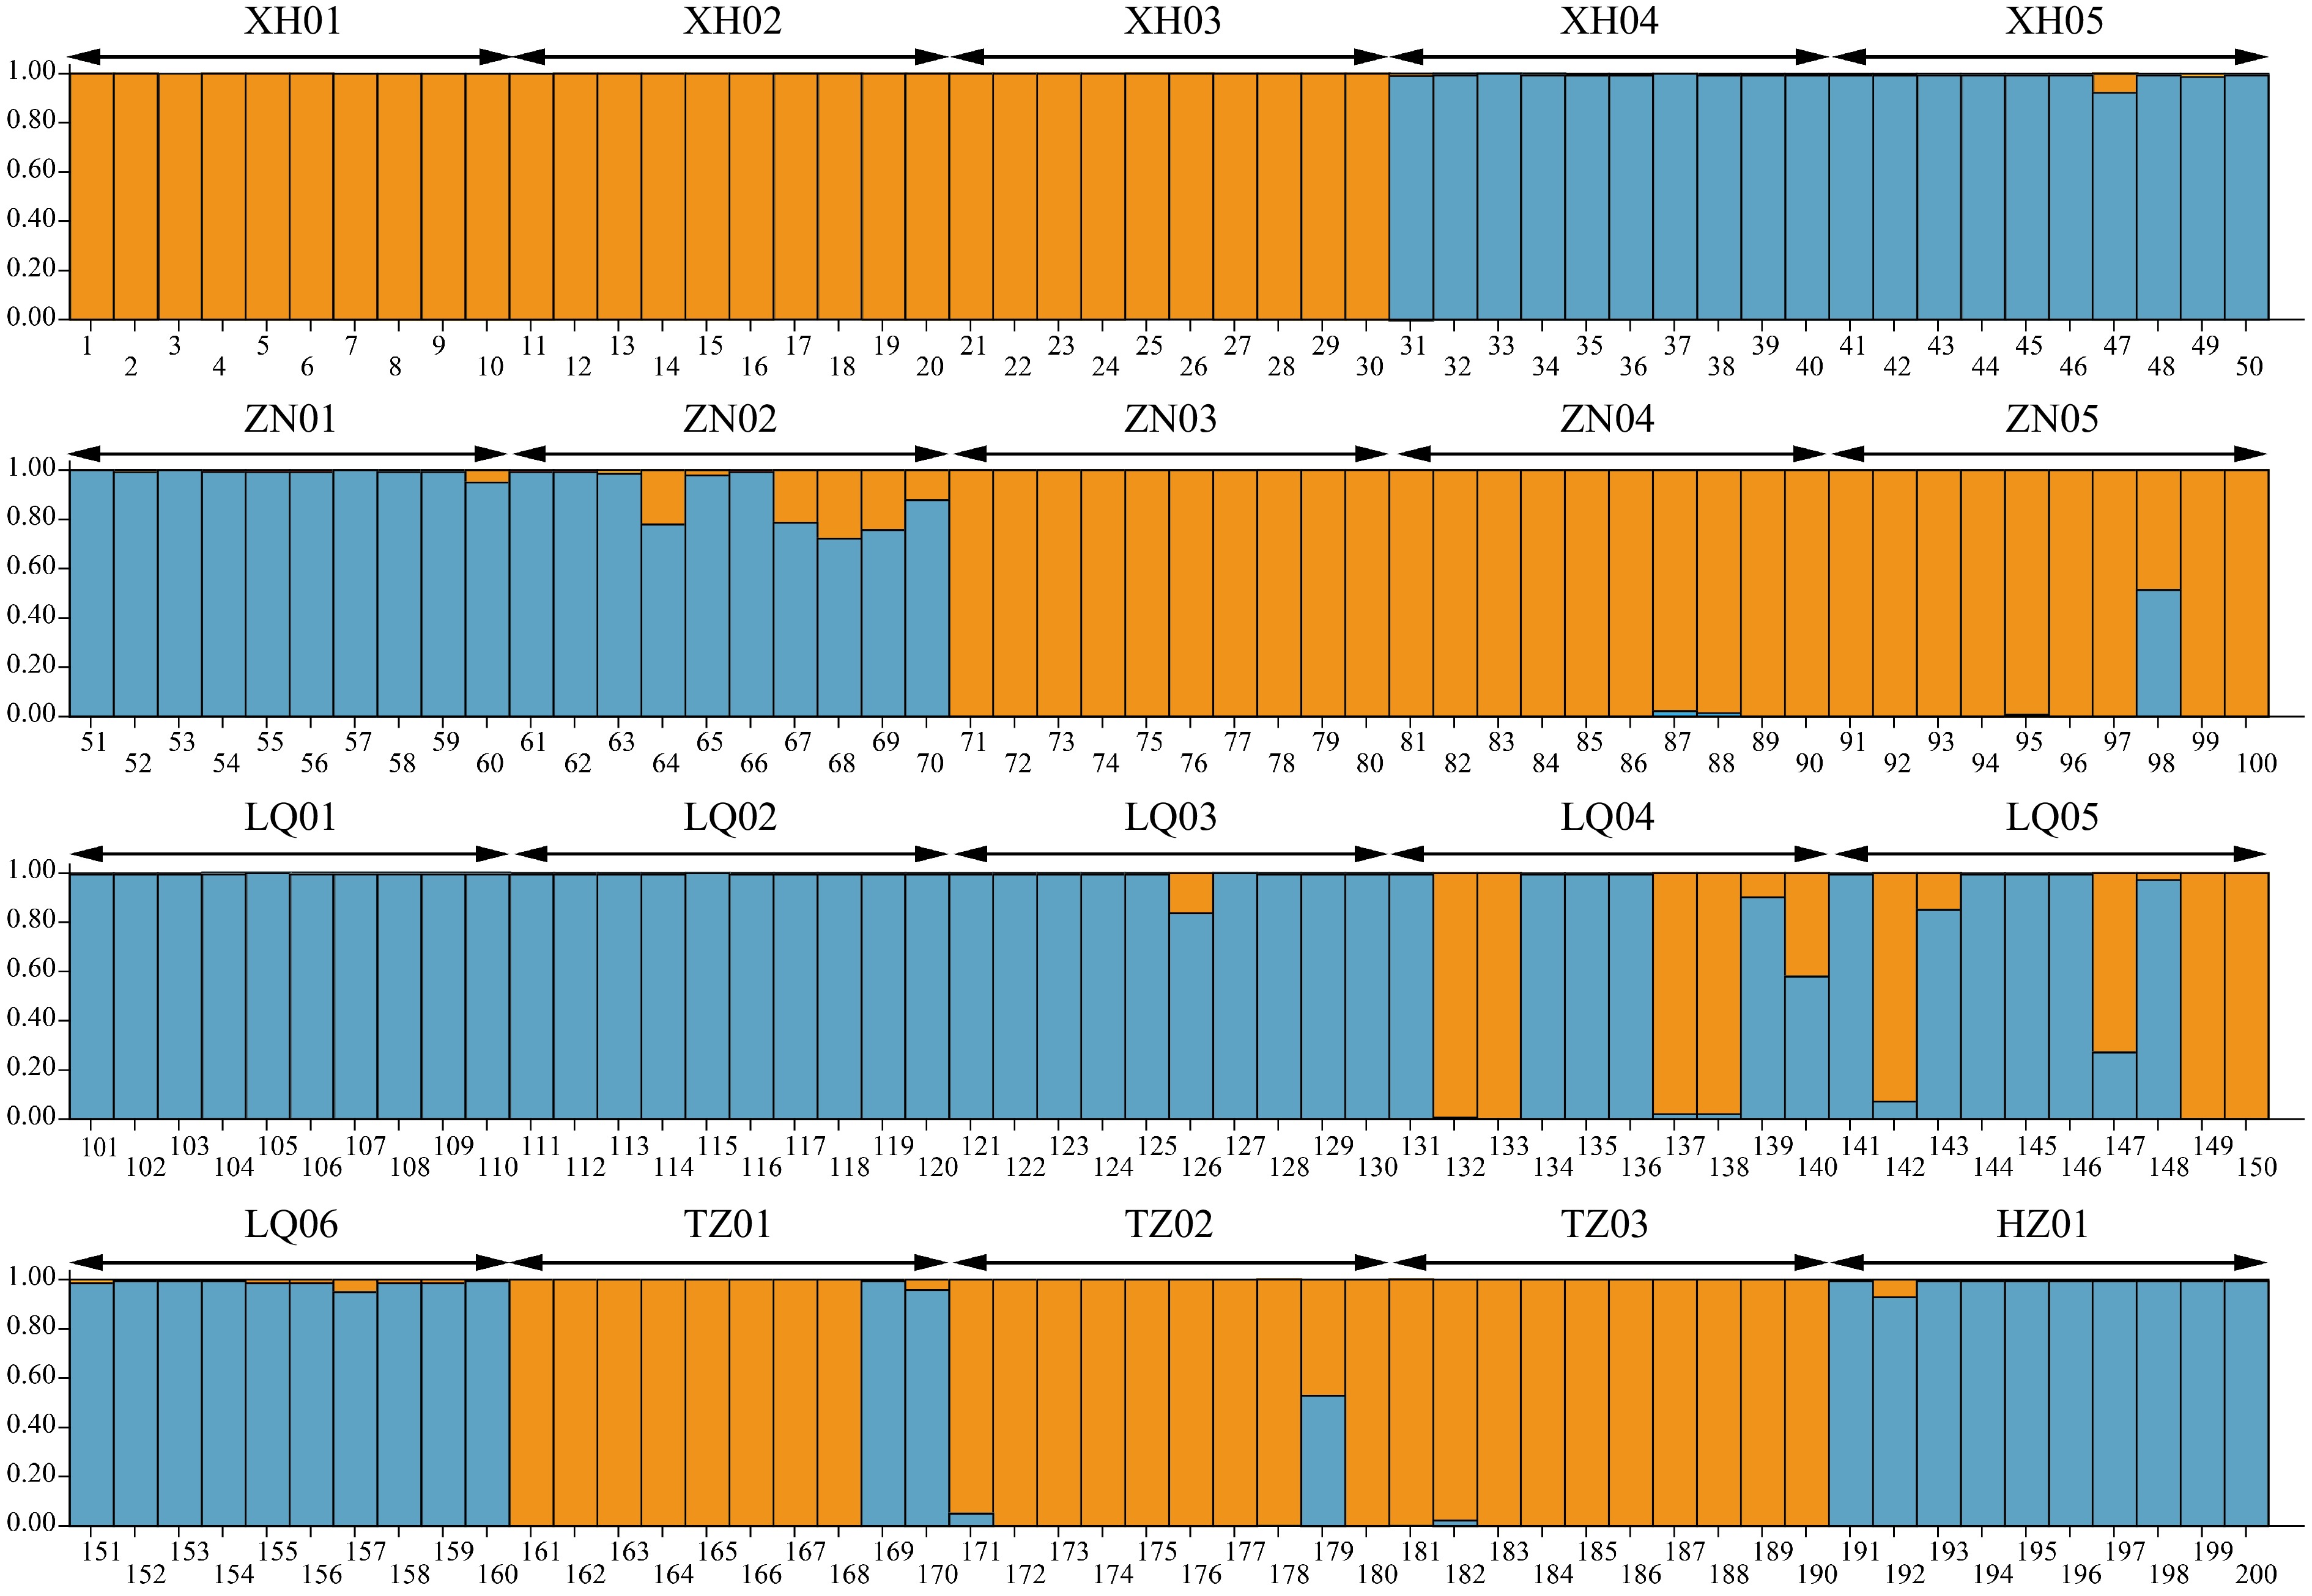
Figure 5.
The STRUCTURE analysis of E. sibiricus populations in NEQTP.
Association analysis of EST-SSR loci and traits of E. sibiricus in the margin of NEQTP
-
The results of Tassel software based on the GLM model showed that a total of 212 loci amplified by EST-SSR markers had a significant relationship (p < 0.01) with the 18 phenotypic traits excepted SW (Supplementary Table S7). The top loci associated with 18 phenotypic traits are shown in Table 4. According to the top loci, the characters of the second leaf from the top and tiller number were significantly associated with marker Ltc0157. Marker Ps433 had a significant association with the internode number and the spikelet number per branch. The ear length and plant height were notably correlated with marker Ltc0129. Marker Ps3447 can be utilized to identify the variations in awn length and breaking tensile strength. Marker Ltc0121 was applicable for identifying the variations in thousand kernel weight, booting time, heading time, and flowering time.
Table 4. Association analysis for phenotypic traits in the 200 E. sibiricus individuals using the GLM model.
Trait Marker P Marker_R2 Trait Marker P Marker_R2 FL Elw3592s195-loci4 2.11 × 10⁻⁴ 0.04127 BTS Ps3447-loci4 2.09 × 10⁻⁴ 0.05866 FW Elw3592s195-loci5 1.71 × 10⁻⁸ 0.10105 SL Elw5627s404-loci2 0.00919 0.02452 SLL Ltc0157-loci7 0.00119 0.04723 AL Ps3447-loci1 5.21 × 10⁻¹⁹ 0.33191 SLW Ltc0157-loci3 2.09 × 10⁻⁷ 0.10462 AL Ps3447-loci2 5.21 × 10⁻¹⁹ 0.33191 SD Elw1420s081-loci1 7.40 × 10⁻⁴ 0.04992 TKW Ltc0121-loci3 0.00121 0.03274 IN Ps433-loci7 6.24 × 10⁻⁷ 0.08686 TKW Ltc0121-loci4 0.00121 0.03274 SN Ps433-loci3 2.17 × 10⁻⁵ 0.08173 BT Ltc0121-loci3 9.50 × 10⁻⁵ 0.04213 FN Ps569-loci7 5.99 × 10⁻⁴ 0.05533 BT Ltc0121-loci4 9.50 × 10⁻⁵ 0.04213 FN Ps569-loci8 5.99 × 10⁻⁴ 0.05533 HT Ltc0121-loci3 1.32 × 10⁻⁵ 0.05129 EL Ltc0129-loci2 1.08 × 10⁻⁵ 0.08931 HT Ltc0121-loci4 1.32 × 10⁻⁵ 0.05129 PH Ltc0129-loci4 7.87 × 10⁻⁴ 0.04798 FT Ltc0121-loci3 7.61 × 10⁻⁶ 0.05388 TN Ltc0157-loci4 9.15 × 10⁻⁵ 0.07315 FT Ltc0121-loci4 7.61 × 10⁻⁶ 0.05388 The relationship between the geographical, genetic, phenotypic, and the altitude distance of E. sibiricus in the margin of NEQTP
-
The Mantel test revealed that geographical distance did not show a significant correlation with either genetic distance (r = 0.044, P = 0.220, Fig. 6a) or phenotypic distance (r = 0.042, P = 0.310, Fig. 6b). This suggests that the genetic and phenotypic diversity of E. sibiricus is relatively independent of geographical factors. In contrast, altitude distance demonstrated strong positive correlations with both genetic distance (r = 0.613, P = 0.010, Fig. 6d) and phenotypic distance (r = 0.509, P = 0.010, Fig. 6e), implying that altitude acted as a barrier that influences population connectivity. In addition, a notable positive correlation was detected between genetic distance and phenotypic distances (r = 0.509, P = 0.010, Fig. 6c).
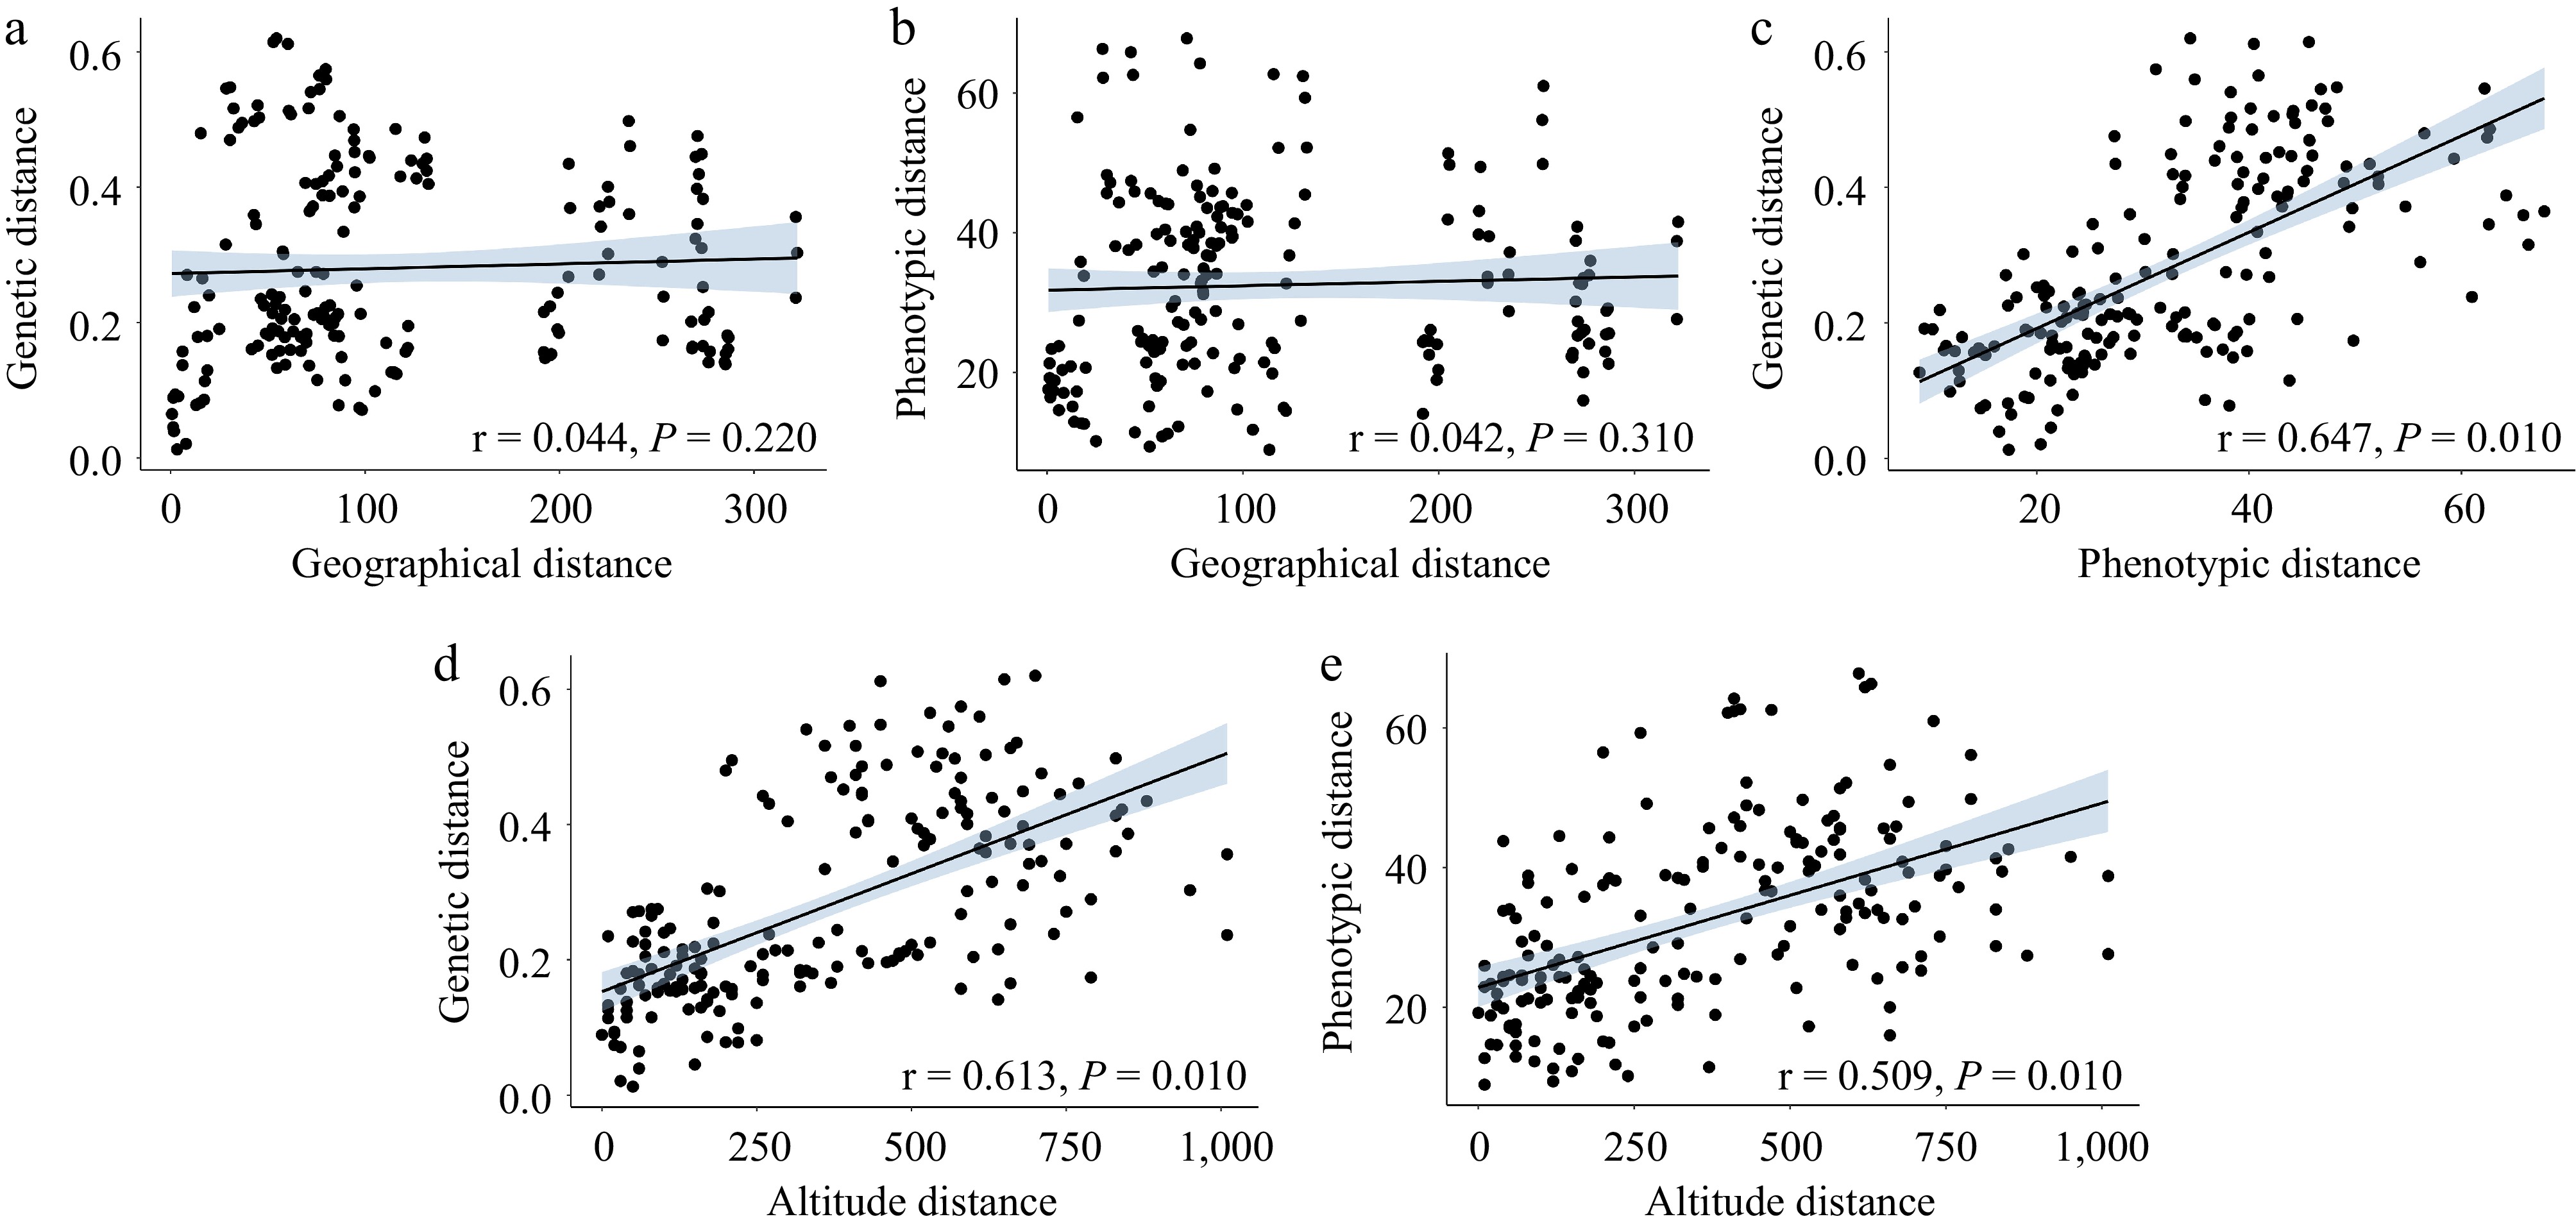
Figure 6.
Correlation analysis of the geographical, genetic, phenotypic, and altitude distance of E. sibiricus in the margin of NEQTP (a) regression of geographical distance and genetic distance (b) regression of geographical distance and phenotypic distance (c) regression of genetic distance and phenotypic distance (d) regression of altitude distance and genetic distance (e) regression of altitude distance and phenotypic distance.
-
Genotype causality can be inferred through phenotypes in the research of genetic diversity, but there are also cases where different genotypes share the same phenotype[28]. Therefore, dual evaluation and mutual verification can quickly define research objects. In this study, the CV of most traits was greater than 10% which declared these 20 populations in the margin of NEQTP were rich phenotypic variations. Among these traits, the greatest CV values were observed for breaking tensile strength and tiller number. A similar result has been presented in the Elymus study that seed shattering exhibited the greatest phenotypic variation in E. nutans and tiller number was the greatest in E. sibiricus[12]. At the molecular level, the percentage of polymorphic bands of E. sibiricus in the margin of NEQTP was 89%, indicating these markers can well reflect the genetic diversity of the germplasms in this study. The average of He was 0.77 and the average of Ho was 0.84. A higher heterozygosity indicated that the population had not undergone intensive selection and the genetic diversity was high[29]. It was similar to the results obtained by previous studies on the genetic diversity of E. sibiricus[20]. Association analysis between genotypes and phenotypes represents the most efficacious approach for functional site excavation and marker-assisted breeding[30]. Zhang et al. identified 1,825 significant loci related to 12 agronomic traits in an association population consisting of 210 E. sibiriucs genotypes, from which they identified core genes for plant height traits[13]. In this study, we identified 212 loci significantly associated with 18 traits, which provided additional resources for marker-assisted breeding of E. sibiricus.
In terms of genetic differentiation, the average phenotypic differentiation coefficient (Pst) was 82.66%, indicating that the phenotypic variation of E. sibiricus in the margin of NEQTP mainly derived from variation among populations. Study on population differentiation showed that less than 10% of genetic variation exists among populations in cross-pollination plants, 51.0% of genetic variation exists among populations in self-pollination plants[31]. As a self-pollinated forage grass, most individuals within a population of E. sibiricus are self-pollinating, which leads to minimal genetic differentiation in the offspring. This self-pollinating characteristic is the primary factor underlying the observation that phenotypic differentiation is greater between populations than within them. Deng et al. found the average phenotypic differentiation coefficient of 15 populations was 31.36%, indicating that the variation of phenotypic traits in Cynodon dactylon mainly came from within populations due to it was cross-pollination plant[32]. AMOVA analysis results of this study showed that the genetic variation between populations of E. sibiricus in the margin of NEQTP accounted for 67% of the total variation. In contrast, previous studies on E. nutans, E. burchan-buddae, and E. sibiricus reported among-population variances of 42.97%, 37.63%, and 40.00%, respectively[20,33], which contradicted the expected genetic pattern for self-pollinated plants. Nonetheless, both the phenotypic and molecular variation analyses in this study align with the genetic patterns typically observed in self-pollinating species.
The genetic structure of the population is a unique distribution pattern formed by the influence of a complex external environment in the process of natural evolution[34]. The optimal classification of the STRUCTURE results was the same as the unweighted pair group method with arithmetic mean (UPGMA) clustering analysis based on populations. The individual plants of LQ04, LQ05, TZ01, and TZ02 populations contained gene flow with other populations. Gene flow may be through pollen or seeds brought by the wind, rivers, or animals[35]. According to previous studies on Elymus, seed dispersal may lead to more gene exchange than pollen dispersal[12,36]. Climate change and human interference also can influence plant diversity[37]. To better explain this phenomenon, we suggest that future studies use population genomics to explore the evolutionary relationships among populations in E. sibiricus.
Flowering time diversity of E. sibiricus in the margin of NEQTP
-
In this study, the development time of E. sibiricus in the margin of NEQTP were especially focused on. Flowering phenology is arguably the most significant phenology of angiosperms. Flowering time was related to altitude, temperature, and rainfall[38]. Moreover, not only abiotic factors affect flowering but biological factors also affect flowering time changes[39]. Correlation analysis showed that flowering time were significantly negatively correlated with FL, FW, SLW, SLL, IN, SN, SL, and TKW. The result indicated the earliest-flowering population XH02 identified in this study was suitable for grassland restoration and seed production in the margin of NEQTP. The early-flowering germplasm can complete the growth period in advance and avoid the harm of some extreme weather[23]. Principal component analysis showed that flowering time, SD, FN, EL, SW, TN, and PH were the main factors contributing to the phenotypic diversity of the population. It was suggested that nutritional traits and reproductive traits together affected the phenotypic diversity of the population similar to the results obtained by Yan et al.[40].
Flowering time was often a target chosen during domestication because it altered yield components[24]. Seed size was mediated by flowering genes CO (CONSTANS)-AP2 (APETALA2) by photoperiod[41], and flowering time affects not only leaf length and width but also the final number of leaves[42] which was certificated in previous studies. In this study, marker Ltc0121 exhibited a stronger correlation than marker 28366 in the identification of flowering time[25]. According to the annotation, marker Ltc0121 was related to inorganic pyrophosphatase[43]. Soluble inorganic pyrophosphatase acetylation led to aberrant pollen tube development[44]. However, to date, there has been no reported correlation between this gene and flowering time. Additionally, marker Ltc0121 was also correlated with the TKW of E. sibiricus on the Qinghai-Tibet Plateau. In the past, researchers often explained the high yield of early-flowering materials from the perspective of grain filling[45]. In durra sorghums of Ethiopia, leaf area was significantly positively related with TKW and plant height was significantly negatively correlated with TKW, and FW which suggested breeding selection of larger leaf area may contribute to yield improvement[46]. In maize hybrids, higher photosynthetic capacity, longer photosynthetic duration, and suitable leaf area index were important factors in obtaining high-yielding maize varieties[47]. Combined with the results of this experiment, we speculated that flowering time may indirectly affect TKW by directly affecting leaf length which was confirmed by structural equation models (Fig. 7).
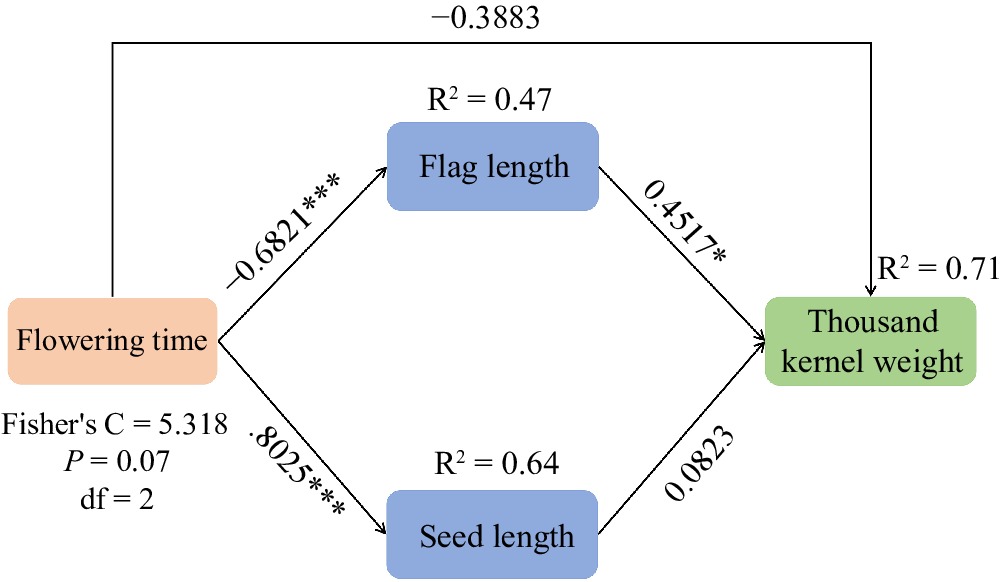
Figure 7.
A structural equation model of treatment effects on the thousand kernel weight (TKW), including direct effects of flowering time on TKW and indirect effect of flag length and seed length on TKW in E. sibiricus.
Factors affecting genetic diversity of E. sibiricus in the margin of NEQTP
-
The sampling sites were located at the margin of NEQTP, close to the west of Loess Plateau, and the resource information was complex. Genetic structure analysis showed a gene differentiation situation. One is, isolation by distance (IBD), caused by remote geographical distances or genetic geographical barriers, intra-population migration, mating, and gene flow. The other is, isolation by environment (IBE), the habitat of the population[14]. In E. nutans, genetic diversity was affected by geography (r = 0.575, P = 0.001) and climate (r = 0.329, P = 0.001), but phenotypic diversity was not[30]. In E. tangutorum, a weak correlation between genetic diversity and environment, and a significant correlation between genetic diversity and geographic distance[48]. In E. excelsus, a weak geographic signature (r = 0.202, P < 0.01) among the tested E. excelsus accessions[49]. In this study, geographical distance were no-significant correlations between genetic distance and phenotypic distance. However, altitude distance had both significant positive correlations with genetic distance and phenotypic distance which indicated that the effect of altitude was more significant for the E. sibiricus populations in the margin of NEQTP. The research of three Elymus species also found altitude affected genome size variation of E. nutans, E. burchan-buddae, and E. sibiricus, especially in the mid-altitude populations (3,900−4,300 m)[50]. Under different environments, the diversity of species is derived from genome size variation and hybridization. Altitude differences constitute different gradients of water, light, heat, and soil, which make the natural geographical environment of plant growth diversified, and also make plants produce complex adaptive changes to the environment, which intensifies the genetic differentiation among populations[51,52].
Conservation and utilization
-
As the dominant grass species in the QTP and the model plant of the genus Elymus, E. sibiricus has been paid increasing attention. Phenotypic variation, genetic diversity, and genetic structure of plant populations are important aspects of conservation biology[53]. In recent years, less work has been done to evaluate the phenotype of E. sibiricus populations. We supplemented the germplasms information of the E. sibiricus in the northeastern margin of the Tibetan Plateau, especially in Tianzhu County. Among them, XH02 was an early-flowering and high-yield population that was suitable for seed production in NEQTP. LQ05 was a higher diversity population derived from over 3,000 m which may be used for ecological restoration. These populations should be subject to ex situ conservation and can be bred into hybrids to retain excellent traits. The lowest genetic diversity population TZ03 with wider leaf and more tillering was suitable for forage production. We recommend that this population be conserved using both in situ and ex situ approaches. Although this region has populations with distinct genetic components (TZ01 and TZ02). In the future, further exploration of genetic resources could be facilitated by utilizing genomic data[54].
-
This study provides a comprehensive dual evaluation of E. sibiricus diversity at the northeastern edge of the Qinghai-Tibet Plateau (NEQTP), integrating both phenotypic and genotypic data, with additional information specifically gathered from Tianzhu County. The results indicate considerable phenotypic variation and molecular polymorphism, most notably within populations. Genetic differentiation among populations was largely influenced by the altitudinal variation along the NEQTP margin. Moreover, flowering time emerged as a key trait in selecting germplasms, which was related to the 1000-grain weight of E. sibiricus. Marker Ltc0121 was a practical tool to identify both traits simultaneously. In light of these findings, accessions XH02, TZ03, and LQ05 are identified as key candidates for future ecological restoration and production efforts. To ensure their effective conservation and utilization, both in situ and ex situ conservation strategies are strongly recommended. This study not only enhances our understanding of the genetic and phenotypic diversity of E. sibiricus but also provides valuable insights into the sustainable development and preservation of its germplasm resources in the NEQTP region.
This work was supported by earmarked fund for Leading Scientist Project of Gansu Province (23ZDKA013), the Leading Scientist Project of Qinghai Province (2023-NK-147), CARS (CARS-34), and Gansu Provincial Science and Technology Major Projects (22ZD6NA007).
-
The authors confirm contribution to the paper as follows: study conception and design: Zheng Y, Xie W; data collection: Zheng Y, Lu H, Tang L, Zhang F; analysis and interpretation of results: Zheng Y, Lu H, Tang L; draft manuscript preparation: Zheng Y, Zhang F, Xie W. All authors reviewed the results and approved the final version of the manuscript.
-
All data generated or analyzed during this study are included in this published article and its supplementary information files.
-
The authors declare that they have no conflict of interest.
- Supplementary Table S1 Information of 14 pairs of EST-SSR primers.
- Supplementary Table S2 The basic parameters and Shannon index of the phenotypic traits in E. sibiricus.
- Supplementary Table S3 The principal component analysis of agronomic traits in the population of E. sibiricus.
- Supplementary Table S4 Polymorphic information of loci amplified by EST-SSR markers.
- Supplementary Table S5 Genetic diversity information of E. sibiricus populations in the margin of NEQTP.
- Supplementary Table S6 Nei's genetic distance (bottom left triangular matrix) and genetic identity (top right triangular matrix) analysis of 20 E. sibiricus populations in NEQTP.
- Supplementary Table S7 Information of loci associated with 18 phenotypic traits using the GLM model (p < 0.01).
- Supplementary Fig. S1 Booting time, heading time, and flowering time of E. sibiricus. (a)−(c) the data in 2019; (d)−(f) the data in 2020; (g)−(i) the average value in two years.
- Copyright: © 2025 by the author(s). Published by Maximum Academic Press, Fayetteville, GA. This article is an open access article distributed under Creative Commons Attribution License (CC BY 4.0), visit https://creativecommons.org/licenses/by/4.0/.
-
About this article
Cite this article
Zheng Y, Lu H, Tang L, Zhang F, Xie W. 2025. Genetic diversity assessment, germplasm resource conservation, and utilization in Elymus sibiricus from the margin of Northeast Qinghai-Tibet Plateau based on phenotypes and genotypes. Grass Research 5: e011 doi: 10.48130/grares-0025-0007 

Genetic diversity assessment, germplasm resource conservation, and utilization in Elymus sibiricus from the margin of Northeast Qinghai-Tibet Plateau based on phenotypes and genotypes
- Received: 12 December 2024
- Revised: 15 January 2025
- Accepted: 11 February 2025
- Published online: 02 April 2025
Abstract: Elymus sibiricus, a dominant native grass species on the margin of the Northeast Qinghai-Tibet Plateau (NEQTP) alpine meadows, is crucial for forage production and ecological restoration. However, limited studies on phenotypic and genetic diversity have hampered the protection and utilization of germplasm in E. sibiricus. In this study, the dual diversity evaluation based on phenotypes and genotypes was performed on 200 germplasms of 20 E. sibiricus populations using 19 phenotypic traits and 14 molecular markers. An abundant polymorphism was observed, with the phenotypic variation coefficient ranging from 2.97% (booting time) to 55.13% (breaking tensile strength) and Nei's genetic diversity index varying from 0.02 (TZ03) to 0.17 (LQ05). Both phenotype differentiation coefficient and molecular analysis of variance showed variation mainly from among populations. Clustering and STRUCTURE results showed that all populations are divided into two groups. A total of 24 loci were determined with a significant relationship to phenotypic traits by Tassel analysis, and the marker Ltc0121 can be used to identify both yield and flowering traits. Altitude distance (r = 0.613, p = 0.010) affected genetic diversity rather than geographical distance (r = 0.044, p = 0.220) for E. sibiricus. Our study evaluated the germplasm of Tianzhu County for the first time. According to the results of dual diversity evaluation, the lowest genetic diversity population TZ03 should be conserved using both in situ and ex situ approaches. The collection and evaluation of E. sibiricus in this study provided a key prerequisite for conservation and utilization in the margin of NEQTP.
-
Key words:
- Elymus sibiricus /
- Germplasm evaluation /
- Genetic diversity /
- Altitude effect /
- Tianzhu County