-
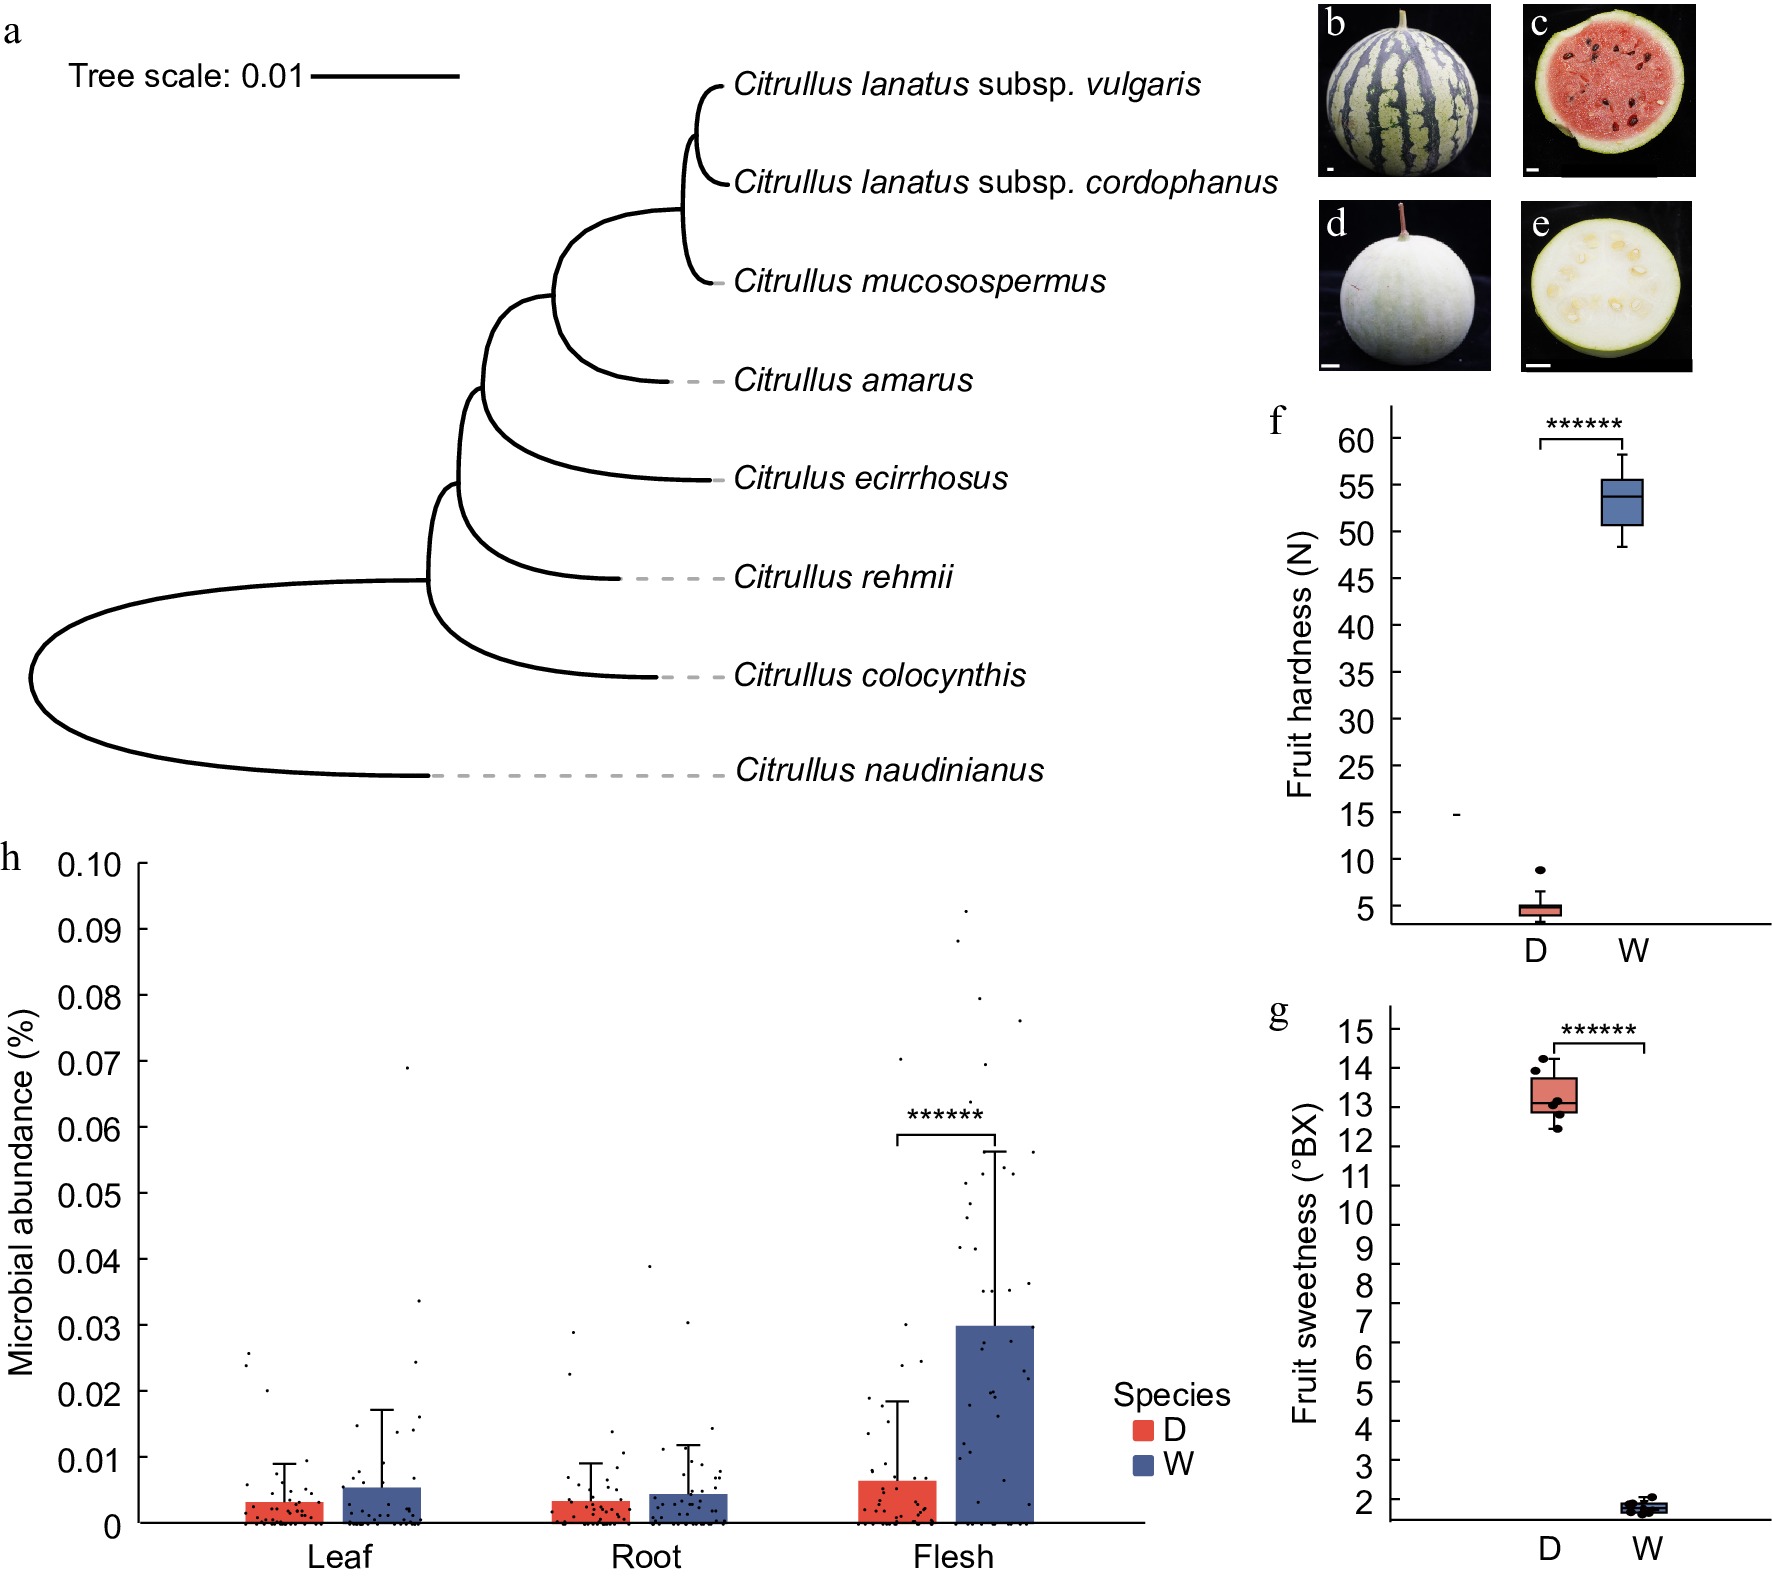
Figure 1.
Differences in fruit characteristics and microbial communities among watermelon cultivars. (a) Phylogenetic tree of watermelon and related Cucurbitaceae species. (b) Fruit appearance of M1511-3. (c) Fruit section of M1511-3. (d) Fruit appearance of PI595203. (e) Fruit section of PI595203. (f) Differences in flesh firmness. (g) Differences in flesh sweetness. (h) Differences in microbial communities across leaves, roots, and flesh.
-
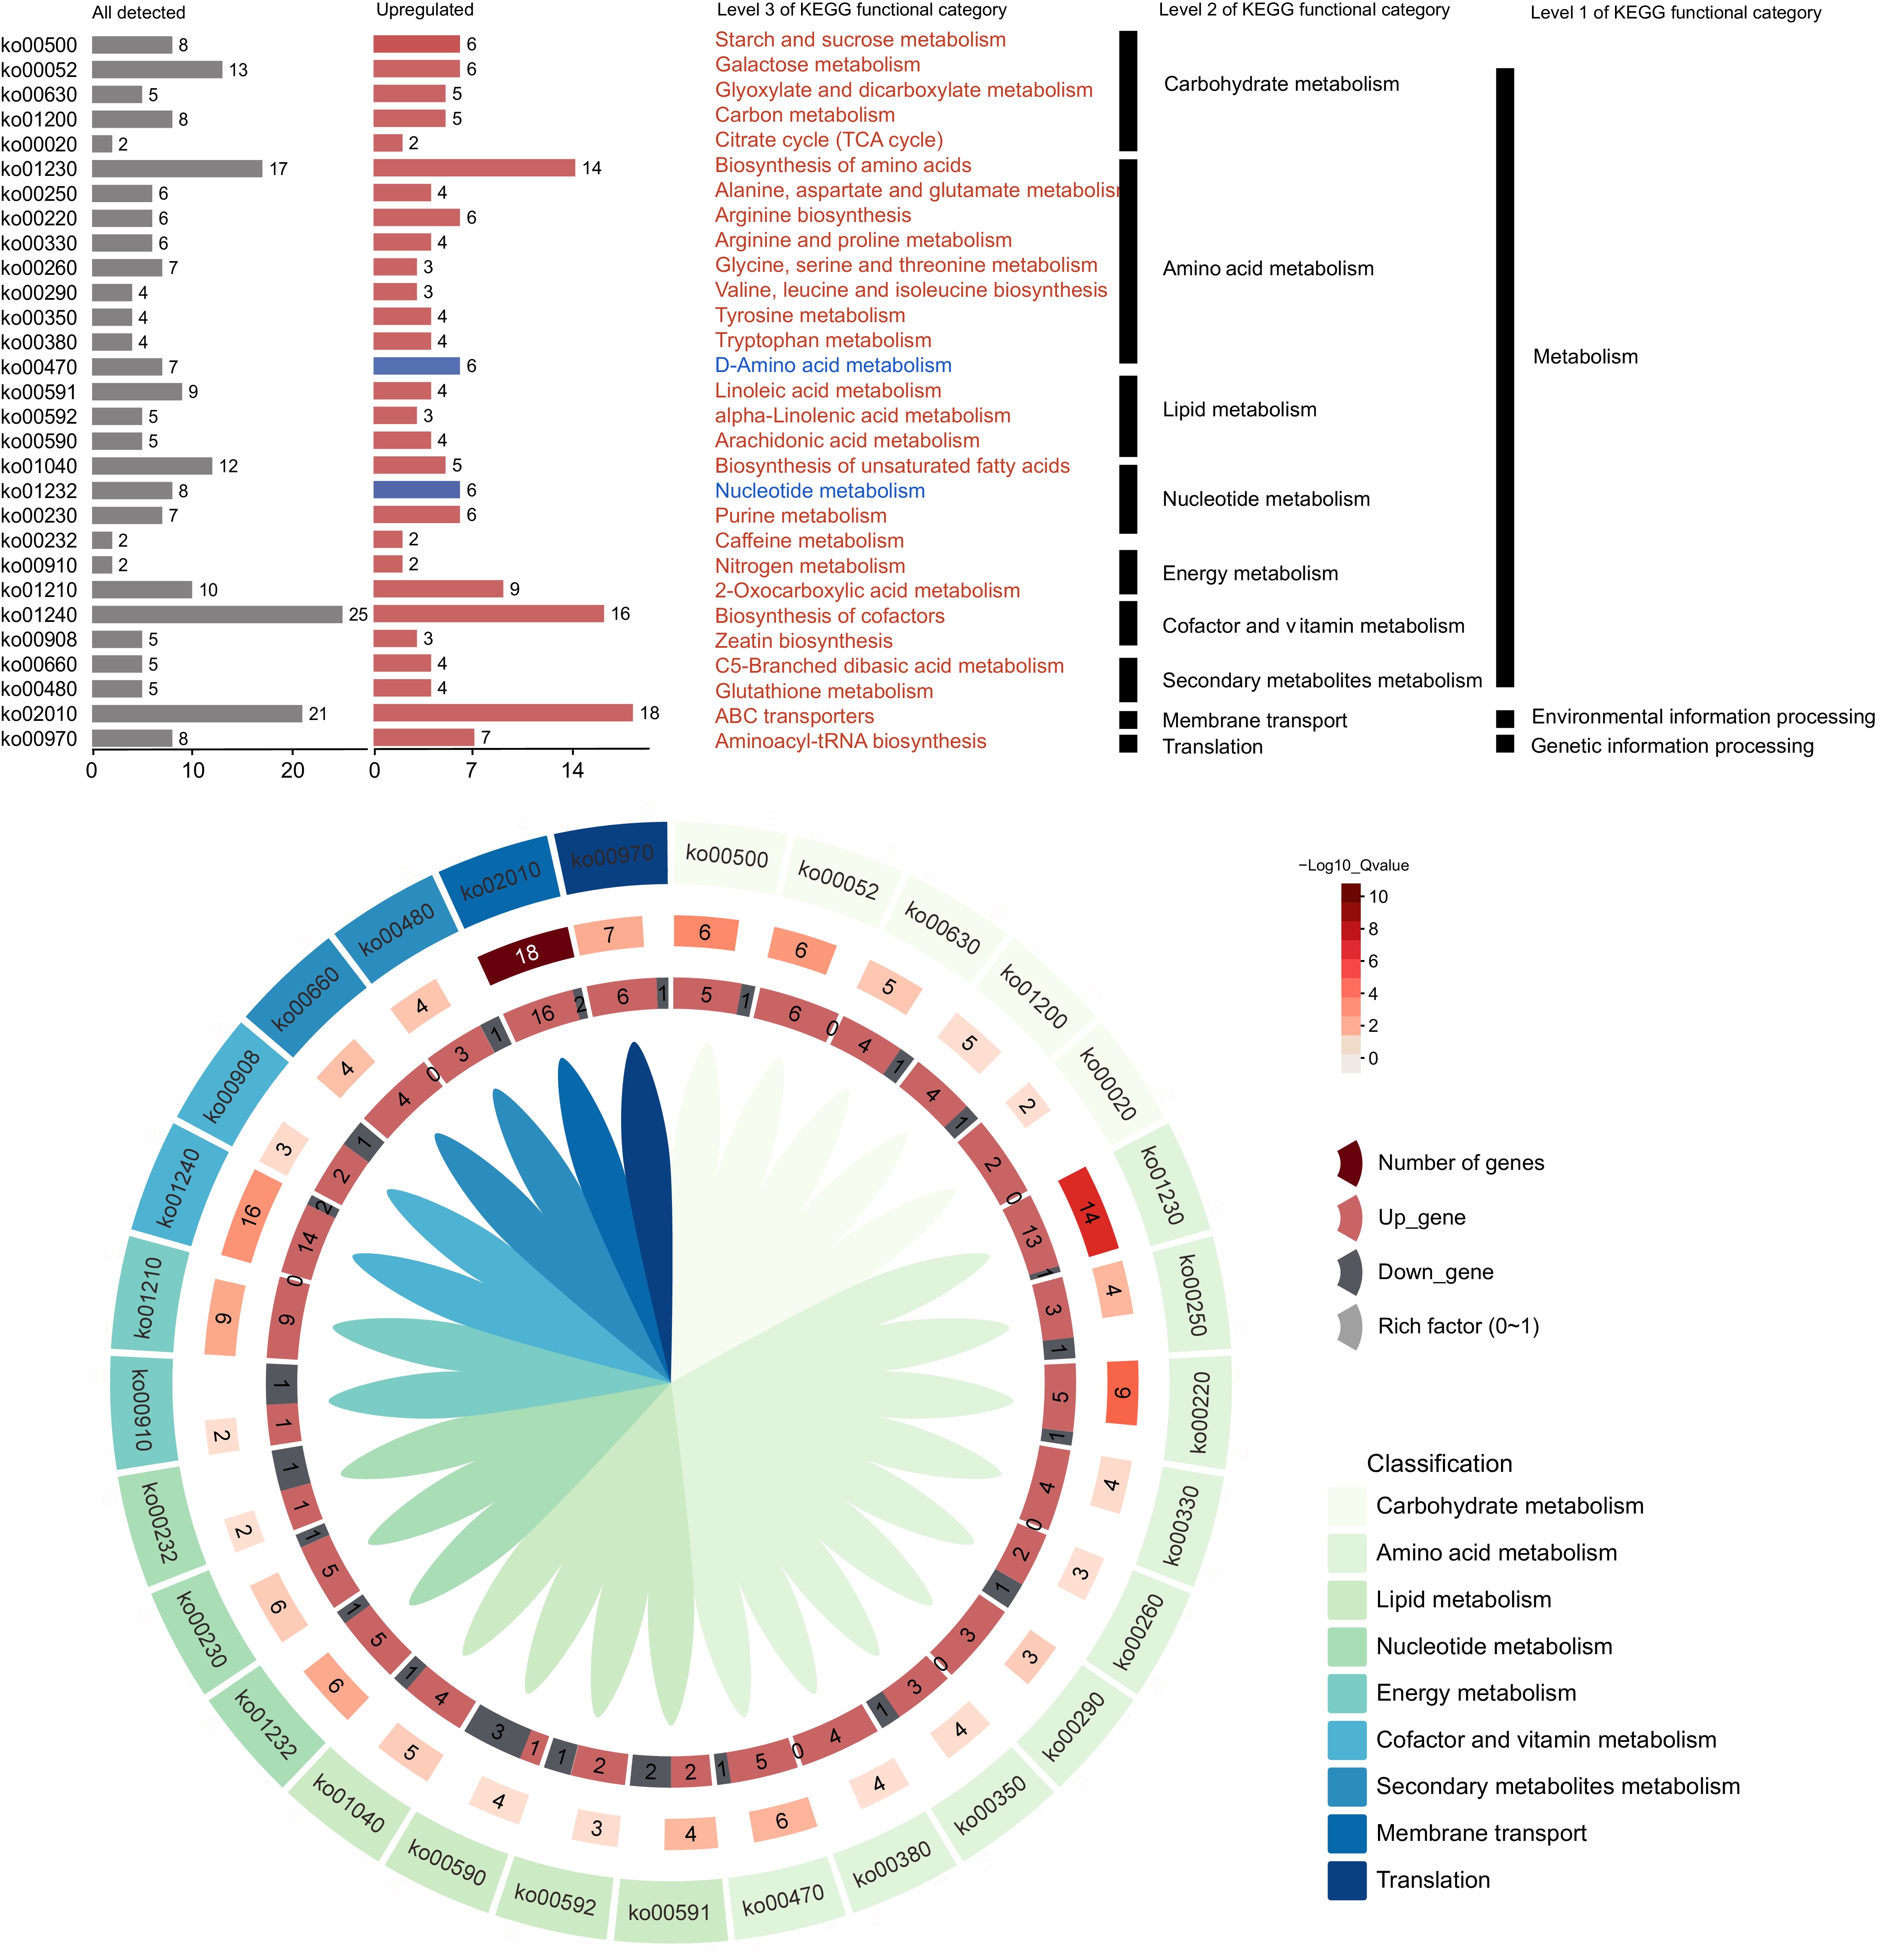
Figure 2.
Analysis of KEGG pathway enrichment and gene expression differences. (a) KEGG enrichment highlights significant KO categories in cultivated (pink) and wild (blue) watermelon flesh. (b) KEGG plot shows enriched pathways in M1511-3 vs PI595203.
-
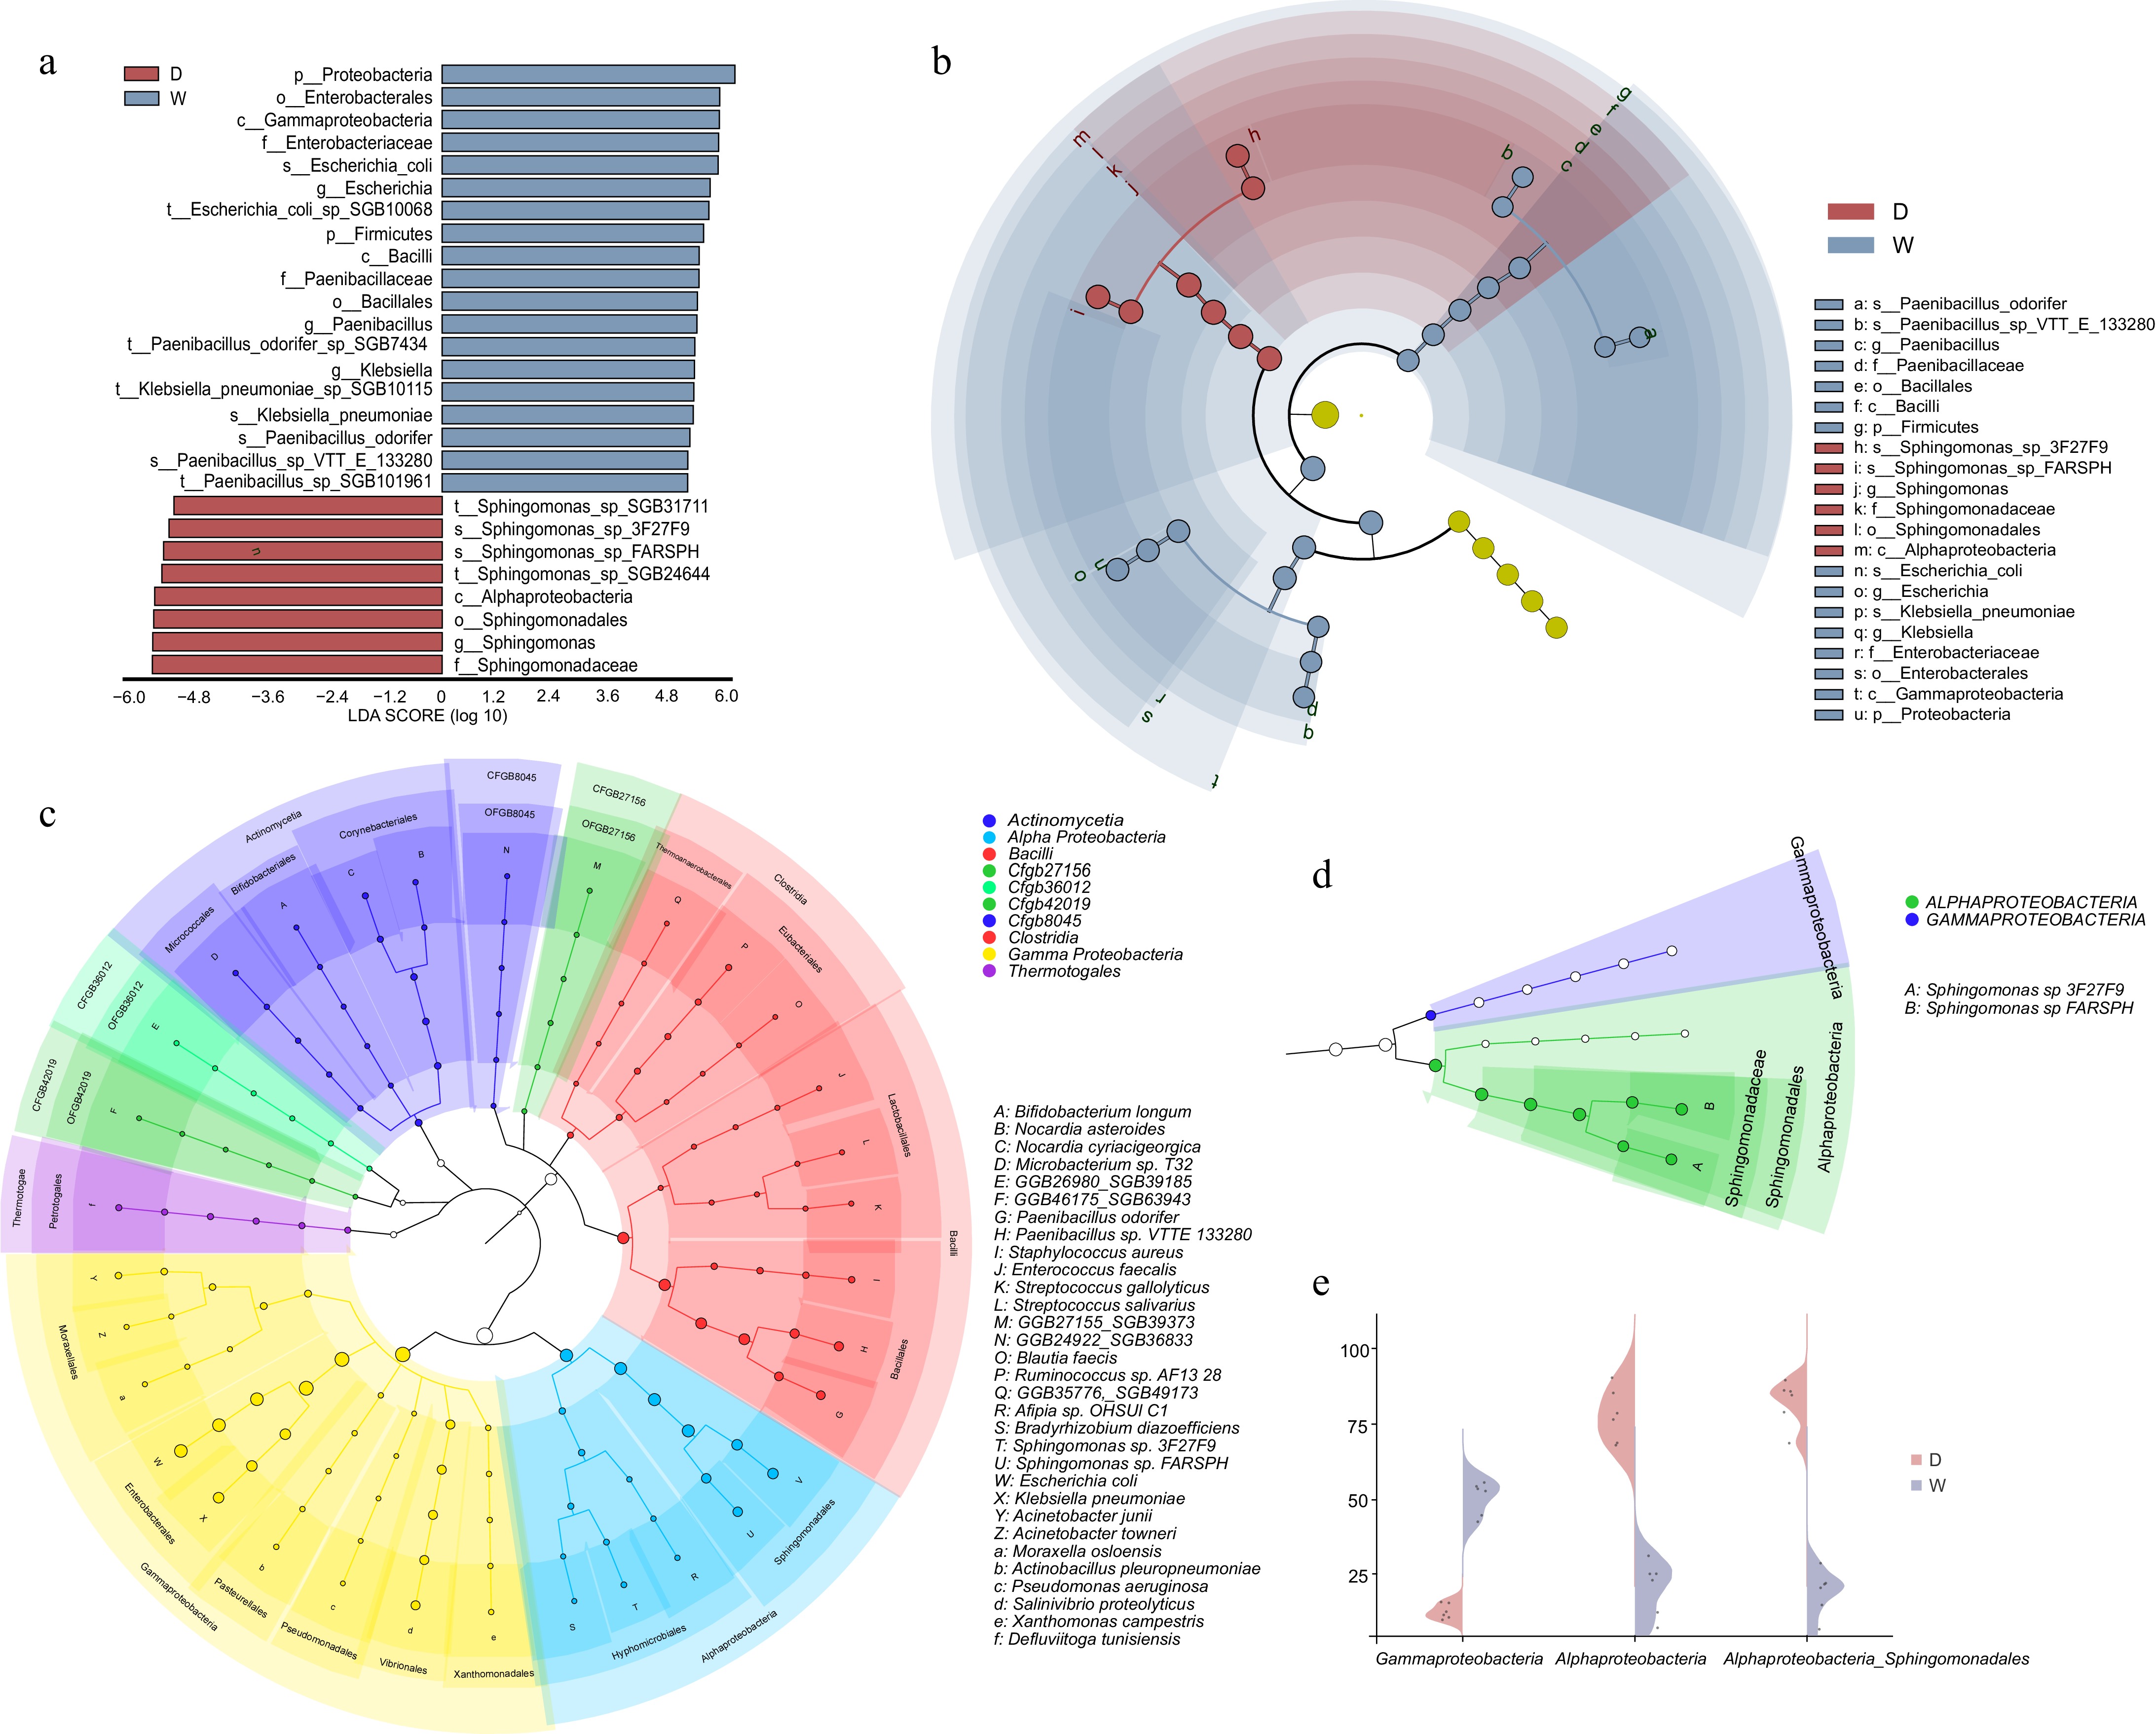
Figure 3.
Comparative analysis of microbial communities in two cultivars. (a) LDA plot showing species with values > 2, denoted by D for M1511-3 and W for PI595203. (b) Evolutionary plot depicting taxonomic levels and biomarkers. (c), (d) Phylogenetic trees of microbial communities in both cultivars. (e) Abundance differences of key microbial species between the two varieties.
-
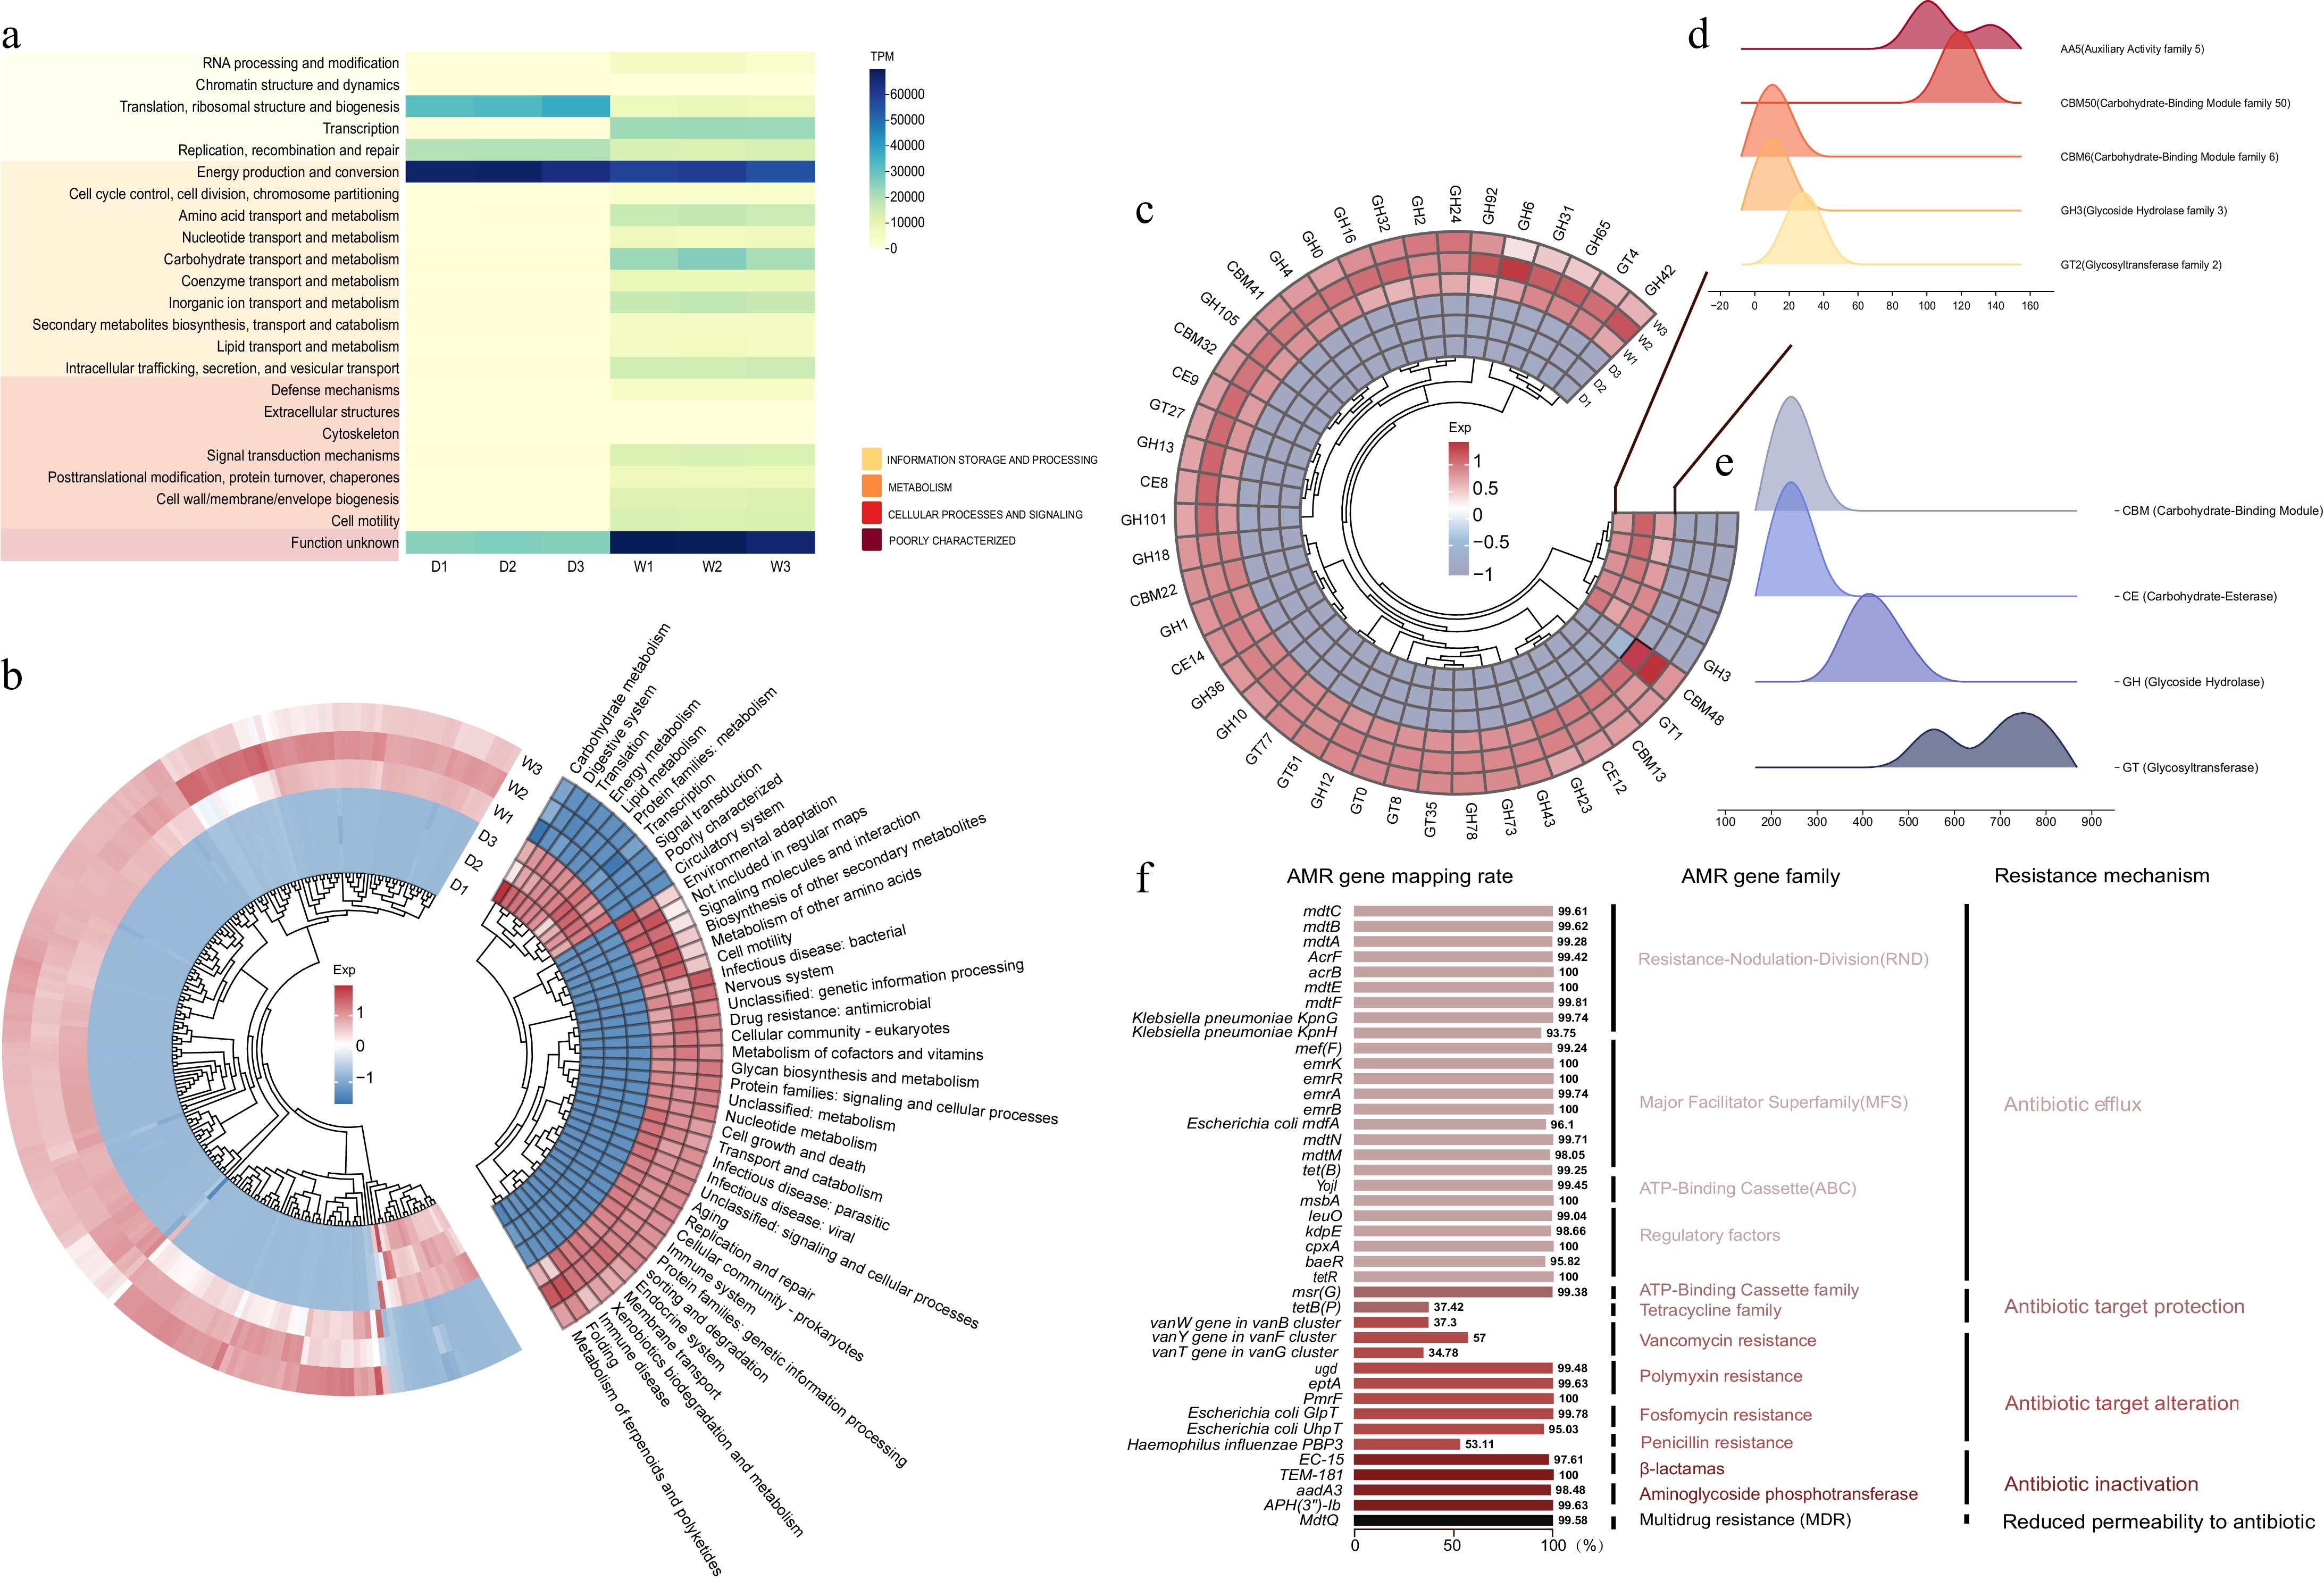
Figure 4.
Functional Differences in Watermelon Flesh Microbiota: (a) COG annotation of microbiota (Group D: M1511-3, Group W: PI595203; n=3 replicates); (b) KEGG pathway enrichment (left: raw data, right: secondary classification); (c) CAZyme family abundance differences, highlighting enrichment in (d) M1511-3 and (e) PI595203 microbiota; (f) 40 AMR genes detected in PI595203, annotated by localization, family, and resistance mechanisms.
Figures
(4)
Tables
(0)