-
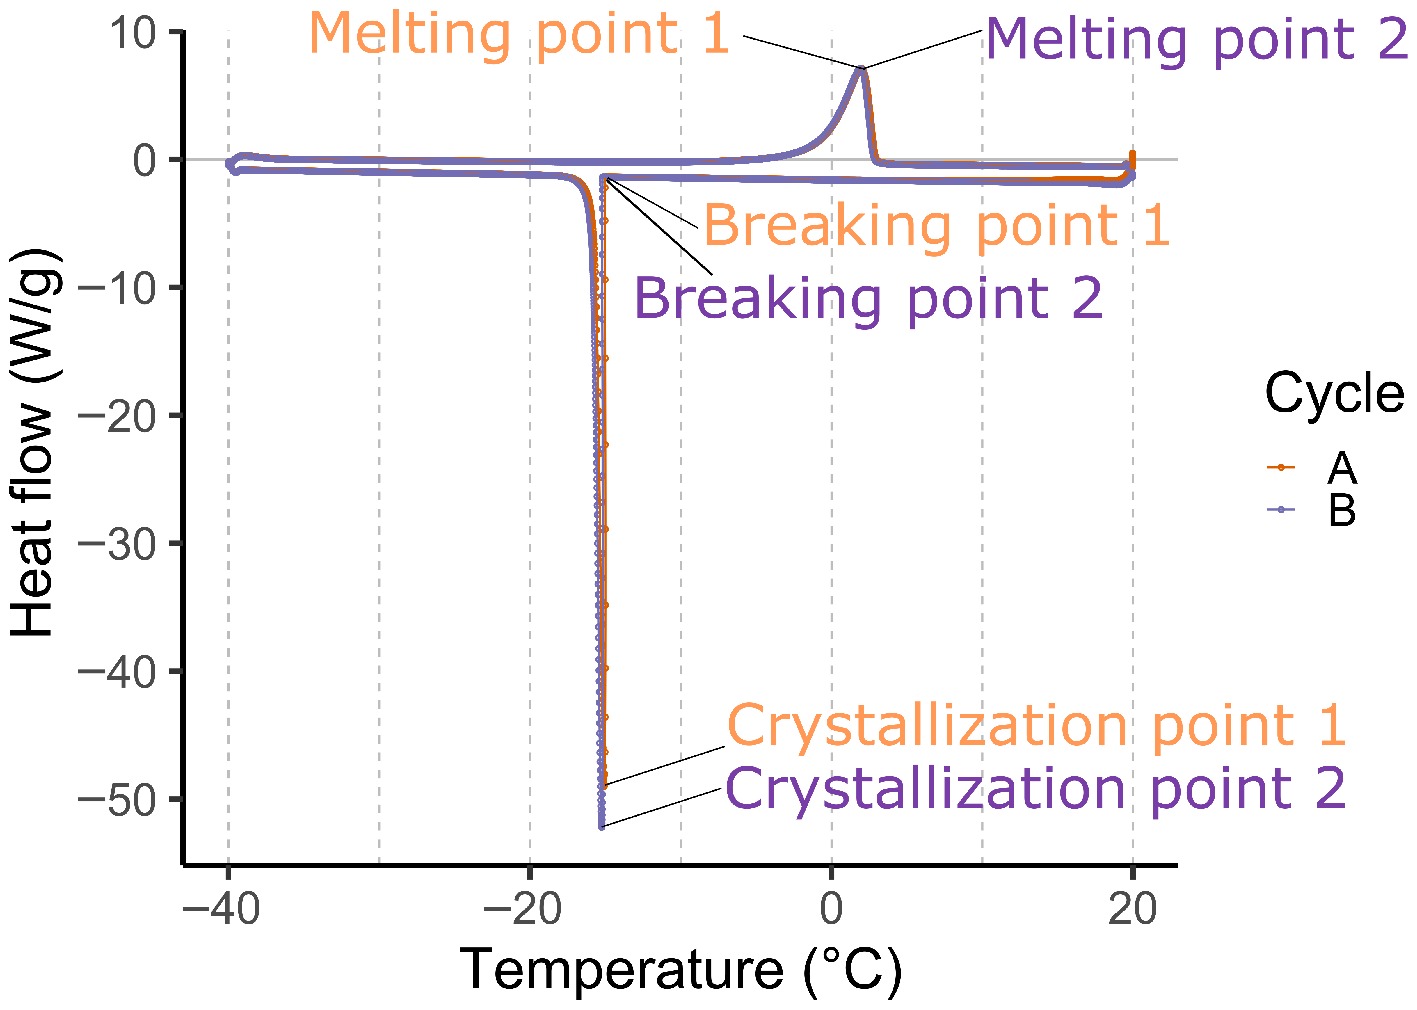
Figure 1.
Differential scanning calorimetry (DSC) heat flow plot of a pear ovule generated by the TA Instruments Q2000 DSC machine, representing two cycles of cooling and heating, each with three main characteristic data points (breaking points, crystallization point, and melting point). Numbers 1 and 2 at each data point represent the first and second cycle (cycles A and B), respectively.
-
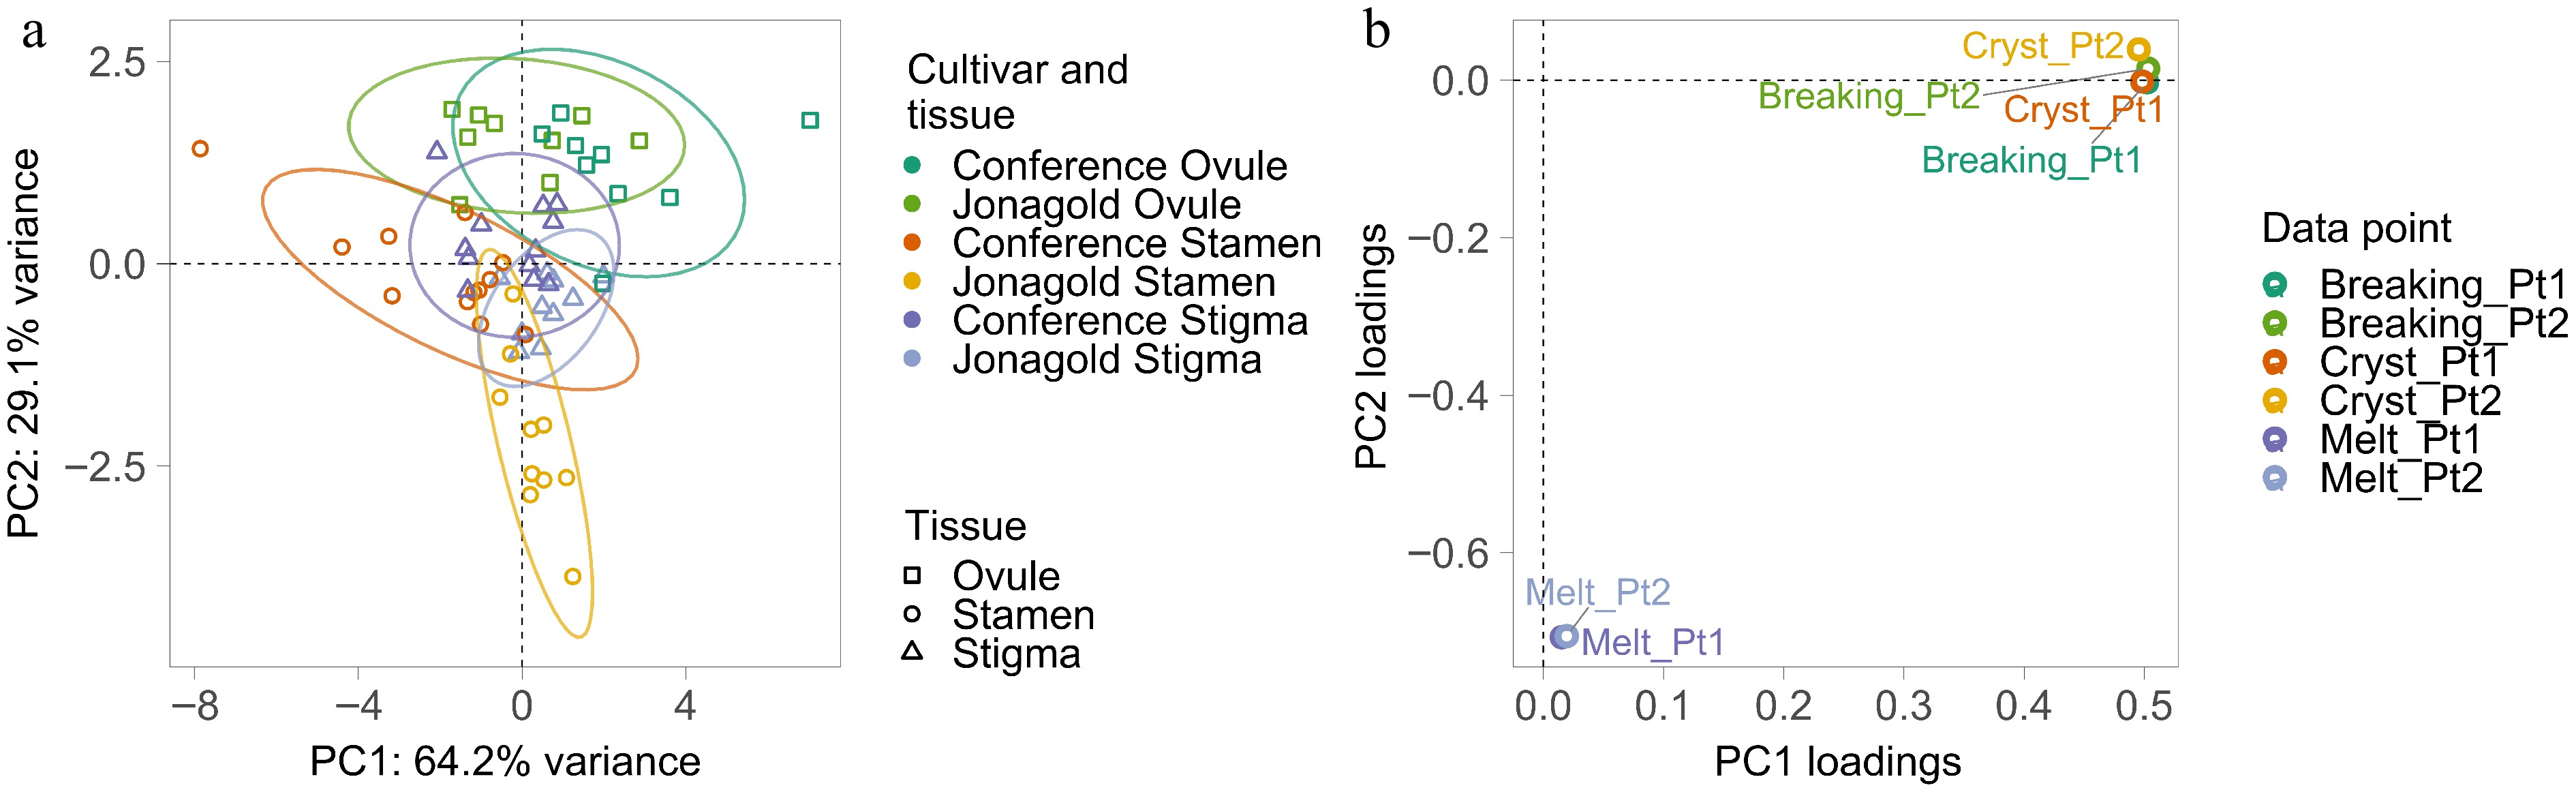
Figure 2.
(a) Principal component analysis (PCA) plot showing variance distribution of the six different differential scanning calorimetry (DSC) data points of all apple and pear floral organ samples according to principal component 1 and 2 (PC1 and PC2) with sample grouping according to tissue (ovule, stamen, or stigma) and species type (cultivars 'Conference' pear and 'Jonagold' apple) as indicated by the ellipsoid figures. (b) PCA loading plot showing the relative contribution of the different DSC data points to the first two principal components of the PCA analysis of all samples. PC1 is determined by Cryst_Pt1, Cryst_Pt2, Breaking_Pt1, and Breaking_Pt2 data points, whereas PC2 is determined by Melt_Pt1 and Melt_Pt2.
-
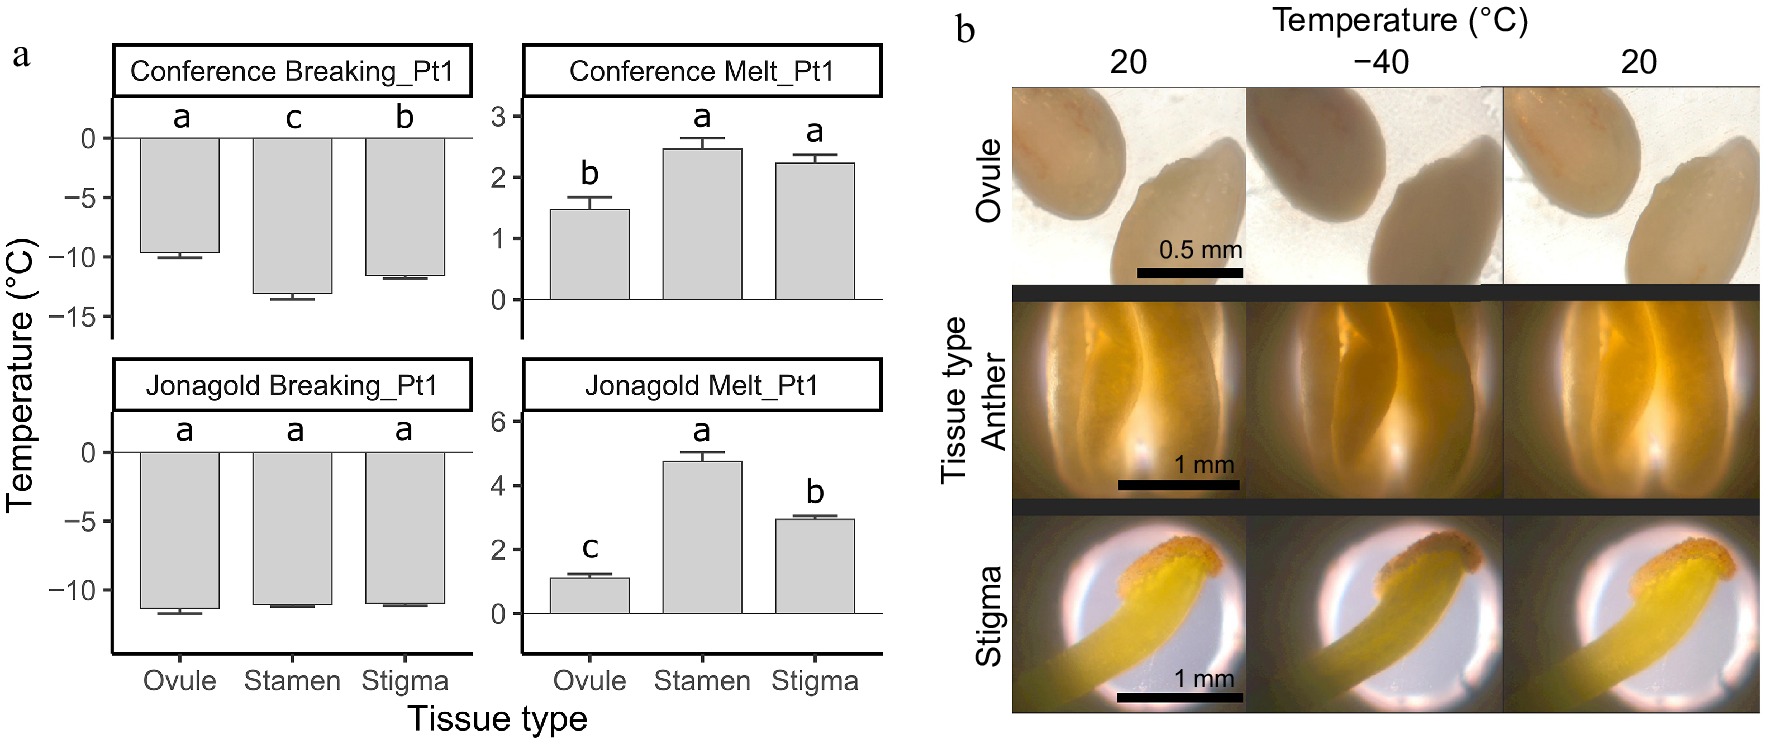
Figure 3.
(a) Pairwise comparison of the freezing (Breaking_Pt1) and thawing (Melt_Pt1) temperatures of different floral organs, as measured via differential scanning calorimetry (DSC) analysis during the first cooling-heating cycle of the pear cultivar 'Conference' and the apple cultivar 'Jonagold' (n ≥ 9; ± SE; Tukey p ≤ 0.05). Significant differences in freezing temperature among tissue types for each species are indicated by different letters. (b) Light microscopy pictures of ovules (top), anthers (middle), and stigmas (bottom) of the apple cultivar 'Jonagold' taken while temperature cycling in the microscopy chamber from 20 to −40 °C (first and second picture of each sample) and after the thawing (last picture of each sample).
Figures
(3)
Tables
(0)