-
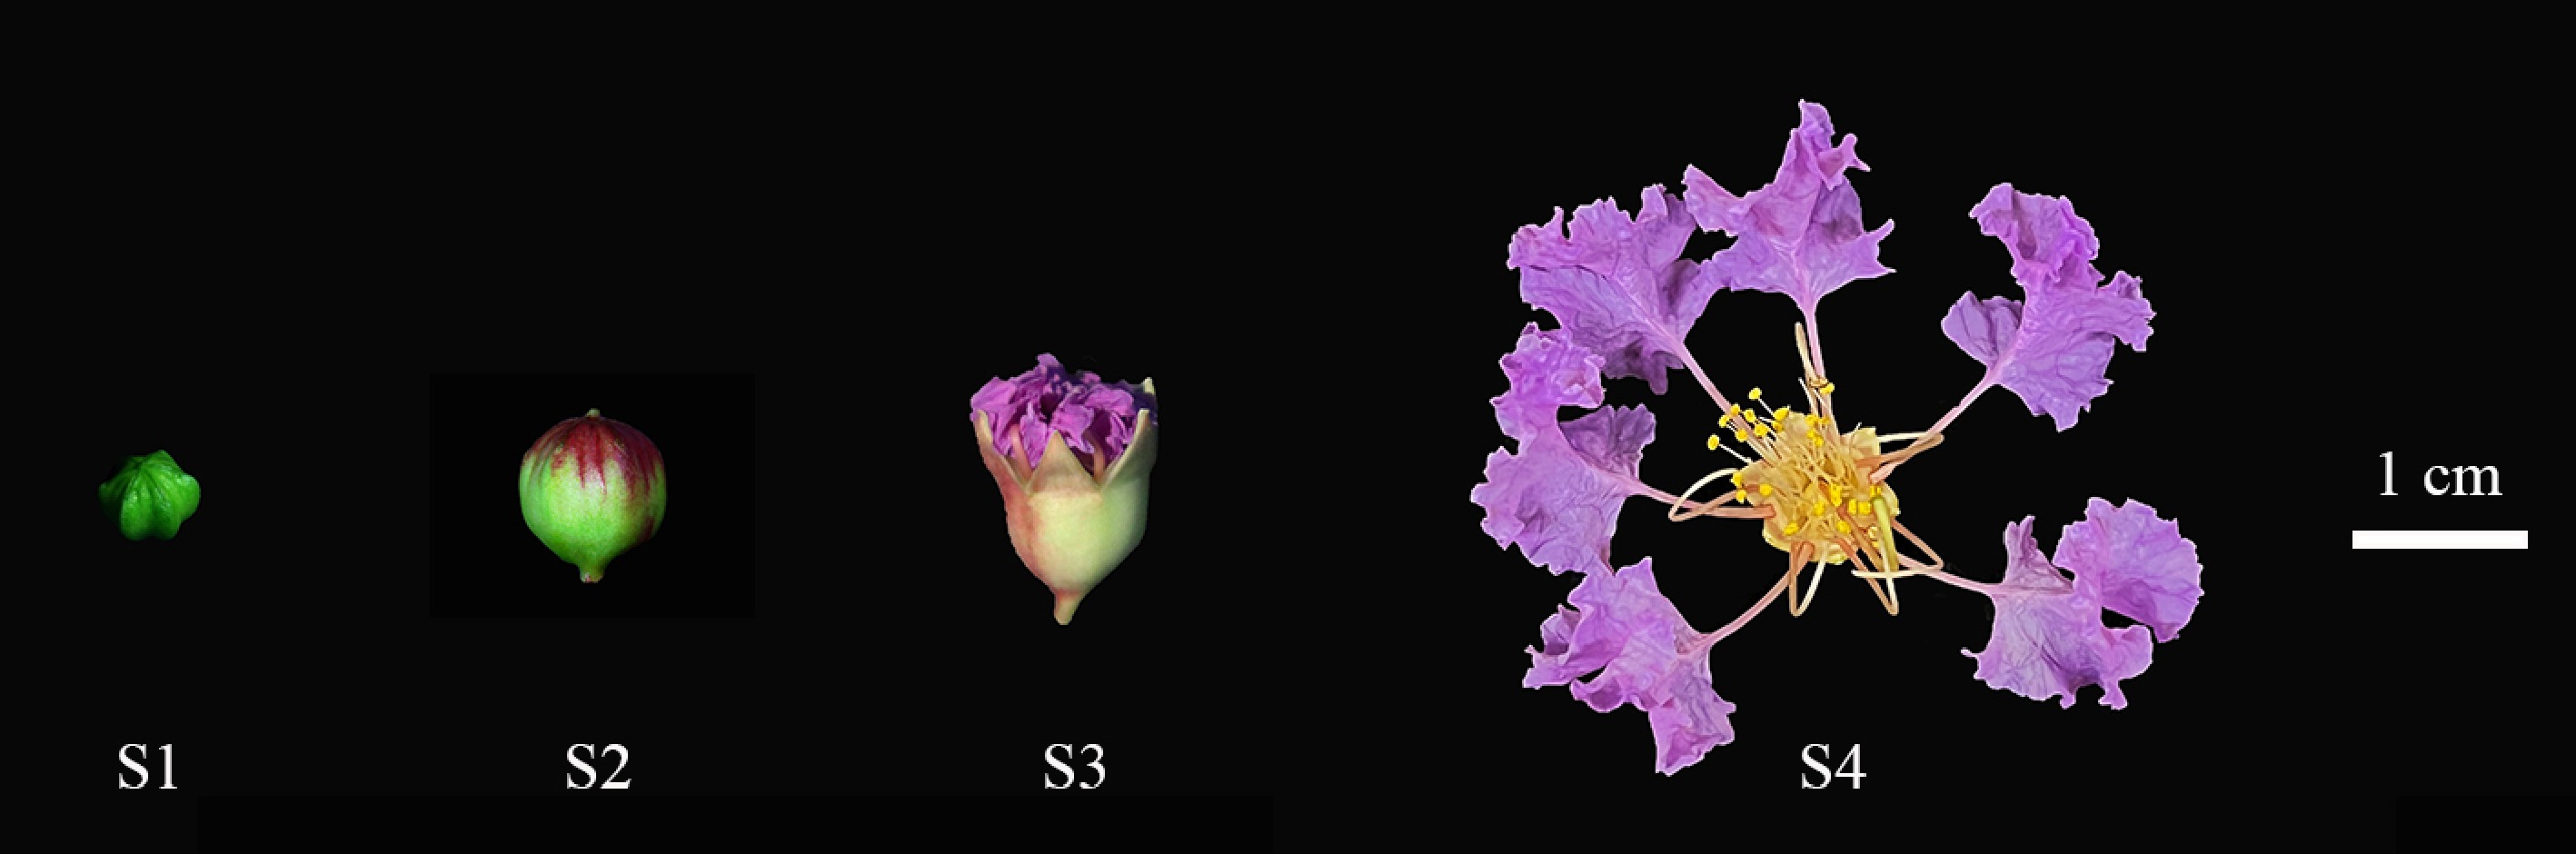
Figure 1.
Four stages of L. indica flower opening. (S1) When the bud is closed and the petals do not show color. (S2) Petals begin to show color. (S3) Petals gradually split, petals and sepals gradually spread, stigma elongated. (S4) Petals and sepals fully extended, anthers tightly closed, stigma green and mucous.
-
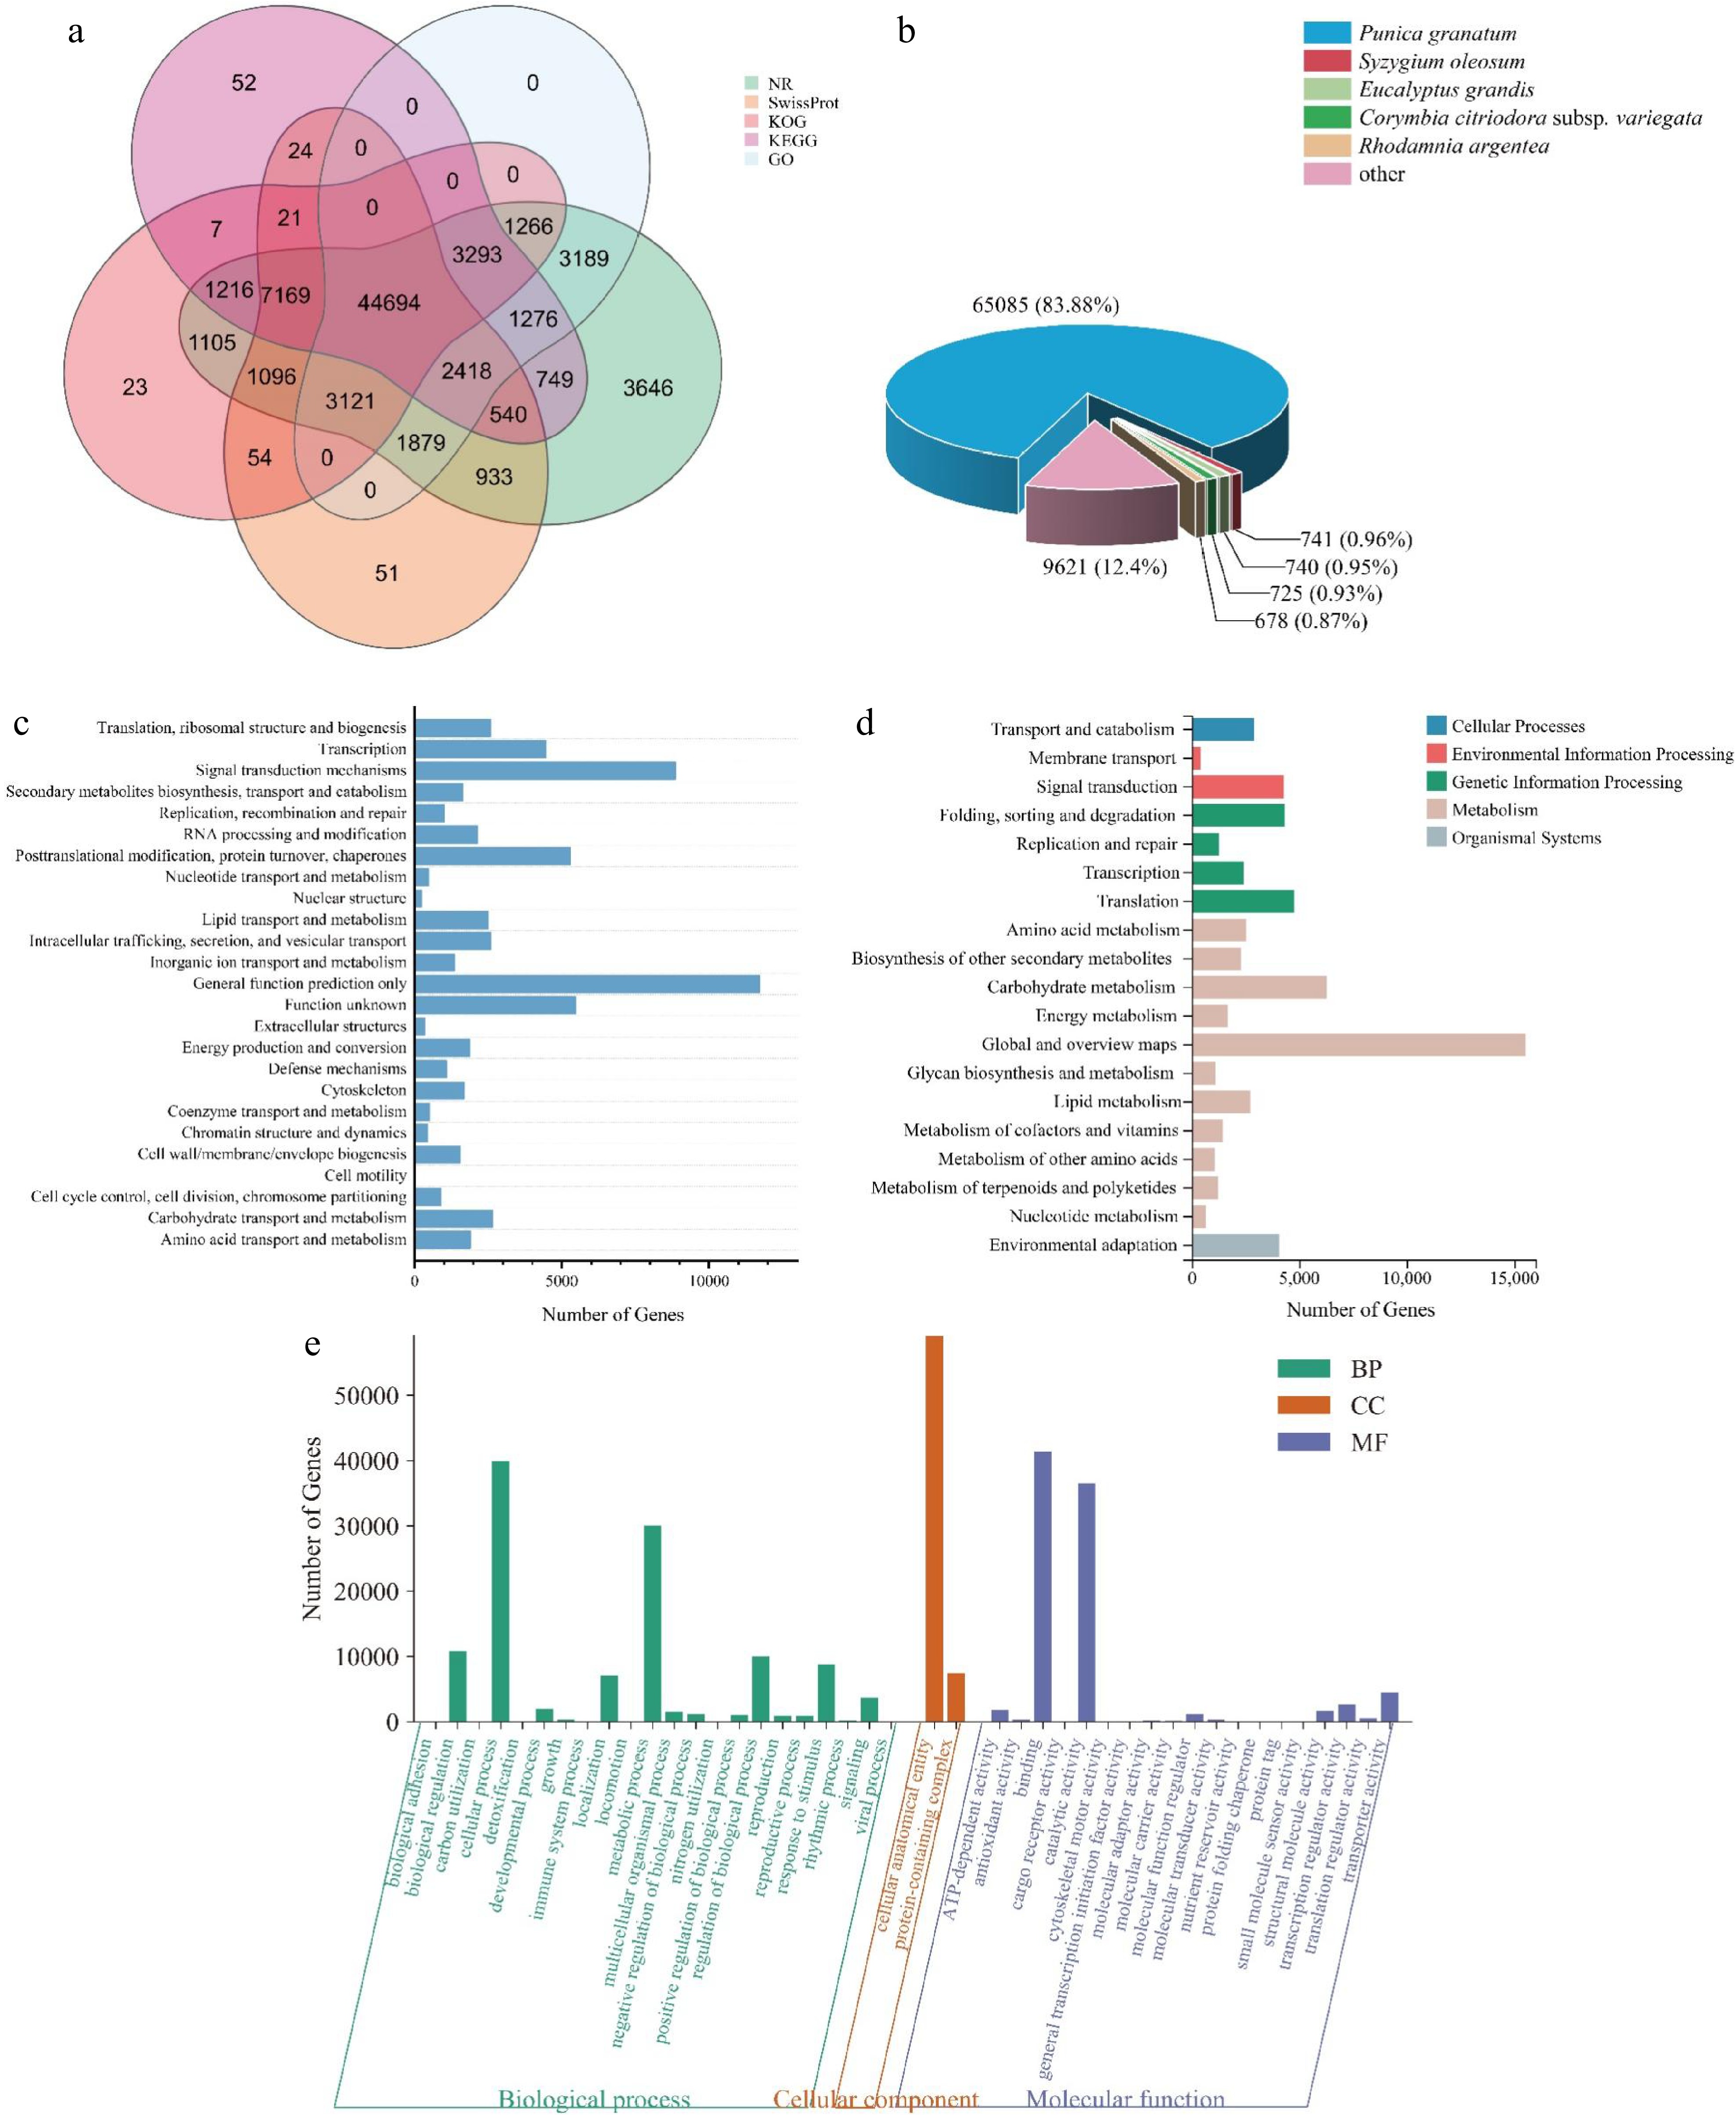
Figure 2.
Gene functional annotation. (a) Venn diagram of the number of unigenes annotated in different public databases. (b) Species distribution of NR annotation. (c) Functional classification of KOG annotation. The x-axis represents the corresponding number of unigenes, the y-axis represents the KOG function classification name. (d) Functional classification and pathway unigenes assembled by KEGG. (e) GO enrichment with three primary classifications of biological process, cellular component, and molecular function.
-
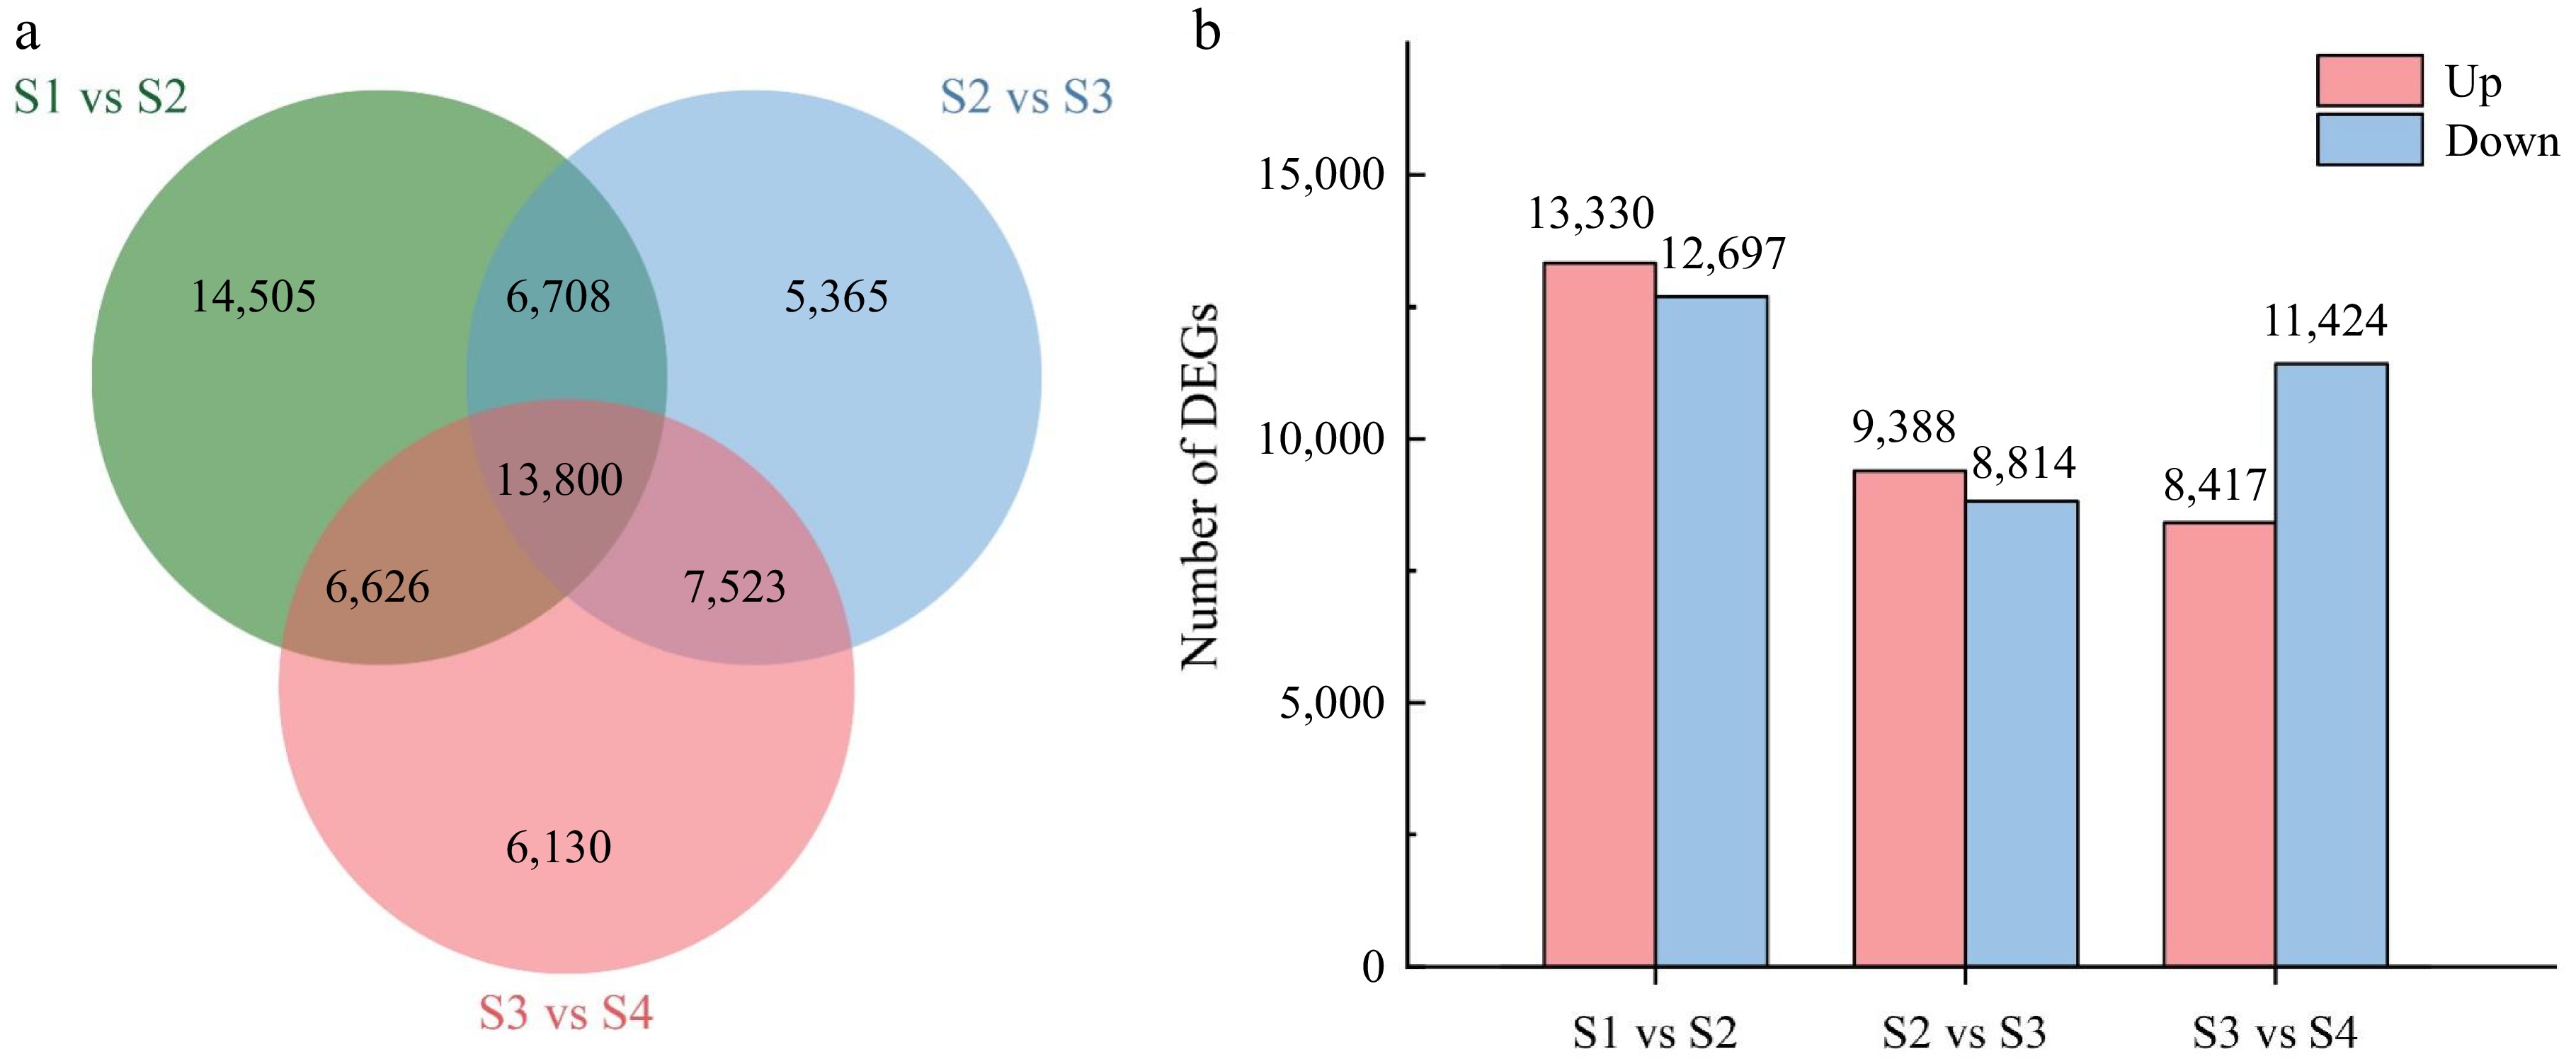
Figure 3.
Comparative analysis of differentially expressed genes (DEGs) between the four stages of flower opening. (a) Venn diagram of the number of DEGs between the stage comparisons. (b) The number of up-regulated and down-regulated DEGs between the three comparisons.
-
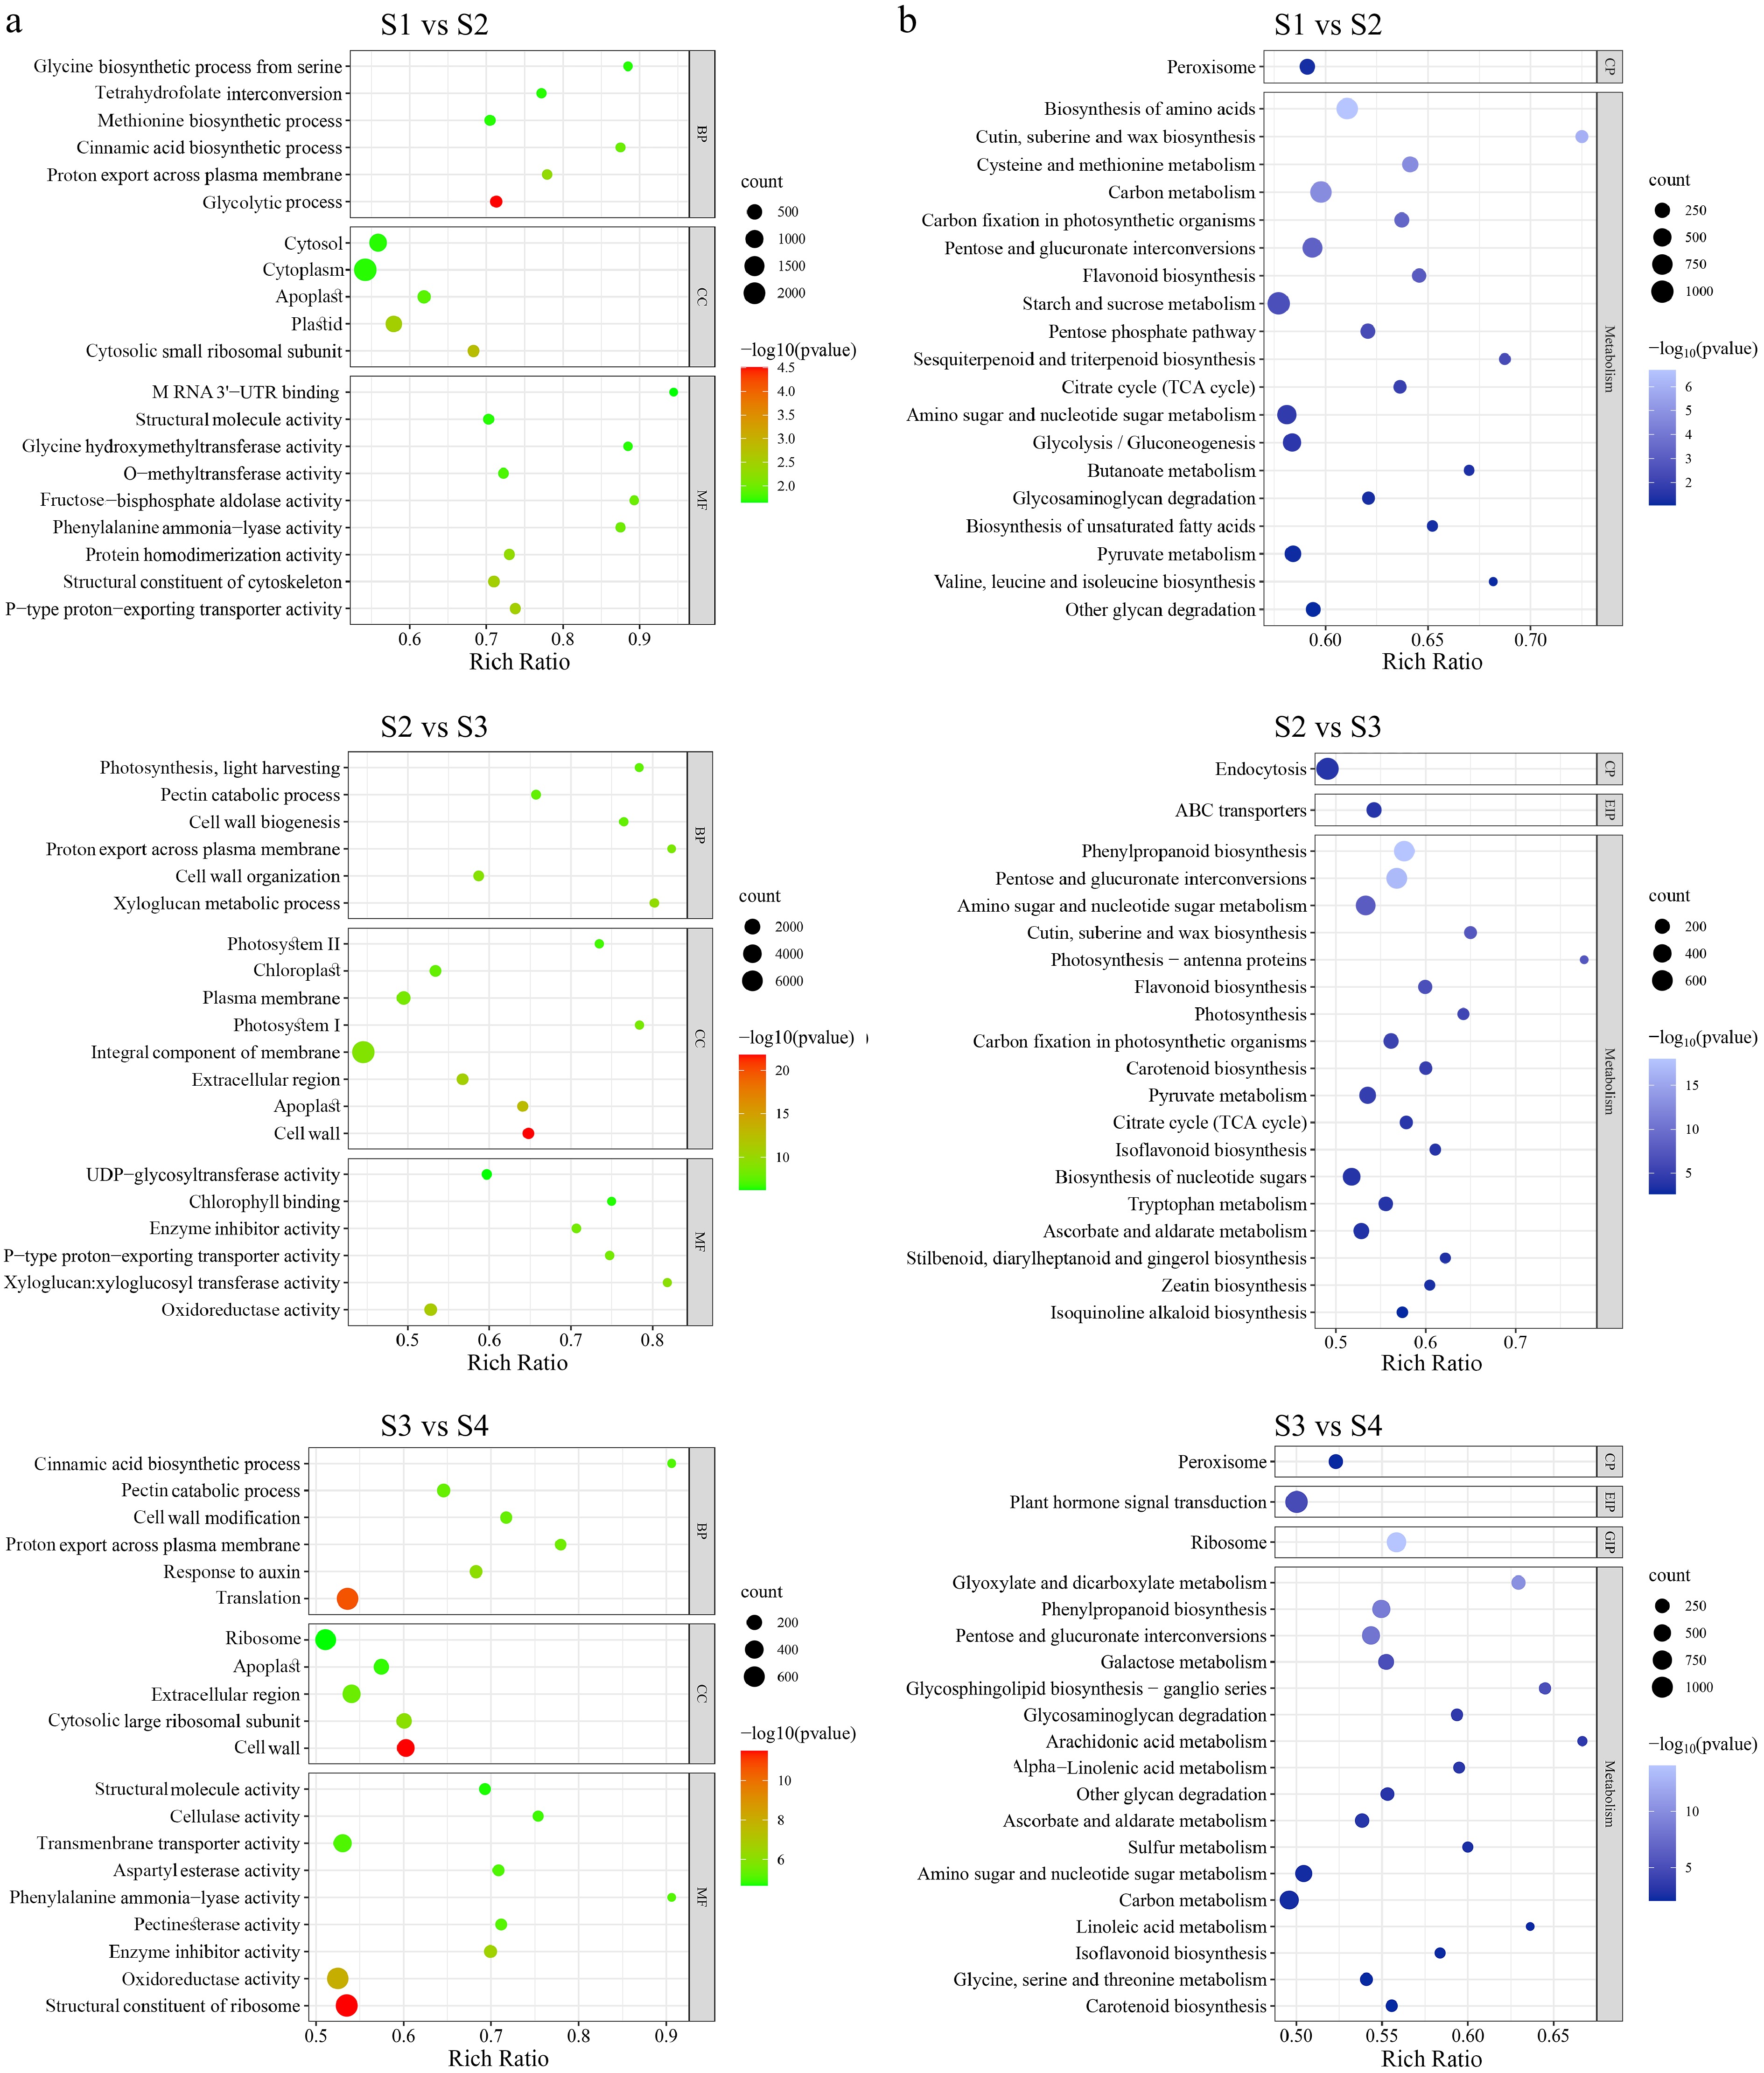
Figure 4.
Enrichment analysis of differentially expressed genes (DEGs) in four stages of flower opening. (a) GO enrichment with DEGs between different flower opening stages. BP, CC, and MC represent biological process, cellular component and molecular function respectively. (b) KEGG pathway enrichment with DEGs between different flower opening stages. CP, EIP, and GIP respectively stand for cellular processes, environmental information processing, and genetic information processing. The number of genes in each category is equal to the dot size. The color of the dot represents the p-value.
-
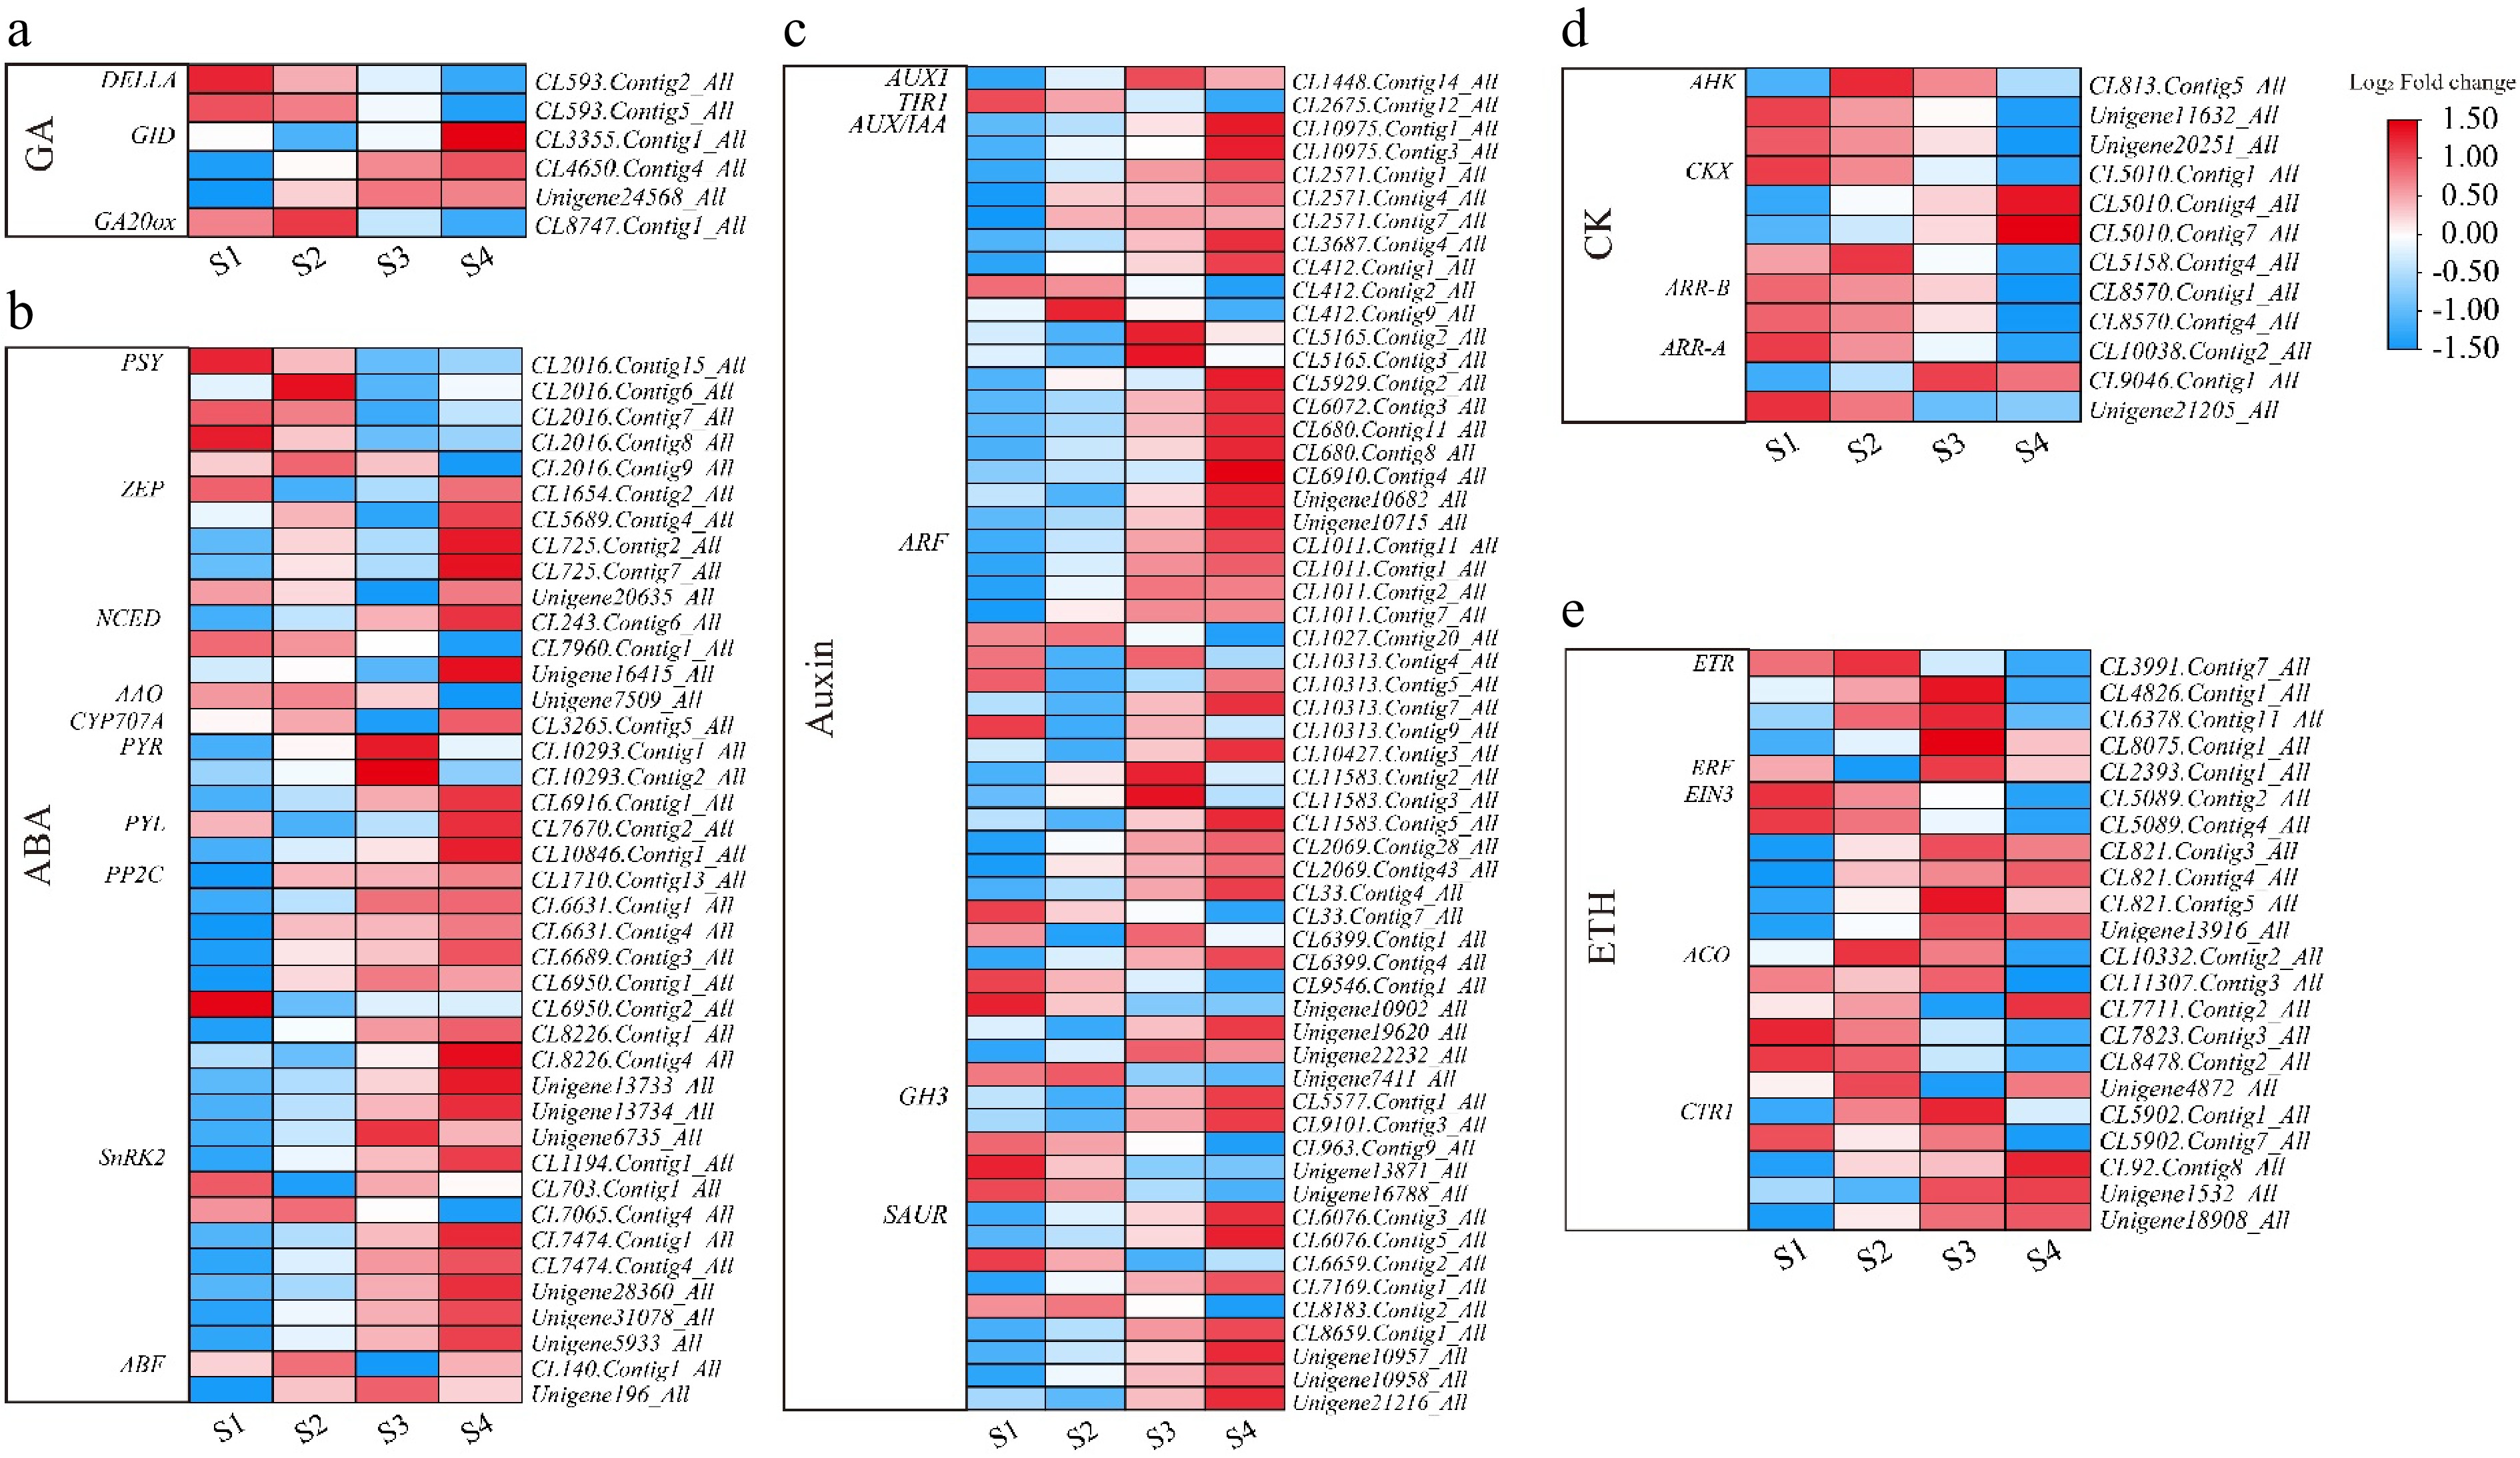
Figure 5.
Heatmap of plant hormone-related genes during flowering of L. indica. Heatmap of major genes involved in the biosynthesis and signaling pathways of (a) gibberellic acid, (b) abscisic acid, (c) auxin, (d) cytokinin, and (e) ethylene. After homogenization, the value of expression appears in the heatmap, with red representing high expression and blue representing low expression.
-
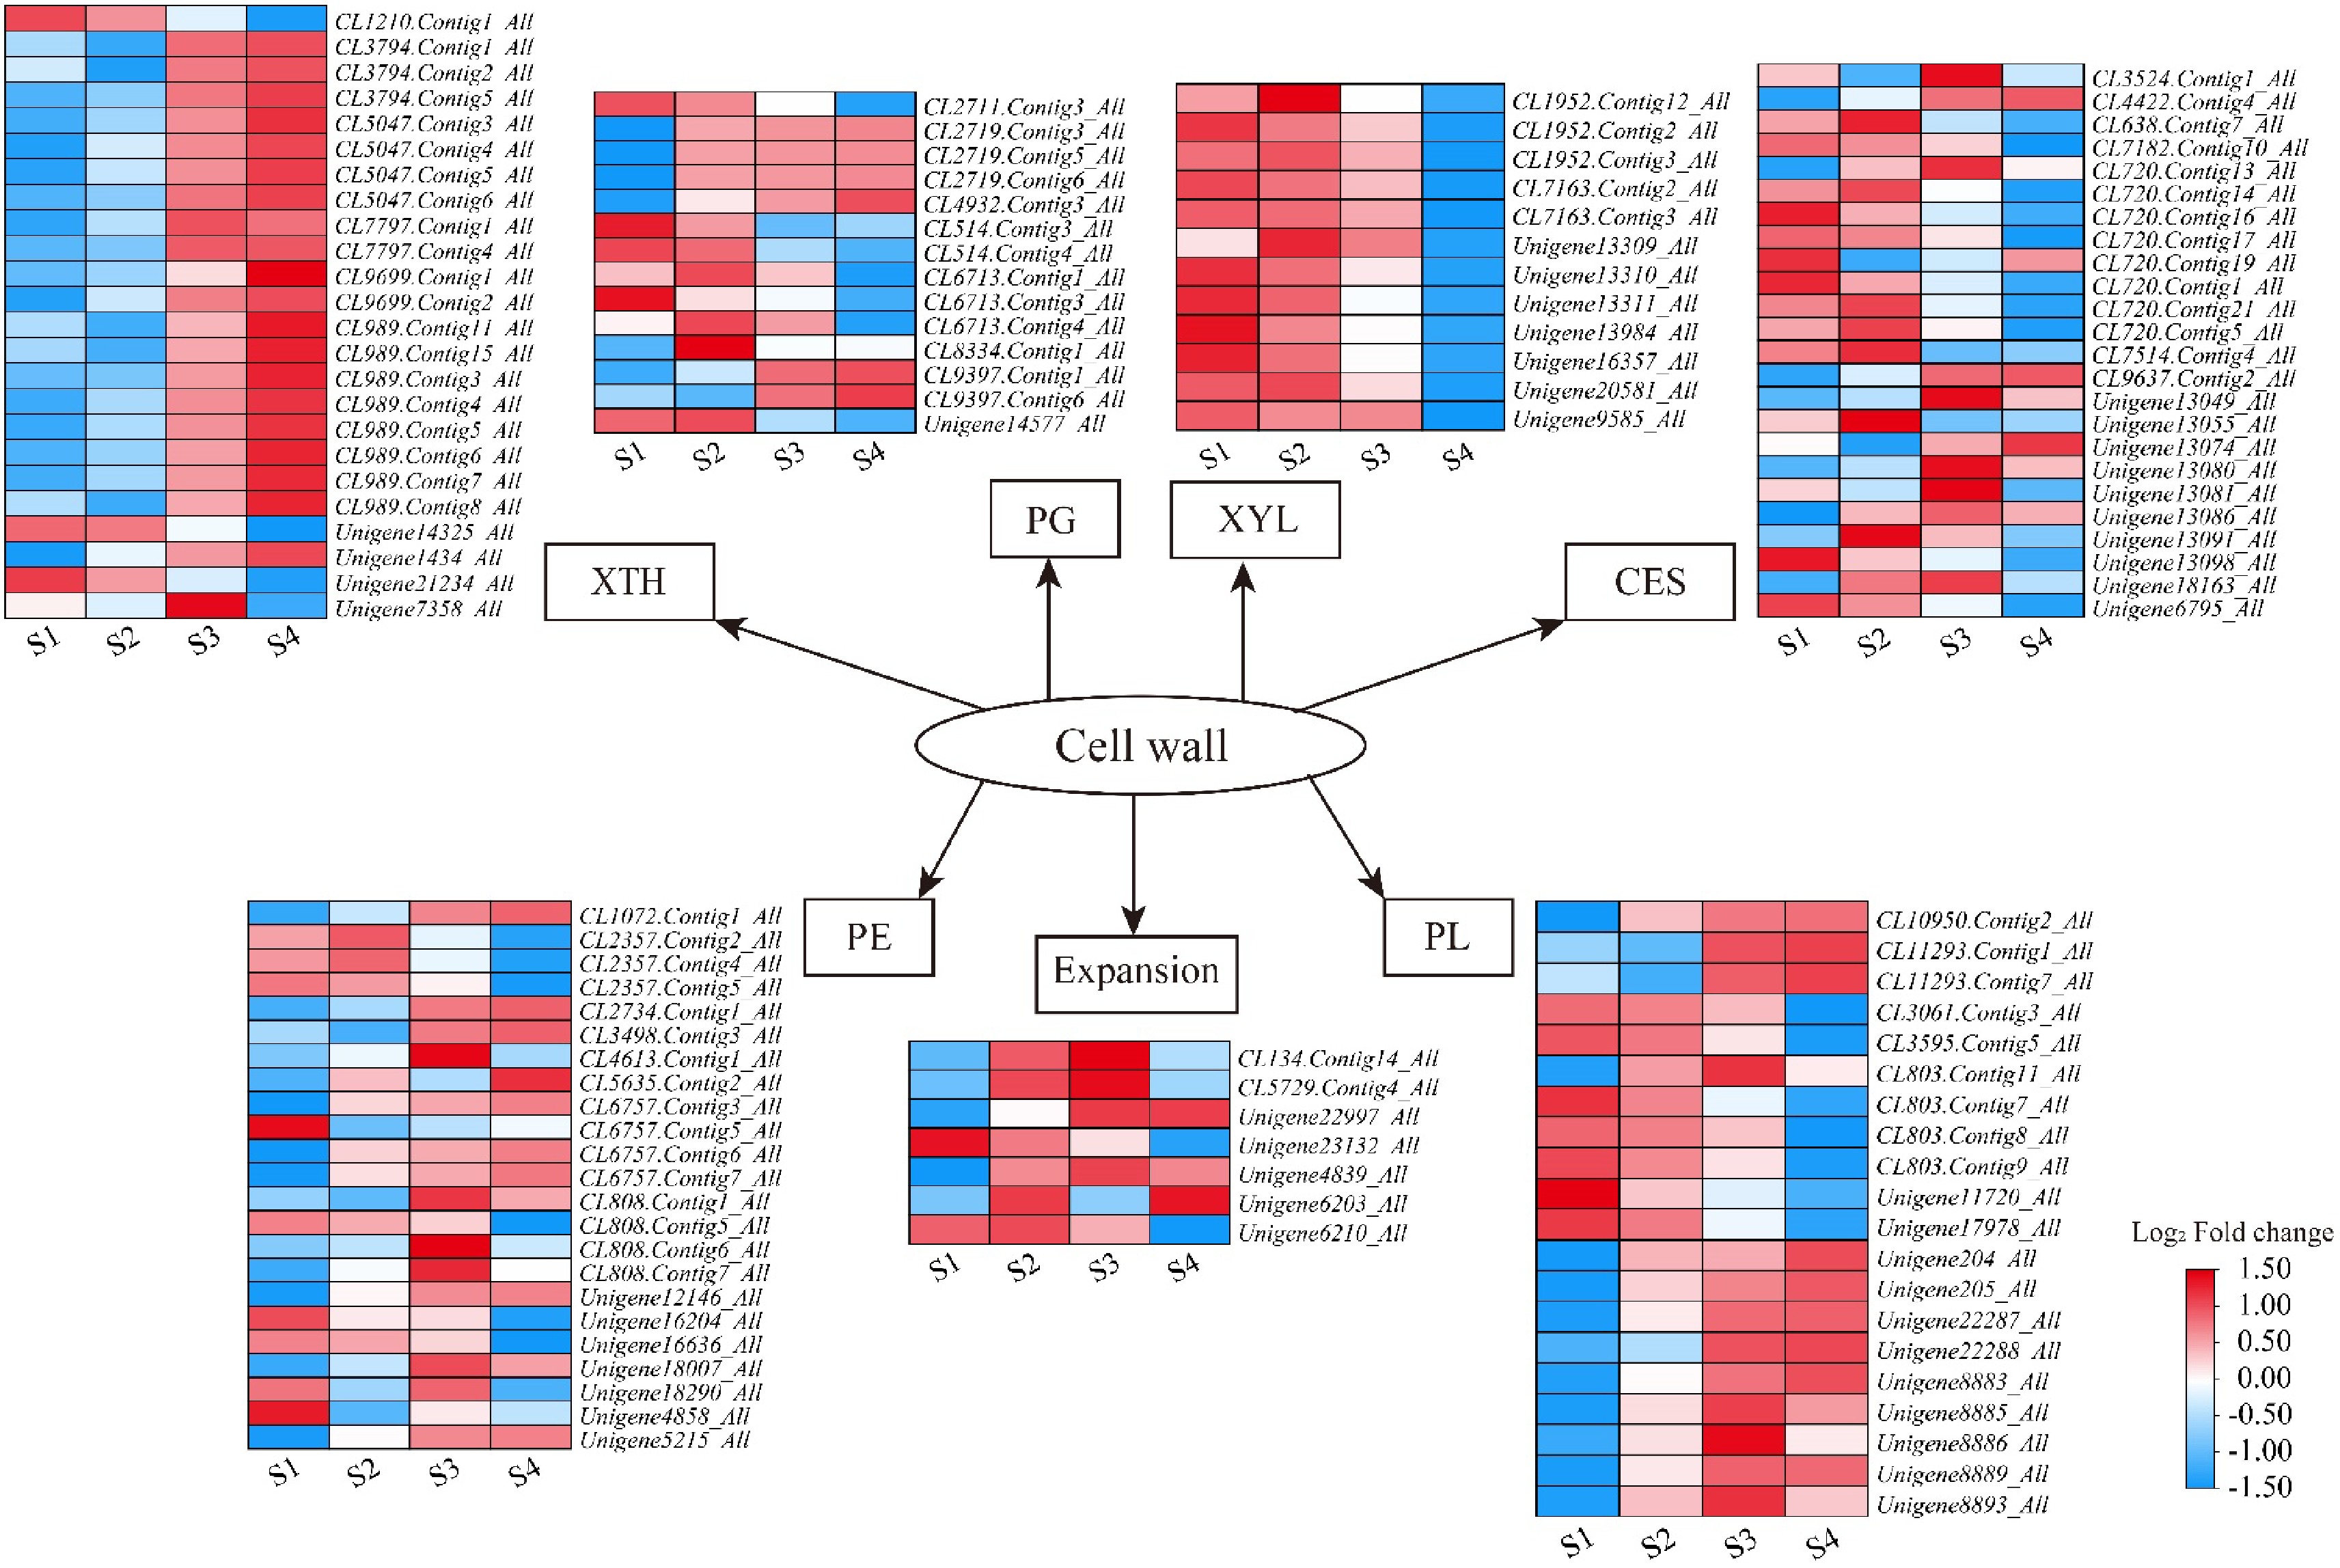
Figure 6.
Heatmaps of petal expansion-related genes in L. indica during flower opening. XTH: xyloglucan endotransglucosylase/hydrolase; PG: polygalacturonase; XYL: xylosidase; CES: cellulose synthase; PE: pectinesterase; PL: pectate lyase. After homogenization, the value of expression appears in the heatmap, with red representing high expression and blue representing low expression.
-
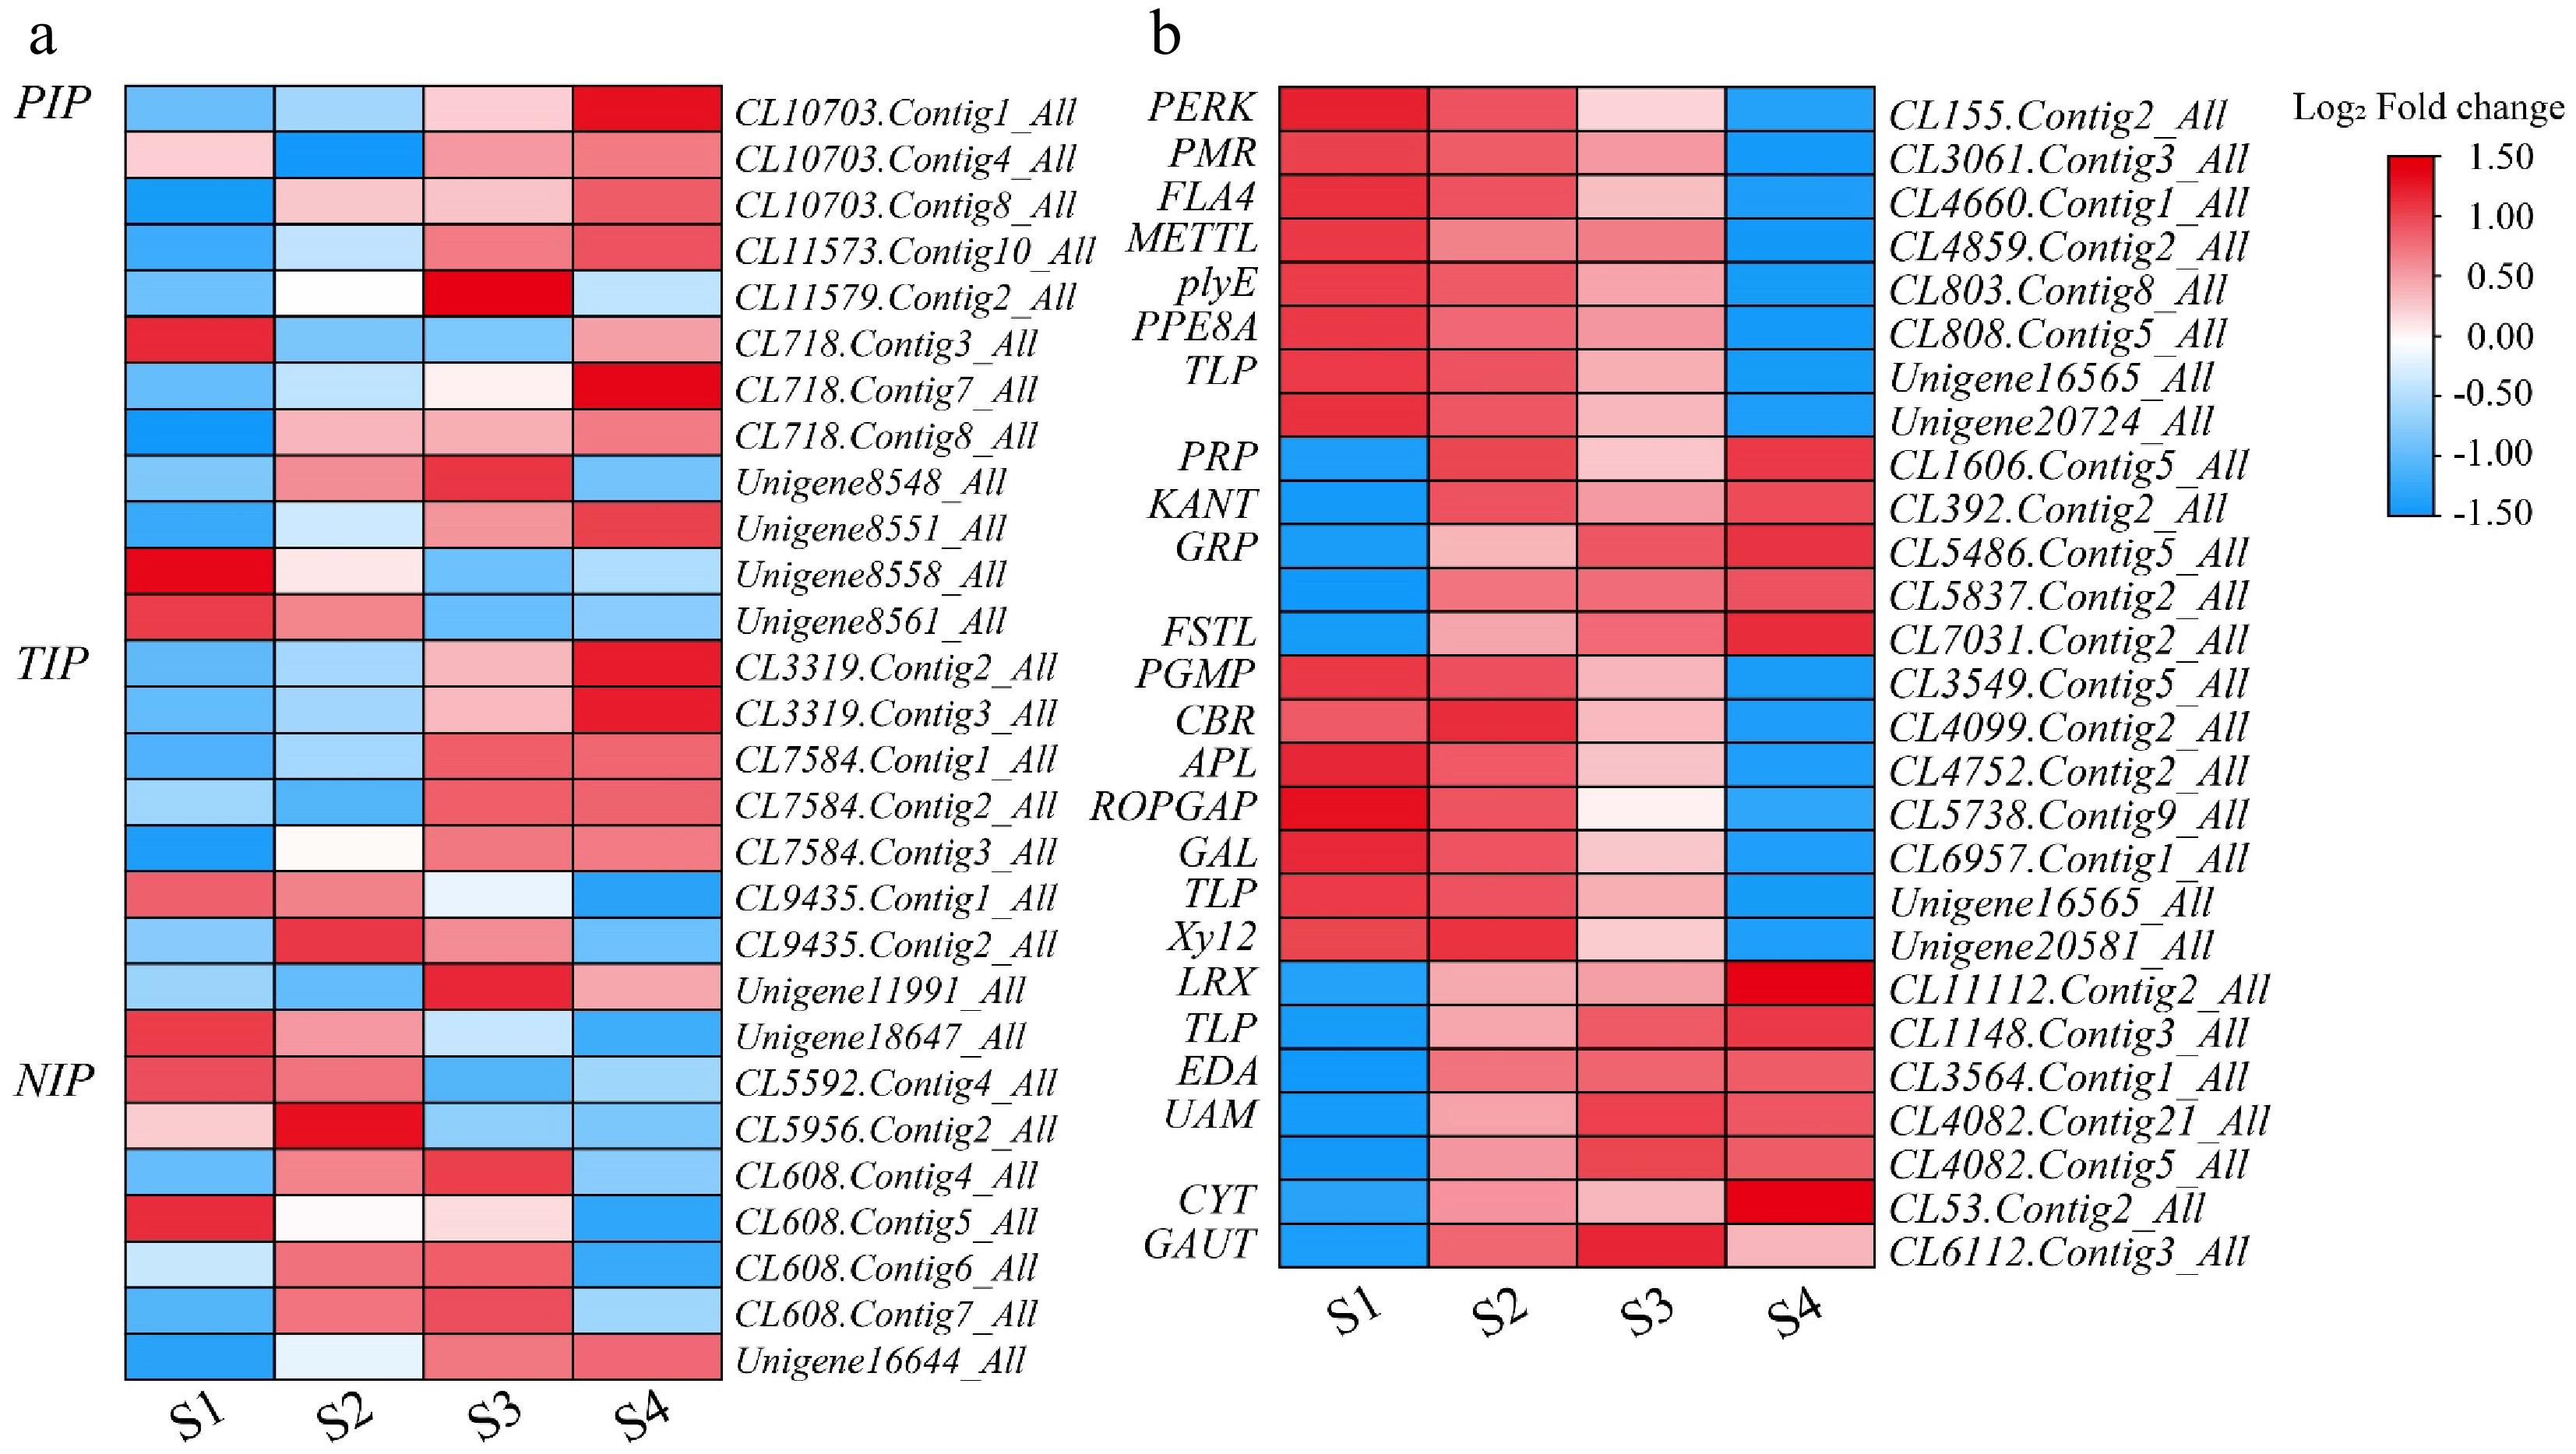
Figure 7.
Heatmap of genes related to water and carbohydrate during flower opening in L. indica. Heatmaps of major genes involved in (a) water and (b) carbohydrates After homogenization, the value of expression appears in the heatmap, with red representing high expression and blue representing low expression.
-
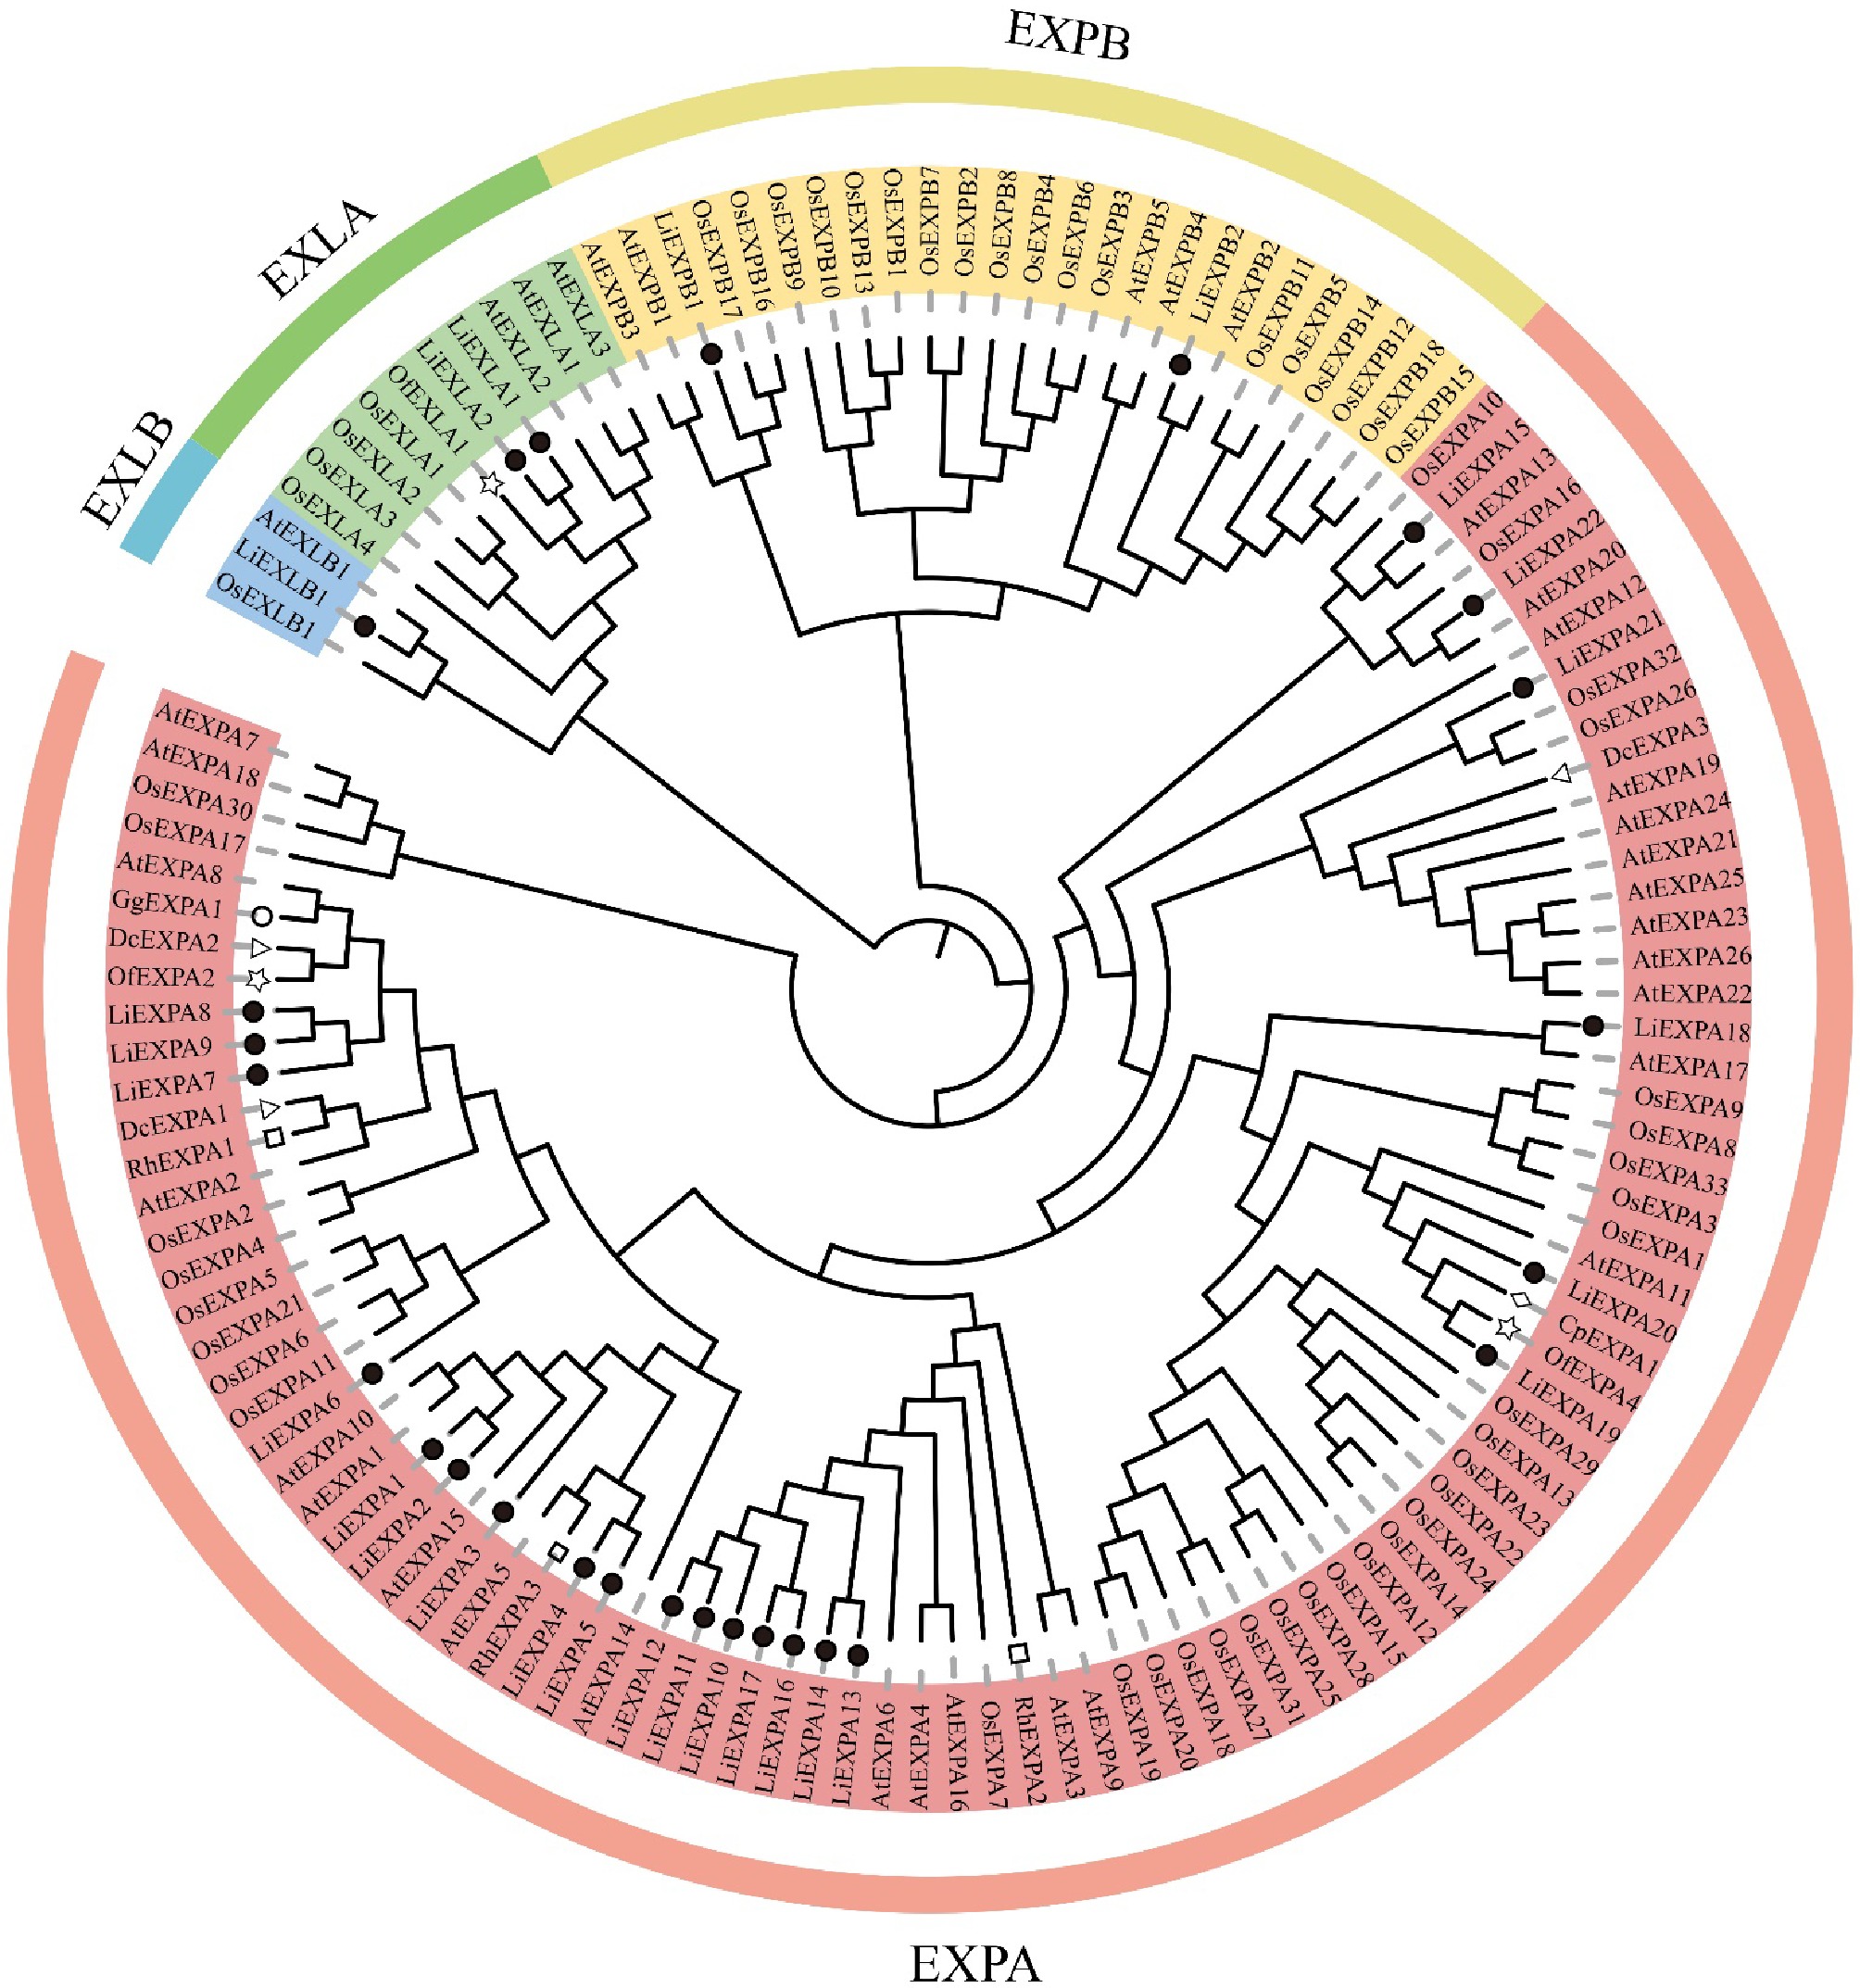
Figure 8.
Plant expansin phylogenetic tree. Each subgroup is distinguished by a different color. At: A. thaliana; Os: O. sativa; Nt: N. tabacum; Li: L. indica; Of: O. fragrans; Rh: R. hybrida; Dc: D. caryophyllus; Gg: G. grandifloras; Cp: C. praecox.
-
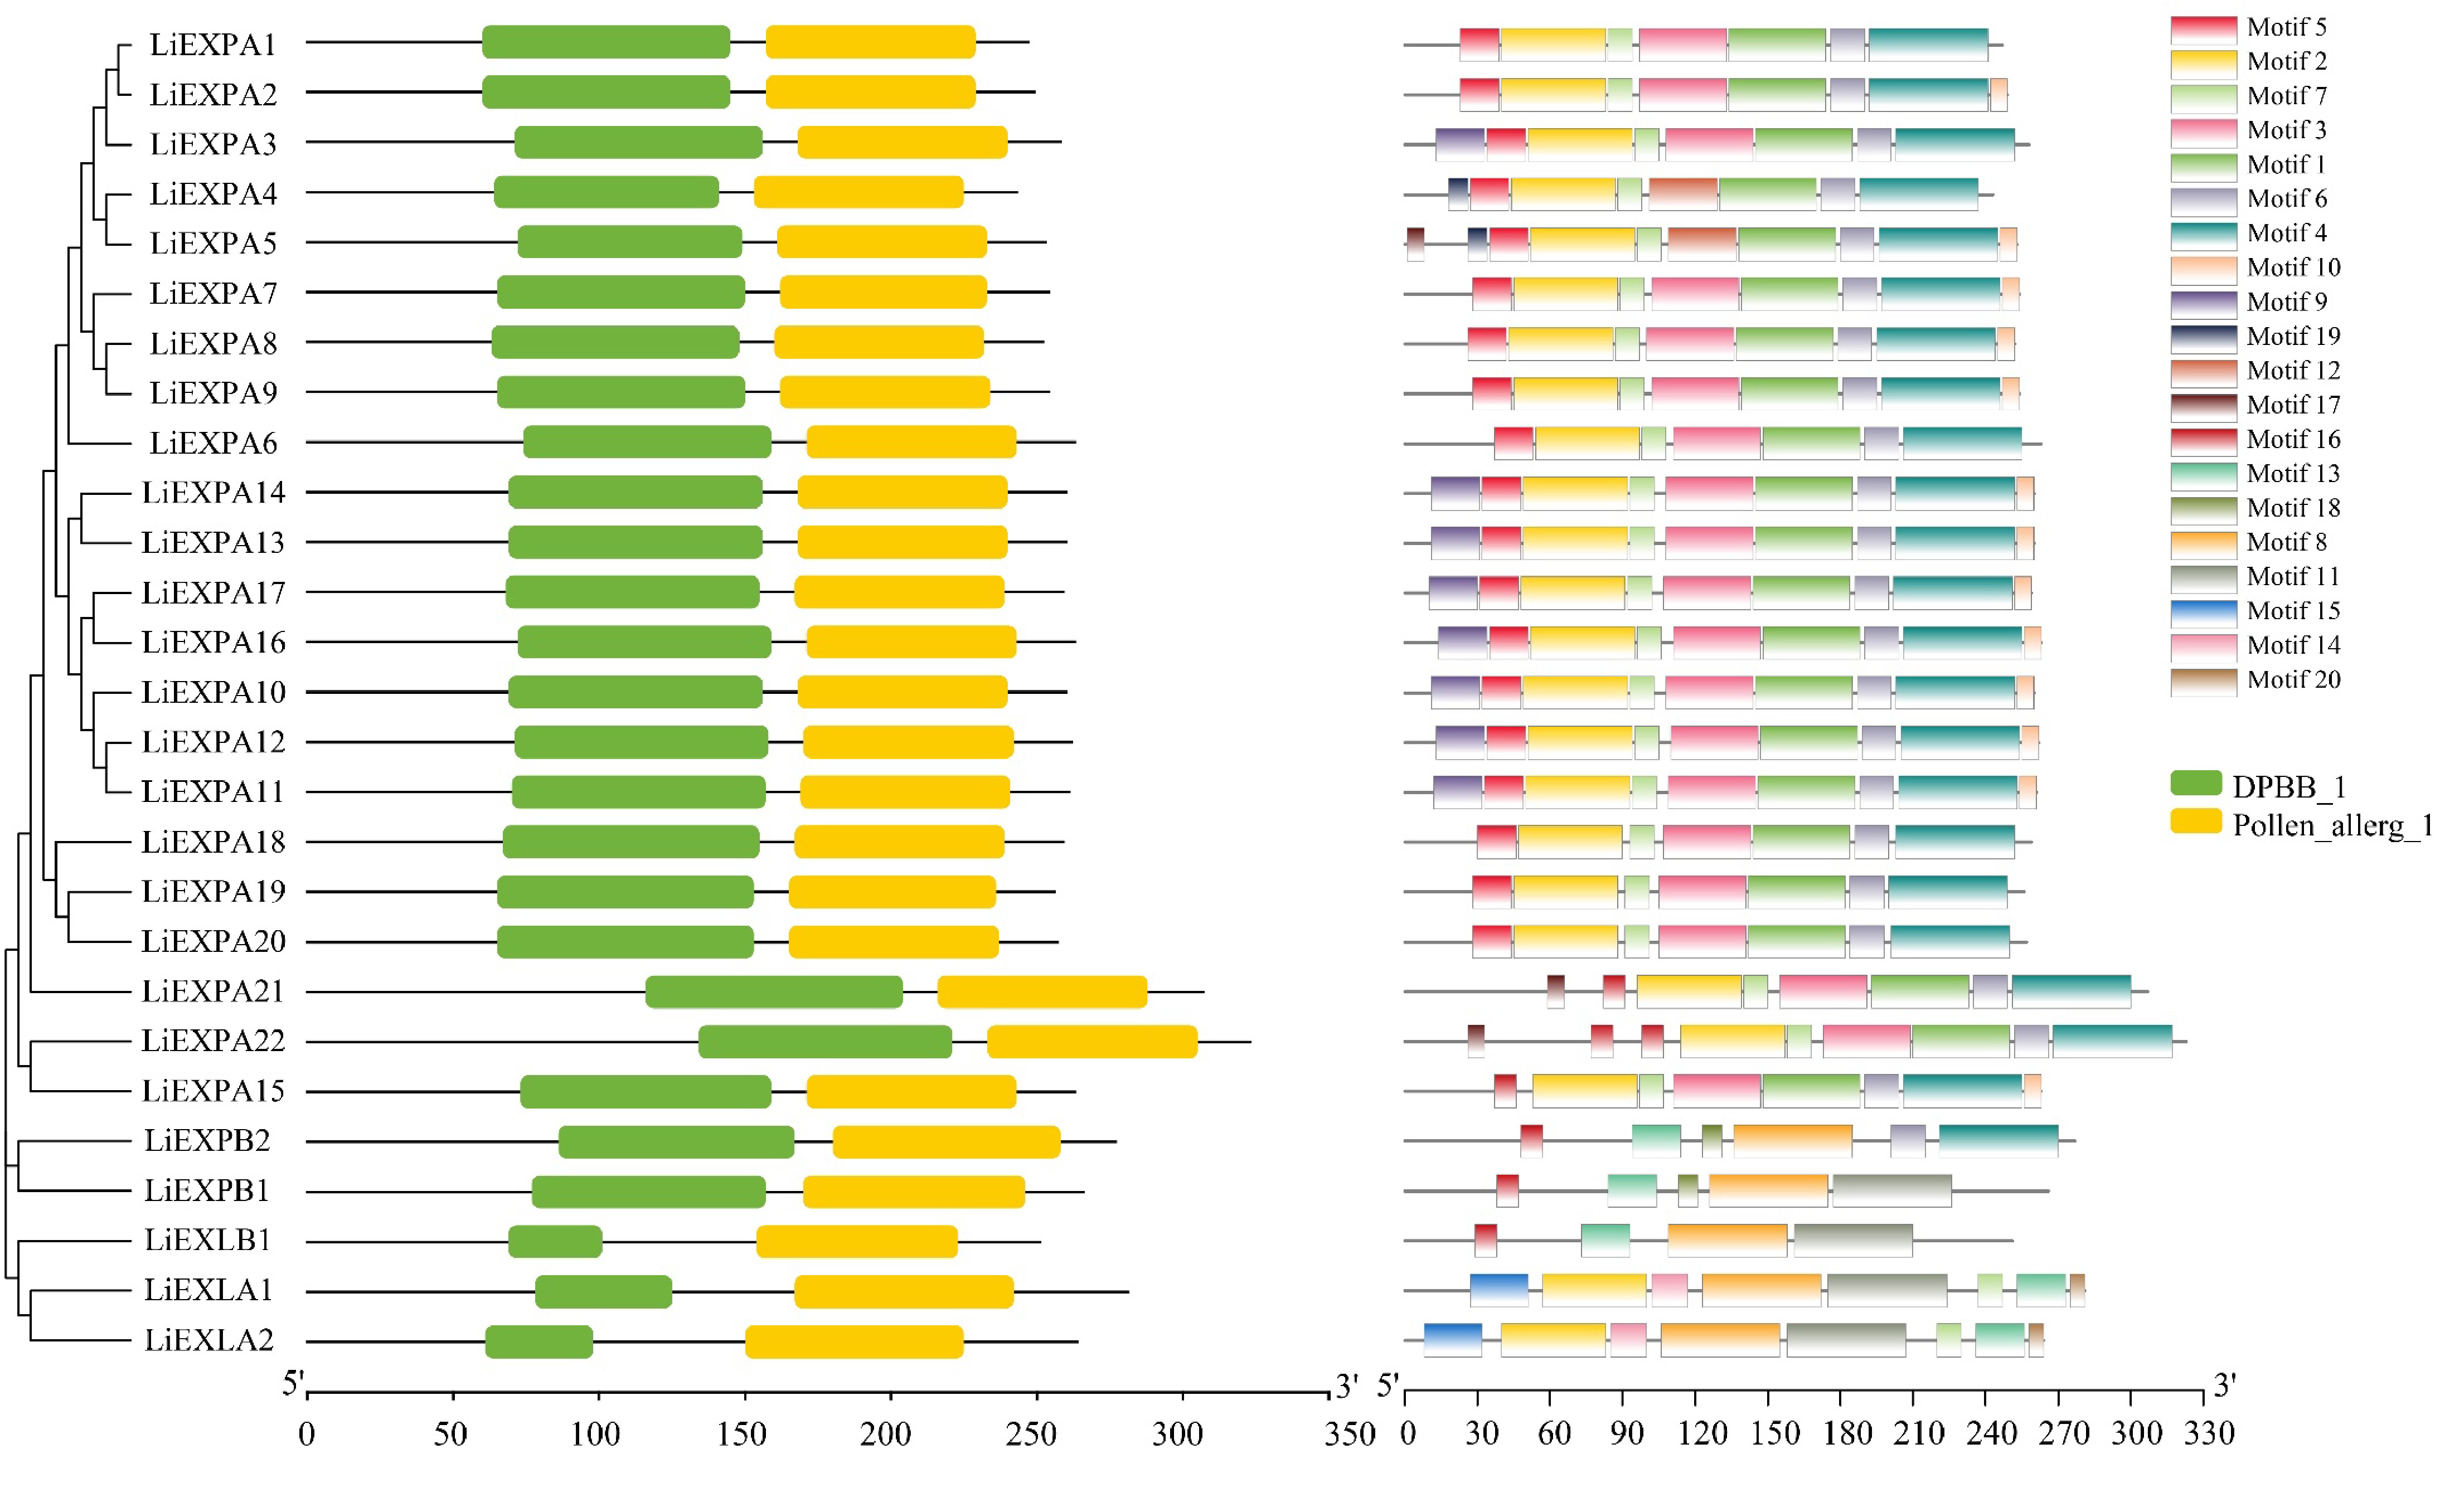
Figure 9.
Analysis of the (a) evolutionary tree, (b) protein motif structure, and (c) domain of the LiEXPs gene family. Different colored modules represent different domains or motifs.
-
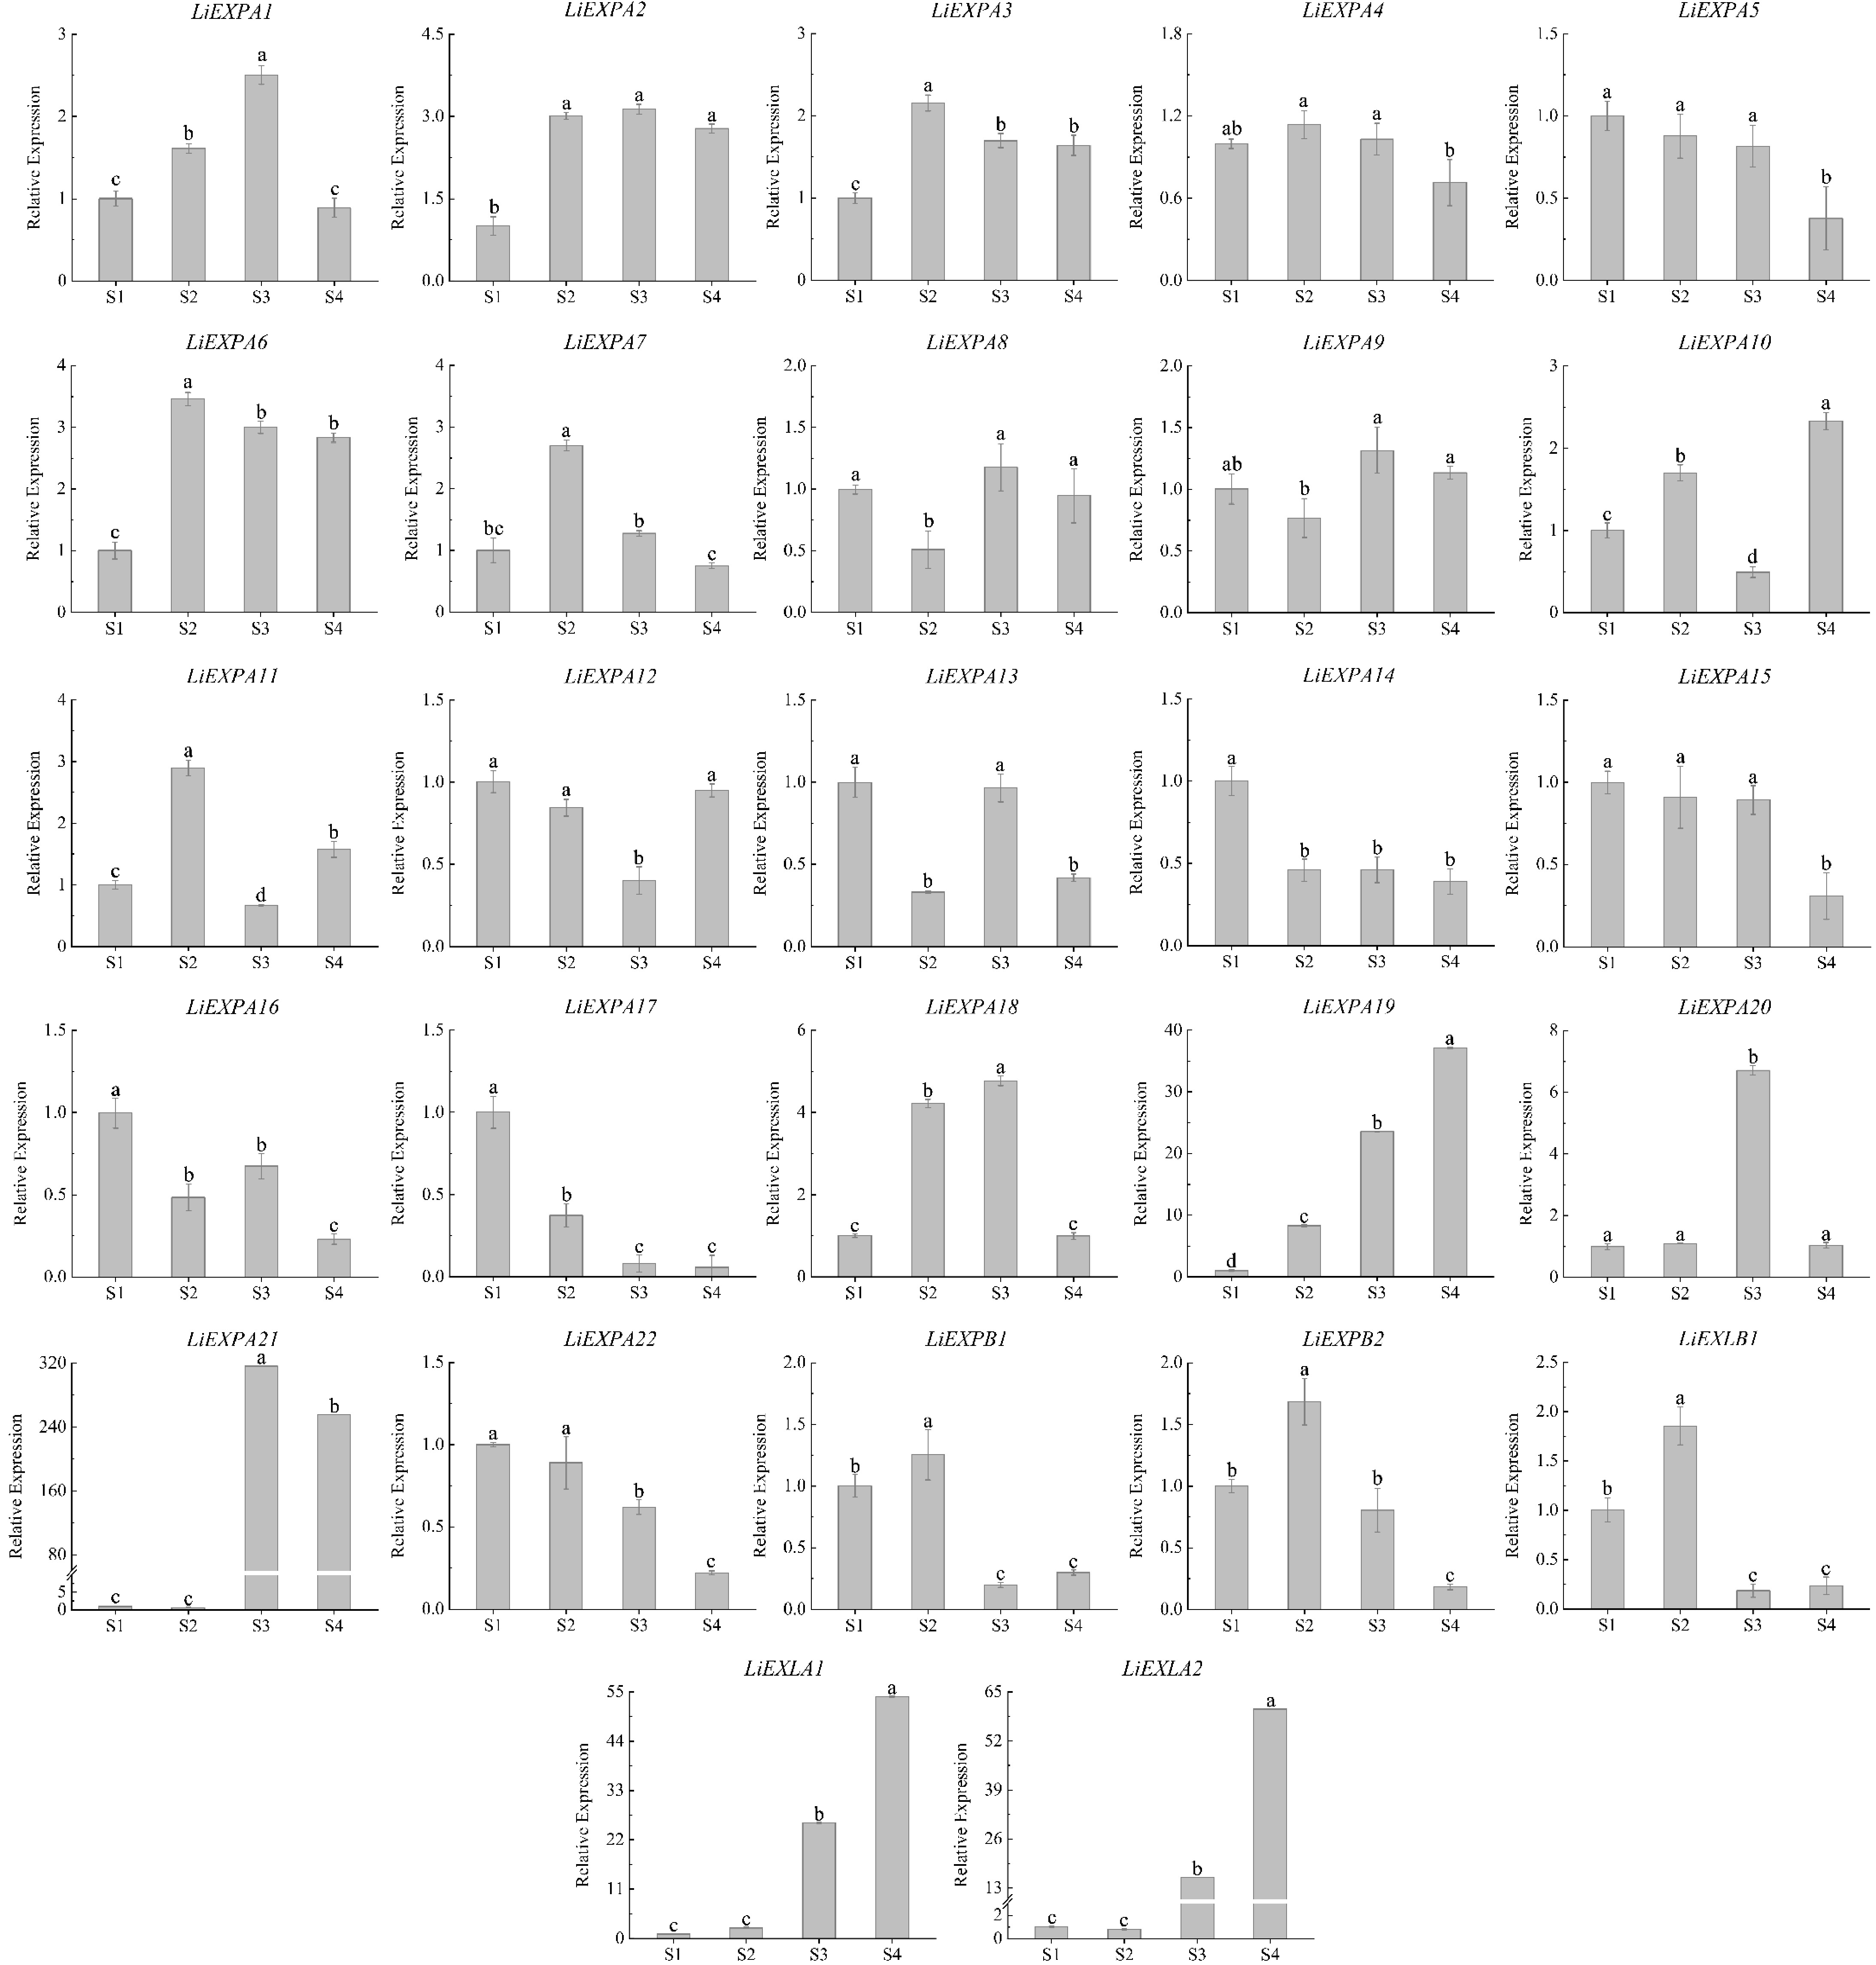
Figure 10.
Expression analysis of LiEXP gene family during flower opening. Significant differences are using ANOVA and Duncan's test (p < 0.05) and are represented by different letters above the error bars.
-
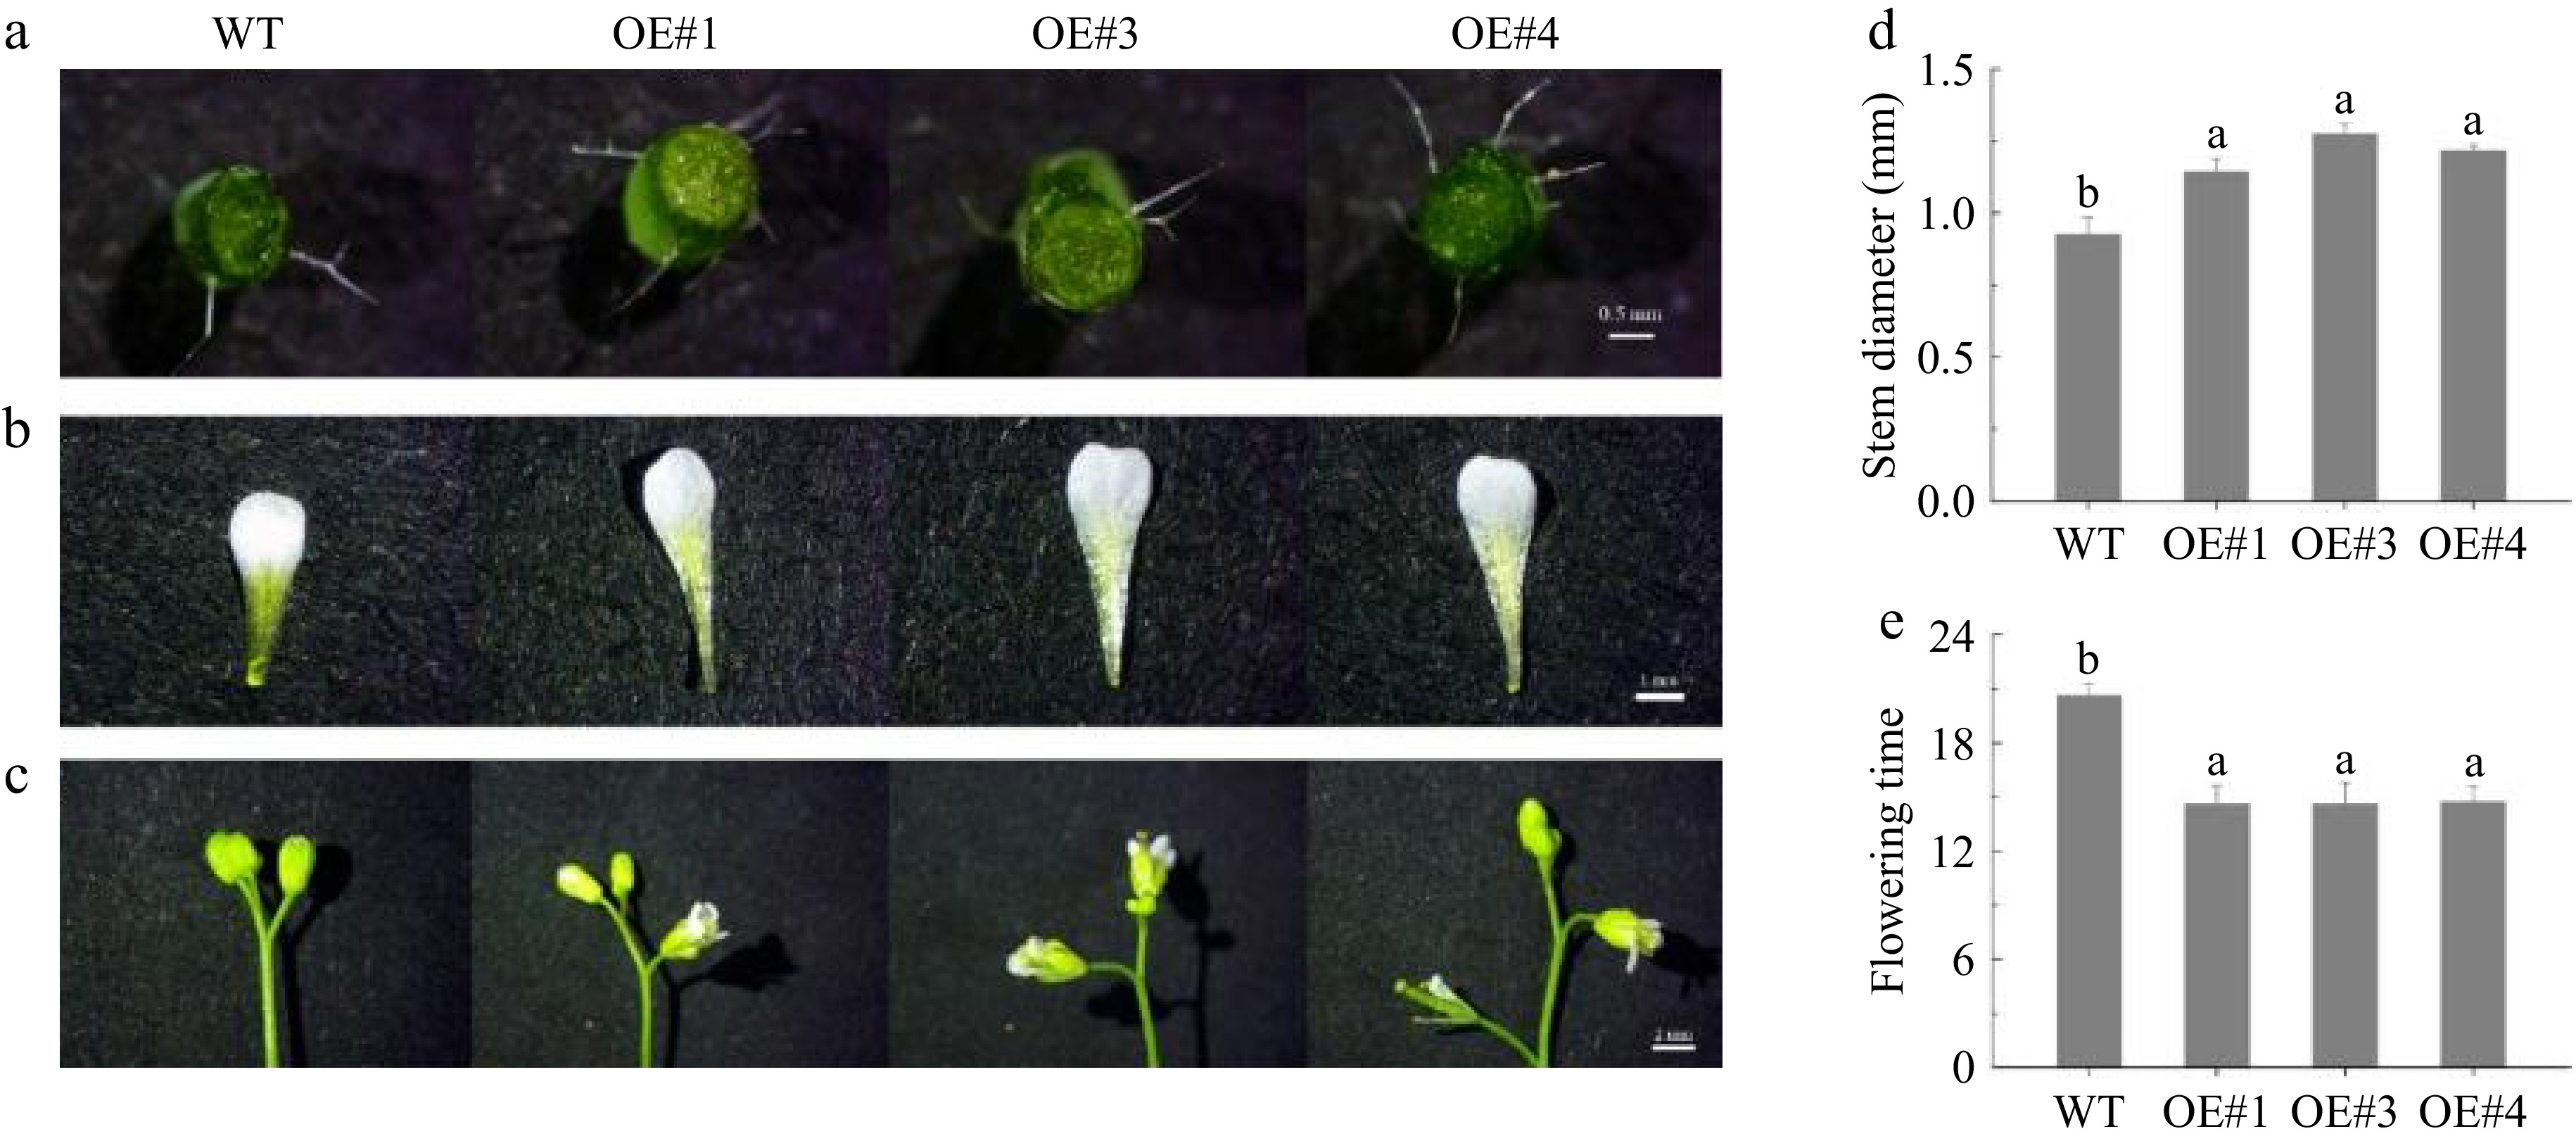
Figure 11.
Wild-type and transgenic LiEXLA1 A. thaliana growth 45 d.
-
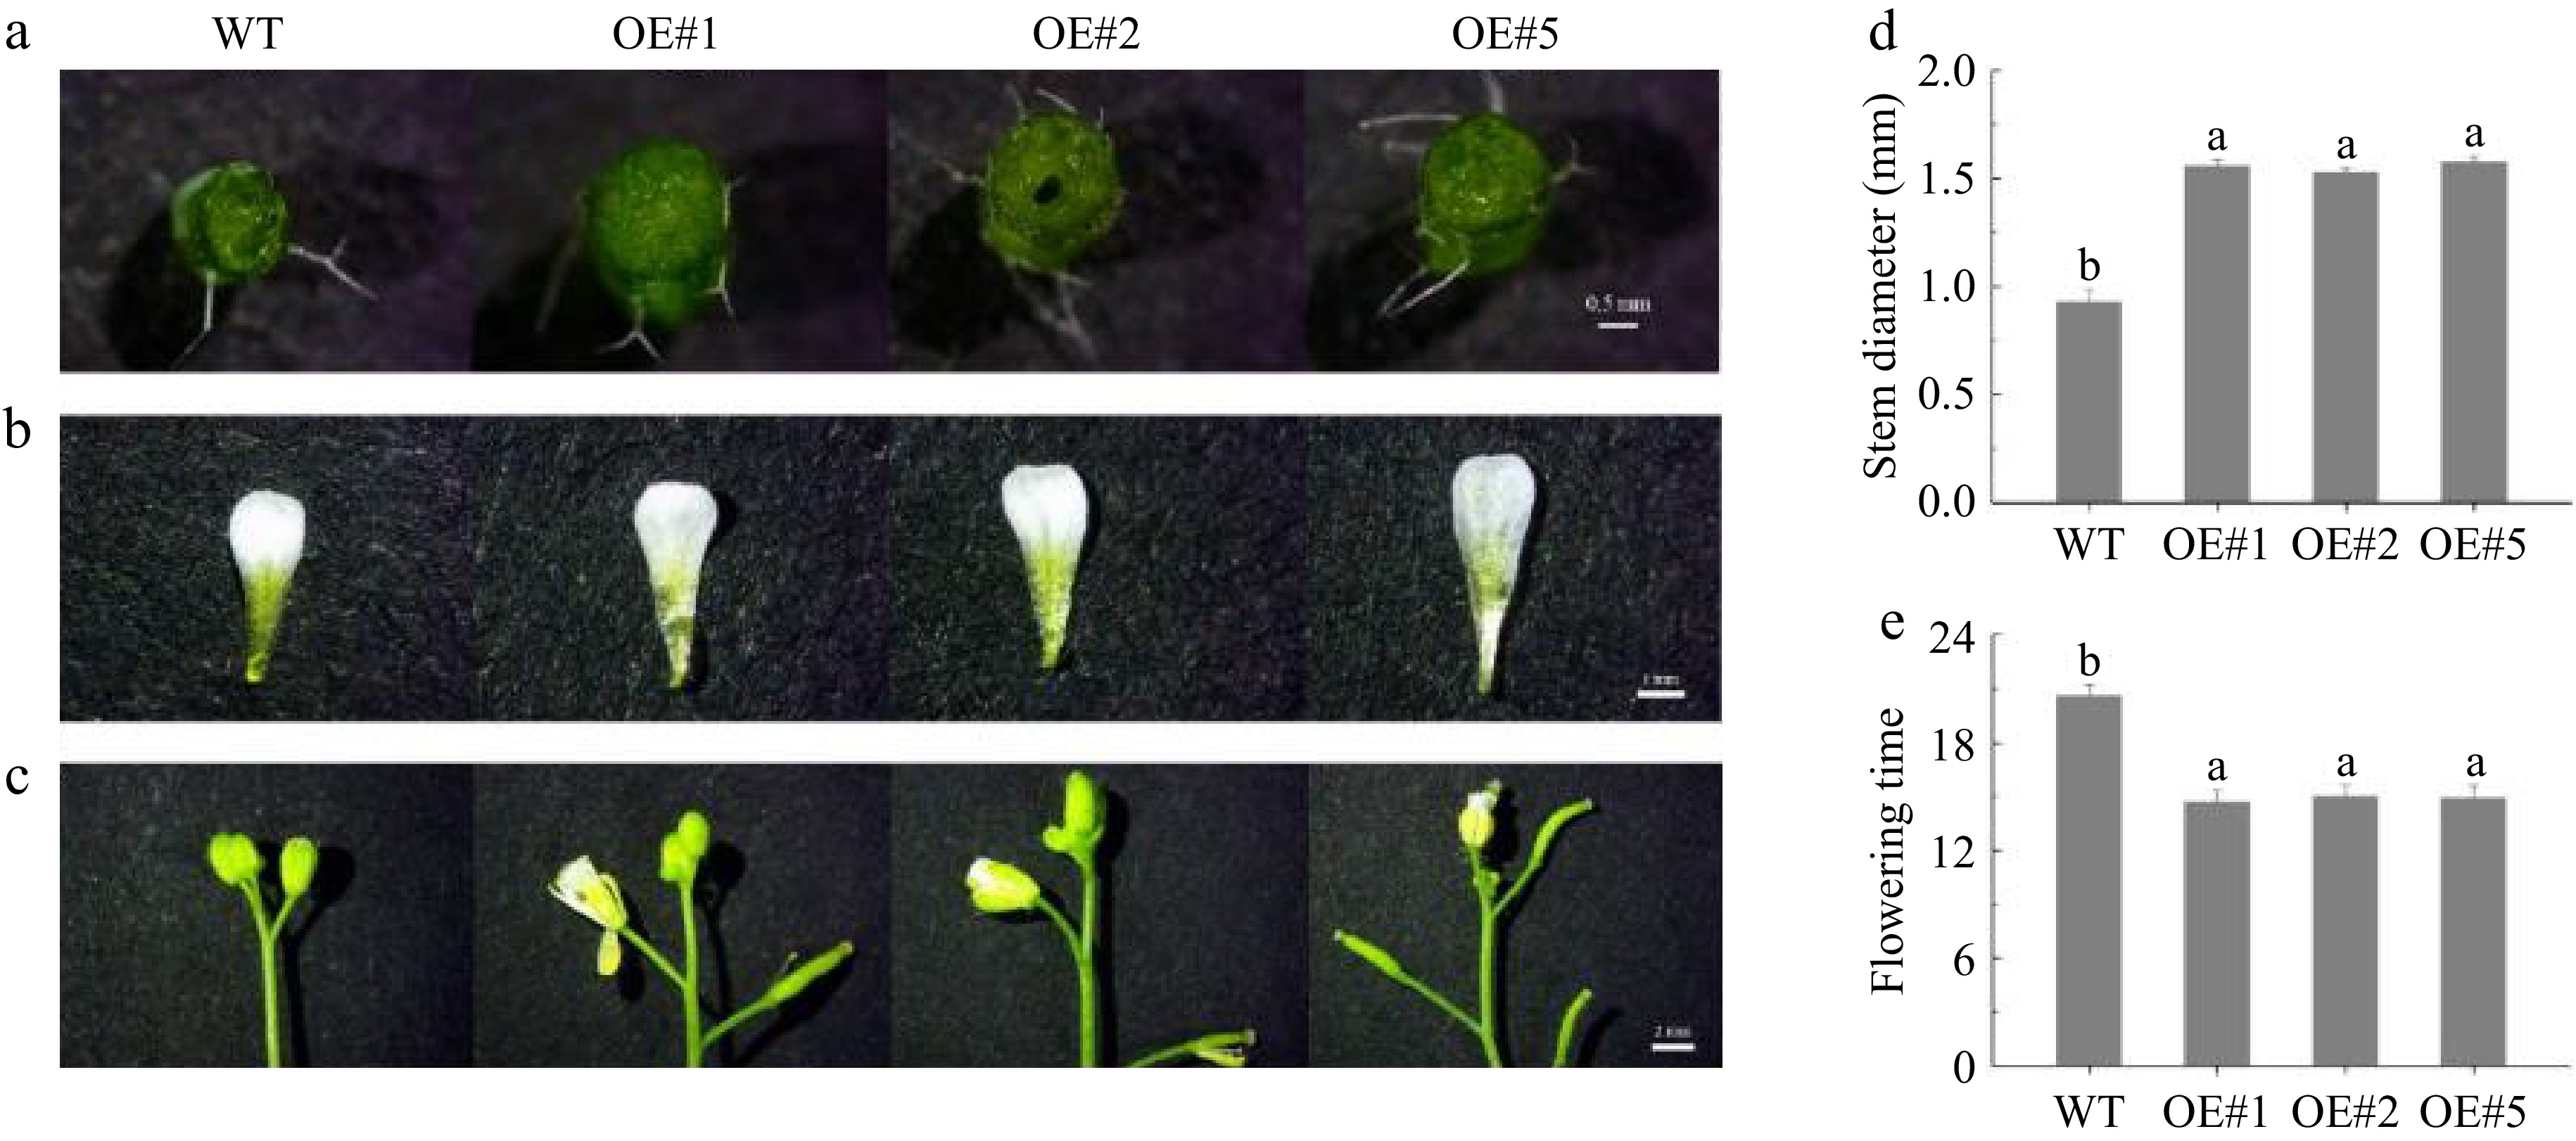
Figure 12.
Wild-type and transgenic LiEXLA2 A. thaliana growth 45 d.
Figures
(12)
Tables
(0)