-
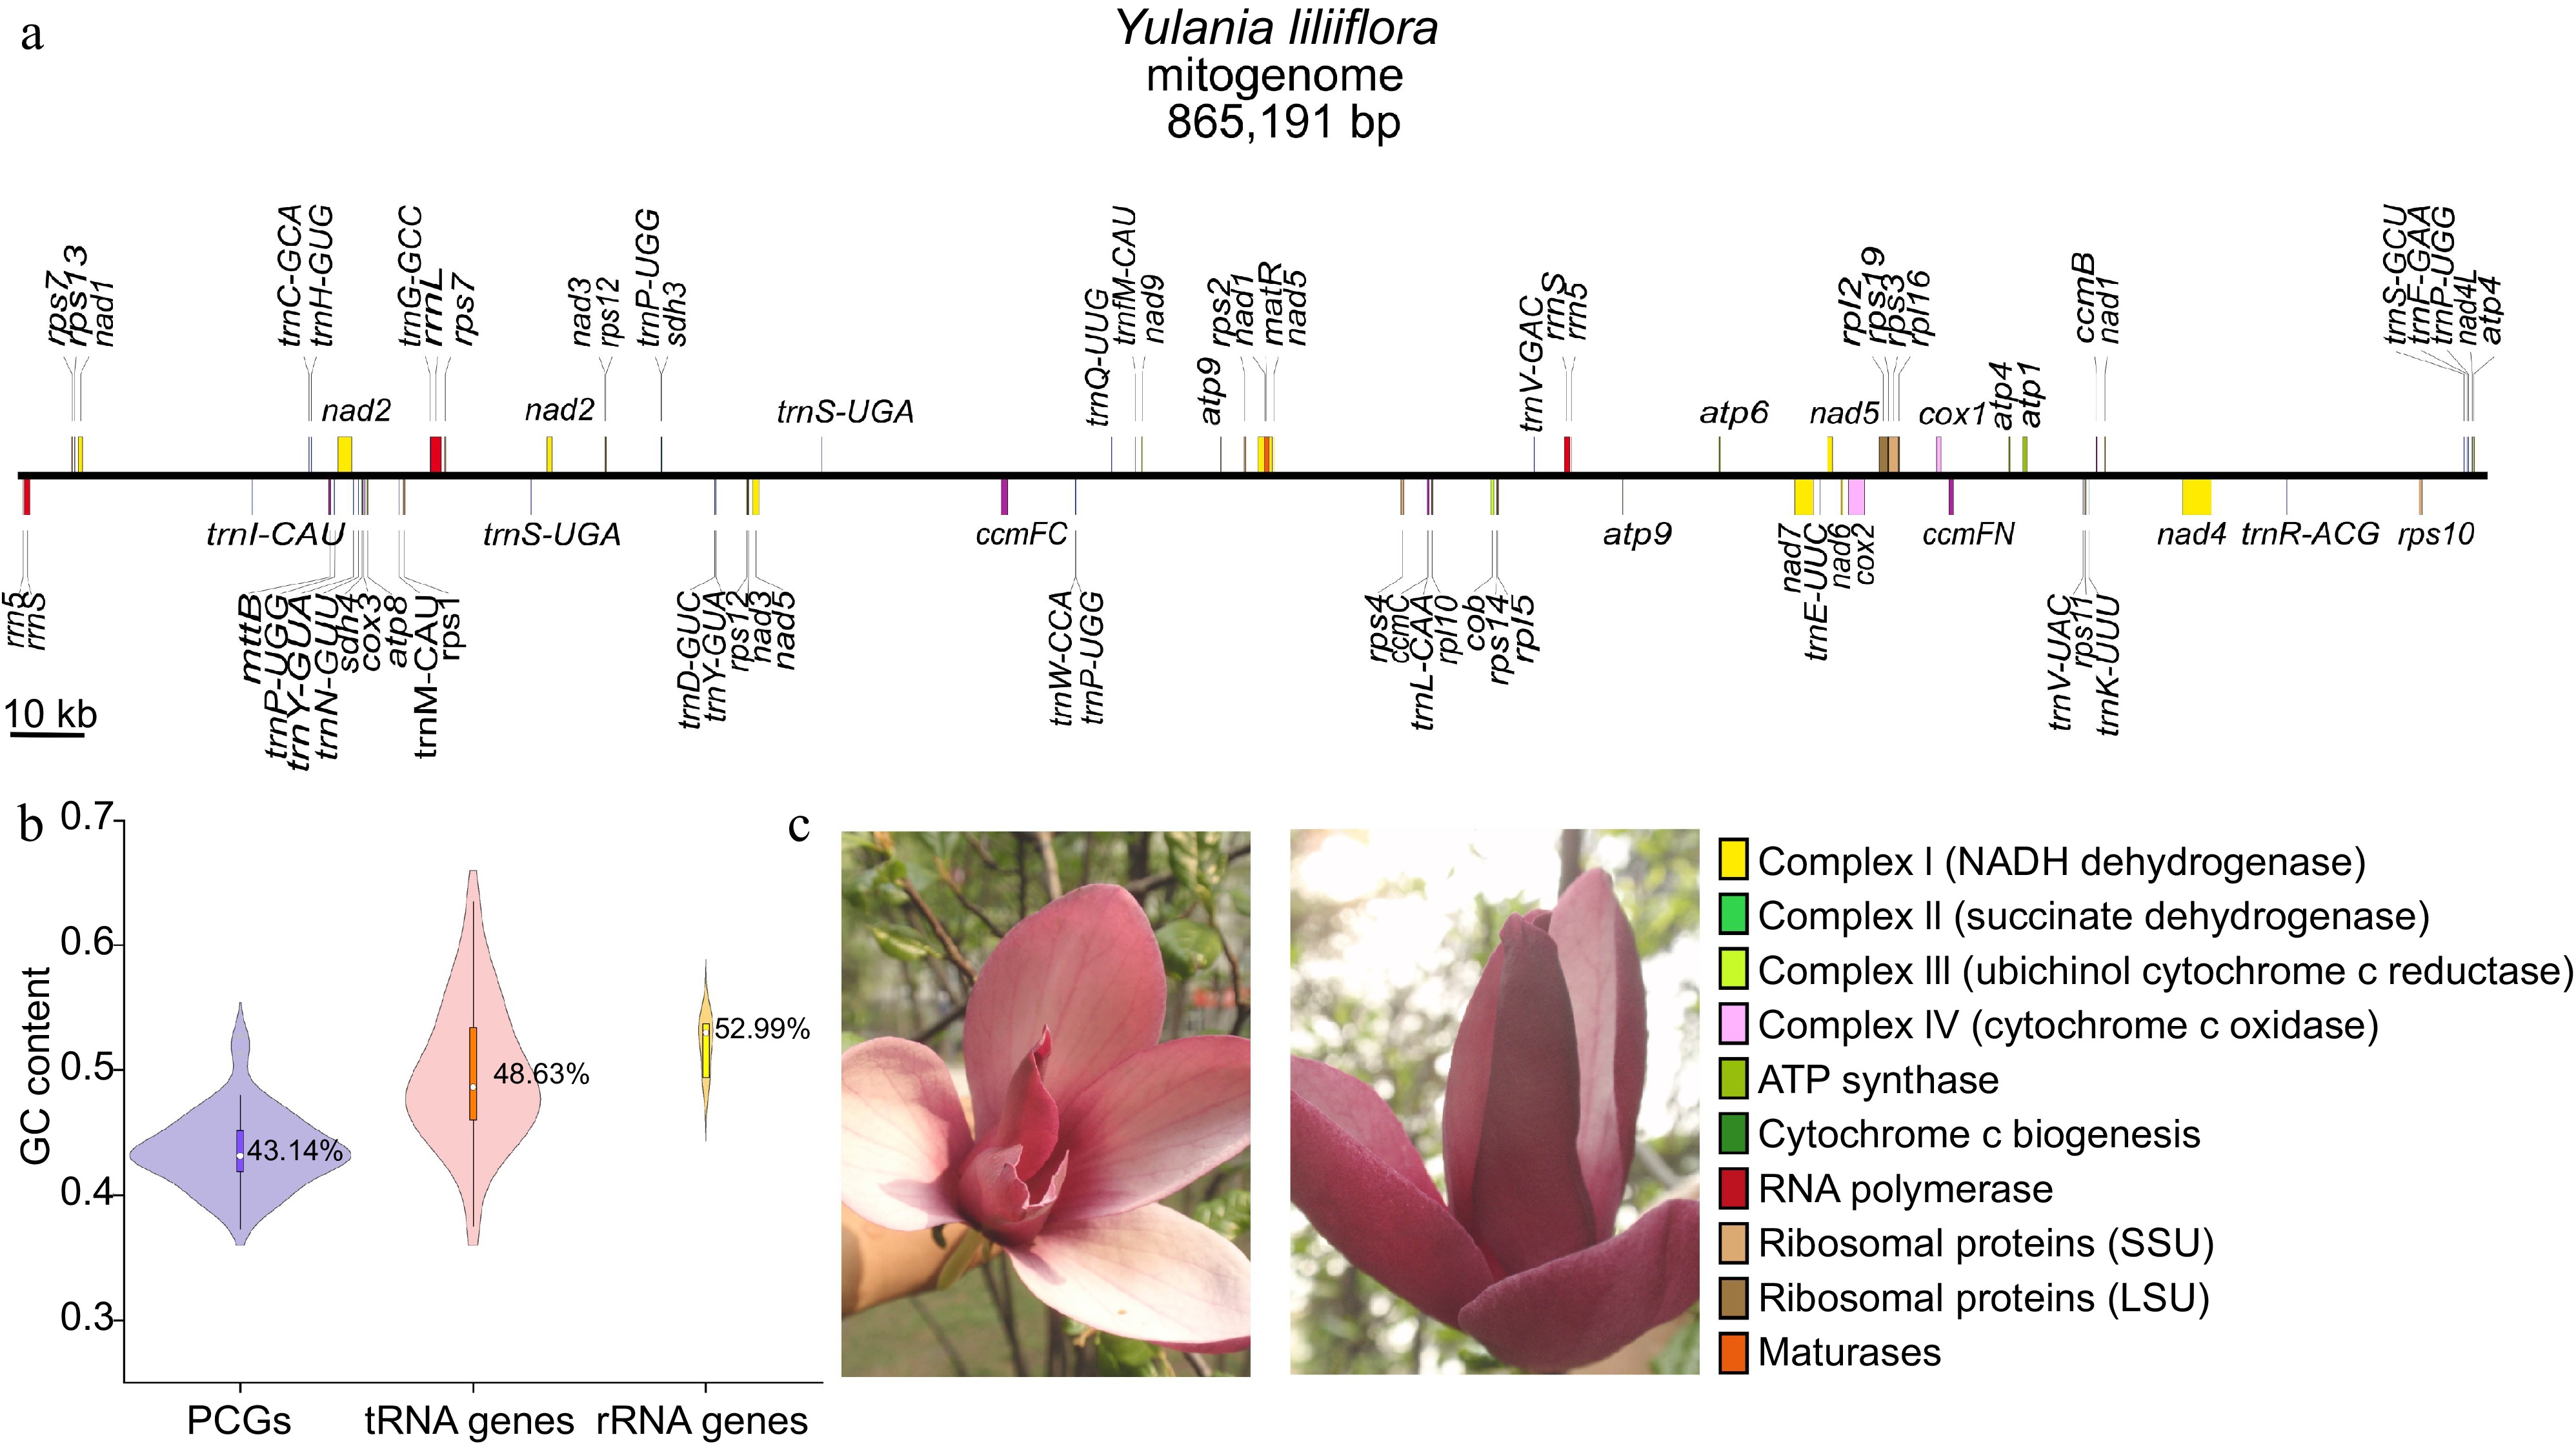
Figure 1.
Summary of the mitogenome of Y. liliiflora. (a) Linear map of the mitogenome of Y. liliiflora. The genes in the upper and lower linear regions are transcribed clockwise and counterclockwise, respectively. (b) The GC content of PCGs, tRNA, and rRNA genes among Y. liliiflora mitogenomes. (c) Y. liliiflora in Nanjing Forestry University (Nanjing, China).
-
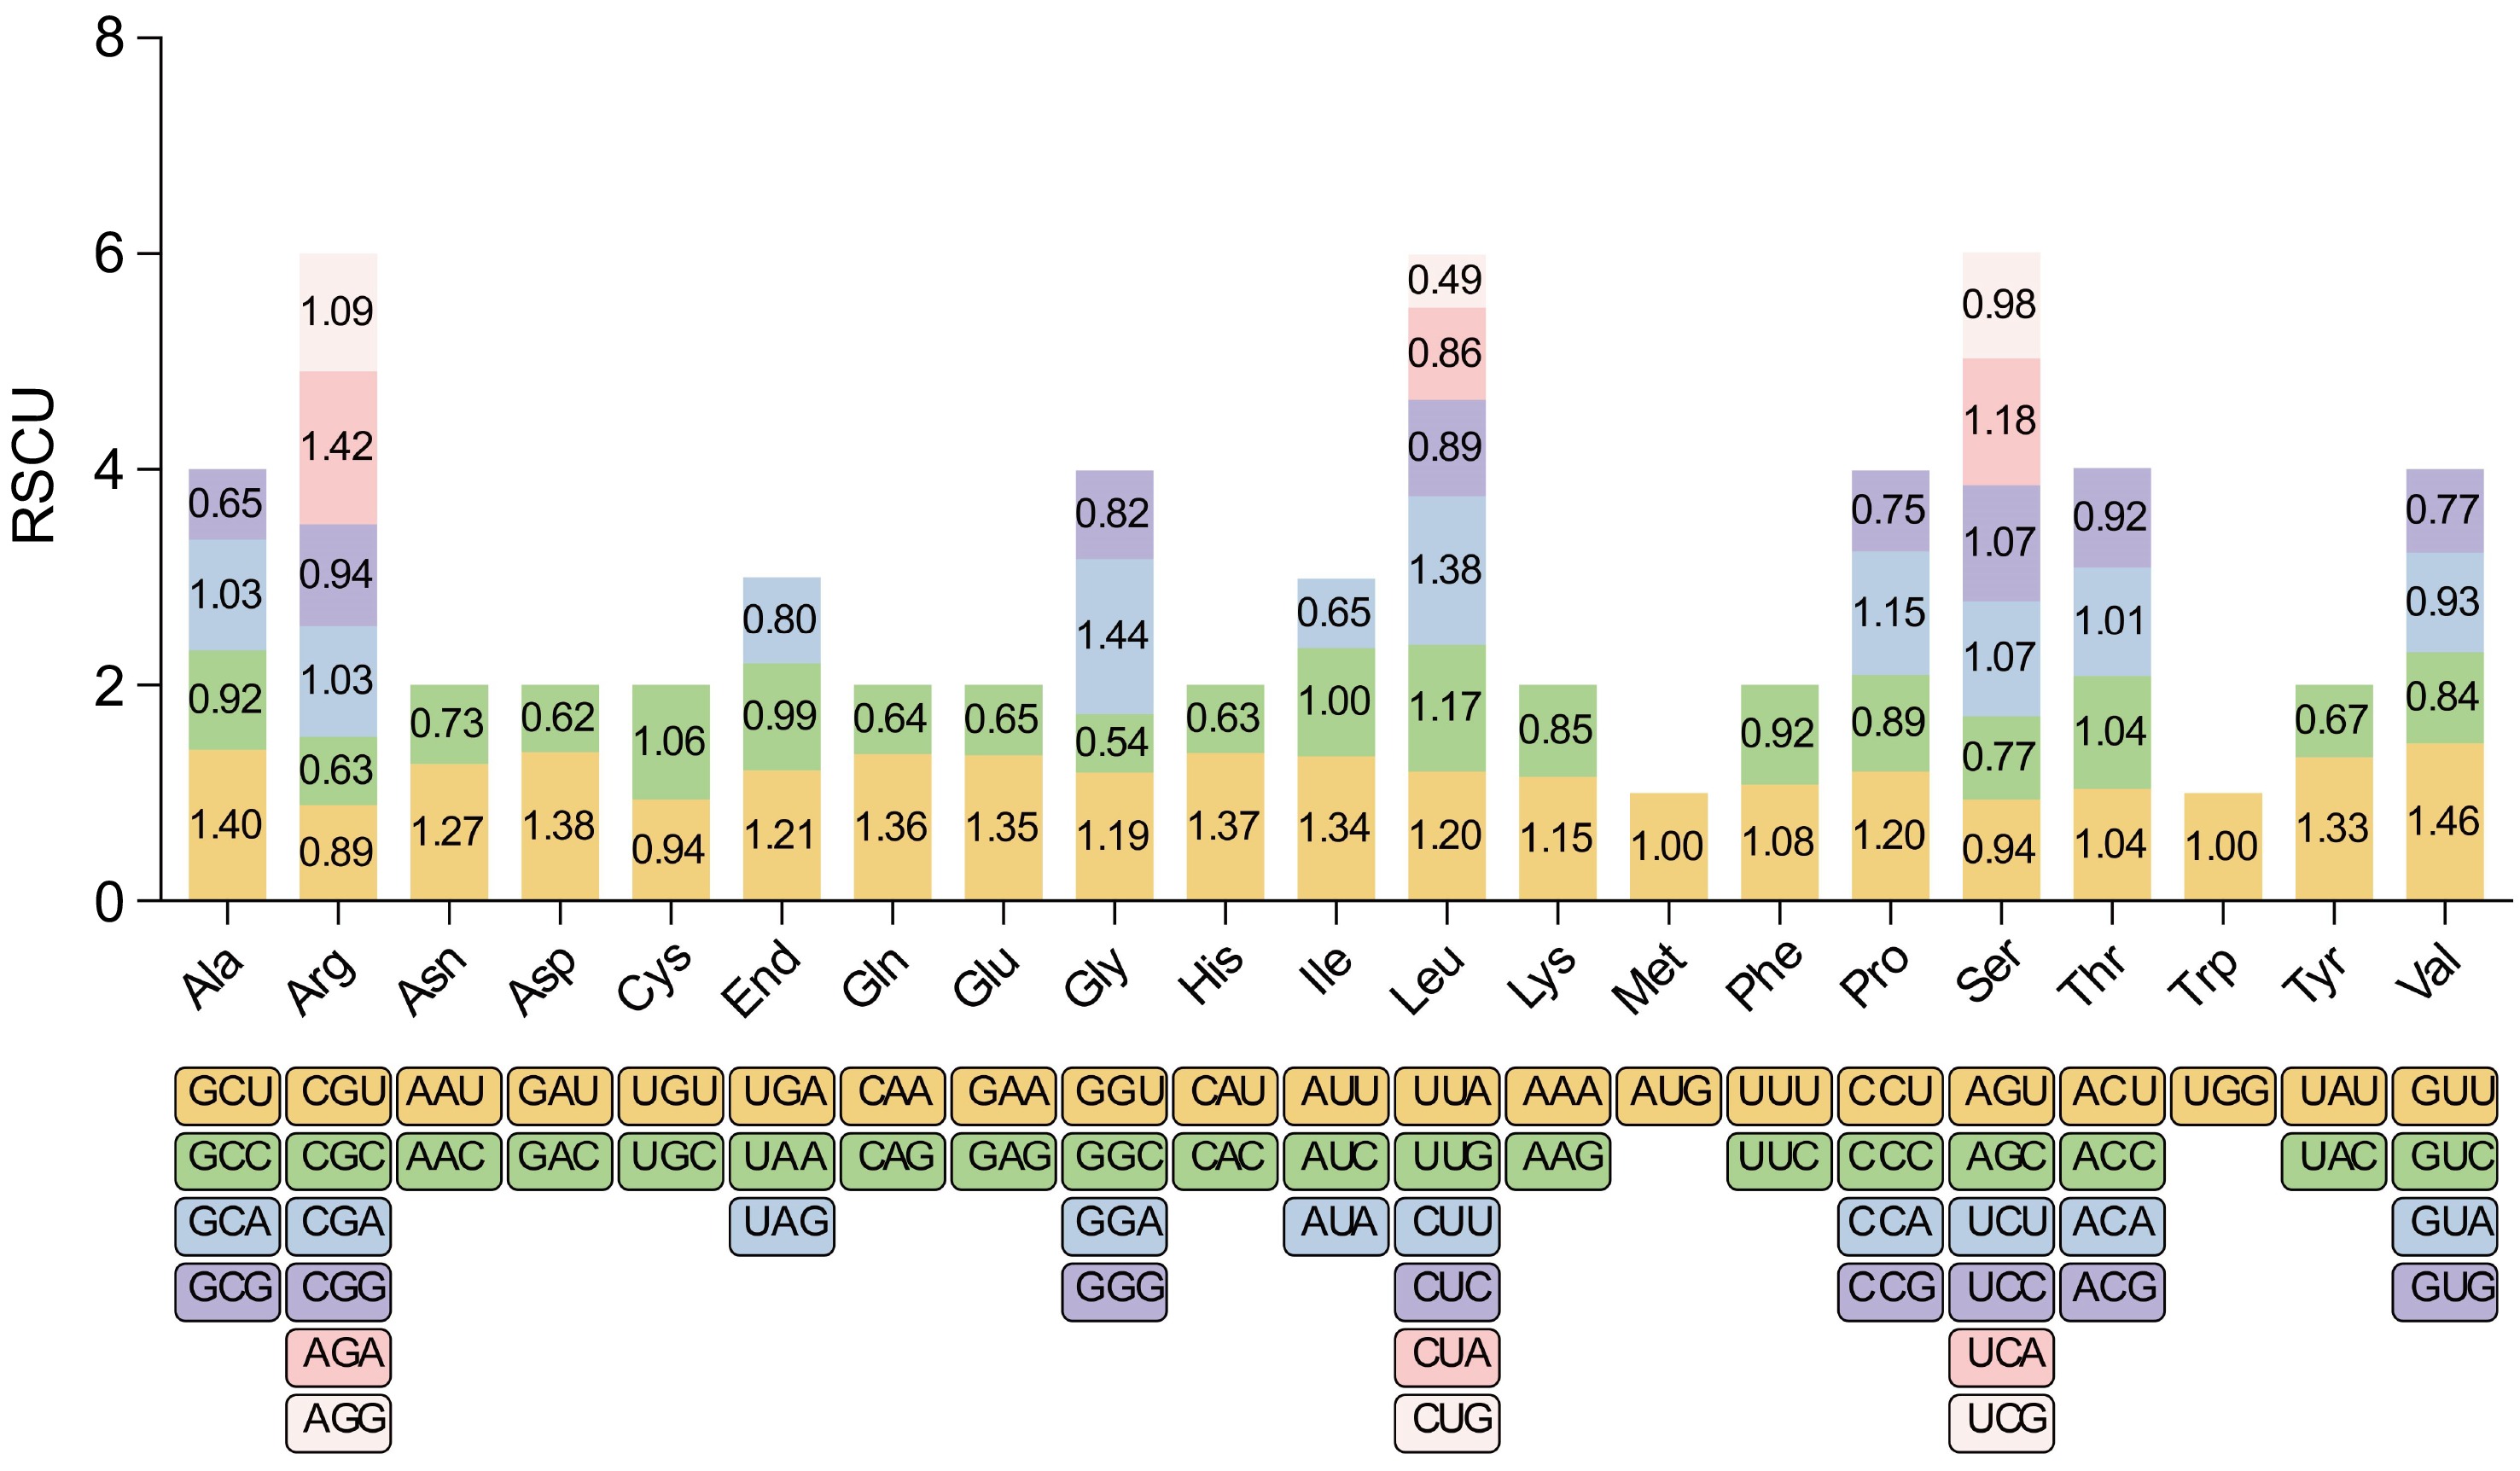
Figure 2.
RSCU in the Y. liliiflora mitogenome. The x-axis of the graphical representation depicts codon families, while RSCU values on the y-axis signify the frequency of codons relative to the expected frequency for uniform synonymous codon usage. This analysis reveals preferential codon usage patterns, shedding light on potential selective pressures and evolutionary influences on mitochondrial protein synthesis in Y. liliiflora.
-
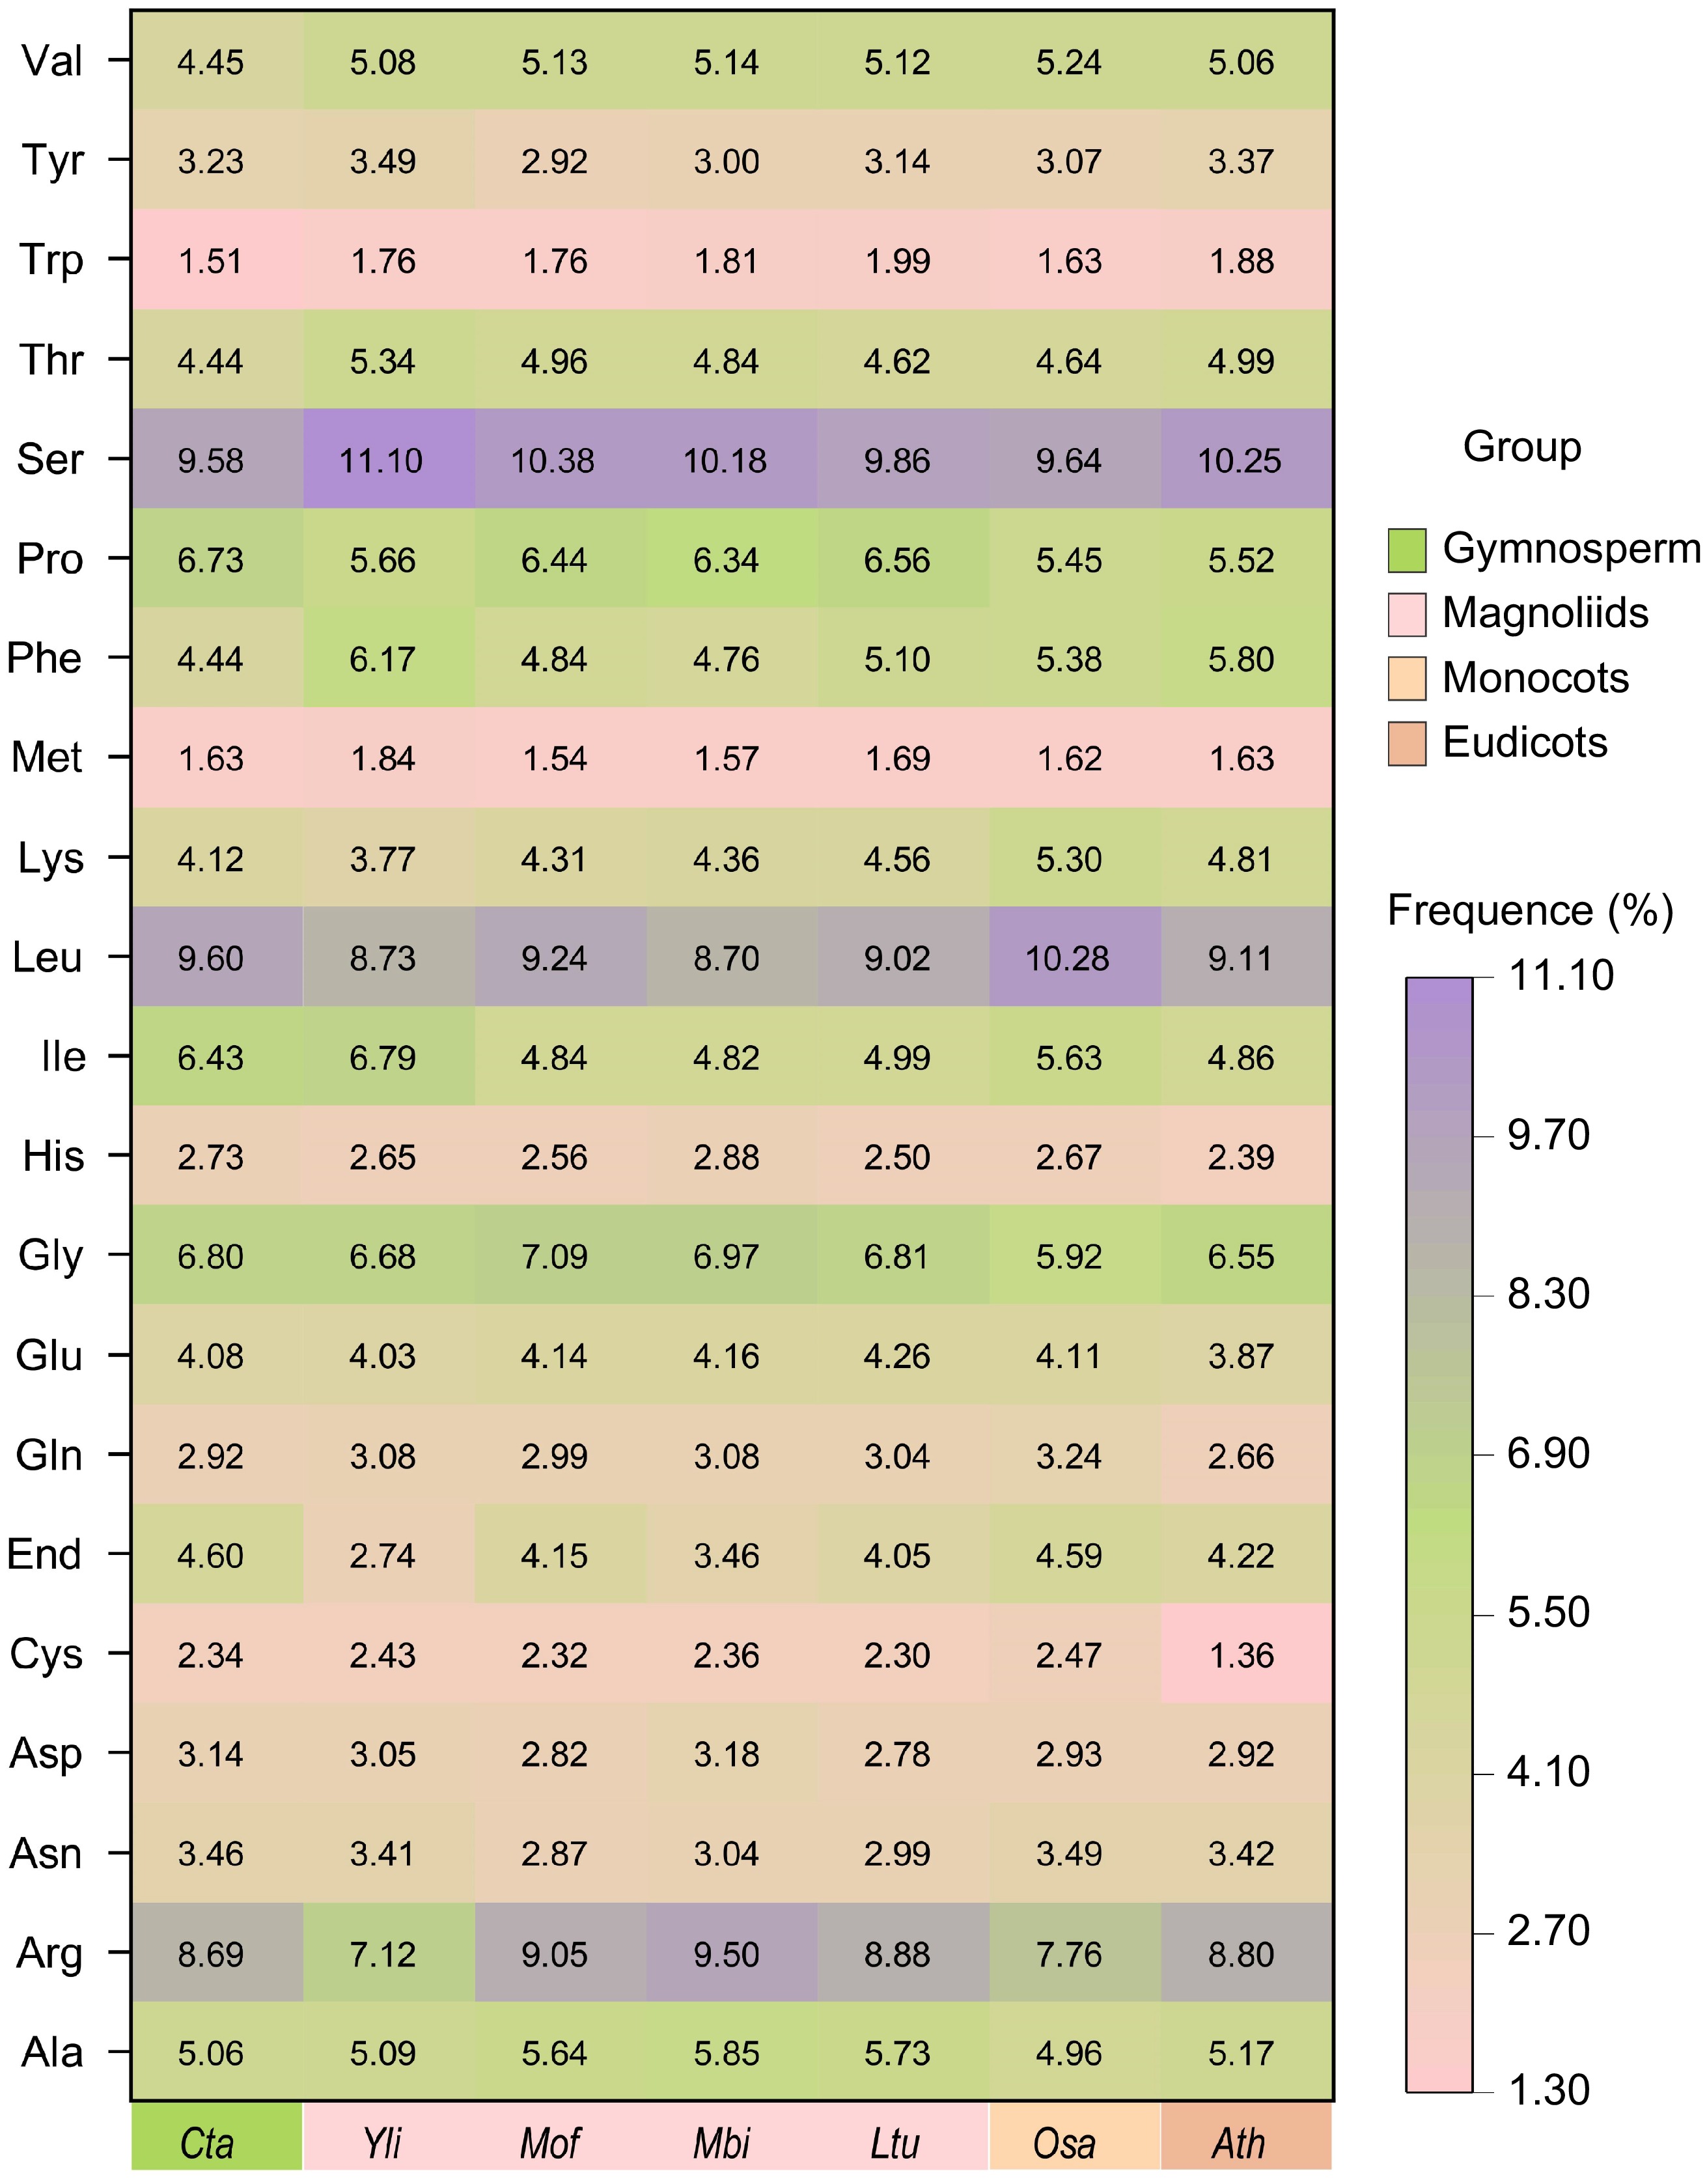
Figure 3.
Codon usage frequence of the Y. liliiflora mitogenome compared with C. taitungensis, M. officinalis, M. biondii, L. tulipifera, O. sativa, and A. thaliana. The x-axis represents different species, while the y-axis depicts amino acid families. Color intensity reflects the percentage of each codon relative to the total codons coding for a specific amino acid, ranging from pink (1.30%) to deep purple (11.10%). The gradual color transition signifies increasing percentages, providing a visual representation of the relative abundance of each codon in the context of all mitochondrial proteins.
-
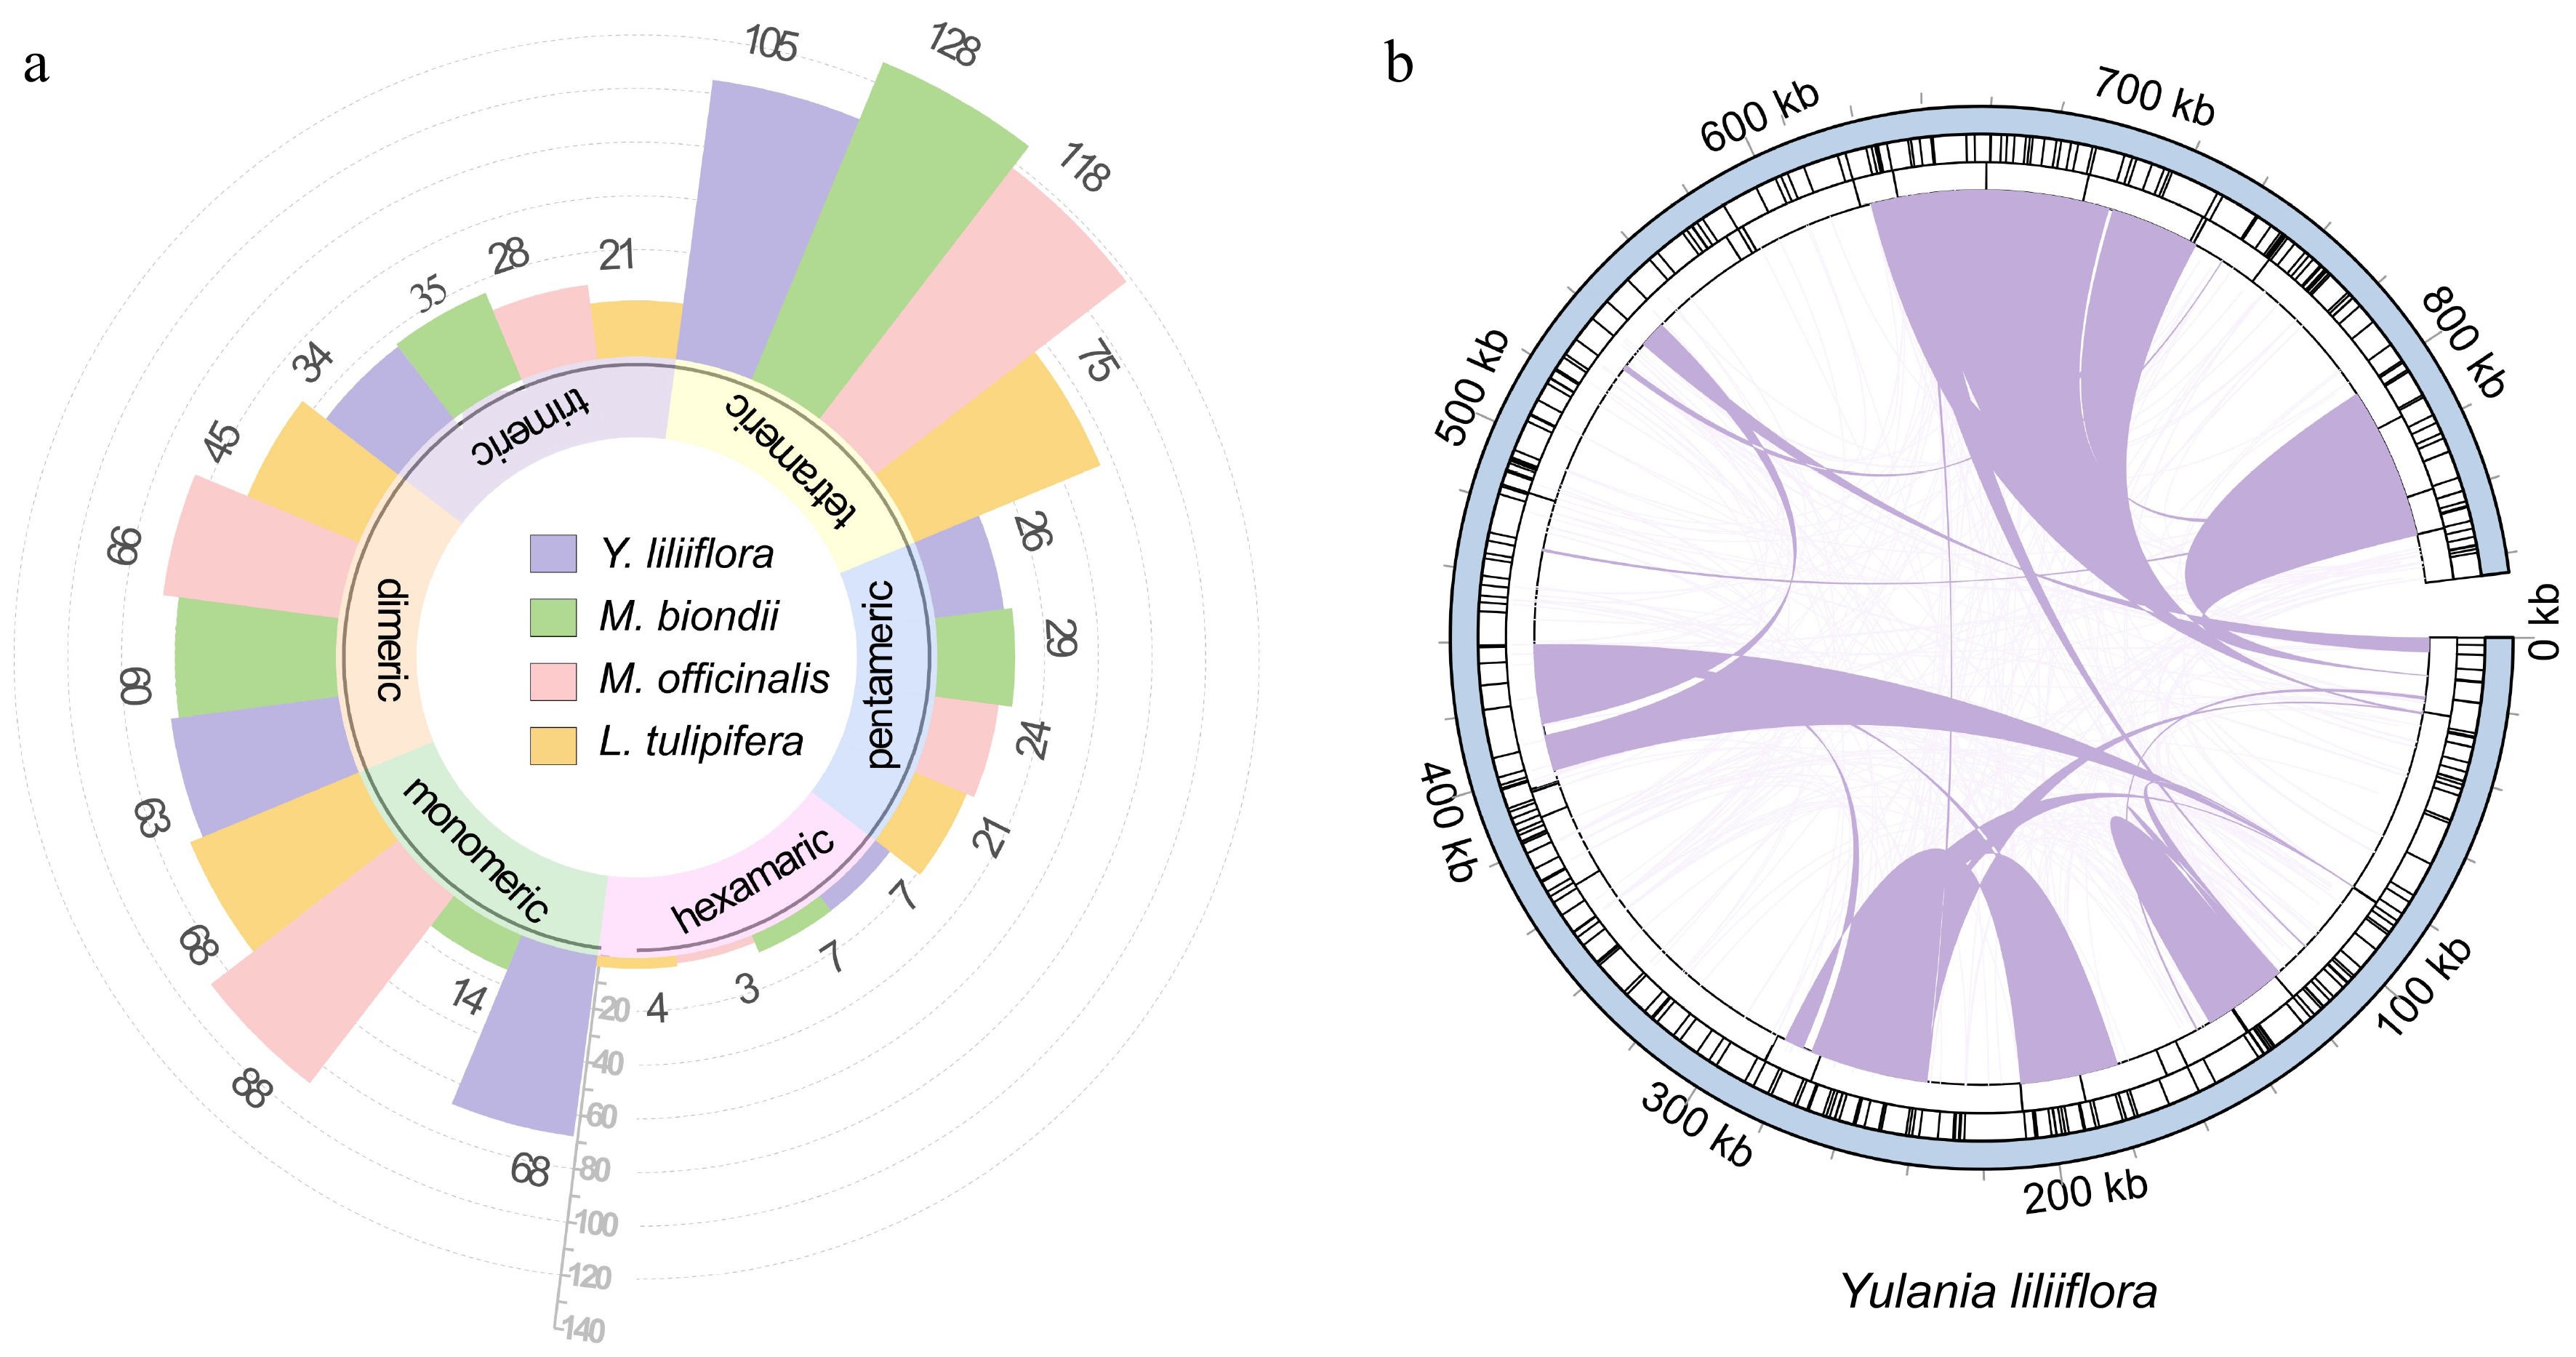
Figure 4.
Repetitive sequences of the Y. liliiflora mitogenome. (a) Ribbon bar graphs presenting SSRs. The legend is in purple, green, pink, and yellow for Y. liliiflora, M. biondii, M. officinalis, and L. tulipifera respectively, with every four bars clustered into one category starting from the 0 scale, representing monomers, dimers, trimers, tetramers, pentamers, and hexamers. (b) The repeats of Y. liliiflora mitogenome. The color line on the inner circle connects two repeated dispersed repeat. The deep purple lines represent ≥ 500 bp repetitive fragments. The tandem repeat is represented by short bars in the intermediate circle, while the SSRs are shown in the outer circle.
-
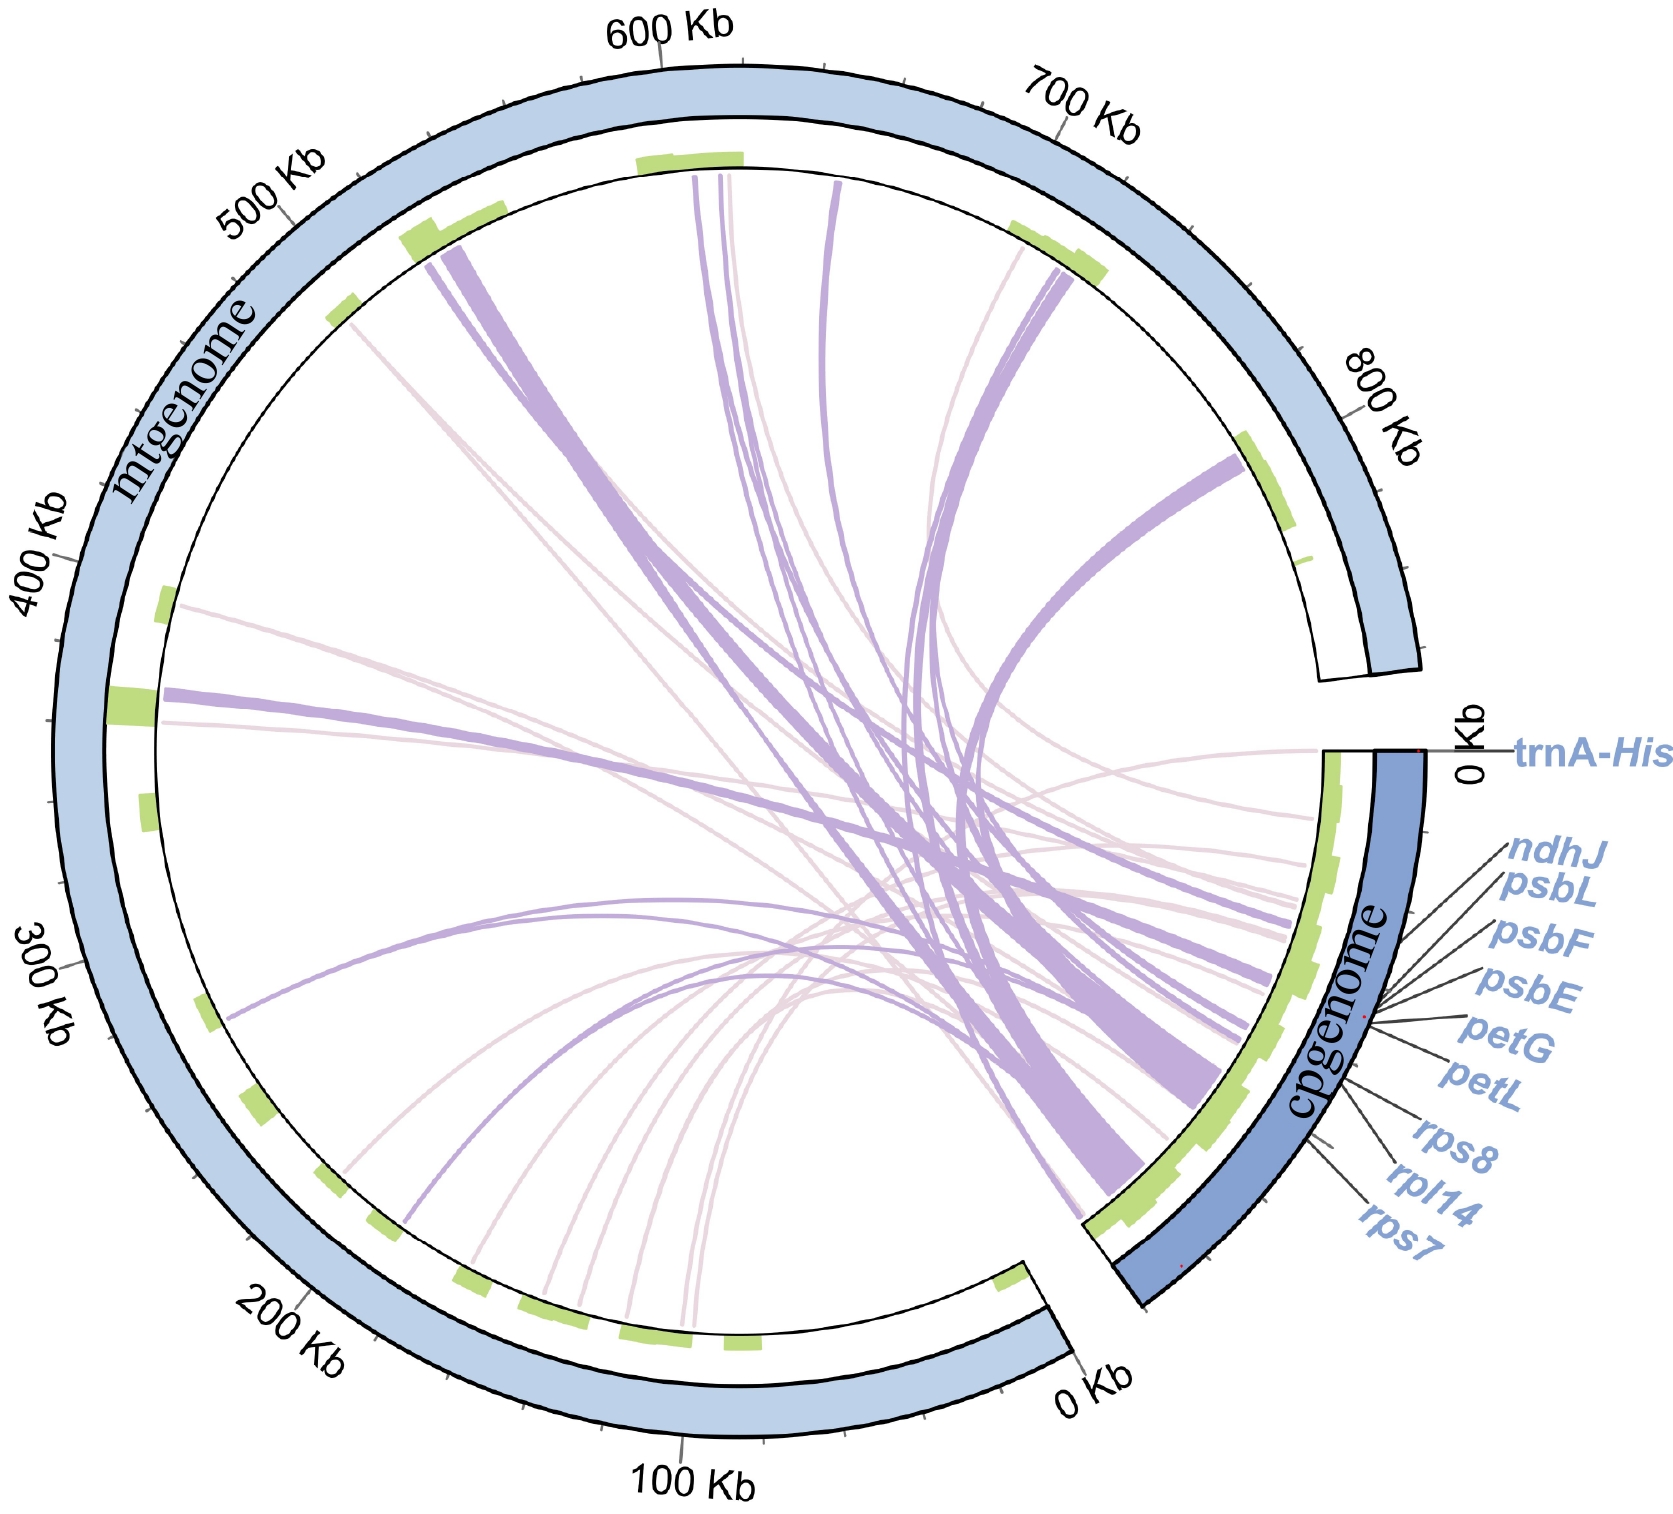
Figure 5.
Migration sequences of the Y. liliiflora mitogenome. The pale purple lines on the inner circle represent fragments that transfer from chloroplasts to mitochondria. The diagram displays transfer fragments of ≥ 100 bp as deep purple lines, while the sequence length is shown on the outside circle.
-
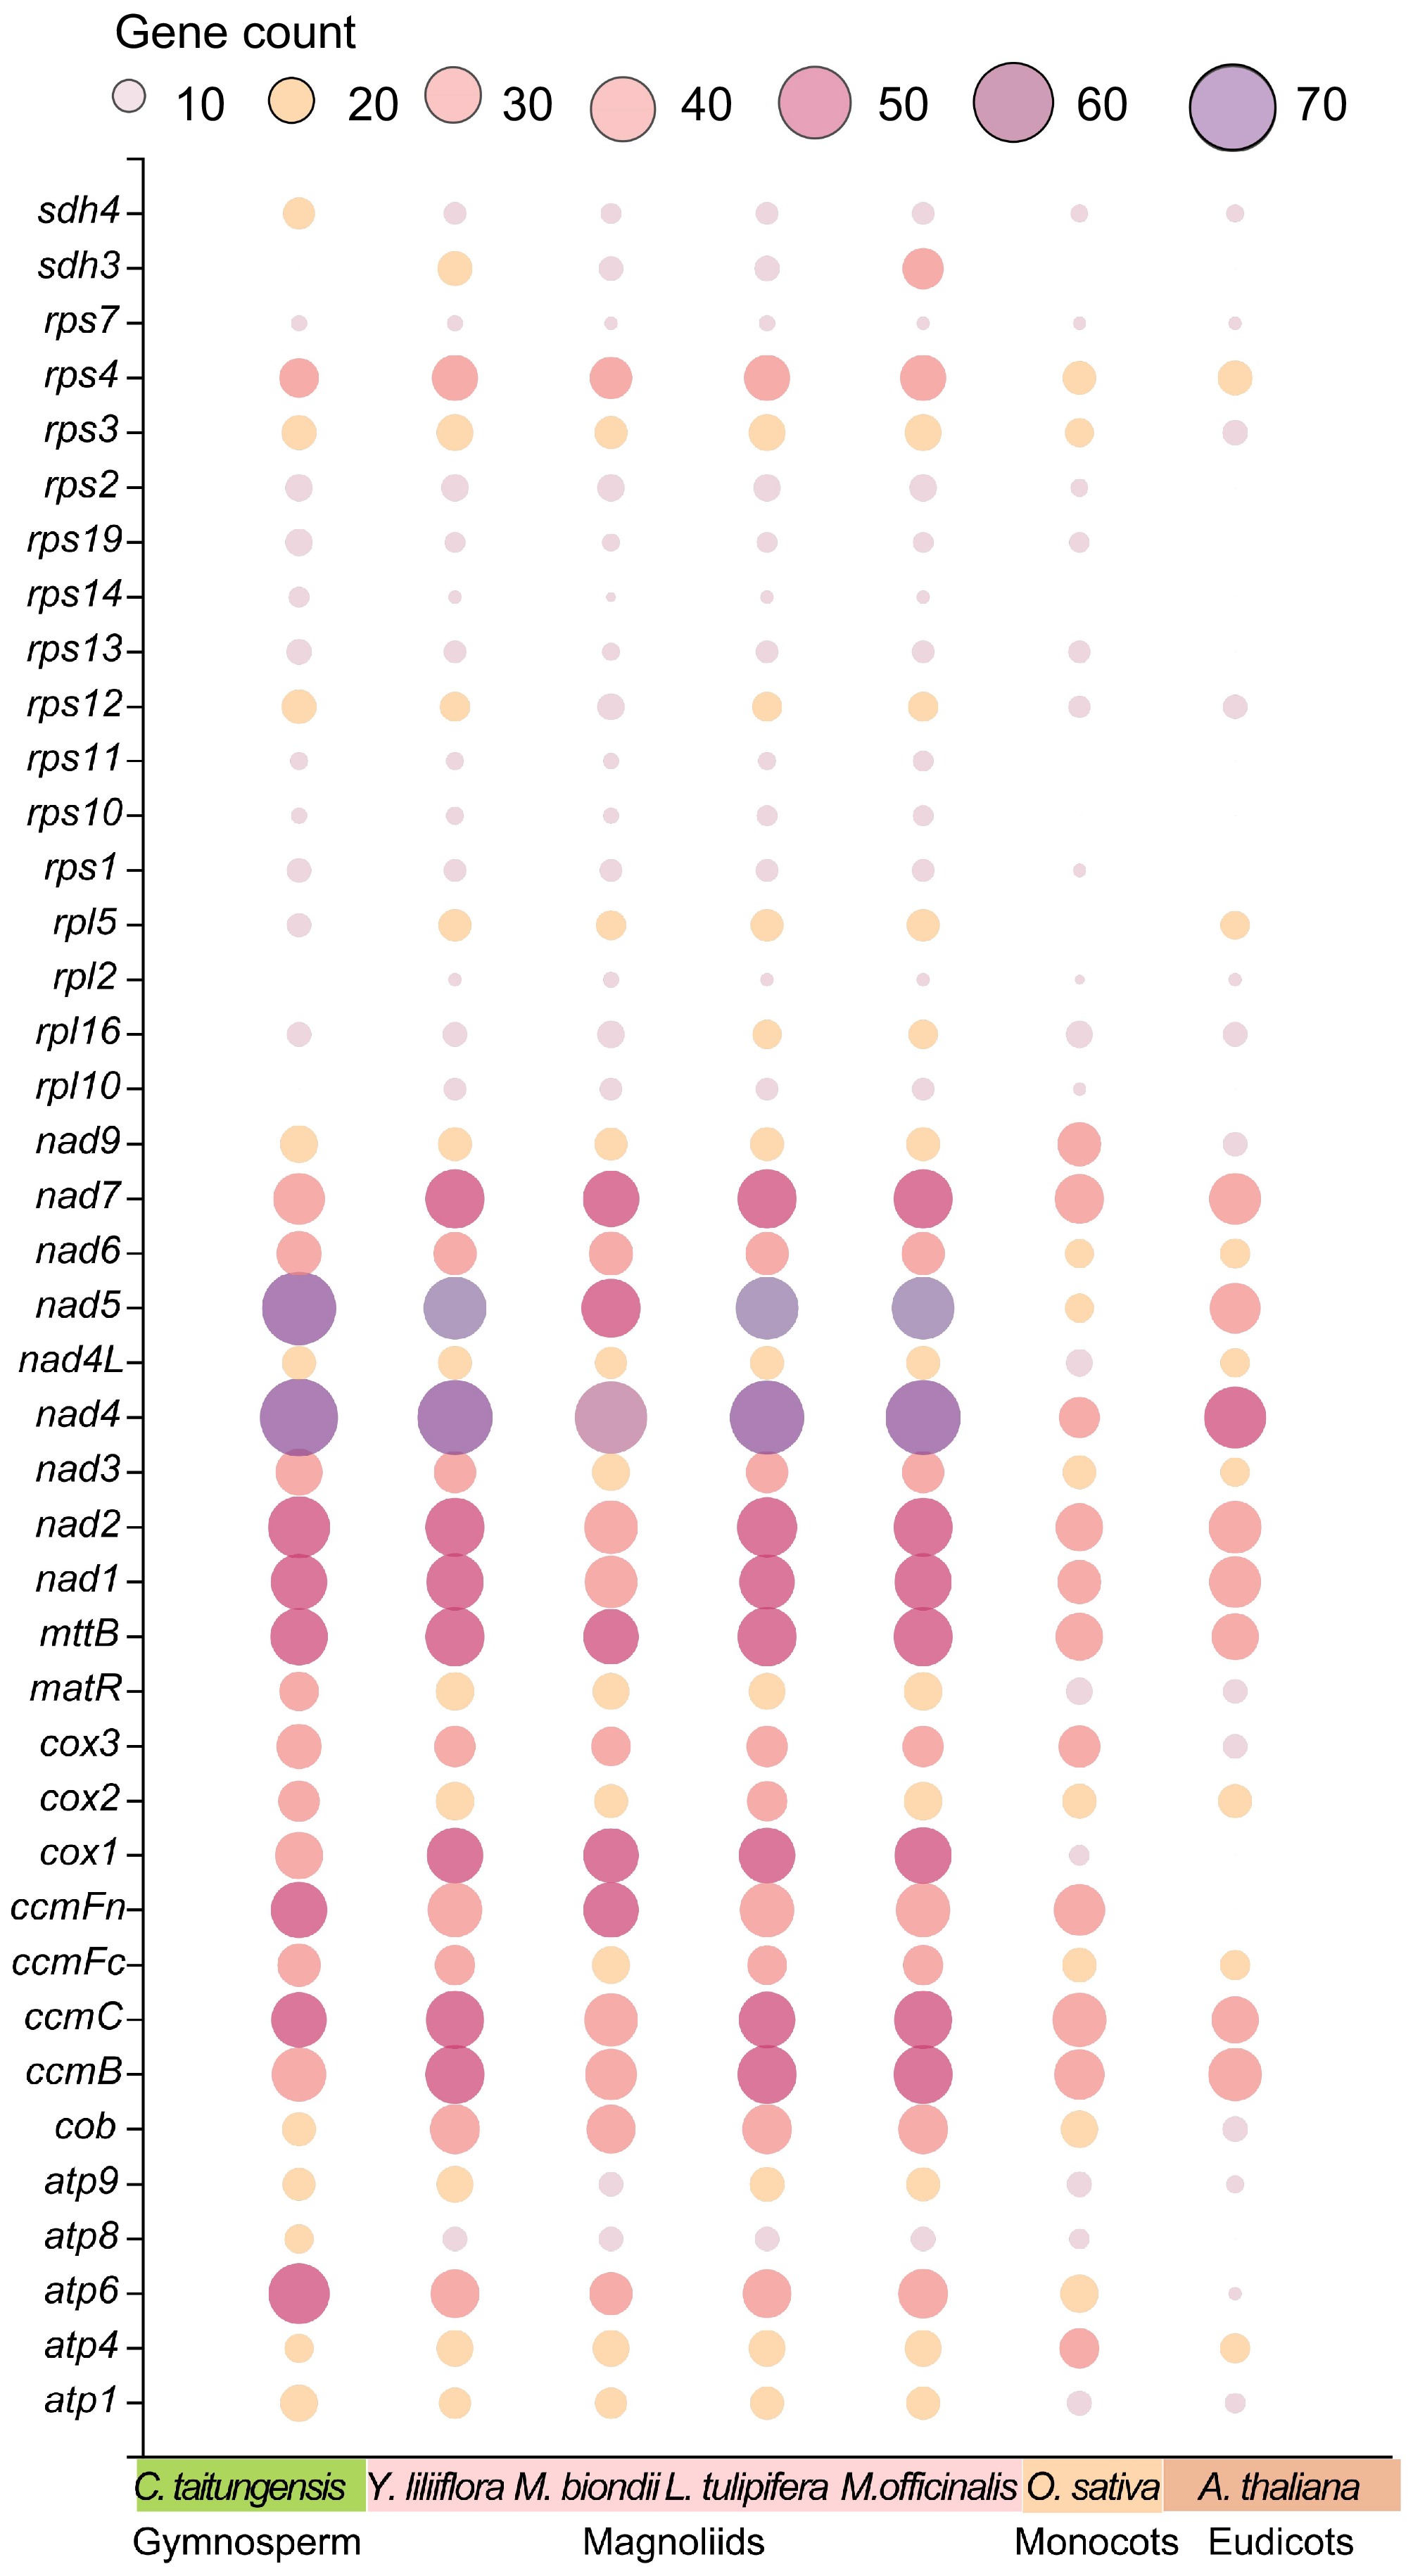
Figure 6.
Bubble plot of the number of RNA editing sites in mitogenome PCGs of C. taitungensis, Y. liliiflora, M. officinalis, M. biondii, L. tulipifera, O. sativa, and A. thaliana.
-
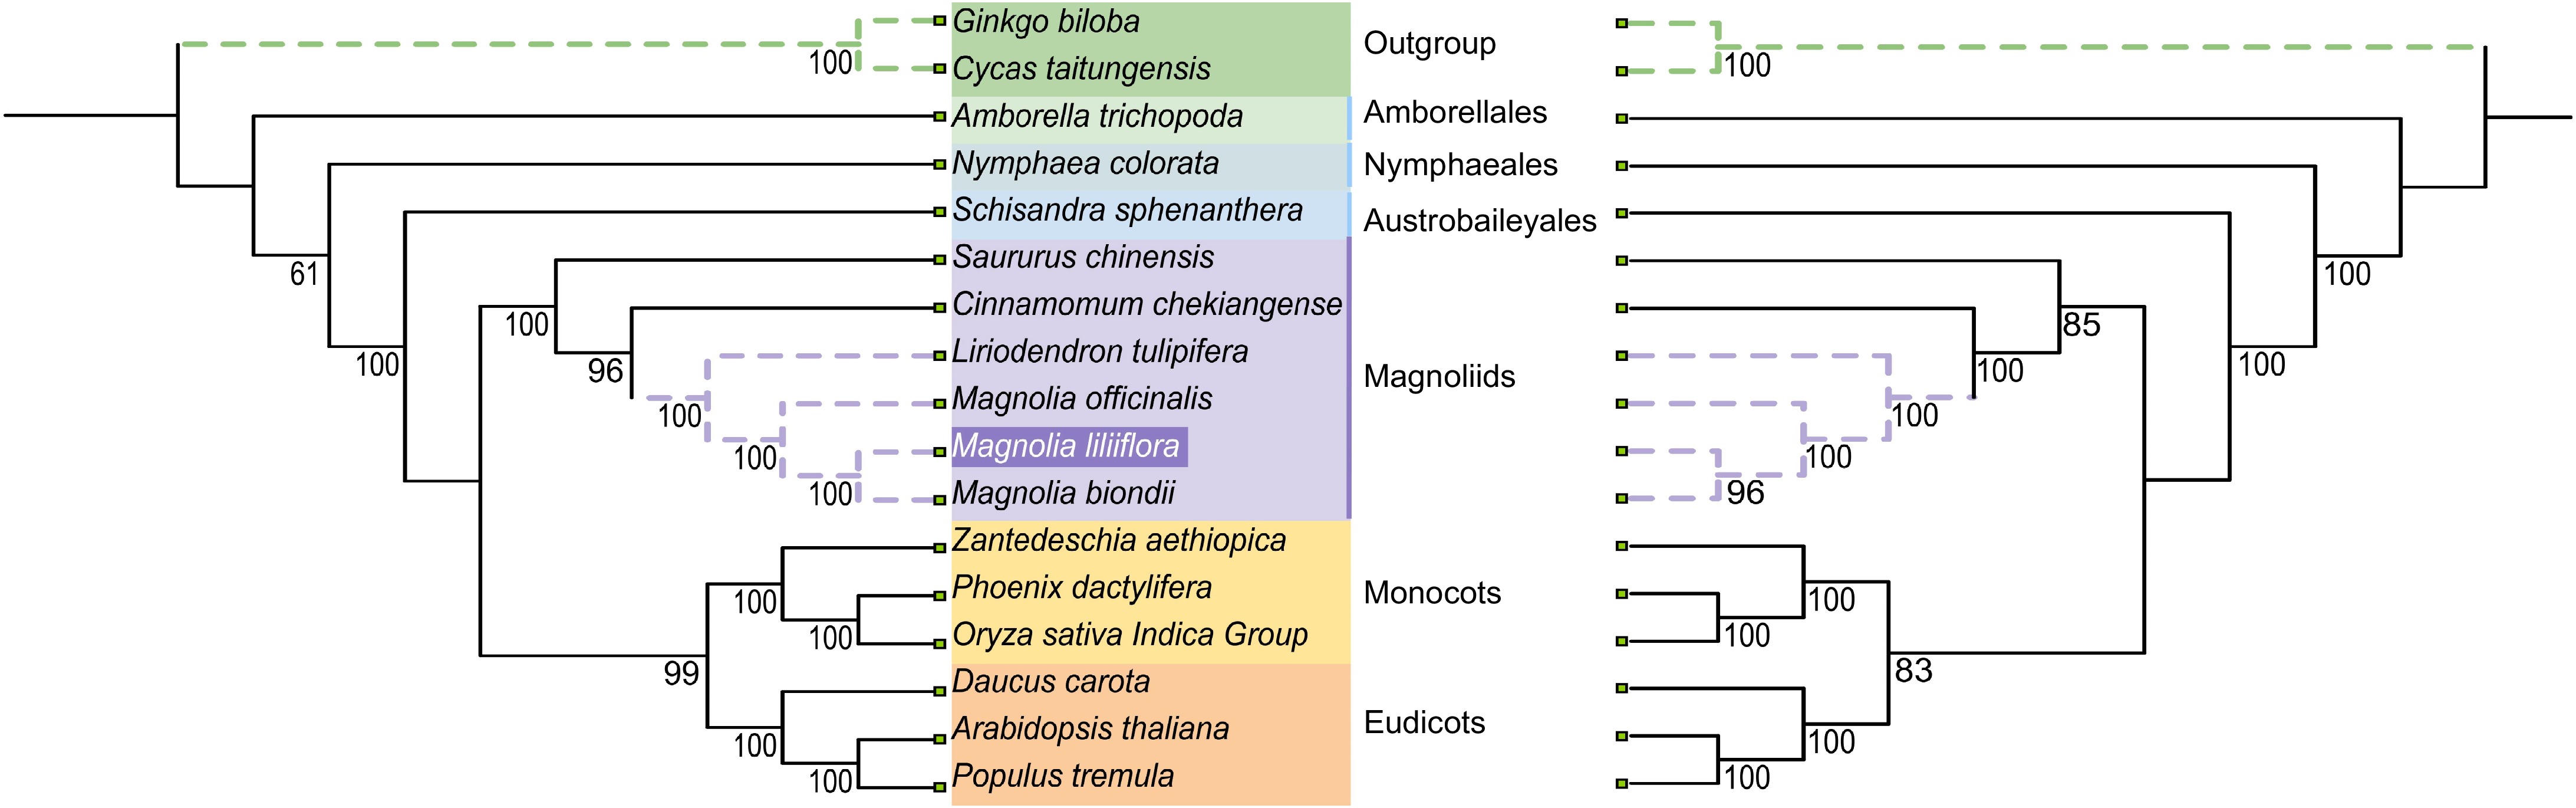
Figure 7.
The relationships of Y. liliiflora with the 16 other represented land plants are shown based on the chloroplast (left) and mitochondrial (right) genomes. Bootstrap support values are presented at each node.
-
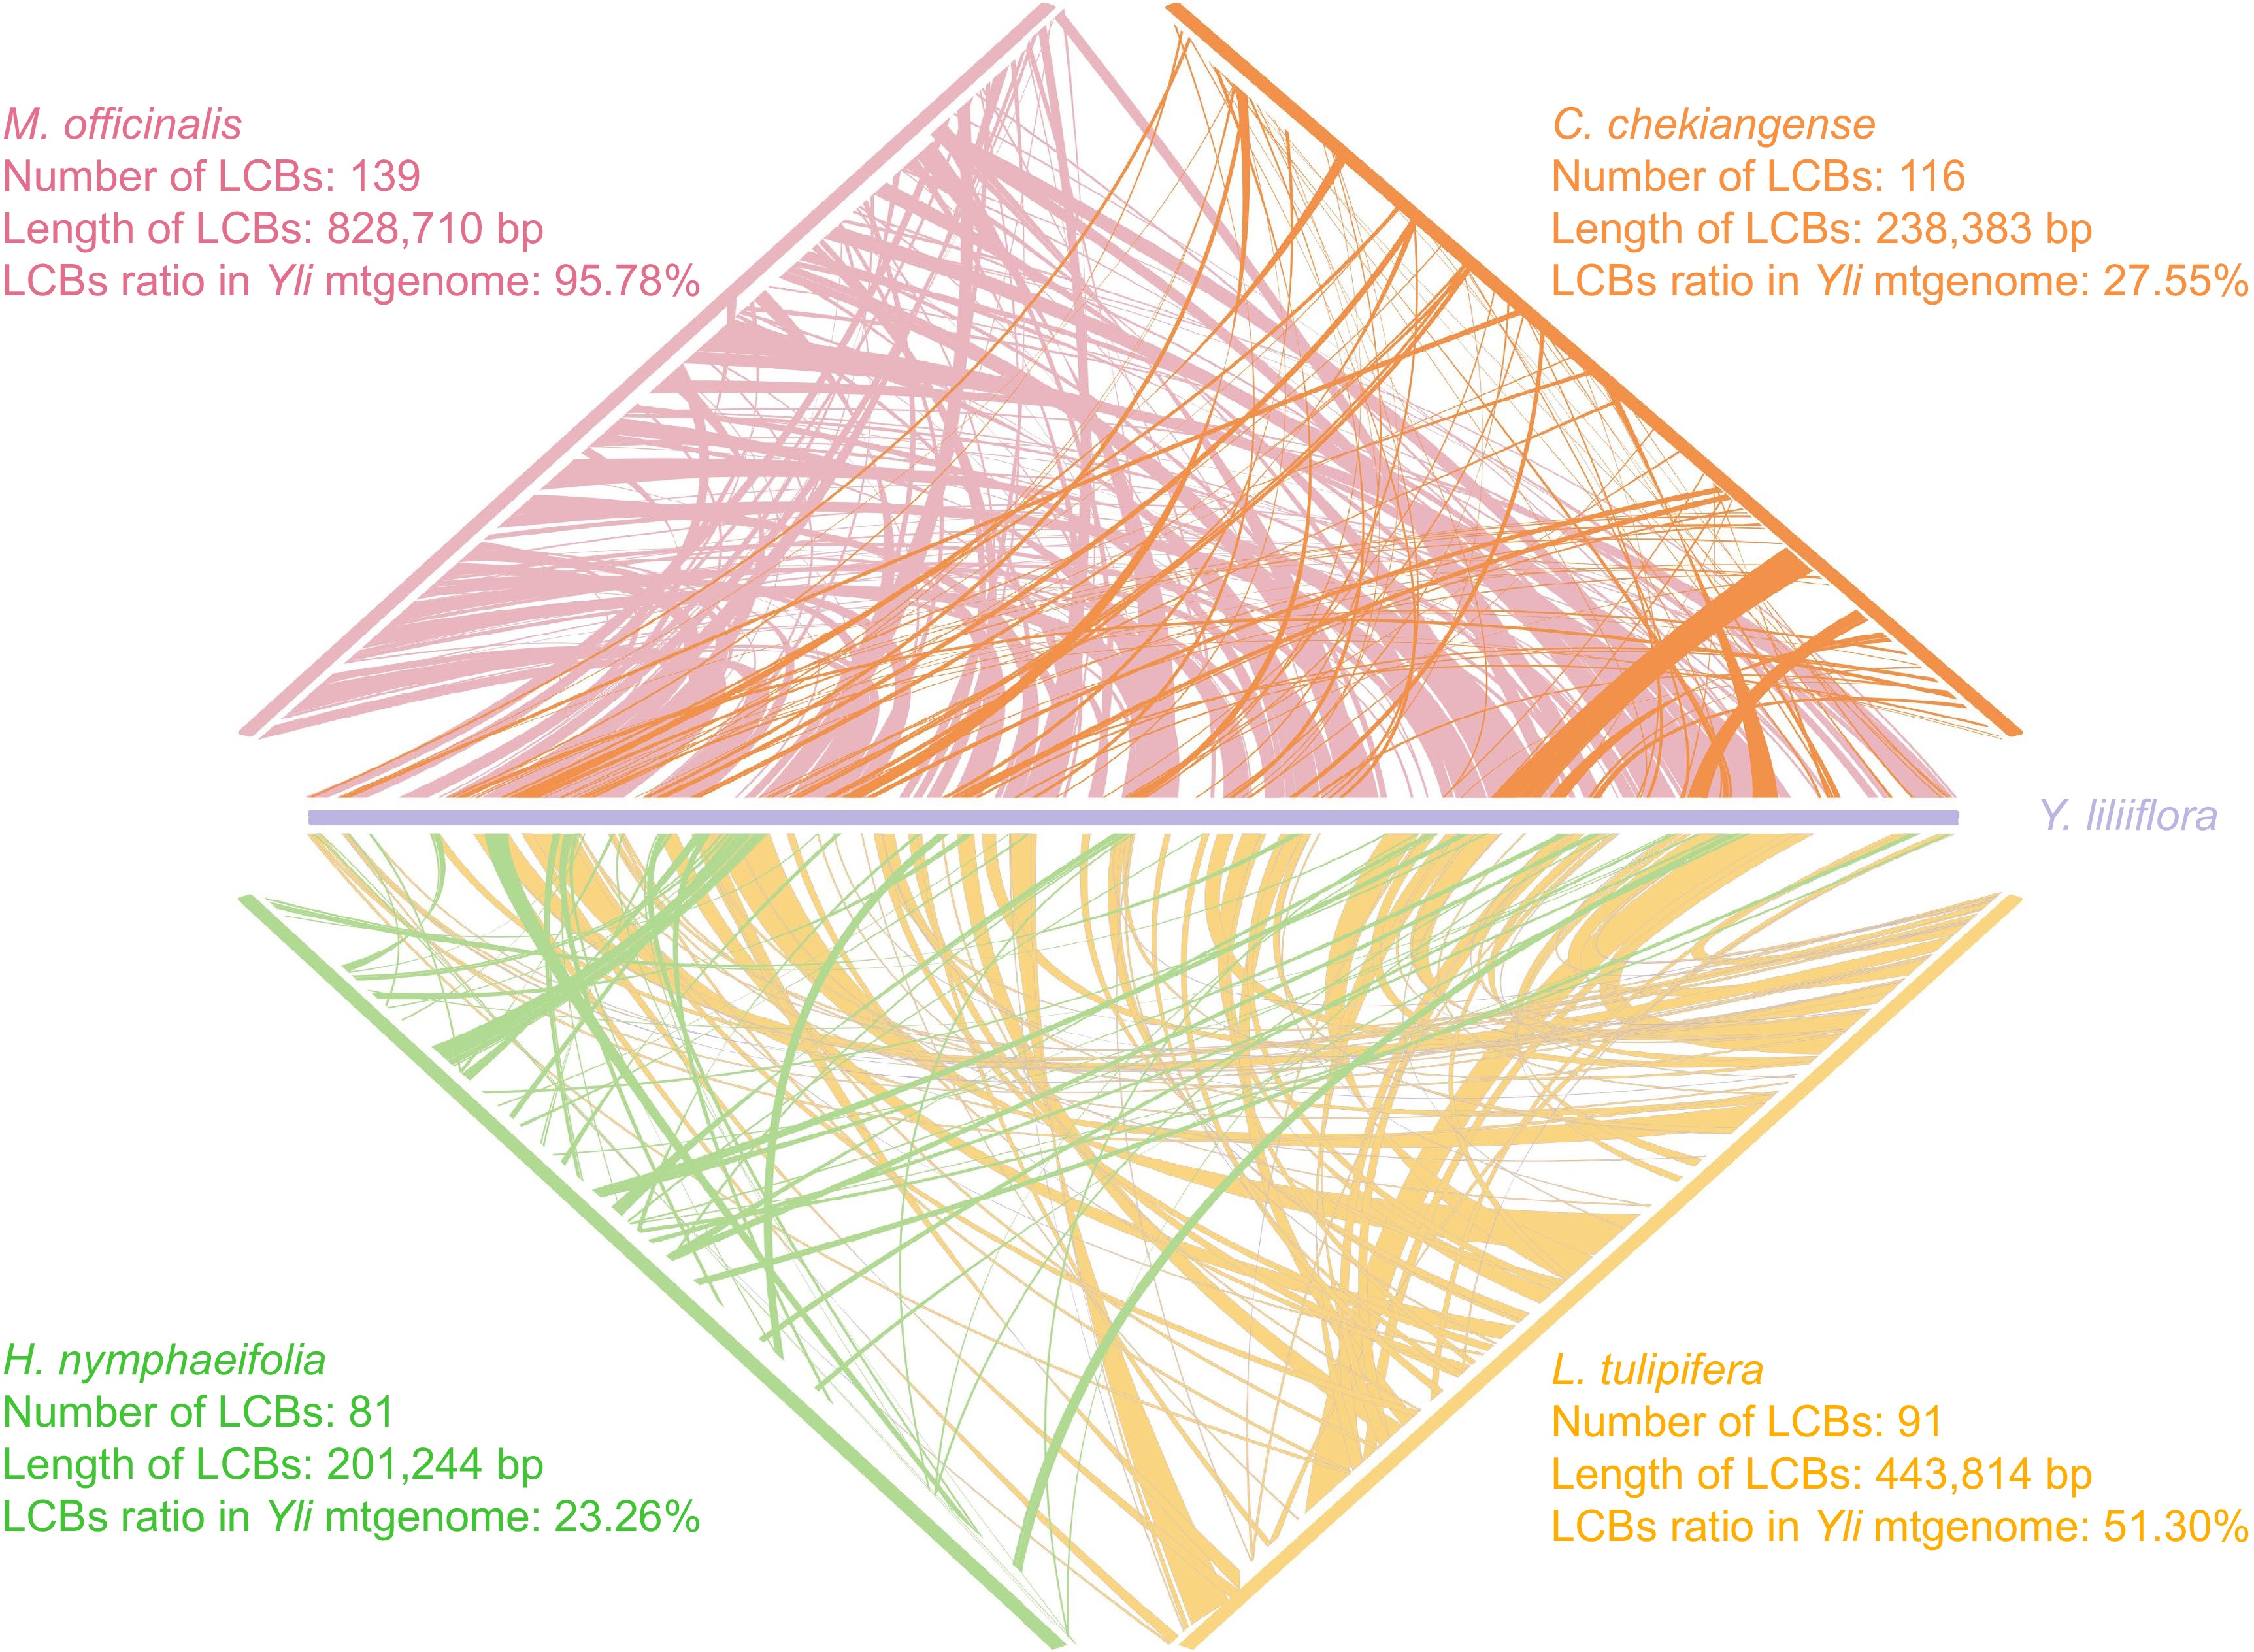
Figure 8.
Mitogenome synteny of five species. The purple, pink, orange, yellow, and green legends represent Y. liliiflora, M. officinalis, C. chekiangense, L. tulipifera, and H. nymphaeifolia, respectively.
-
Group of genes Gene name Length (bp) Start codon Stop codon Amino acids ATP synthase atp1 1,530 ATG TGA 509 atp4 × 2 582 ATG TAA 193 atp6 720 ATG CAA 239 atp8 480 ATG TAA 159 atp9 225 ATG TAA 74 NADH dehydrogenase nad1**++ 978 ACG TAA 325 nad2***+ 1,467 ATG TAA 488 nad3 × 2 357 ATG TAA 118 nad4*** 1,488 ATG TGA 495 nad4L 303 ACG TAA 100 nad5**++ 2,013 ATG TAA 670 nad6 735 ATG TGA 244 nad7**** 1,185 ATG TAG 394 nad9 573 ATG TAA 190 Cytohrome c biogenesis ccmB 621 ATG TGA 206 ccmC 960 ATG TAA 319 ccmFc* 1,329 ATG CGA 442 ccmFn 1,806 ATG TAG 601 Maturases matR 1,959 ATG TAG 652 Ubichinol cytochrome c reductase cob 1,182 ATG TGA 393 Cytochrome c oxidase cox1 1,584 ACG TAA 527 cox2** 765 ATG TAA 254 cox3 798 ATG TGA 265 Transport membrance protein mttb 768 ACG TGA 255 Ribosomal proteins (LSU) rpl2* 1,665 ATG TAG 554 rpl5 561 ATG TAA 186 rpl10 471 ATG TAA 156 rpl16 435 GTG TAA 144 Ribosomal proteins (SSU) rps1 693 ATG TAG 230 rps2 657 ATG TAA 218 rps3* 1,572 ATG TAA 523 rps4 1,071 ACG TAA 356 rps7 × 2 450 ATG TAA 149 rps10* 360 ACG TGA 119 rps11 516 ATG CAA 171 rps12 × 2 378 ATG TGA 125 rps13 351 ATG TGA 116 rps14 303 ATG TAG 100 rps19 282 ATG TAA 93 Succinate dehydrogenase sdh3 330 ATG TAA 109 sdh4 447 ATG TGA 148 Transfer RNAs trnC-GCA 71 − − − trnD-GUC 74 − − − trnE-UUC 72 − − − trnF-GAA 74 − − − trnfM-CAU 74 − − − trnG-GCC 72 − − − trnH-GUG 74 − − − trnI-CAU 74 − − − trnK-UUU 73 − − − trnL-CAA 74 − − − trnM-CAU 73 − − − trnN-GUU 72 − − − trnP-UGG 75 − − − trnQ-UUG 72 − − − trnR-ACG 79 − − − trnS-GCU 88 − − − trnS-UGA 87 − − − trnV-GAC 72 − − − trnV-UAC 73 − − − trnW-CCA 74 − − − trnY-GUA 83 − − − Ribosomal RNAs rrn5 118 − − − rrnL 3,710 − − − rrnS 2,087 − − − The numbers following the gene names indicate the number of copies. * Indicates the number of cis-splicing genes, while + indicates the number of trans-splicing genes. Table 1.
The physical placements and functional categorizations of the Y. liliiflora mitochondrial genome (mitogenome).
Figures
(8)
Tables
(1)