-
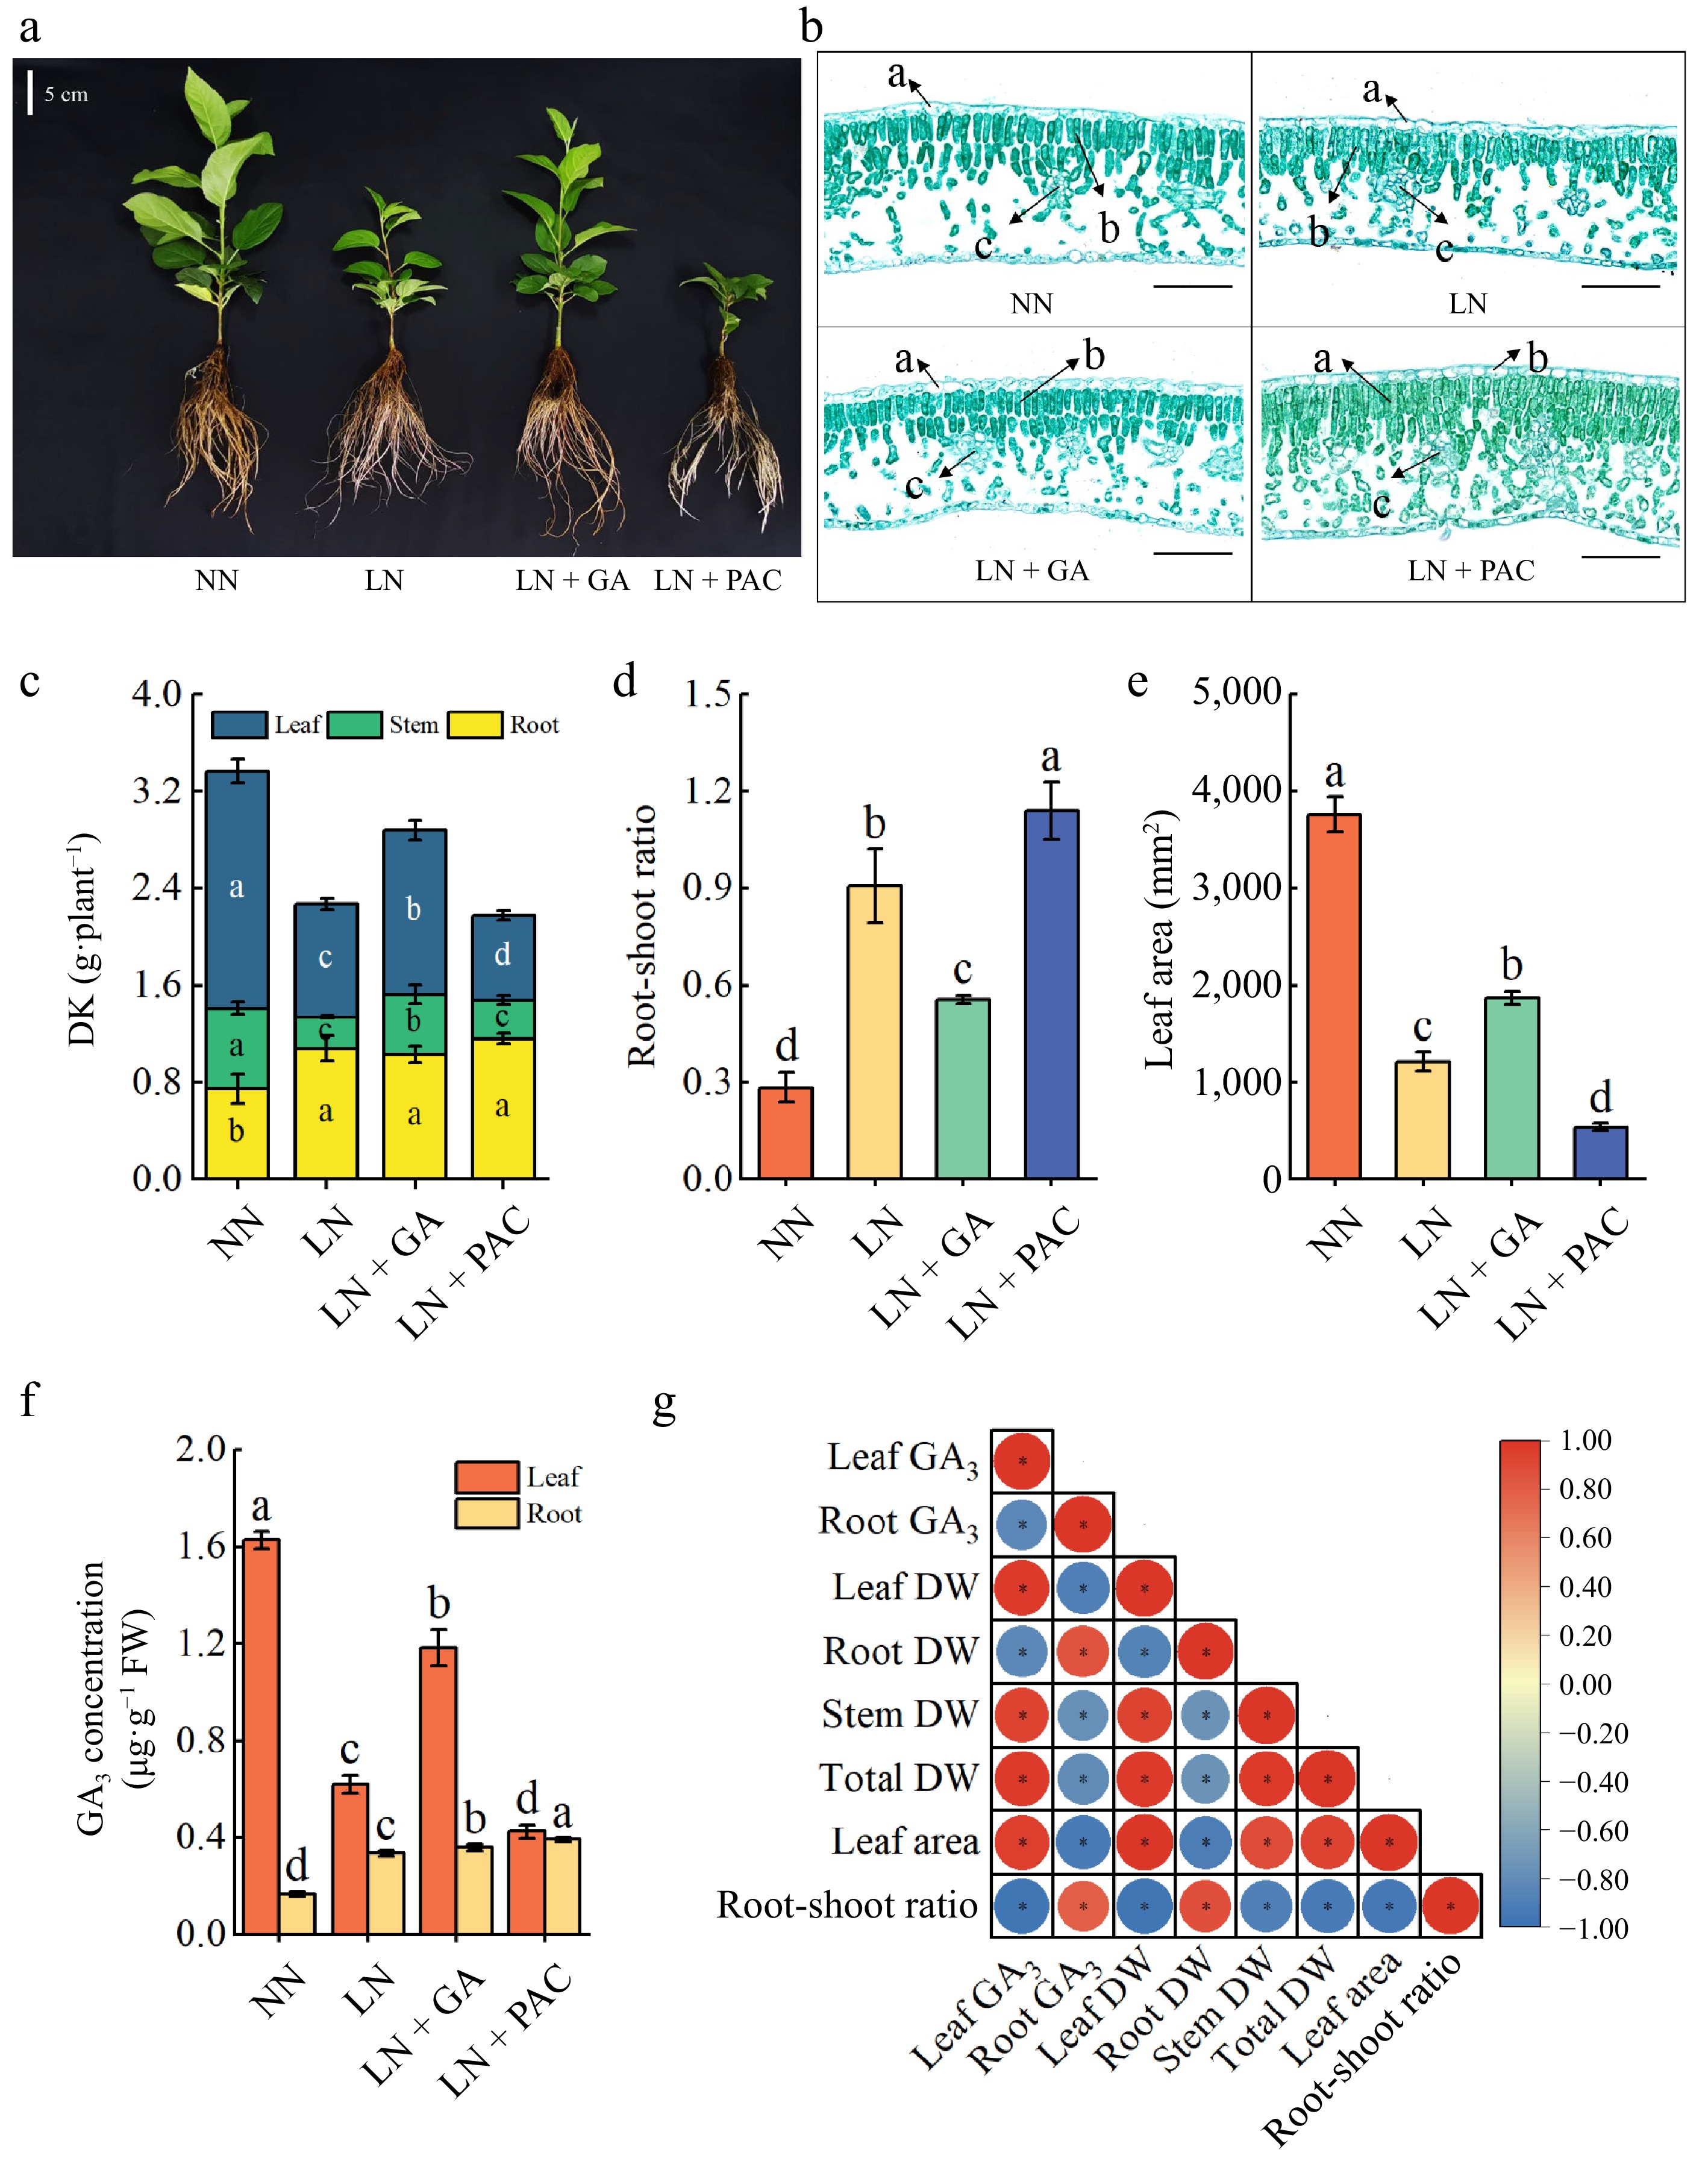
Figure 1.
Effects of exogenous GA3 and PAC on the (a) growth, (b) leaf anatomical structure, (c) dry weight, (d) root-shoot ratio, (e) leaf area, and (f) endogenous GA3 concentration of apple rootstocks under low-N stress, and (g) correlation analysis. In (b), 'a' represents epidermis, 'b' represents palisade tissue, 'c' represents vascular bundle, and the scale is 100 μm. DW: dry weight; NN: plants under normal N supply (5 mM NO3−); LN: plants under low N supply (0.5 mM NO3−); GA: GA3; PAC: paclobutrazol. Vertical lines indicate the standard deviation (± SD) for a sample size of n = 5. The presence of different letters indicates a statistically significant difference at the 5% level (p < 0.05).
-
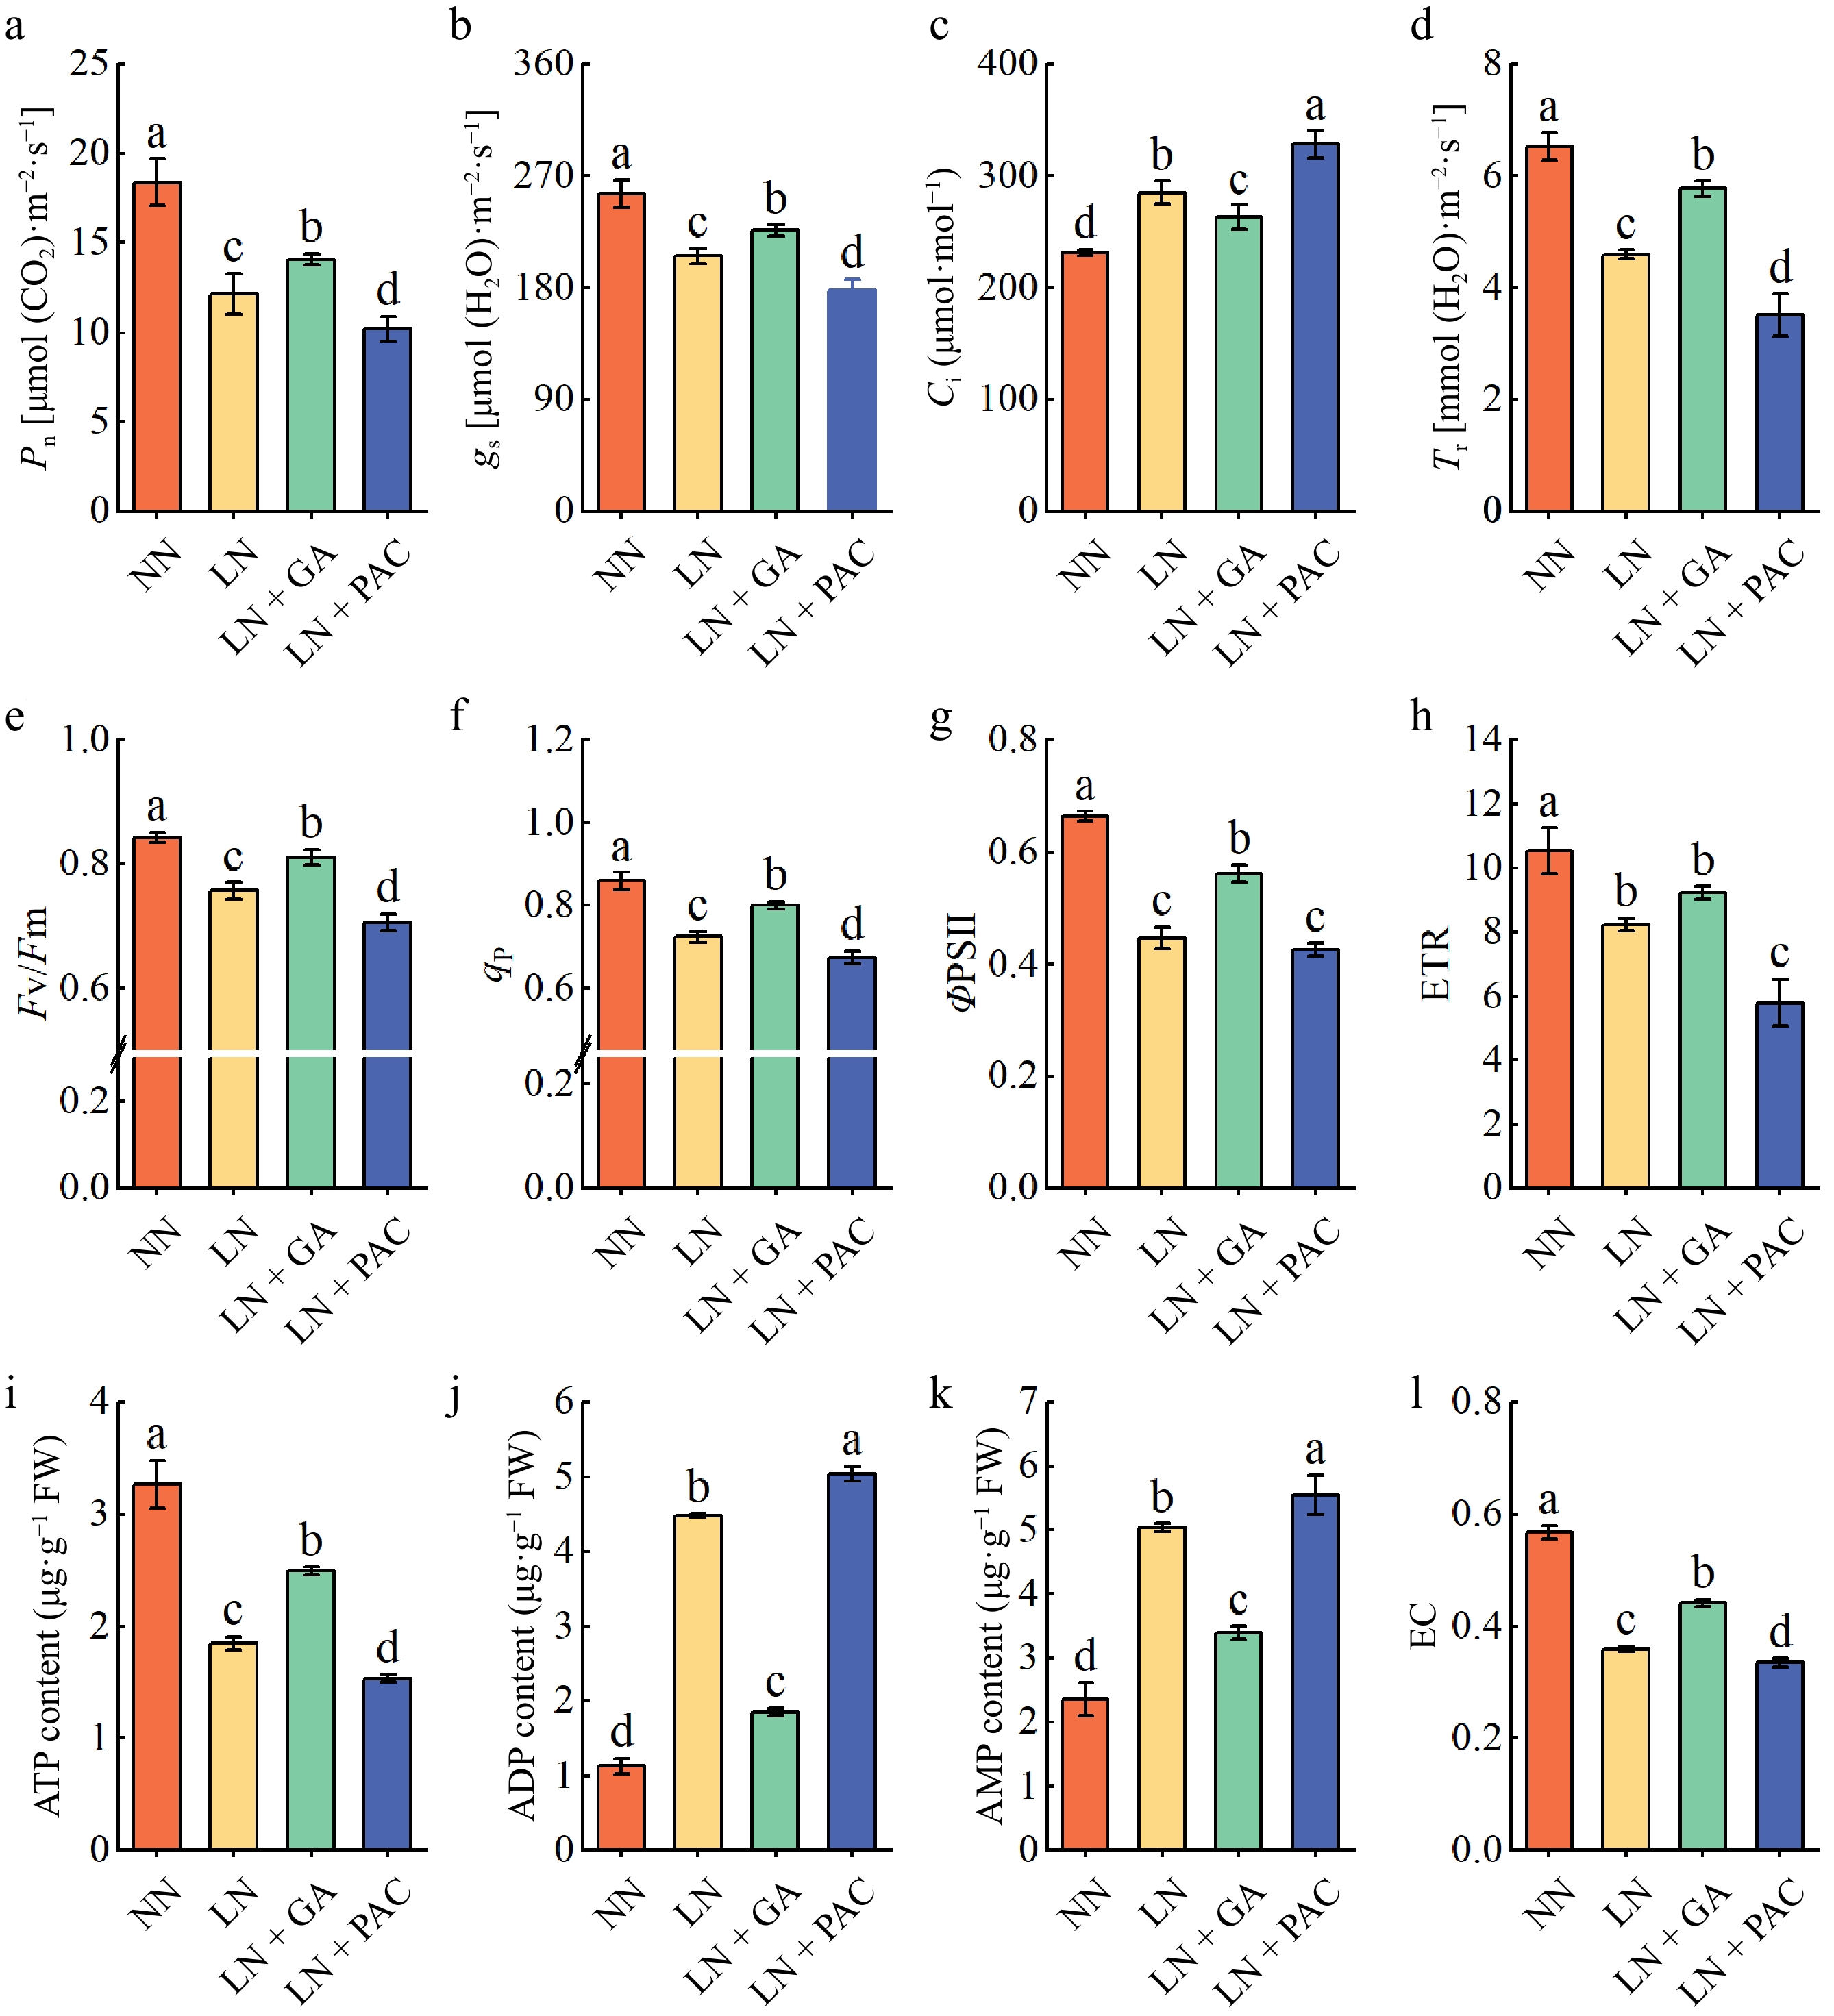
Figure 2.
Effects of exogenous GA3 and PAC on photosynthetic parameters (a) Pn; (b) gs; (c) Ci; (d) Tr, chlorophyll fluorescence (e) Fv/Fm; (f) qp; (g) ΦPSII; (h) ETR, and energy states (i) ATP content in leaves; (j) ADP content in leaves; (k) AMP content in leaves; (l) EC in leaves of apple rootstocks under low-N stress. ΦPSII: PSII actual photochemical efficiency; Fv/Fm: maximum photochemical quantum yield of PSII; qp: photochemical quenching coefficient; ETR: linear electron transfer rate; EC: energy charge; NN: plants under normal N supply (5 mM NO3−); LN: plants under low N supply (0.5 mM NO3−); GA: GA3; PAC: paclobutrazol. Vertical lines indicate the standard deviation (± SD) for a sample size of n = 5. The presence of different letters indicates a statistically significant difference at the 5% level (p < 0.05).
-
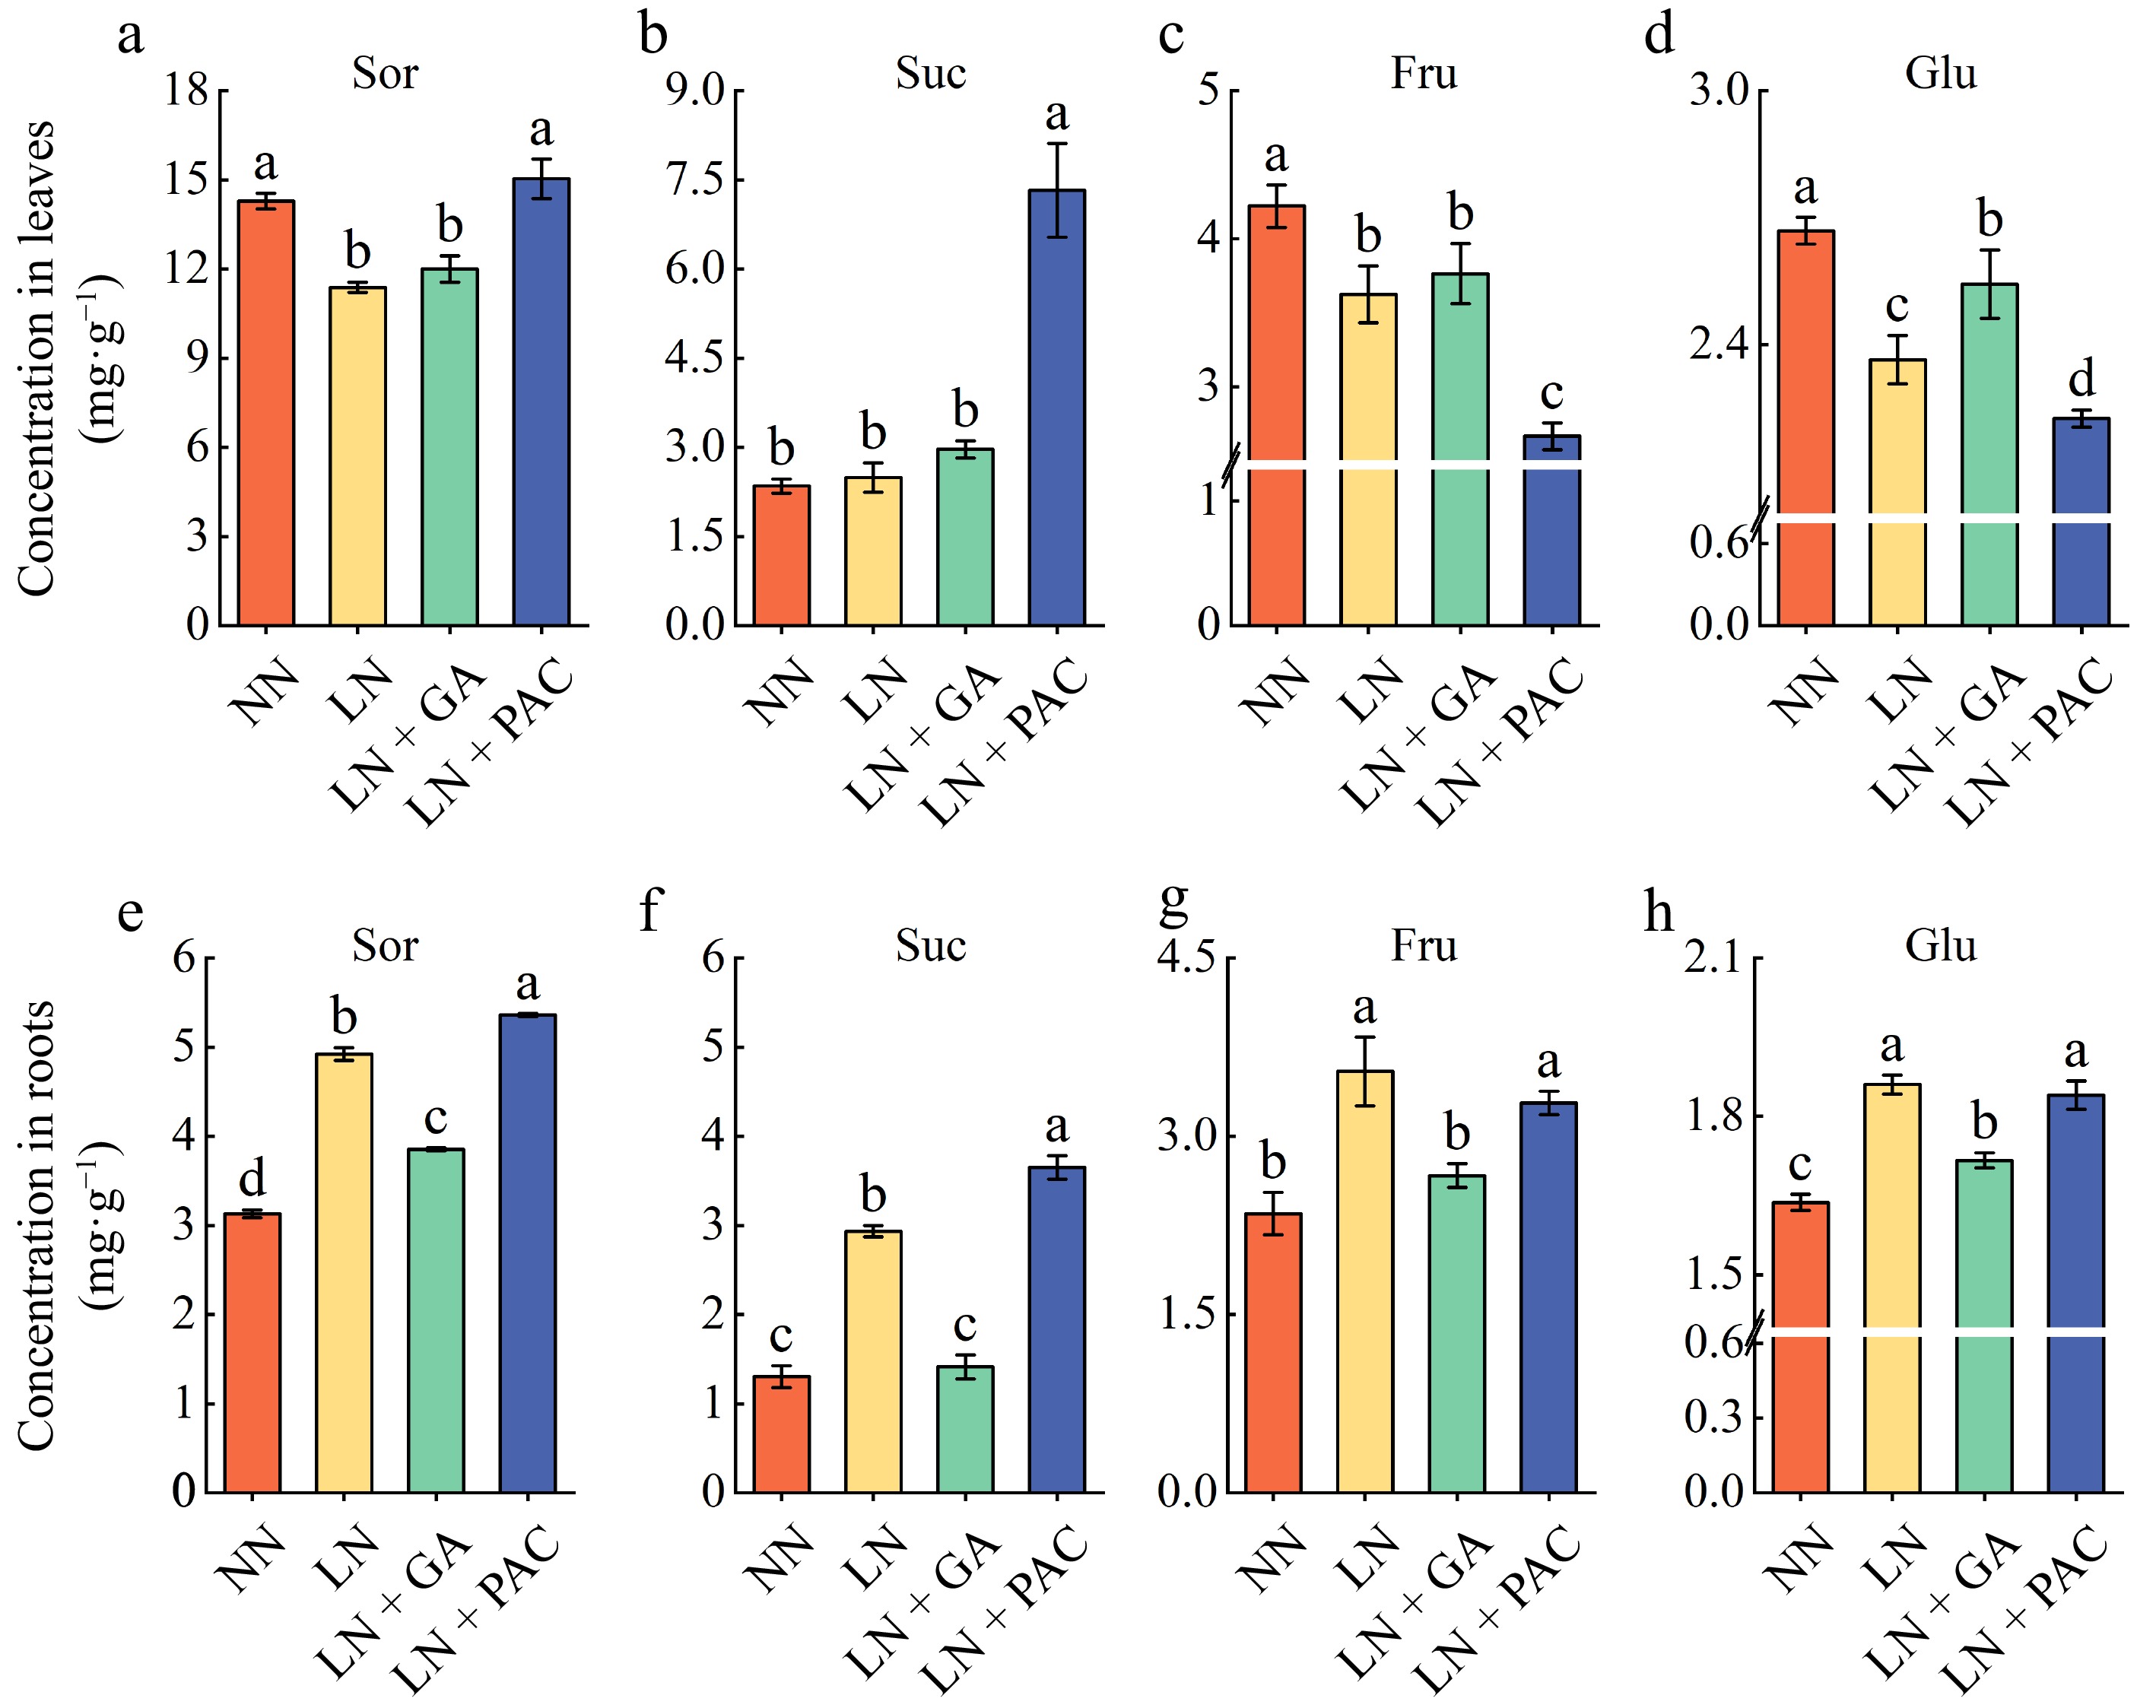
Figure 3.
Effects of exogenous GA3 and PAC on soluble sugar concentrations of apple rootstocks under low-N stress. The Sor concentration in (a) leaves and (e) roots. The Suc concentration in (b) leaves and (f) roots. The Fru concentration in (c) leaves and (g) roots. The Glu concentration in (c) leaves and (g) roots. Sor: sorbitol; Suc: sucrose; Fru: fructose; Glu: glucose; NN: plants under normal N supply (5 mM NO3−); LN: plants under low N supply (0.5 mM NO3−); GA: GA3; PAC: paclobutrazol. Vertical lines indicate the standard deviation (± SD) for a sample size of n = 5. The presence of different letters indicates a statistically significant difference at the 5% level (p < 0.05).
-
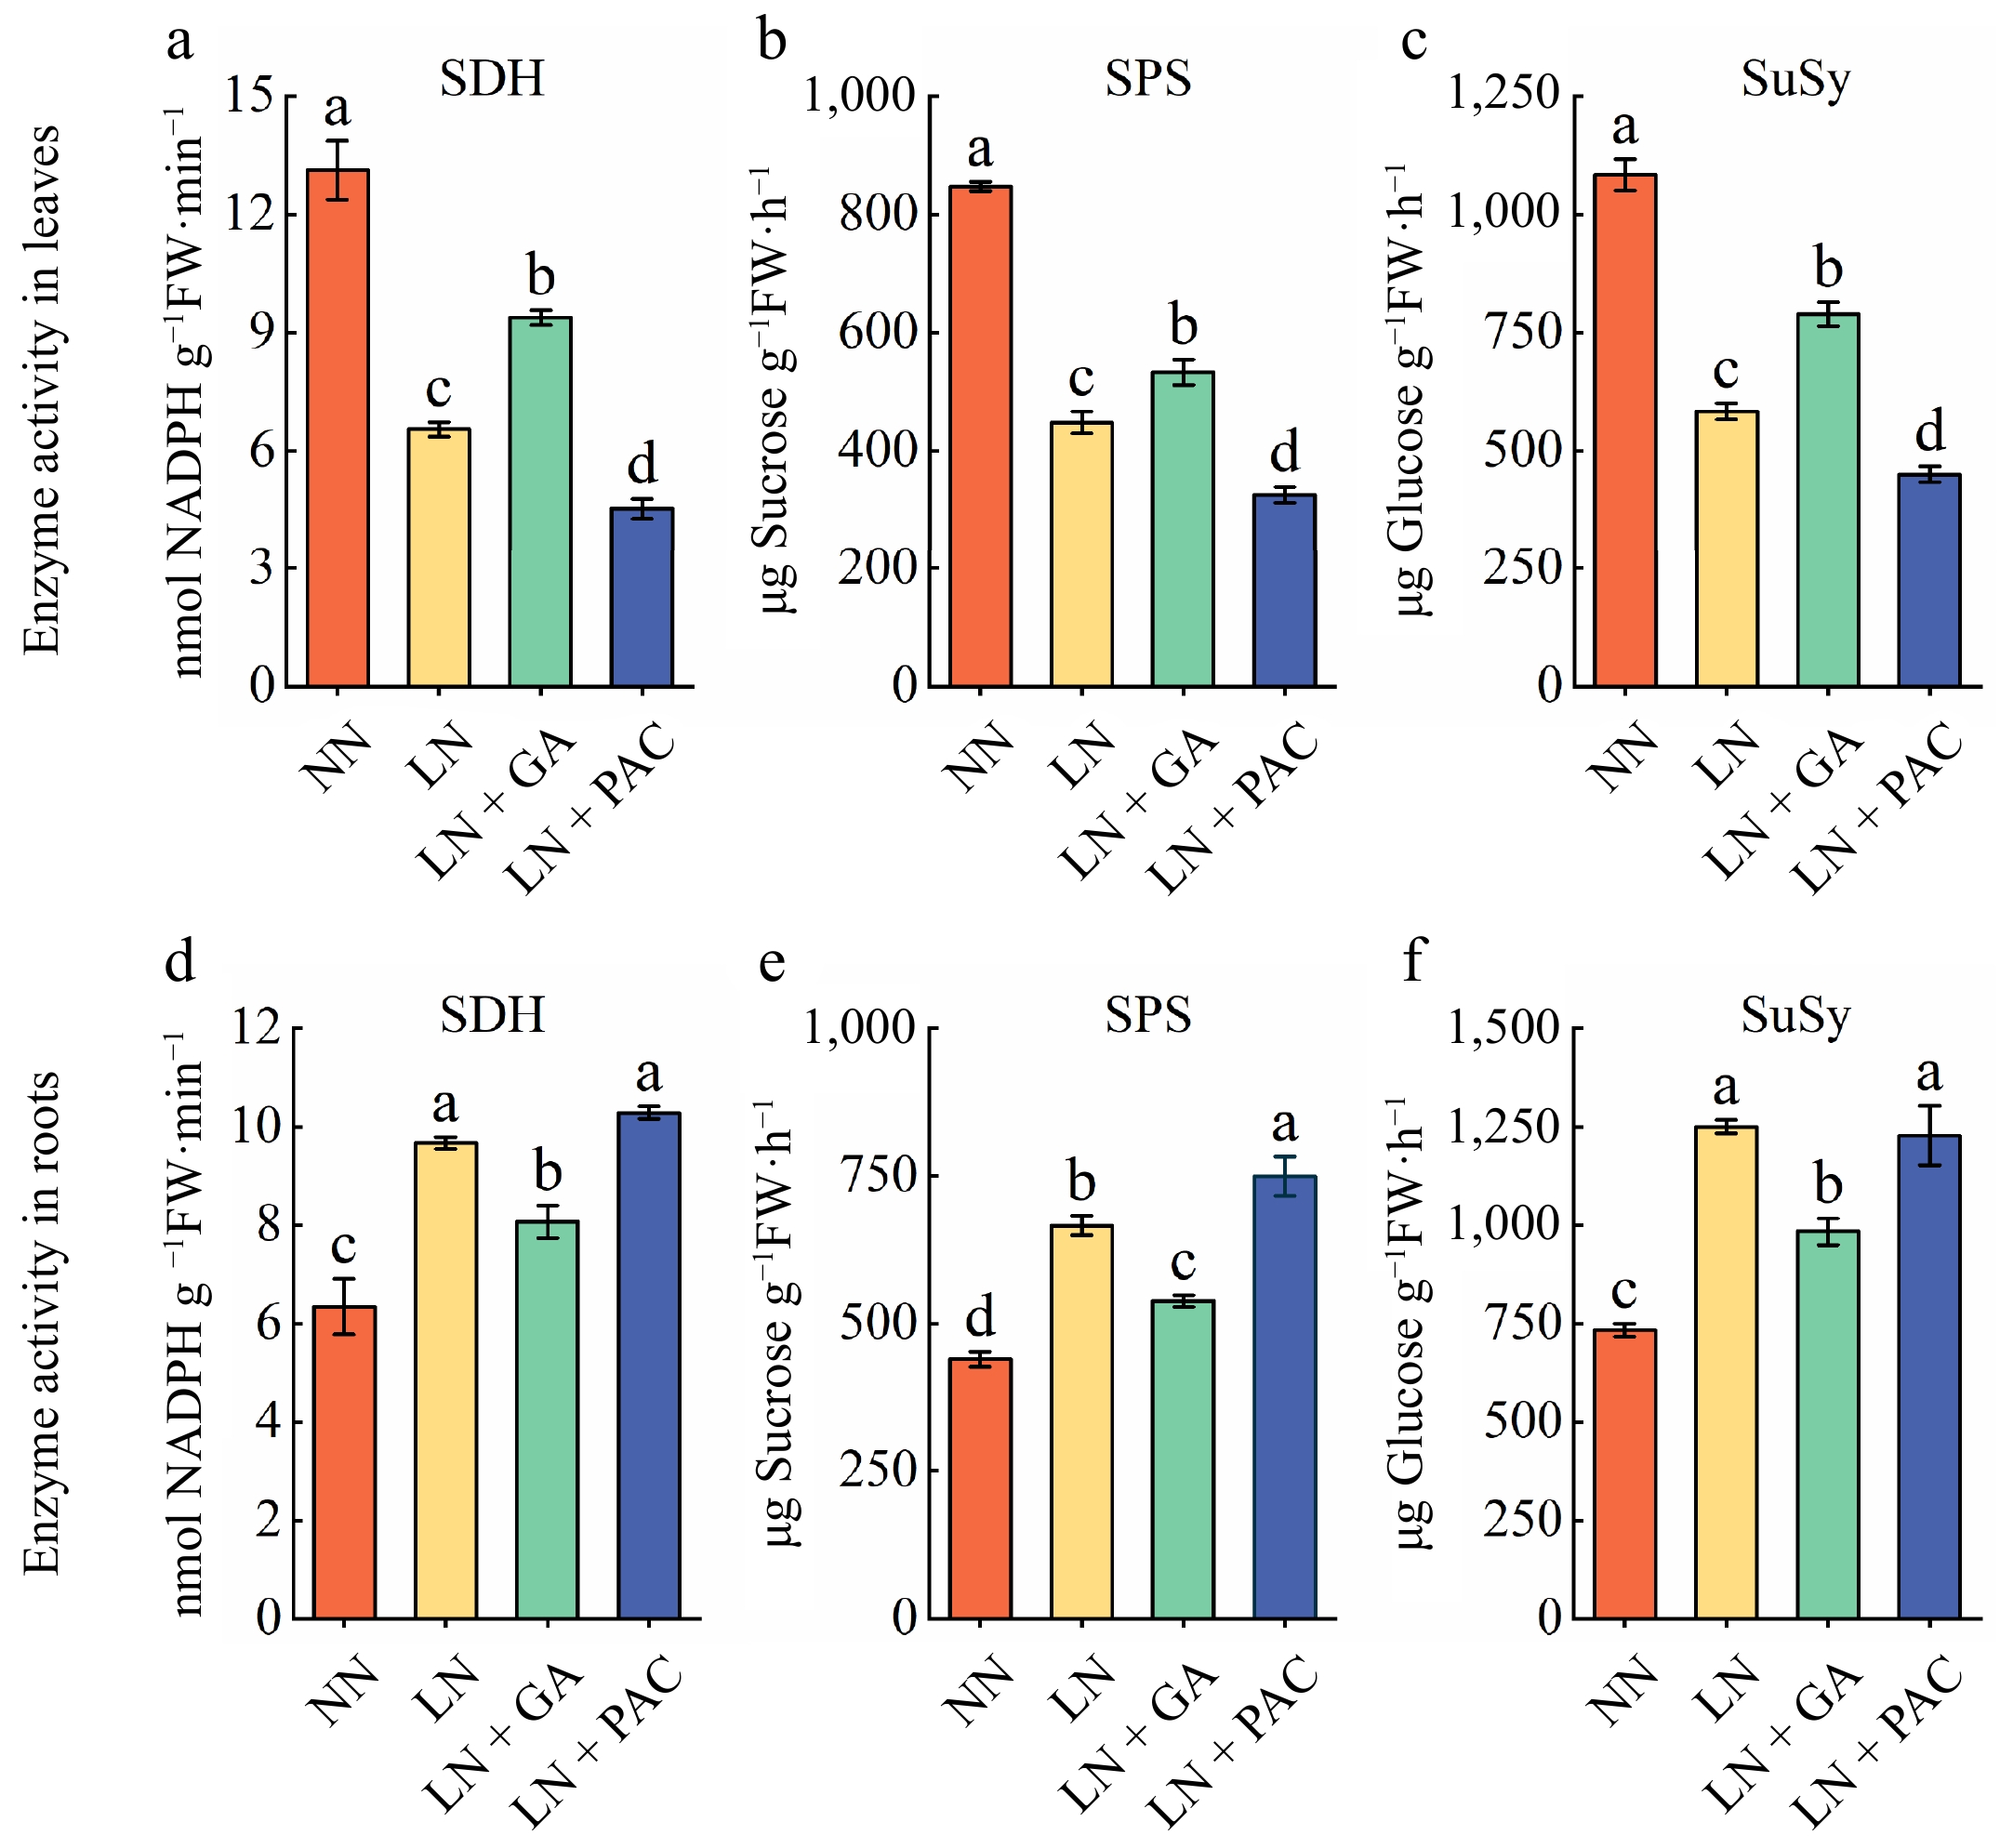
Figure 4.
Effects of exogenous GA3 and PAC on sugar-metabolizing enzyme activities of apple rootstocks under low-N stress. The SDH activity in (a) leaves and (d) roots. The SPS activity in (b) leaves and (e) roots. The SuSy activity in (c) leaves and (f) roots. SDH: sorbitol dehydrogenase; SPS: sucrose-phosphate synthase; SuSy: sucrose synthase; NN: plants under normal N supply (5 mM NO3−); LN: plants under low N supply (0.5 mM NO3−); GA: GA3; PAC: paclobutrazol. Vertical lines indicate the standard deviation (± SD) for a sample size of n = 5. The presence of different letters indicates a statistically significant difference at the 5% level (p < 0.05).
-
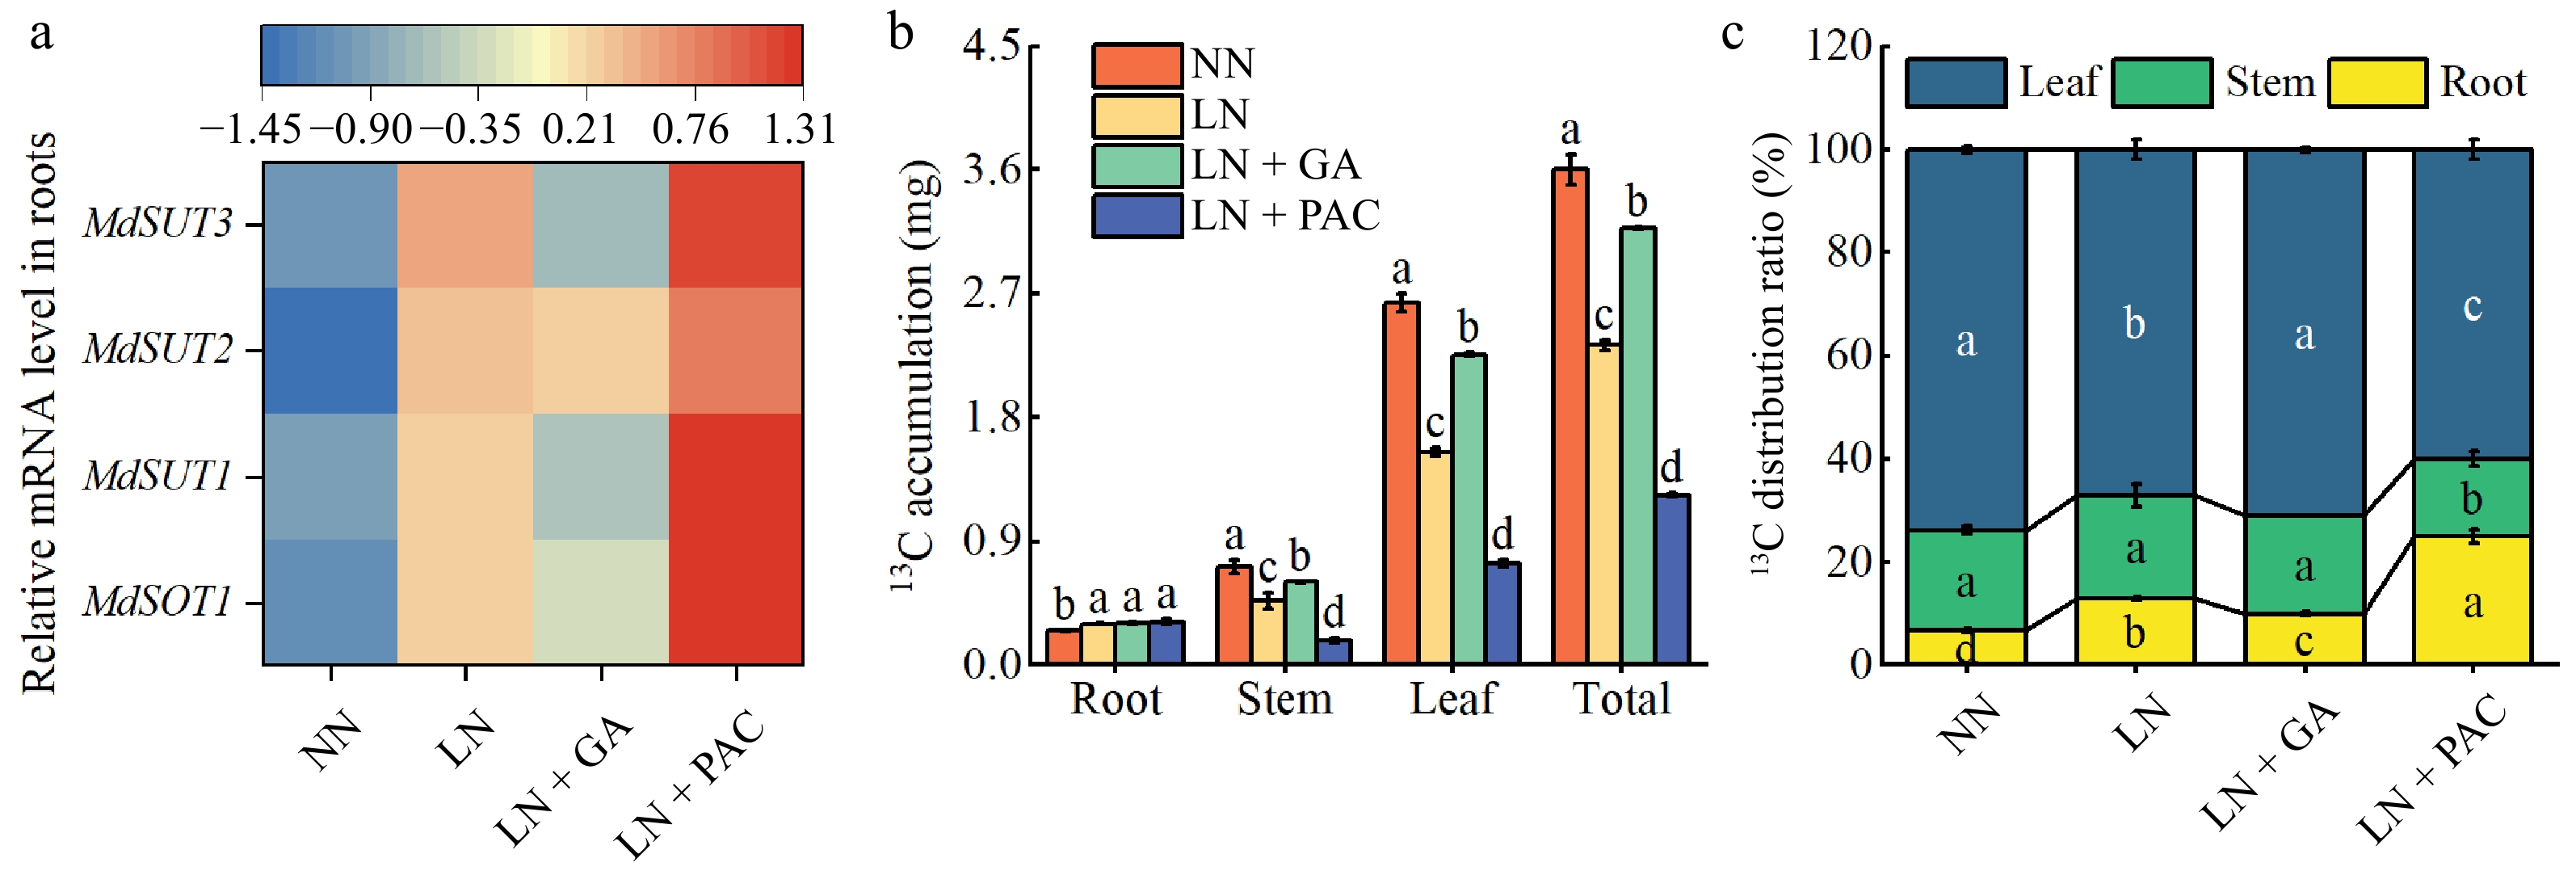
Figure 5.
Effects of exogenous GA3 and PAC on transcription levels of genes encoding (a) sugar transporters, (b) 13C accumulation, and (c) 13C distribution ratio of apple rootstocks under LN stress; NN: plants under normal N supply (5 mM NO3−); LN: plants under low N supply (0.5 mM NO3−); GA: GA3; PAC: paclobutrazol. Vertical lines indicate the standard deviation (± SD) for a sample size of n = 5. The presence of different letters indicates a statistically significant difference at the 5% level (p < 0.05).
-
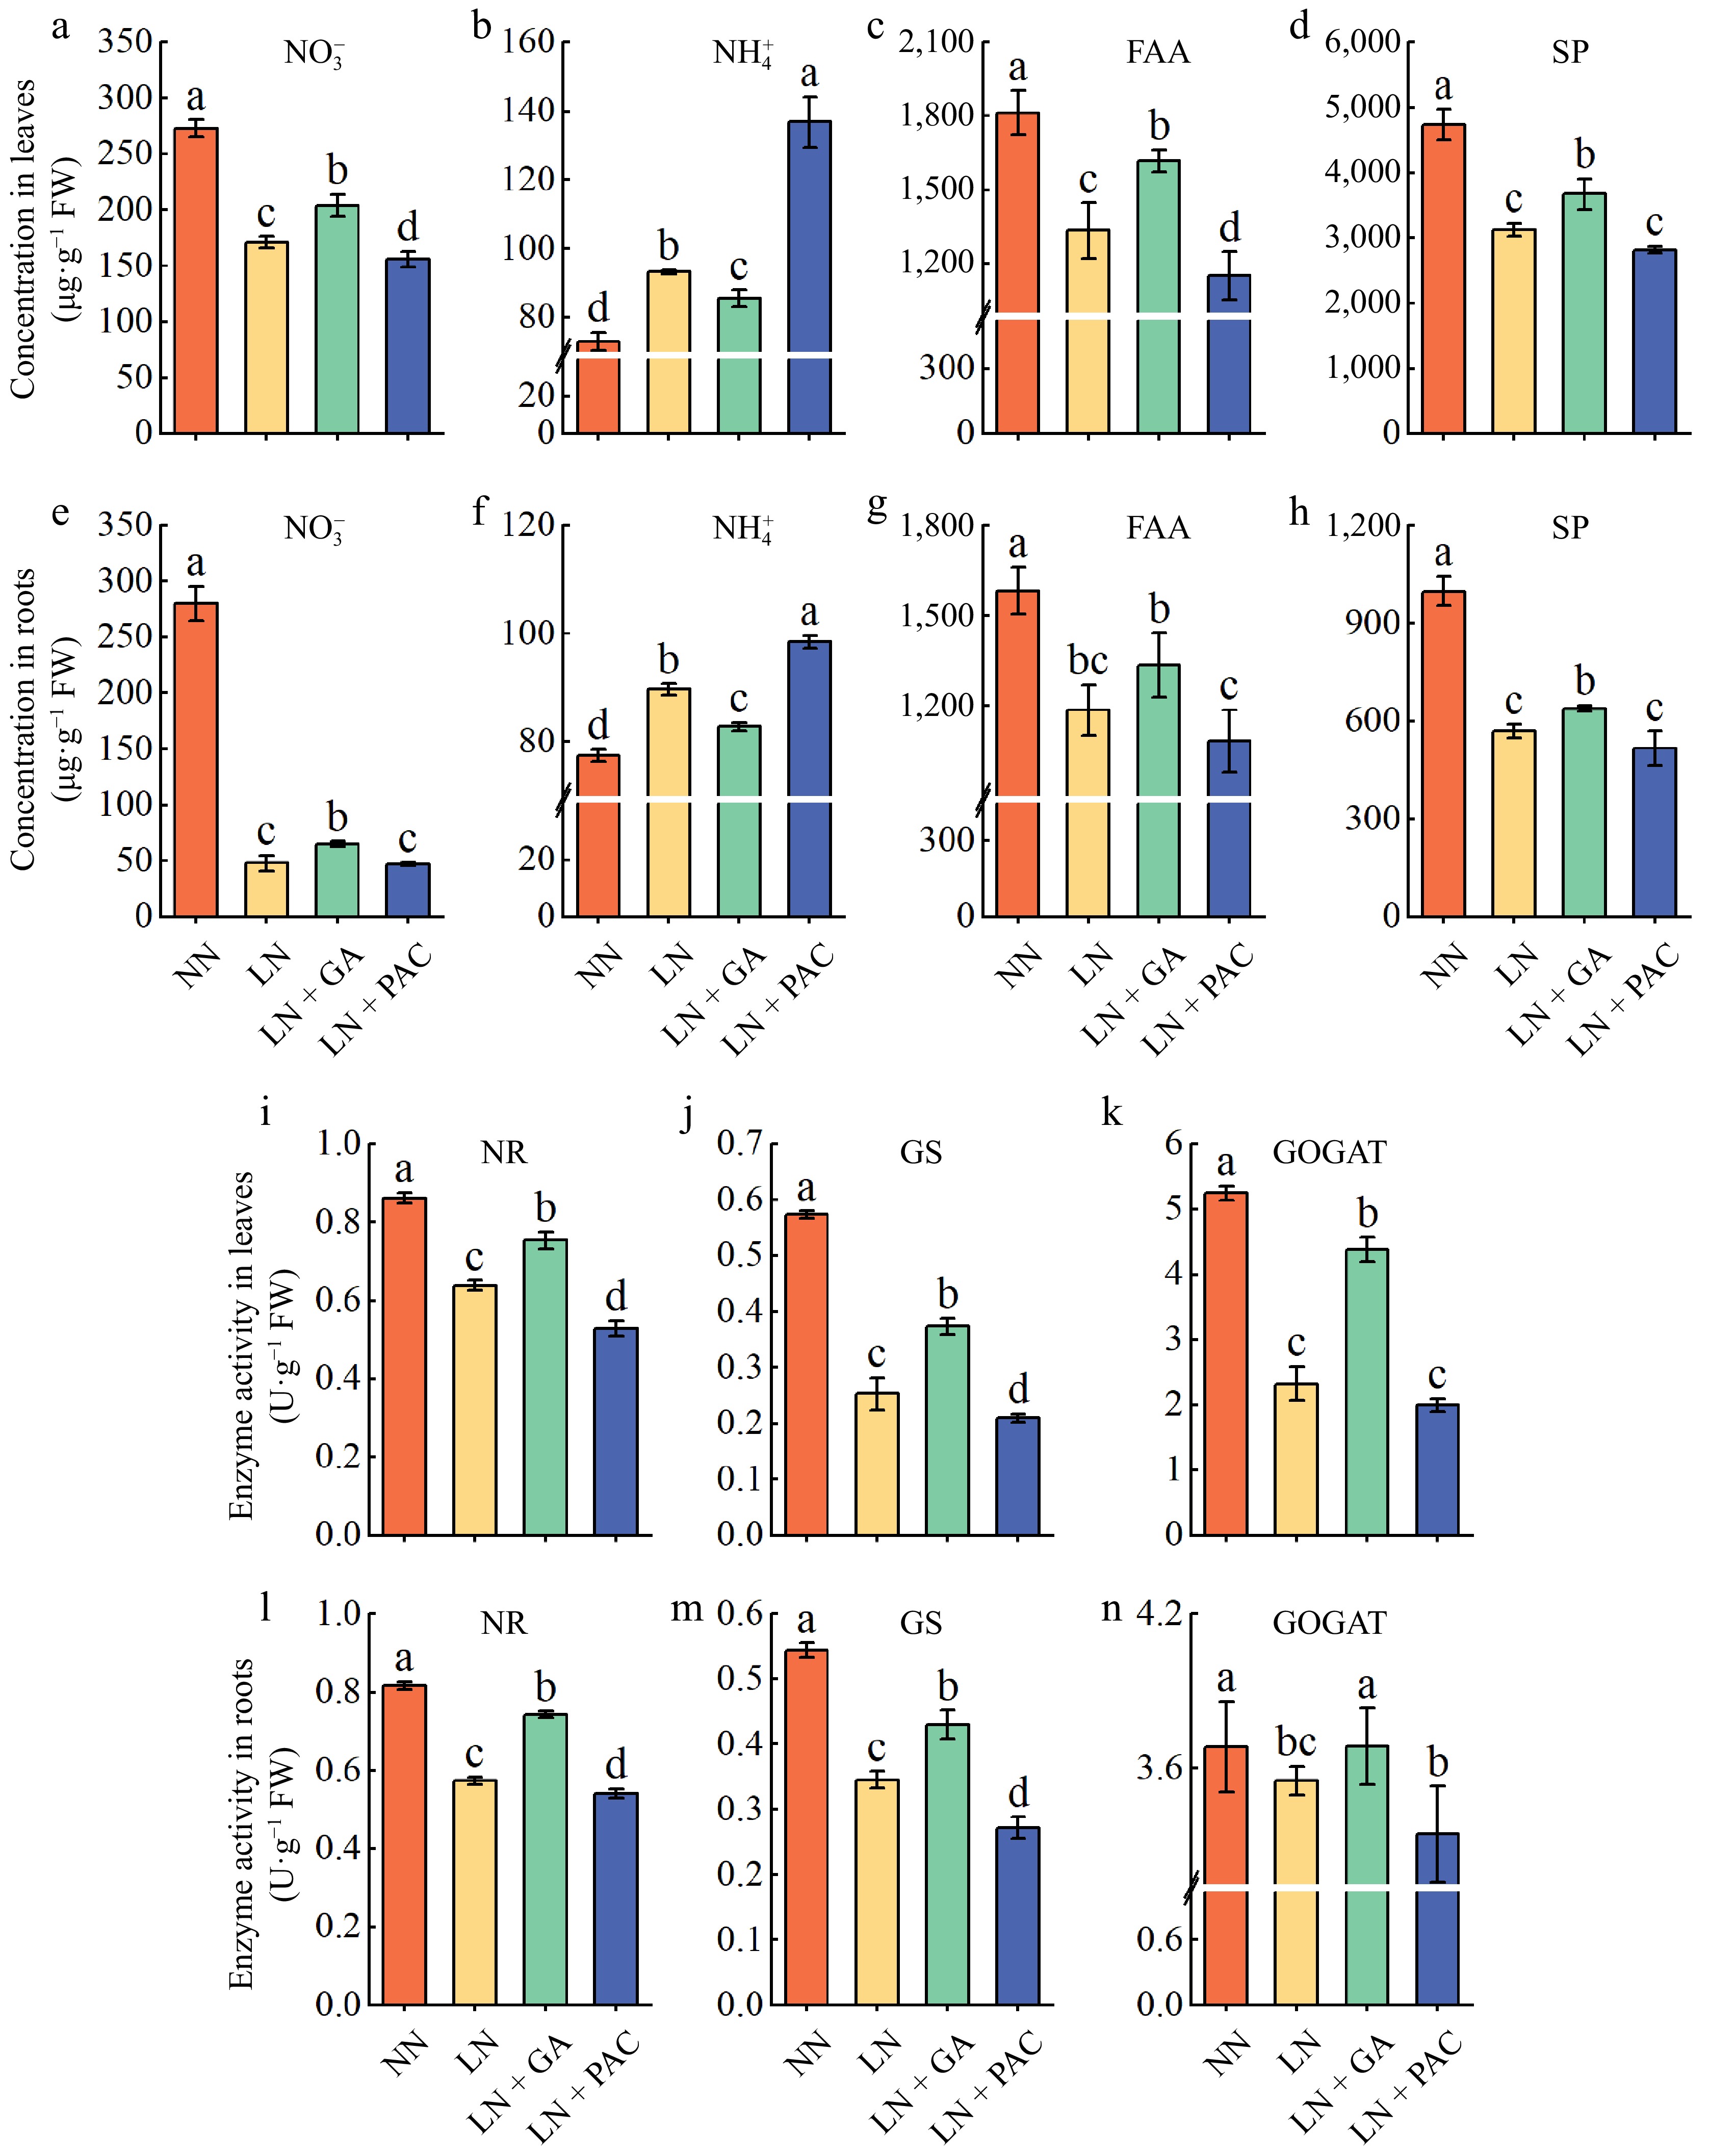
Figure 6.
Effects of exogenous GA3 and PAC on the concentration of N metabolism intermediates and N metabolism enzyme activities of apple rootstocks under low-N stress. The NO3− concentration in (a) leaves and (e) roots. The NH4+ concentration in (b) leaves and (f) roots. The FAA concentration in (c) leaves and (g) roots. The SP concentration in (c) leaves and (g) roots. The NR activity in (i) leaves and (l) roots. The GS activity in (j) leaves and (m) roots. The GOGAT activity in (k) leaves and (n) roots. FAA: free amino acid; SP: soluble protein; NR: nitrate reductase; GS: glutamine synthetase; GOGAT: glutamate synthase; NN: plants under normal N supply (5 mM NO3−); LN: plants under low N supply (0.5 mM NO3−); GA: GA3; PAC: paclobutrazol. Vertical lines indicate the standard deviation (± SD) for a sample size of n = 5. The presence of different letters indicates a statistically significant difference at the 5% level (p < 0.05).
-
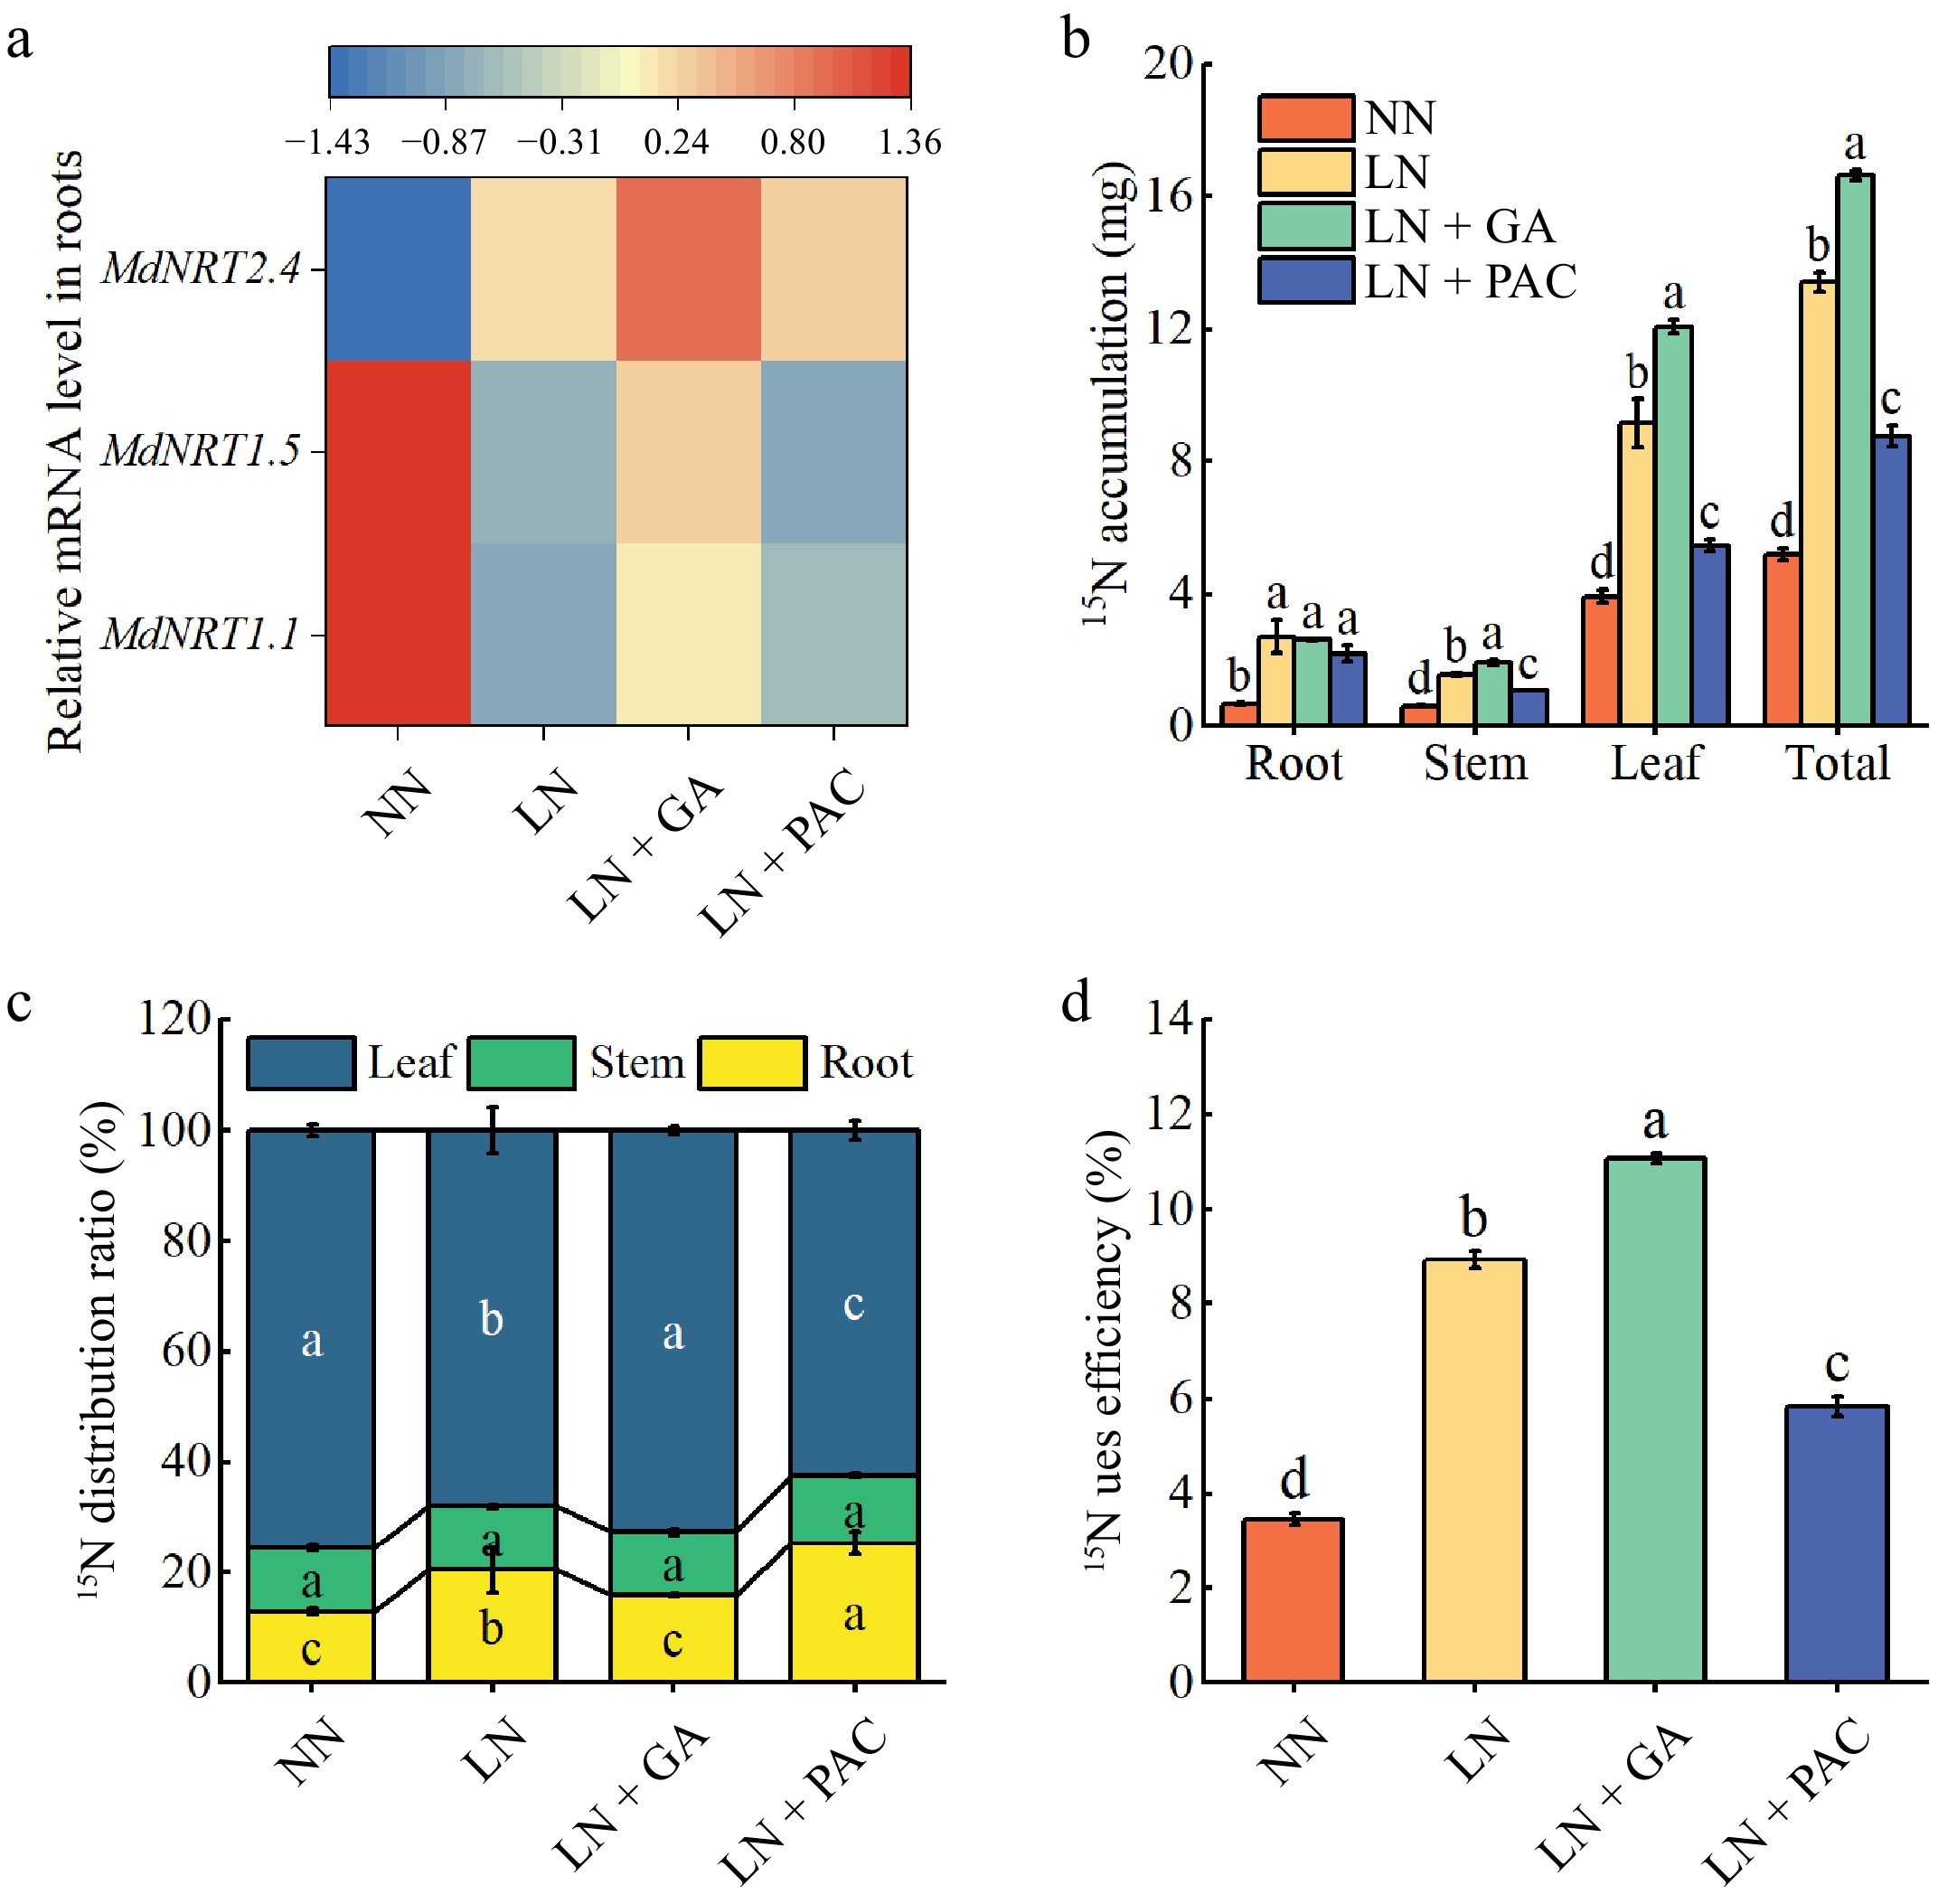
Figure 7.
Effects of exogenous GA3 and PAC on transcription levels of genes encoding (a) NO3− transporters, (b) 15N accumulation, (c) 15N distribution ratio, and (d) 15N use efficiency of apple rootstocks under low-N stress; NN: plants under normal N supply (5 mM NO3−); LN: plants under low N supply (0.5 mM NO3−); GA: GA3; PAC: paclobutrazol. Vertical lines indicate the standard deviation (± SD) for a sample size of n = 5. The presence of different letters indicates a statistically significant difference at the 5% level (p < 0. 05).
-
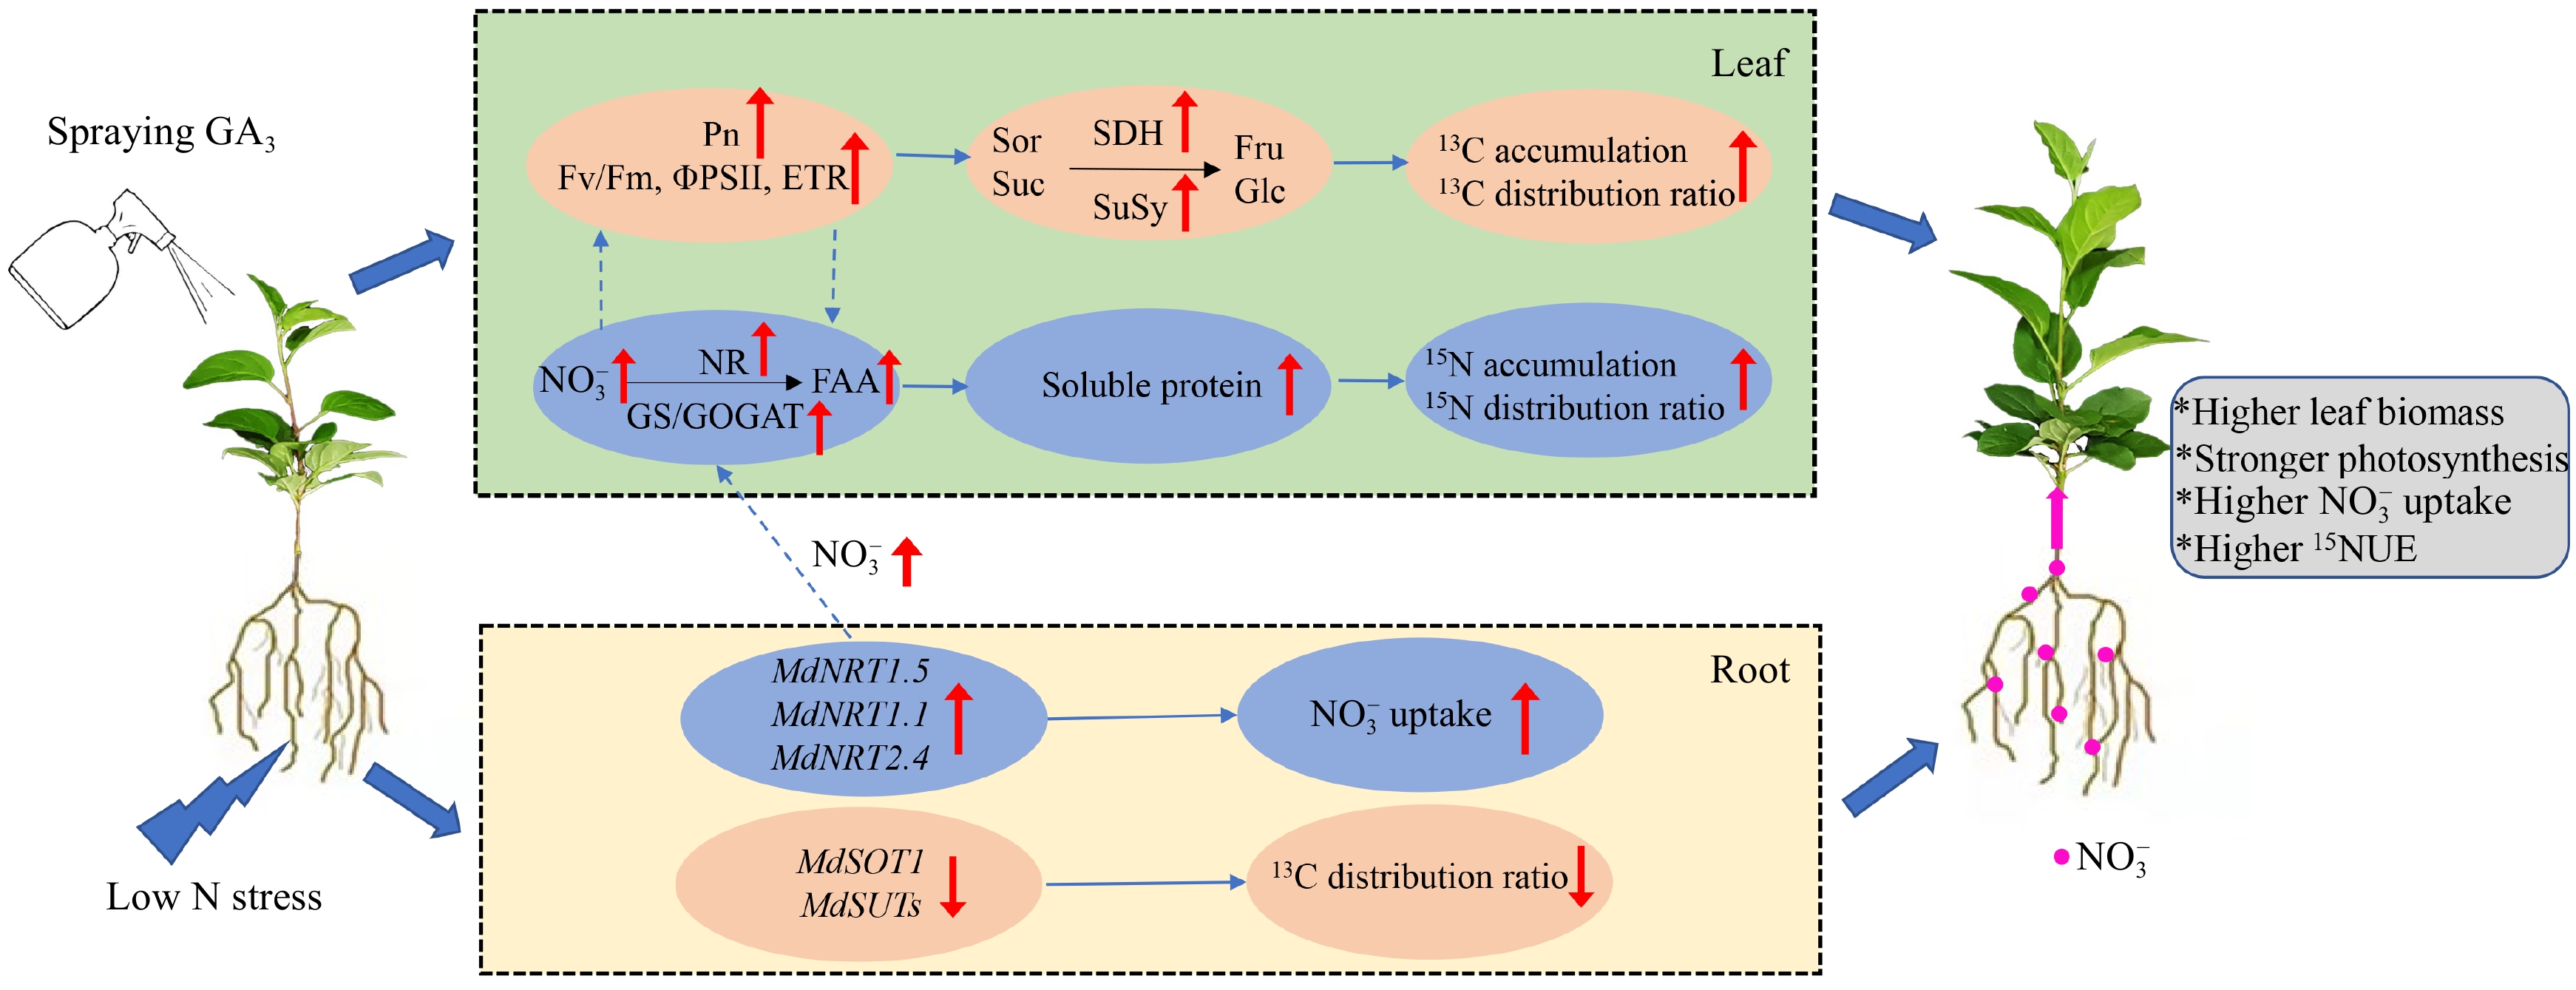
Figure 8.
Schematic model displaying the role of exogenous GA3 on low N stress of apple rootstocks.
Figures
(8)
Tables
(0)