-
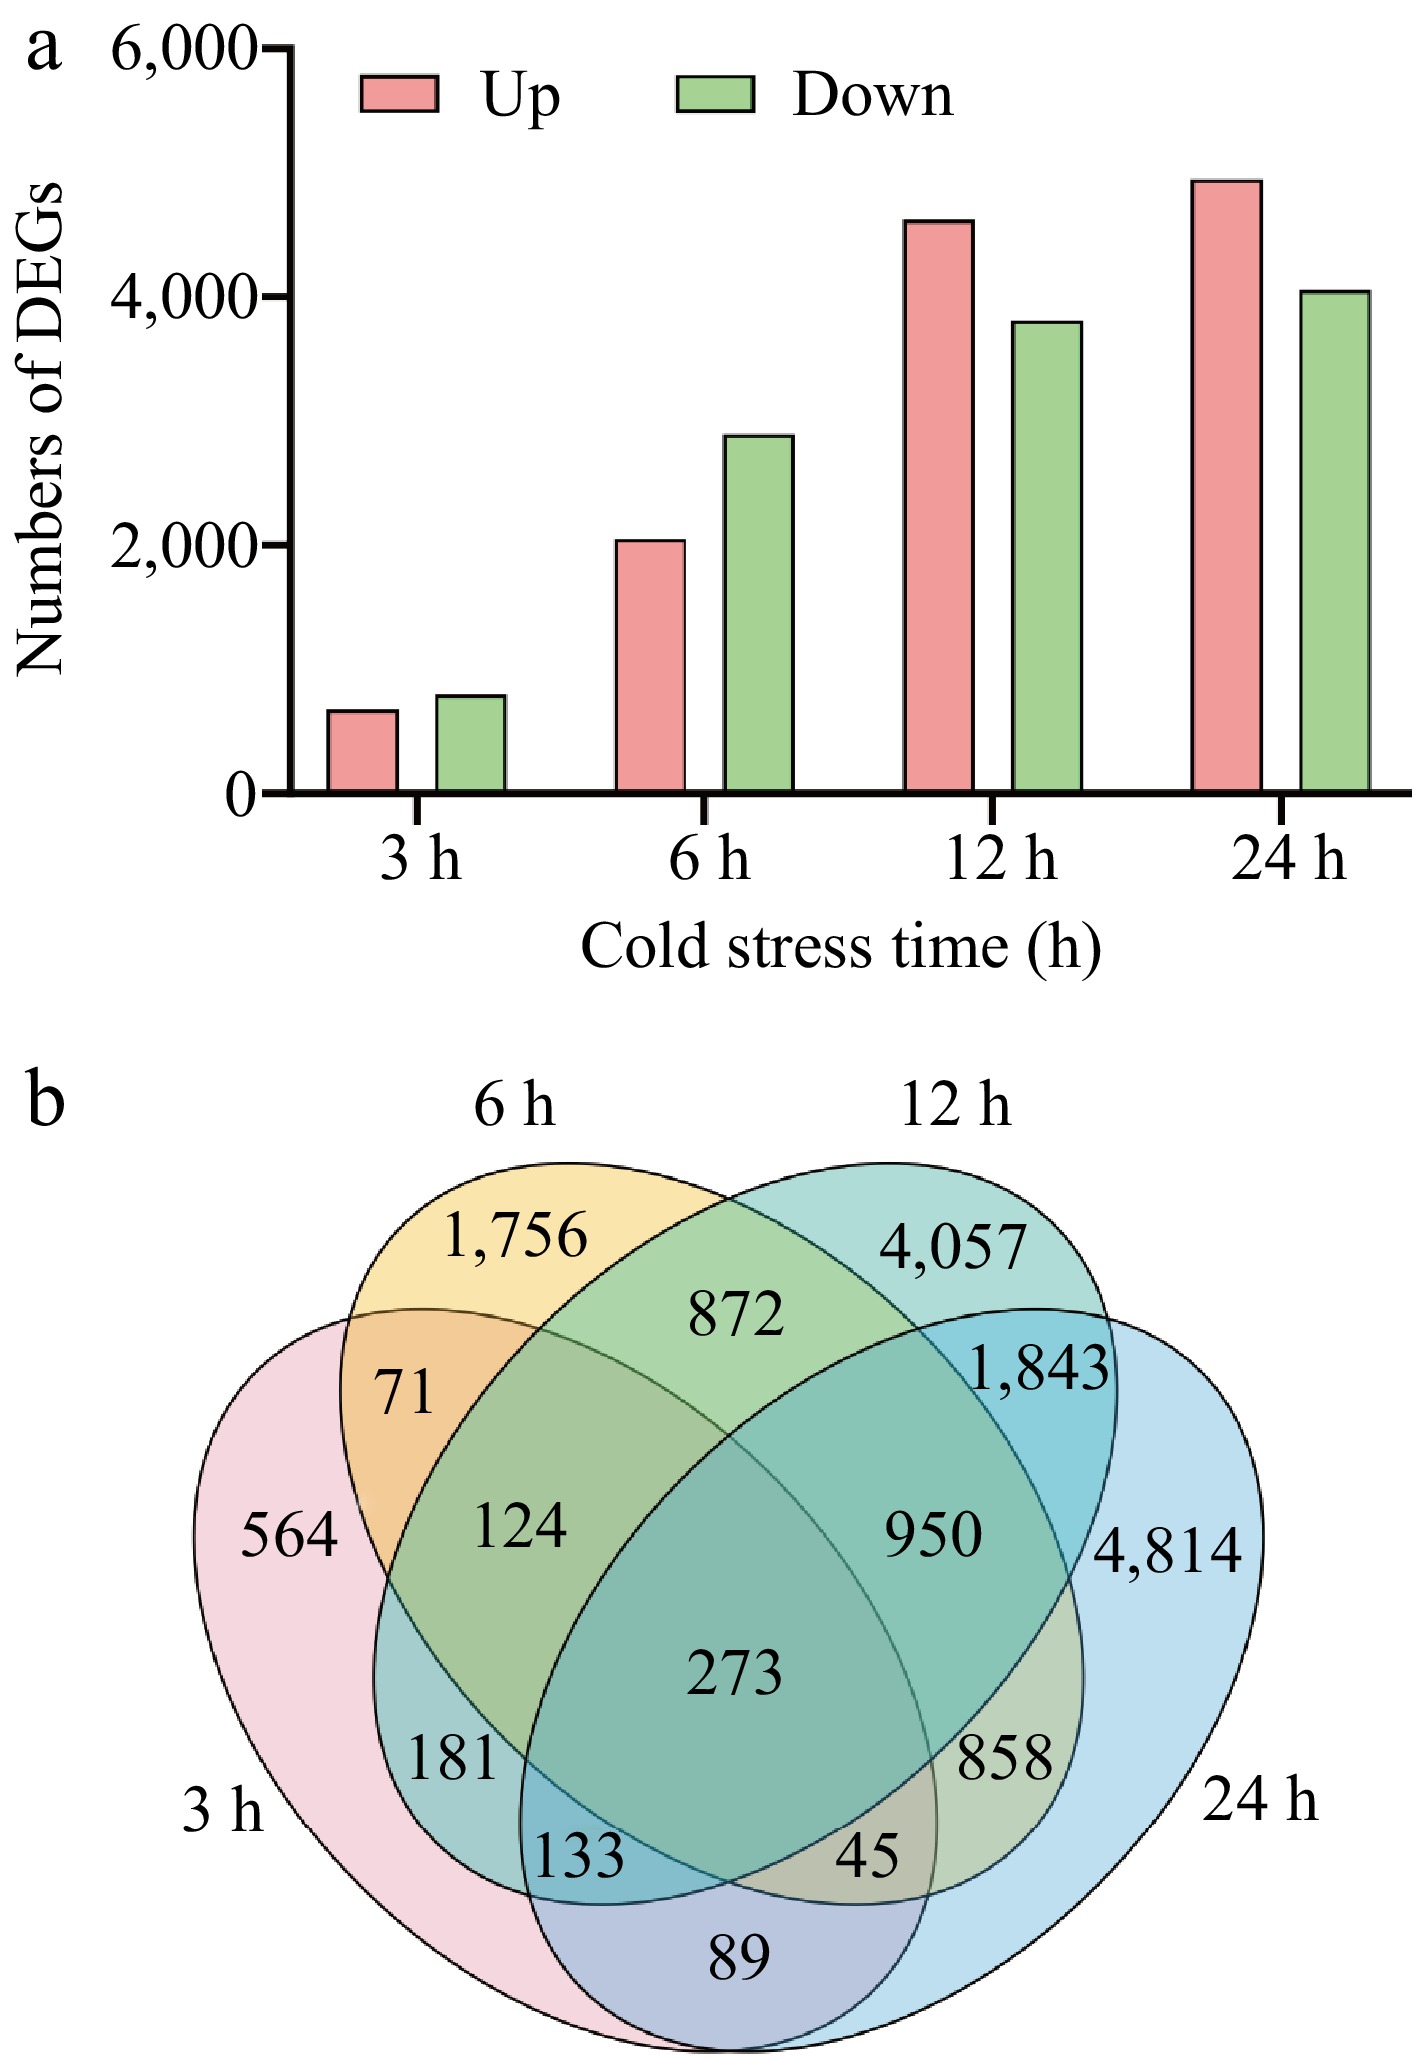
Figure 1.
The numbers of DEGs of elephant grass under cold stress. (a) The number of up- and down-regulated genes at 3, 6, 12, and 24 h; (b) Venn diagram of DEGs.
-
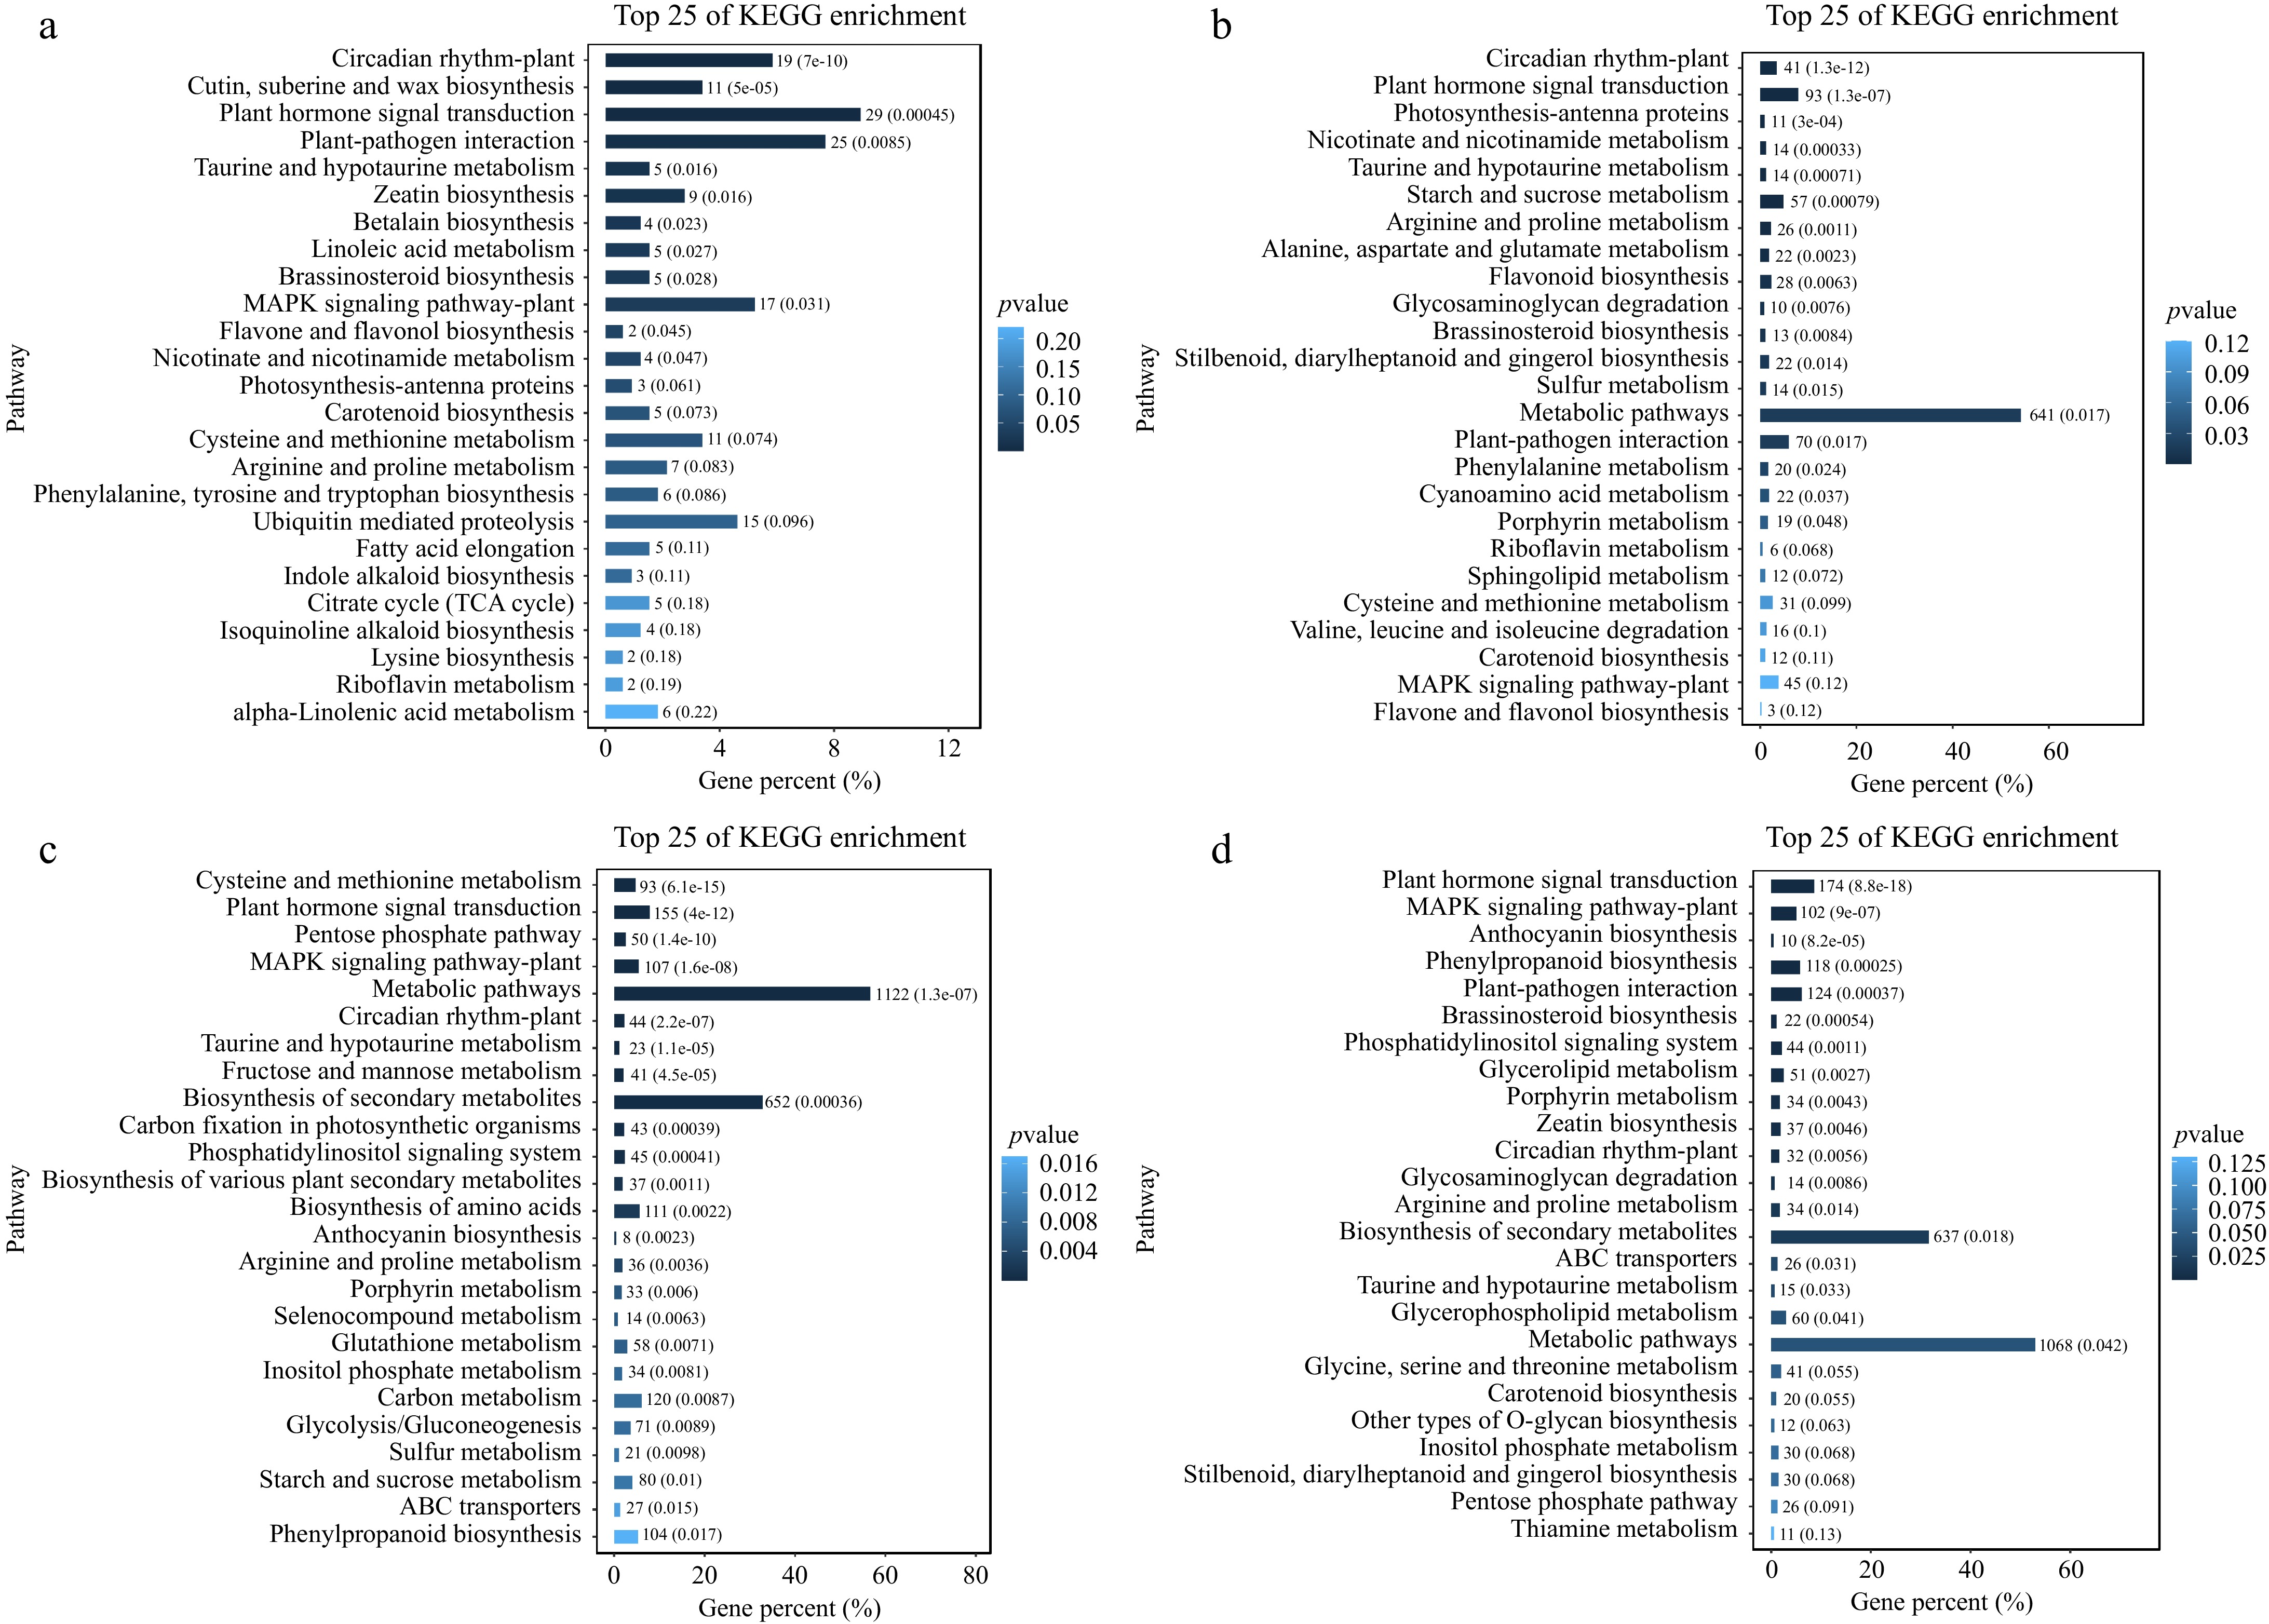
Figure 2.
KEGG pathway enrichment analysis of DEGs during cold treatments. Enriched pathways of cold treatments at (a) 3 h, (b) 6 h, (c) 12 h, and (d) 24 h.
-
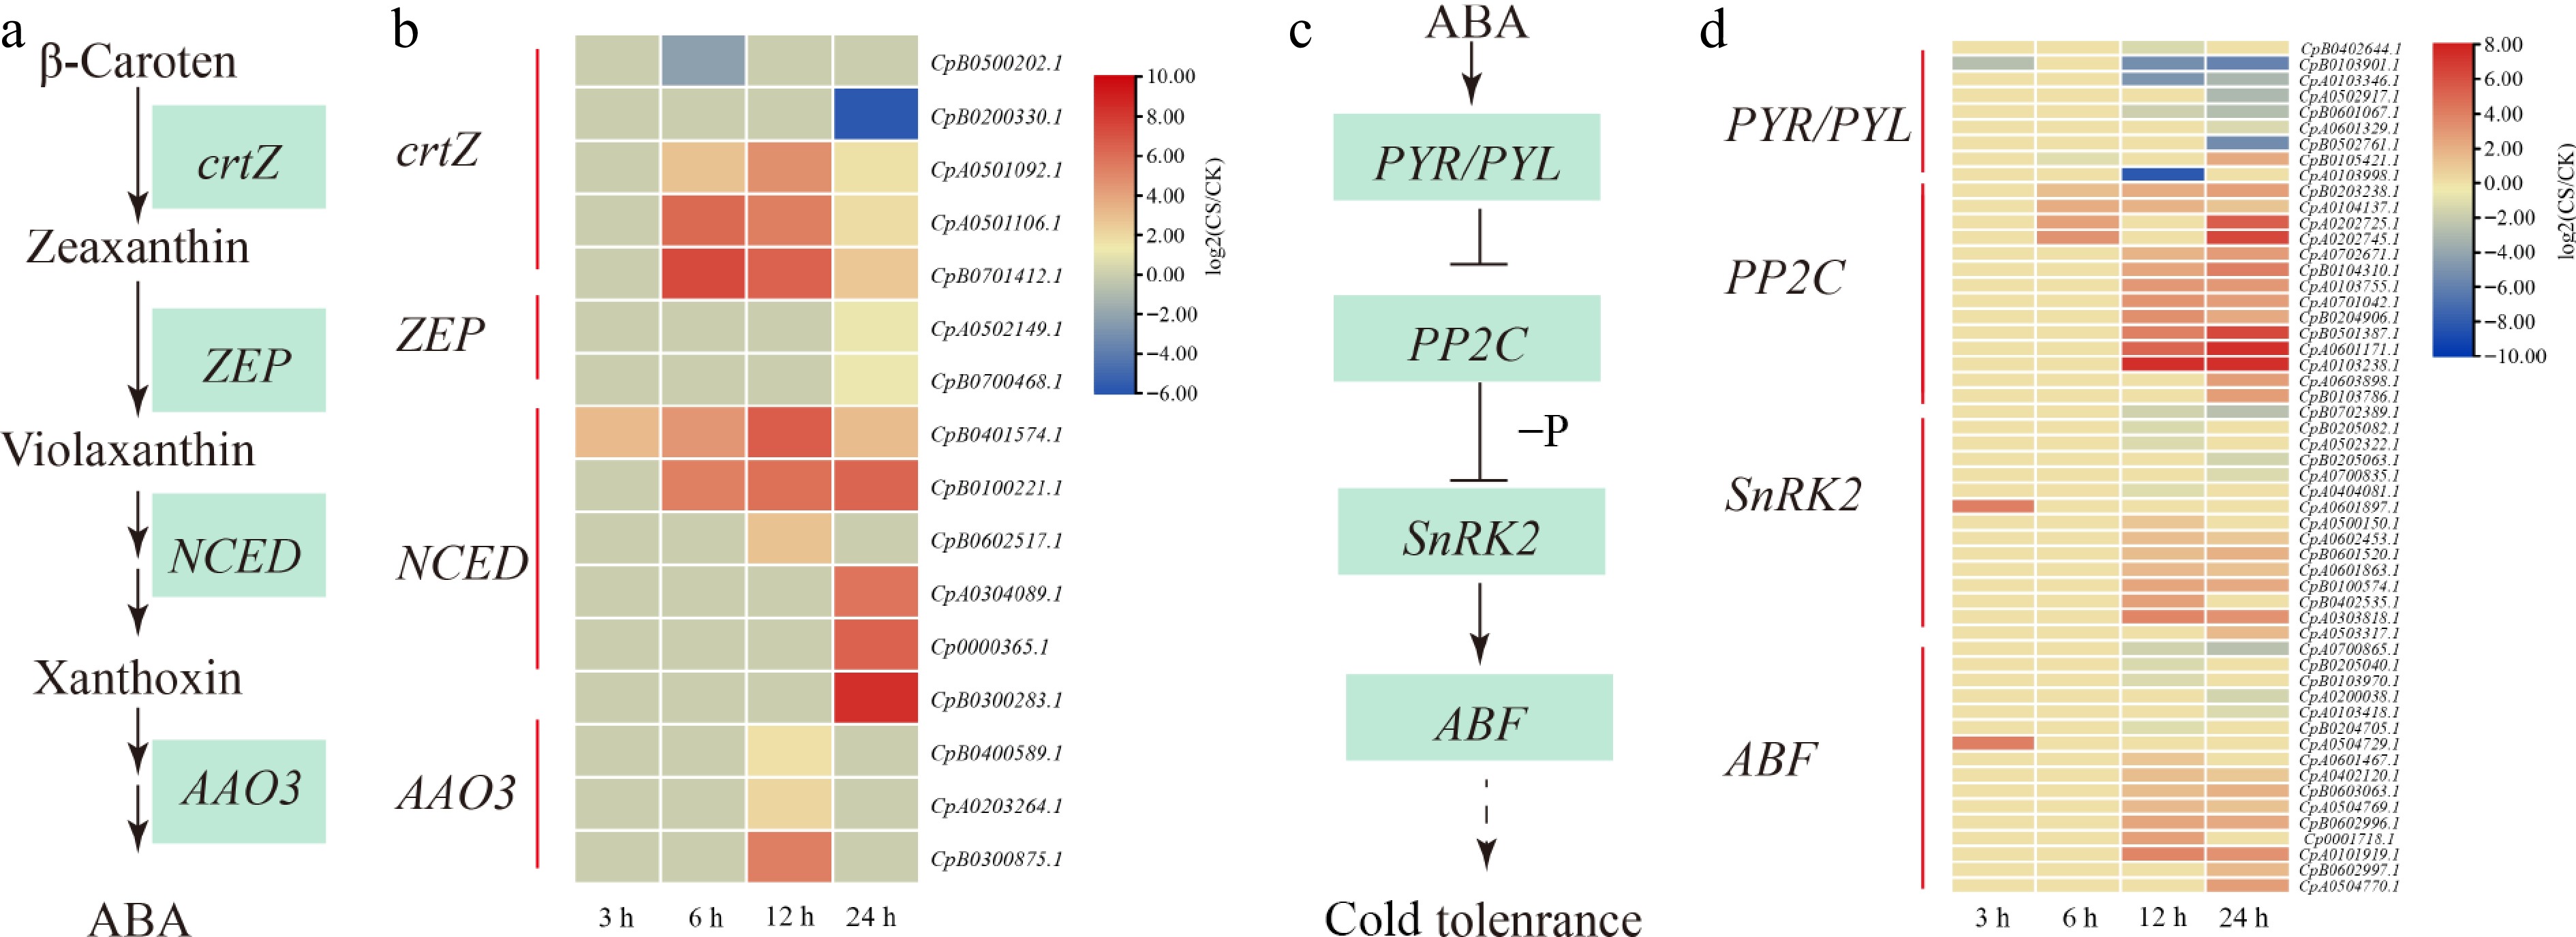
Figure 3.
ABA biosynthesis and ABA signaling pathway in response to cold stress. (a) The ABA biosynthetic pathway. (b) Heat map clustering analysis of ABA biosynthesis under cold stress. (c) The ABA signaling pathway. (d) Heat map clustering analysis of ABA signal pathway under cold stress. '−P' denotes dephosphorylation, arrows indicate promotion, and horizontal lines represent inhibition. Expression data are presented as log2(CS/CK) values, yellow indicates gene upregulation, while blue represents downregulation.
-

Figure 4.
Calcium signaling and MAPK signaling pathway in response to cold stress. (a) The calcium signaling and MAPK signaling pathway. (b) Heat map clustering analysis of calcium signaling and MAPK signaling pathway for cold stress. '+P' denotes phosphorylation, arrow indicates promotion. Expression data are presented as log2(CS/CK) values, yellow indicates gene upregulation, while blue represents downregulation.
-

Figure 5.
Number and classification of TF-encoded genes of elephant grass under cold stress. (a) Number of differentially expressed TF. (b) Venn diagram of the number of differentially expressed TFs at various cold treatments 3, 6, 12, and 24 h. (c) Heatmap of 42 TFs at various cold treatments 3, 6, 12, and 24 h. Expression data are presented as log2(CS/CK) values, yellow indicates gene upregulation, while blue represents downregulation.
-

Figure 6.
The response of antioxidant enzymes in elephant grass under cold stress. (a) The antioxidant enzymes metabolic pathway. (b) Heat map clustering analysis of antioxidant oxidase cold stress. SOD: Superoxide dismutase; POD: peroxidase; APX: Ascorbate peroxidase; CAT: catalase; MDHAR: Monodehydroascorbate reductase; DHAR: Dehydroascorbate reductase: GPX: Glutathione peroxidase; GST: Glutathione S-transferase; GR: Glutathione Reductase; Expression data are presented as log2(CS/CK) values, yellow indicates gene upregulation, while blue represents downregulation.
-

Figure 7.
The response of arginine and proline in elephant grass under cold stress. (a) The putrescine biosynthesis pathway. (b) Heat map clustering analysis of putrescine biosynthesis under cold stress. (c) The proline biosynthesis and metabolism pathway. (d) Heat map clustering analysis of proline biosynthesis and metabolism under cold stress. Arrows indicate promotion. Expression data are presented as log2(CS/CK) values, yellow indicates gene upregulation, while blue represents downregulation.
-

Figure 8.
The (a) CAT and (b) APX activity in elephant grass under cold stress. The content of (c) proline and (d) ABA in elephant grass under cold stress. *Represents significant difference (p < 0.05) between CS and CK at the same treatment time, ns represent non-significant differences; and data are presented as mean ± SEM (n = 3).
-

Figure 9.
The results of WGCNA of elephant grass under cold stress. (a) Cluster dendrogram, each leaf in the tree corresponds to a single gene, while the primary branches form 22 distinct modules, each represented by a different color. The x-axis denotes individual genes, and the y-axis reflects co-expression distances. Modules were identified through dynamic tree cutting, which segments the dendrogram at significant branching points. The horizontal bar directly beneath the dendrogram illustrates module assignments, with colors distinguishing different modules. (b) Module–trait relationships, each row represents a module, and each column corresponds to a specific physiological indicator. The color of each cell at their intersection denotes the correlation coefficient between the module and the indicator. Yellow indicates a strong correlation between a given module and the physiological indicator. (c) KEGG enrichment analysis of black module genes. (d) KEGG enrichment analysis of black magenta genes. (e) KEGG enrichment analysis of brown module genes.
-

Figure 10.
Tolerance to cold stress of NCED, SAPK1, P5CS, and ADC overexpressing yeast cells. (a) Diluted droplets of yeast transformants growth under control. (b) Diluted droplets of yeast transformants growth under cold stress treatment.
-

Figure 11.
Gene expression as determined by RT-qPCR. * Represents the significant difference (p < 0.05) in gene expression between CS and CK treatments at the same stress time. Student's t-test was used to determine significant differences in gene expression levels, and data are presented as mean ± SEM (n = 3).
Figures
(11)
Tables
(0)