-
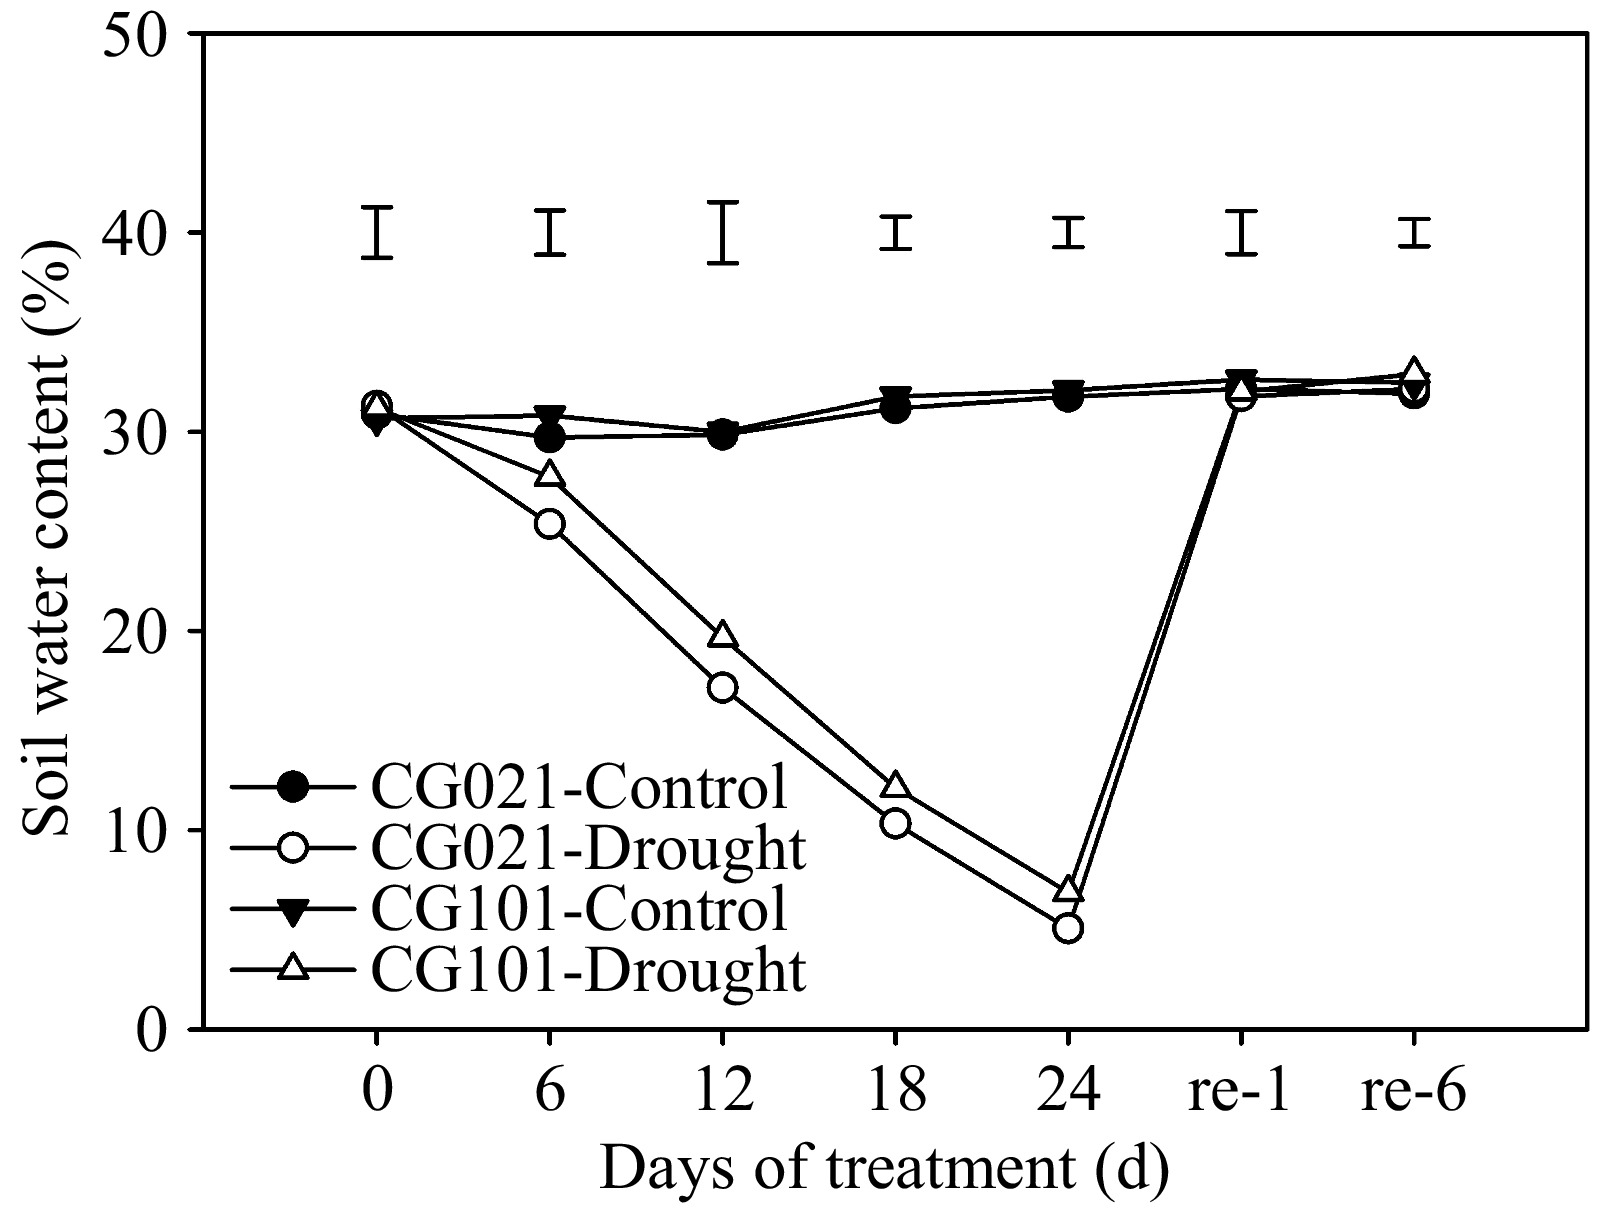
Figure 1.
Soil water content in the drought-sensitive 'CG021' and the drought-tolerant 'CG101' during the experiment. Bars on the top indicate LSD values for the comparison among treatments on a given day.
-
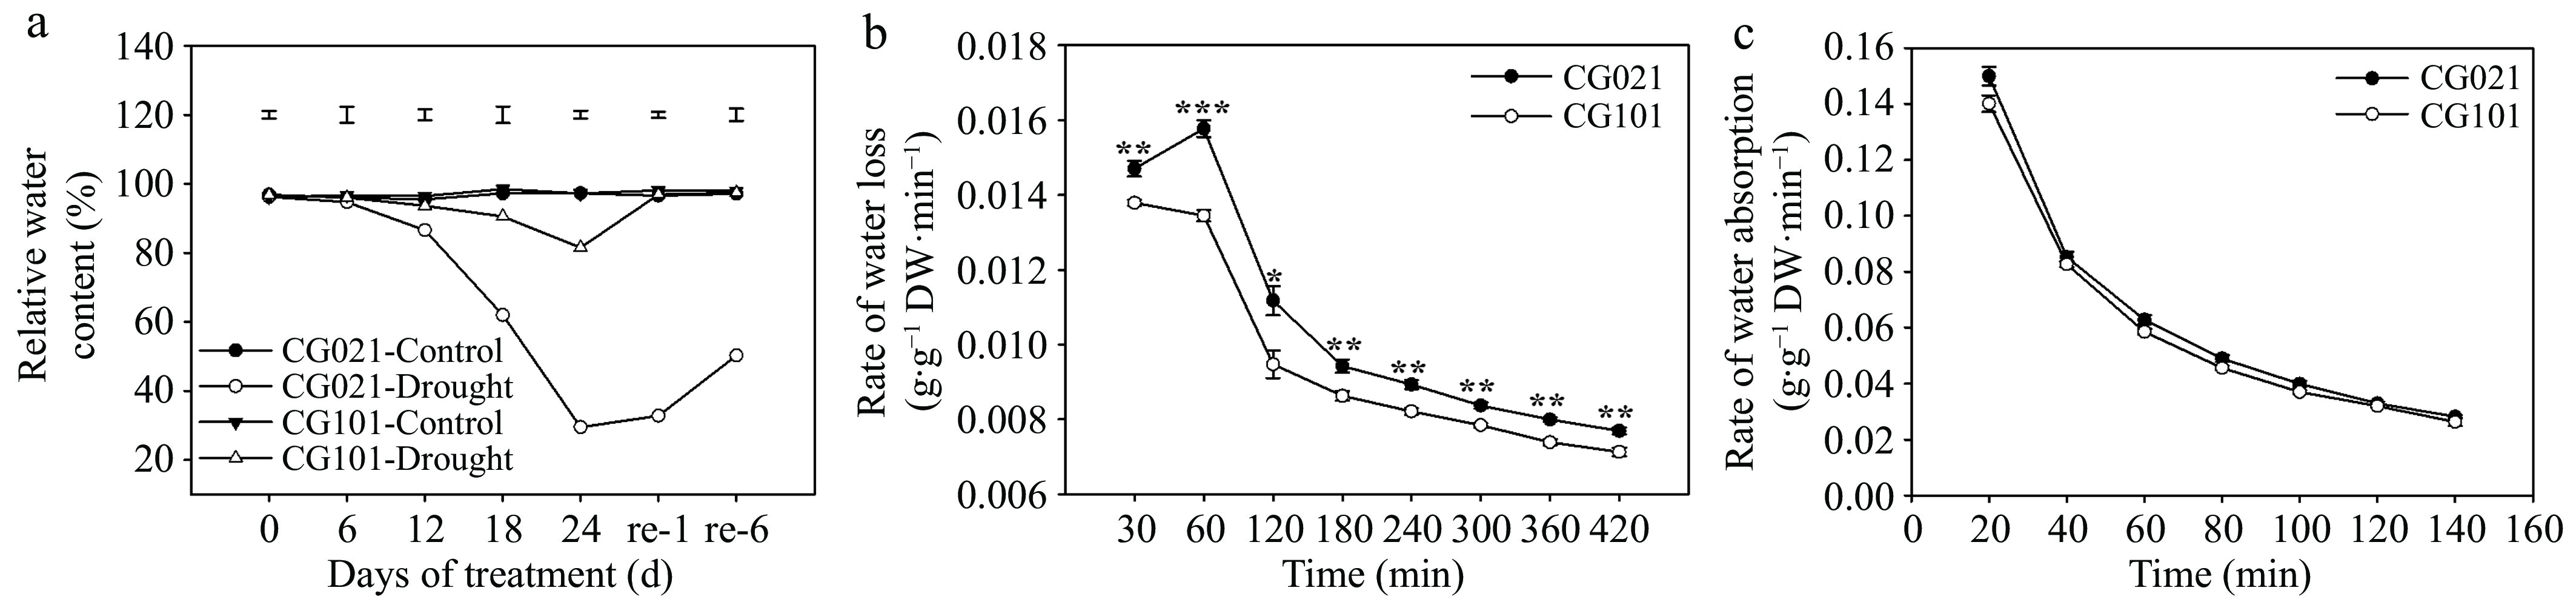
Figure 2.
(a) Relative water content, (b) rate of water loss, and (c) rate of water absorption in the drought-sensitive 'CG021' and the drought-tolerant 'CG101' during the experiment. Vertical bars indicate LSD values for the comparison among treatments on a given day. Error bars indicate the standard error (SE). Asterisks indicate significant differences (* p < 0.05, ** p < 0.01, *** p < 0.001) between different genotypes at a certain time point.
-
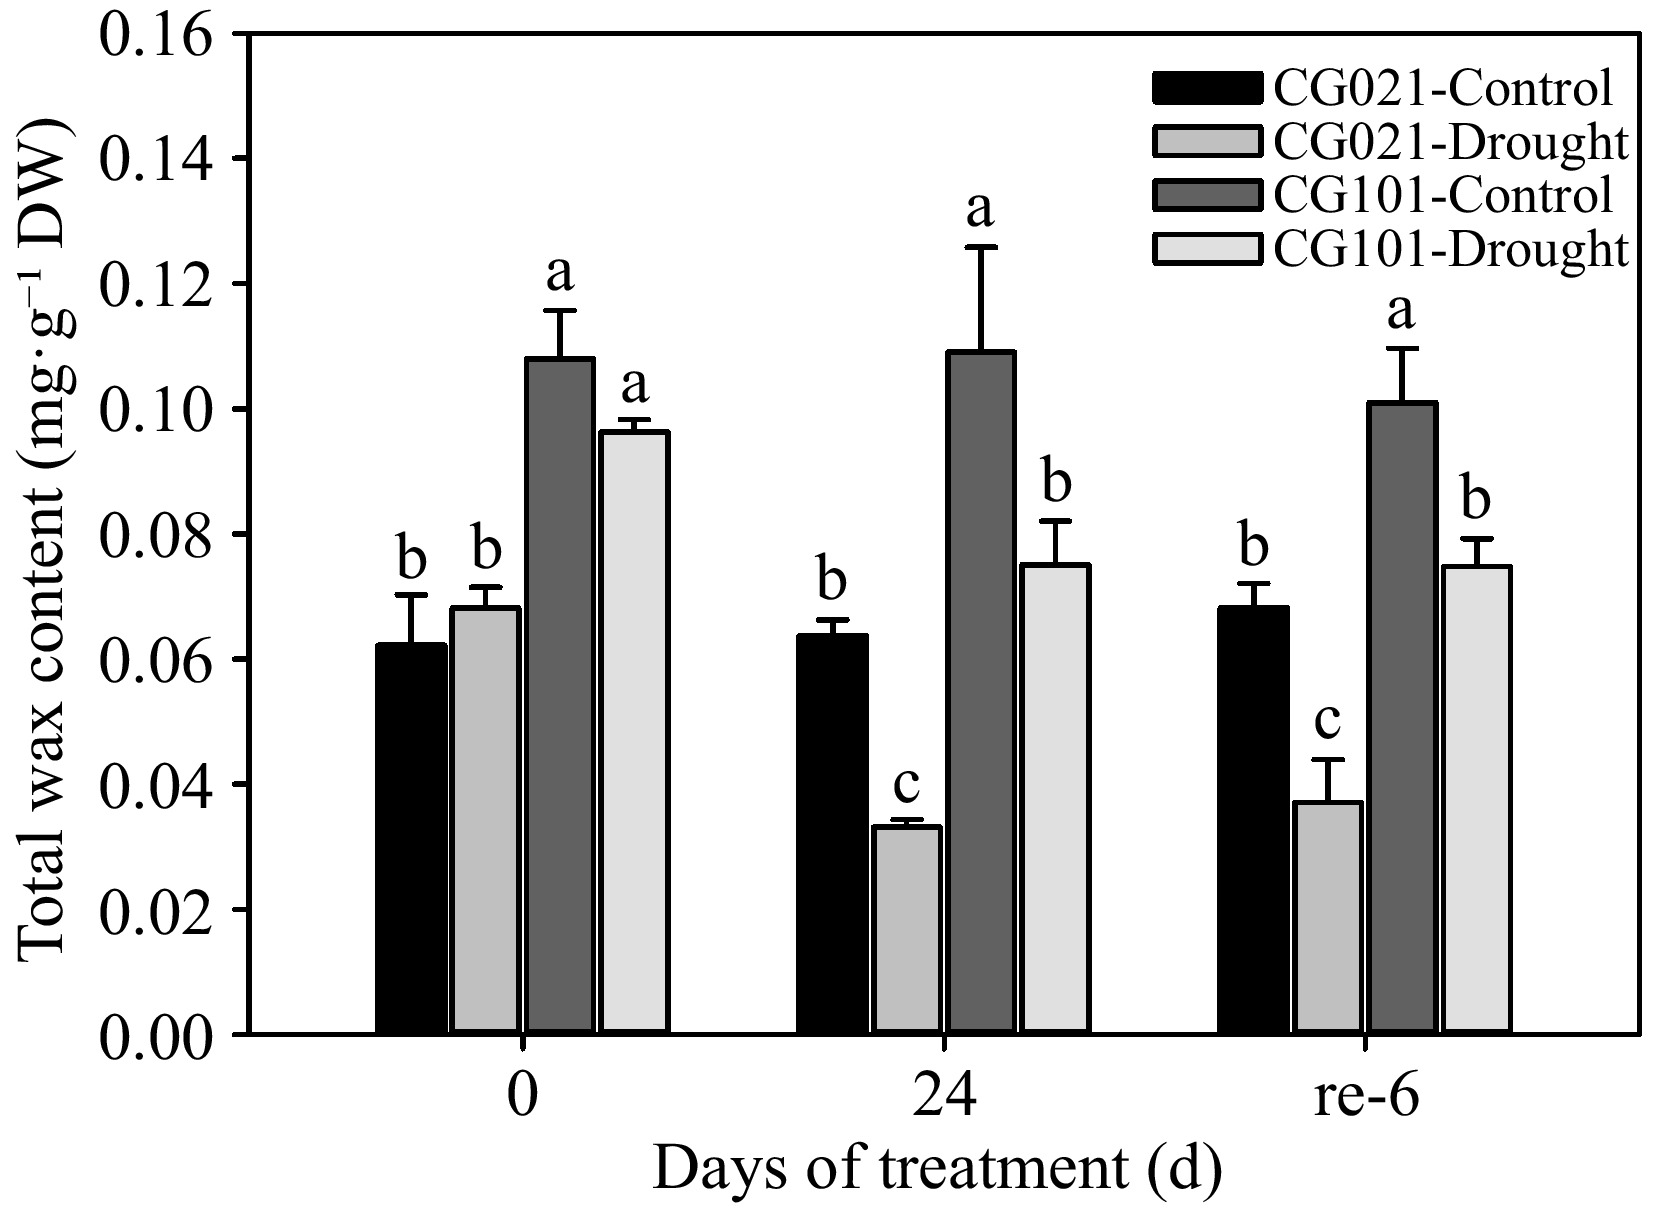
Figure 3.
Leaf wax content in the drought-sensitive 'CG021' and the drought-tolerant 'CG101' during the experiment. Different letters indicate significant differences between different treatments at a certain point in time (p < 0.05).
-
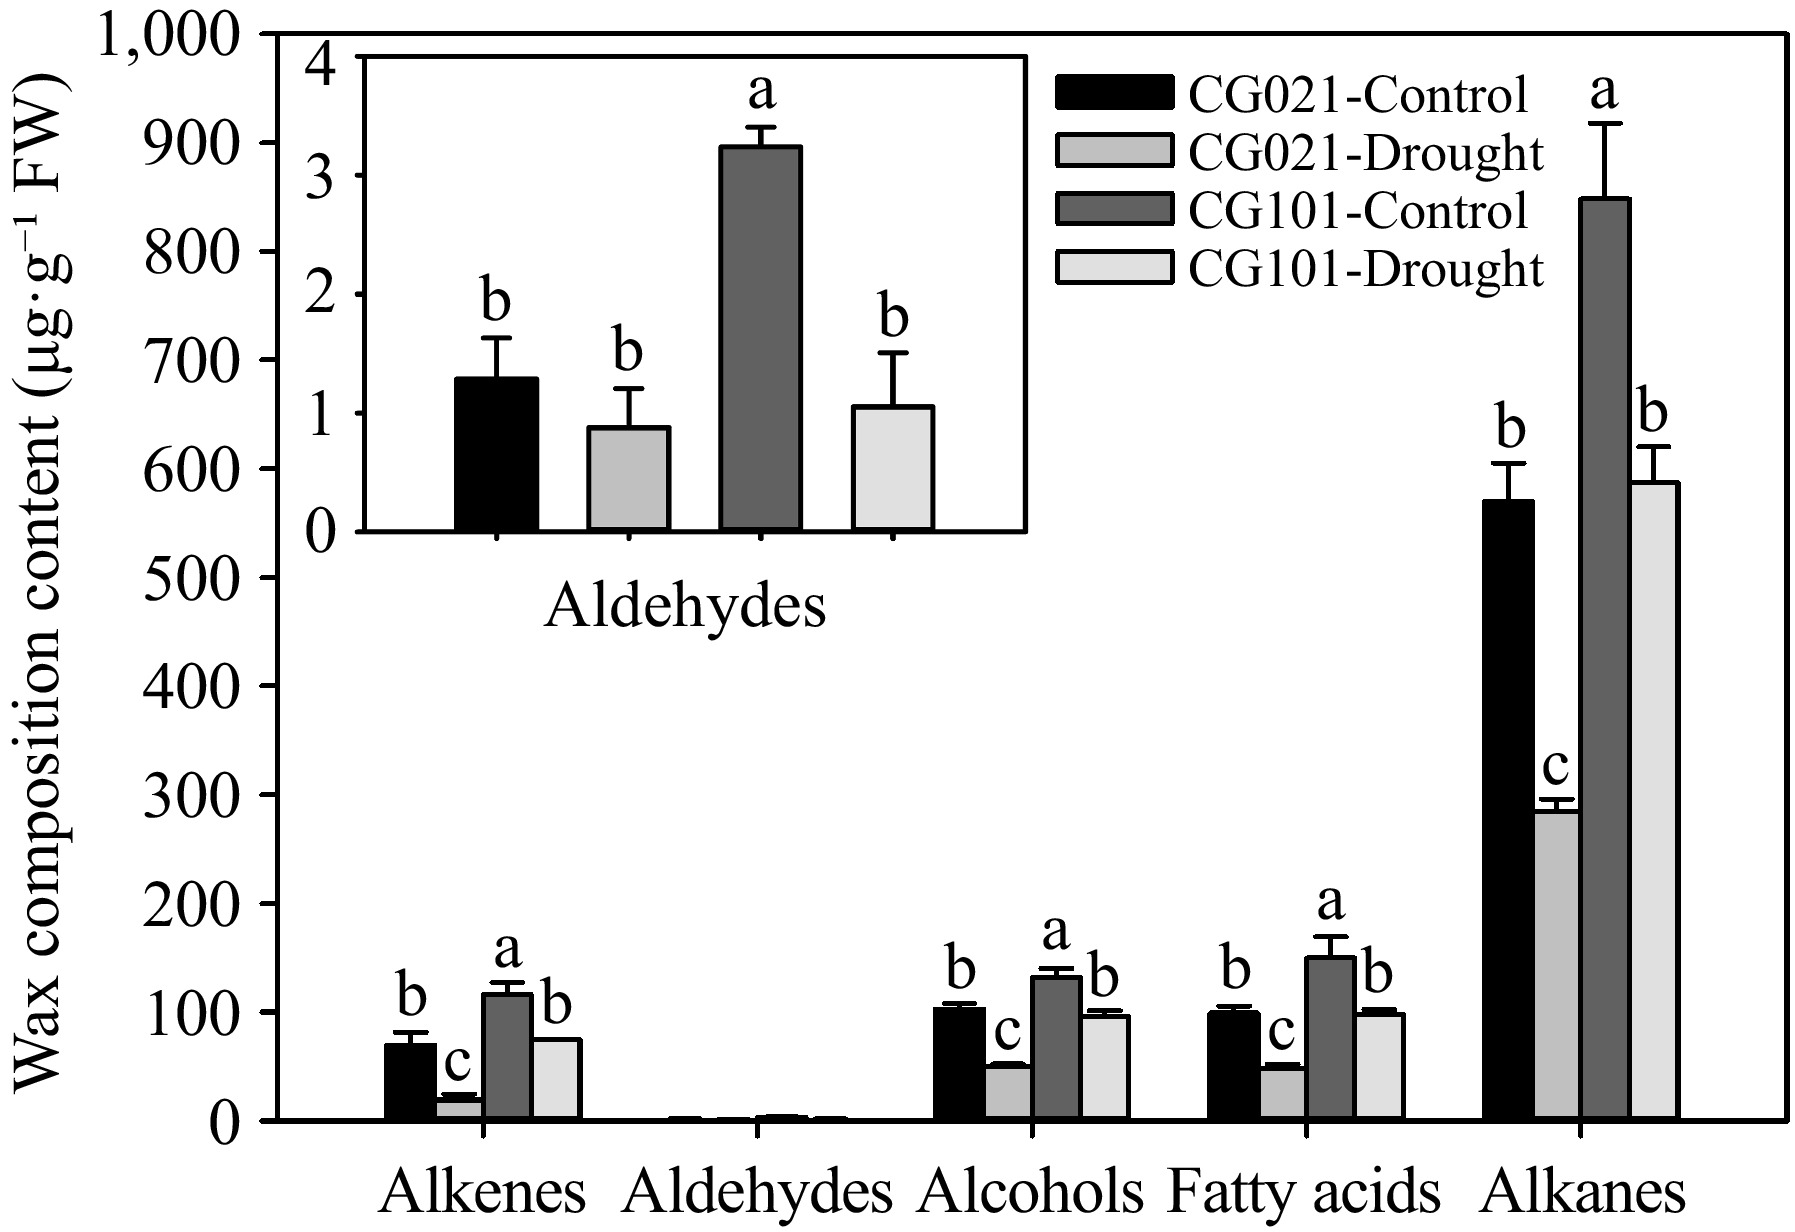
Figure 4.
The cuticular wax composition in the drought-sensitive 'CG021' and the drought-tolerant 'CG101' after 24 d of drought stress. Different letters indicate significant differences between different treatments (p < 0.05).
-
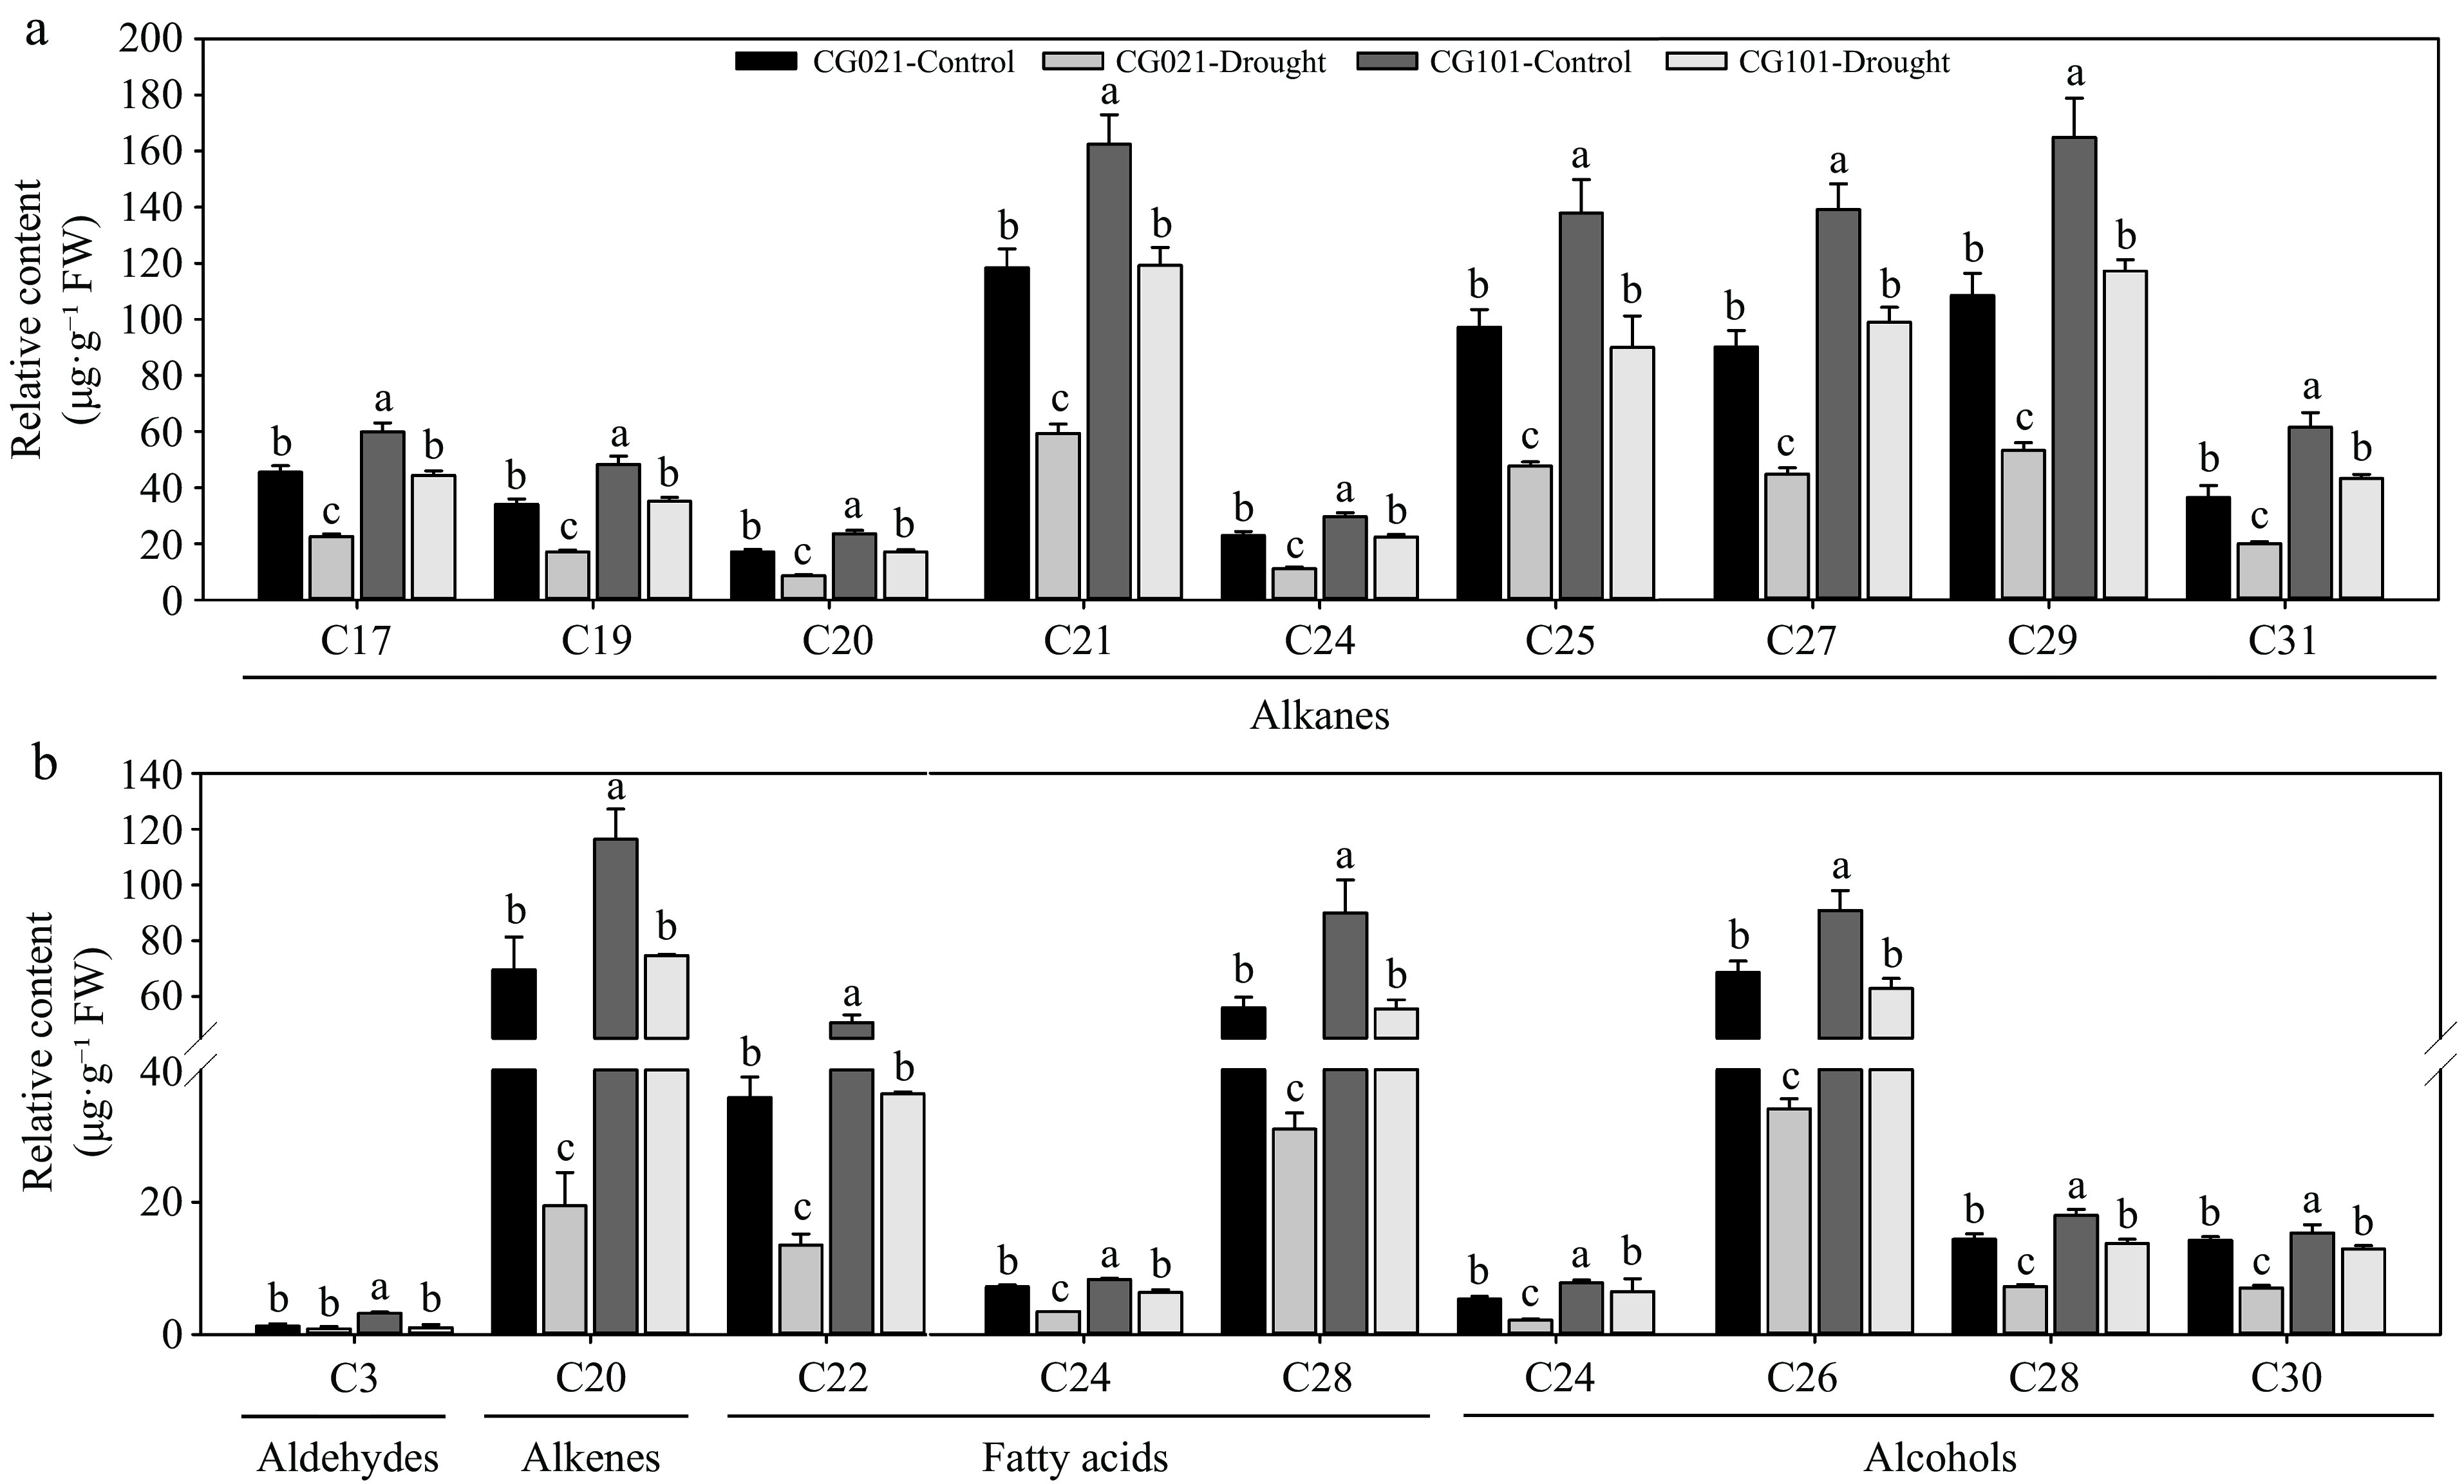
Figure 5.
The carbon chain length of the cuticular wax composition in the drought-sensitive 'CG021' and the drought-tolerant 'CG101' after 24 d of drought stress. Different letters indicate significant differences between different treatments (p < 0.05).
-
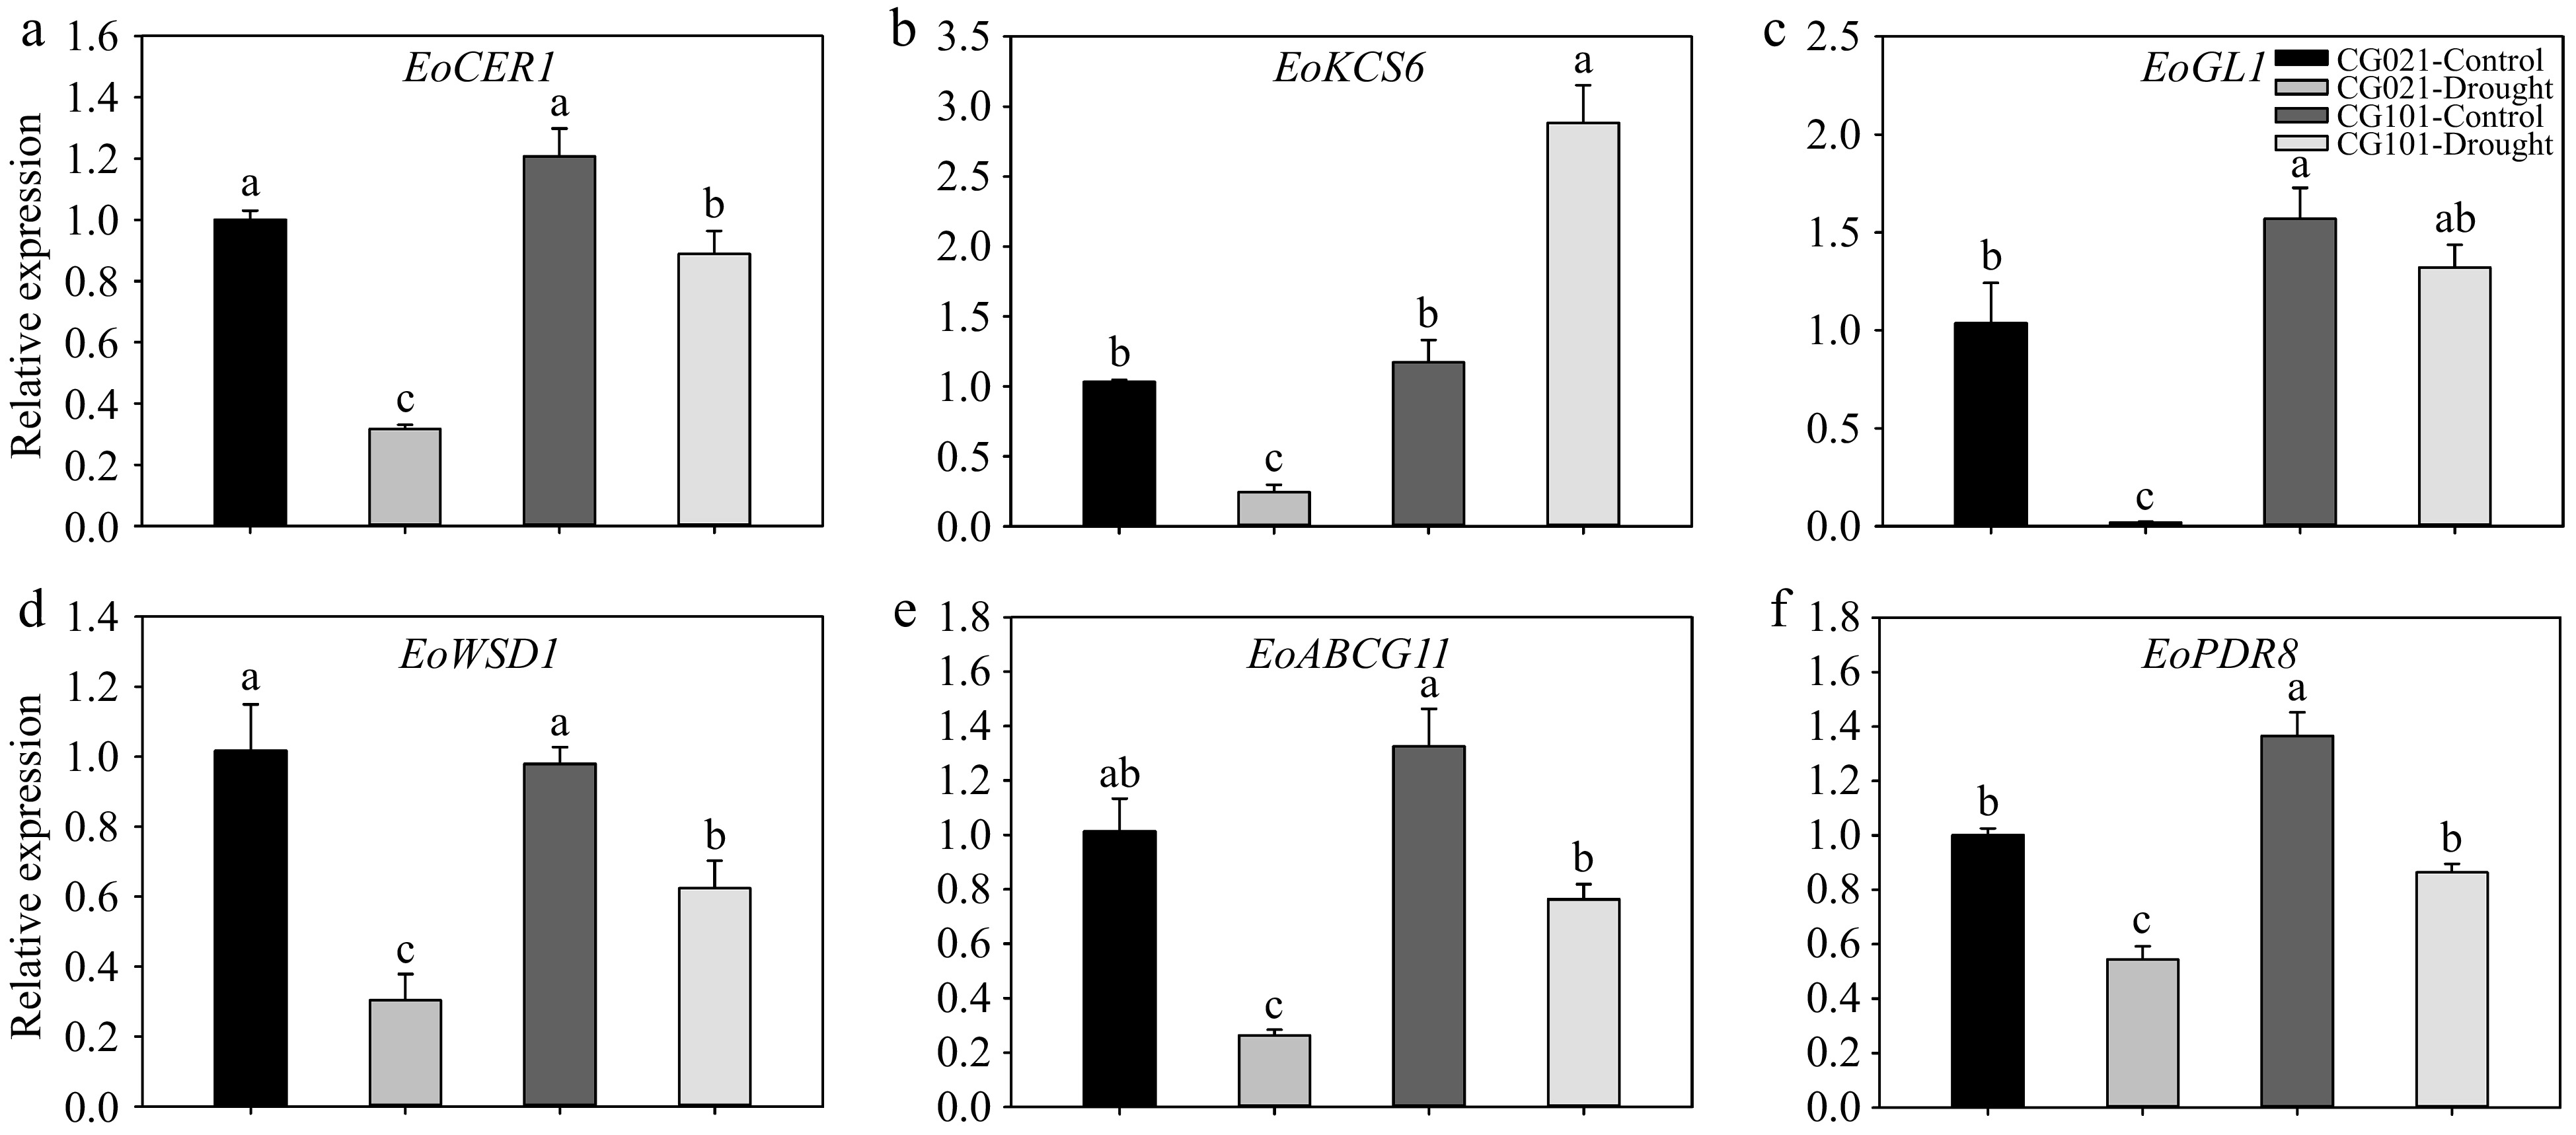
Figure 6.
The relative expression of cuticular wax-related genes in the drought-sensitive 'CG021' and drought-tolerant 'CG101' after 24 d of drought stress. Different letters indicate significant differences between different treatments (p < 0.05).
-
Primer name Forward primer (5'-3') Reverse primer (5'-3') EoMD CTCTGATCCATCGAGTCACATTAC GAGGGAAGCTCTGATGTTCATT EoCER1 ATGAACTACCTGGGGCACTG TAGAGGTCGTCGCTGGACTT EoKCS6 GGTACGAGCTCGCCTACATC TCTCCACGACCACATACCAA EoGL1 GTCCACACGCCTTCATTTTT TGTAGAAGCCGAGGTTGTCC EoWSD1 TGATTGGTCCAGTTGAGCAG GCTTGAGGGATTCAGCAAAG EoBCG11 TCTACCGCCTGCTCTTCTTC CAGTTCCGGTTTAGCCTTTG EoPDR8 CTCTGATCCATCGAGTCACATTAC GAGGGAAGCTCTGATGTTCATT Table 1.
Sequences of primers used in this study.
Figures
(6)
Tables
(1)