-
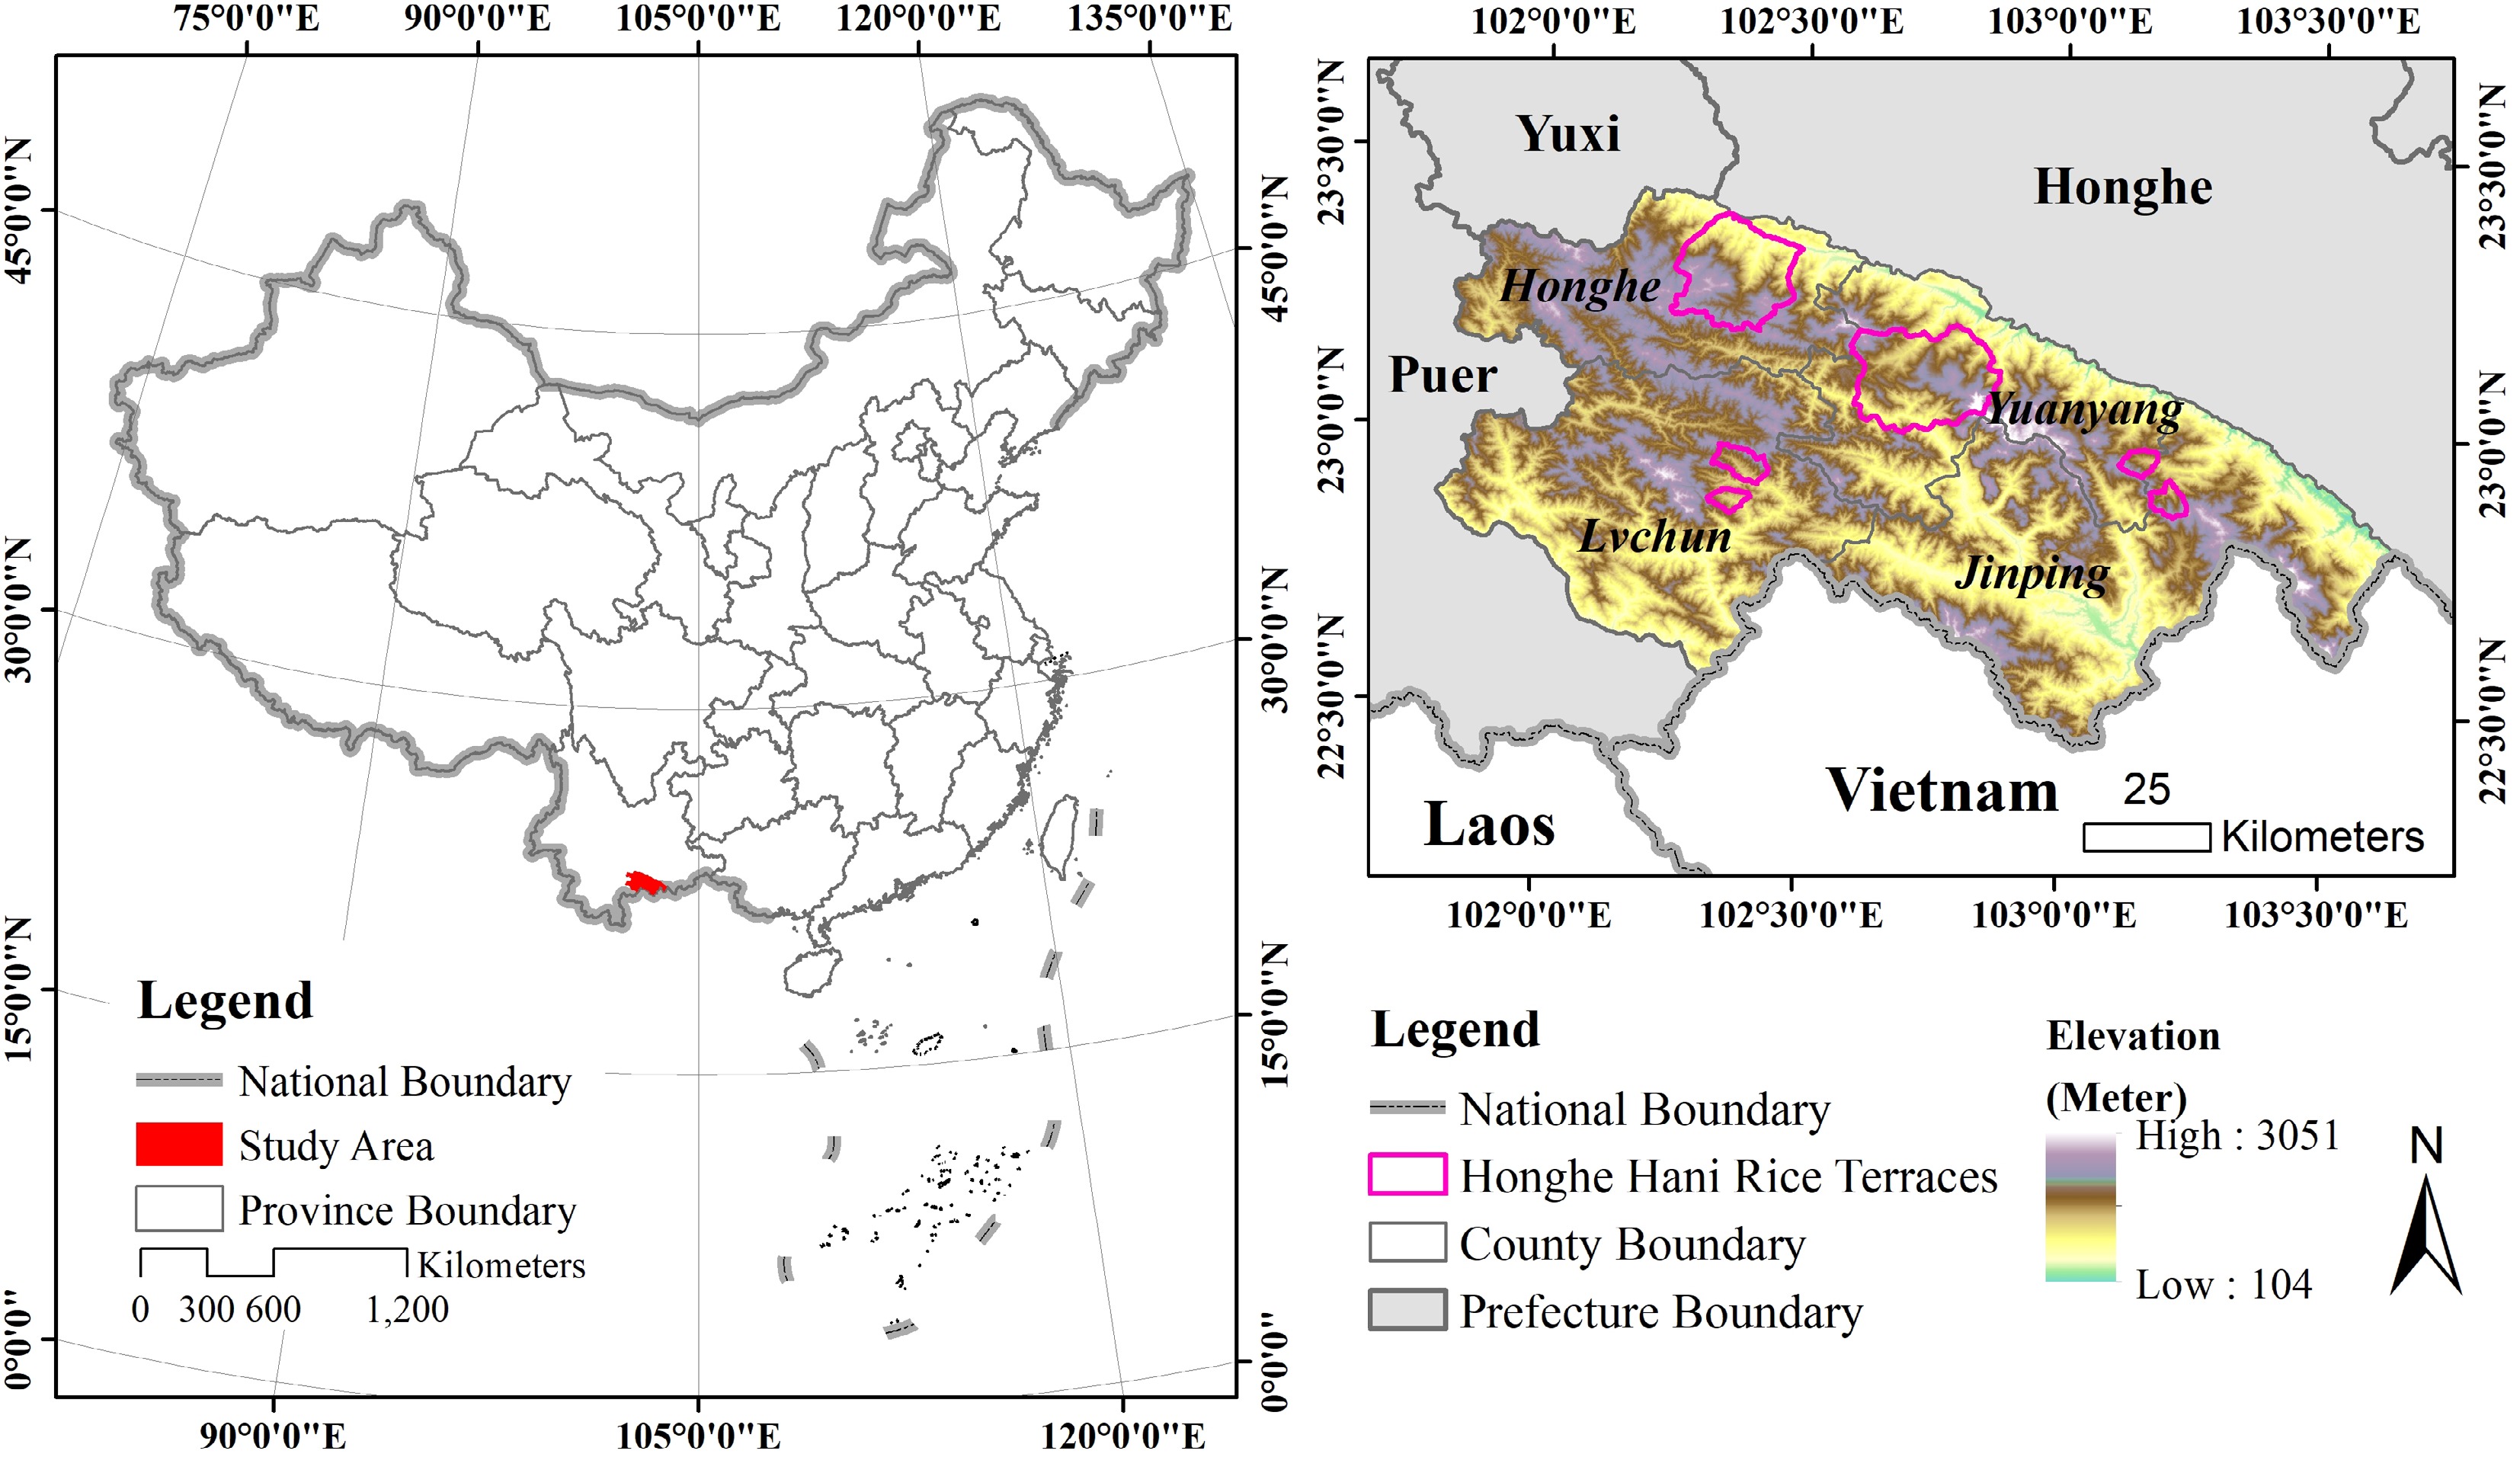
Figure 1.
Location and elevation range of the HHRT.
-
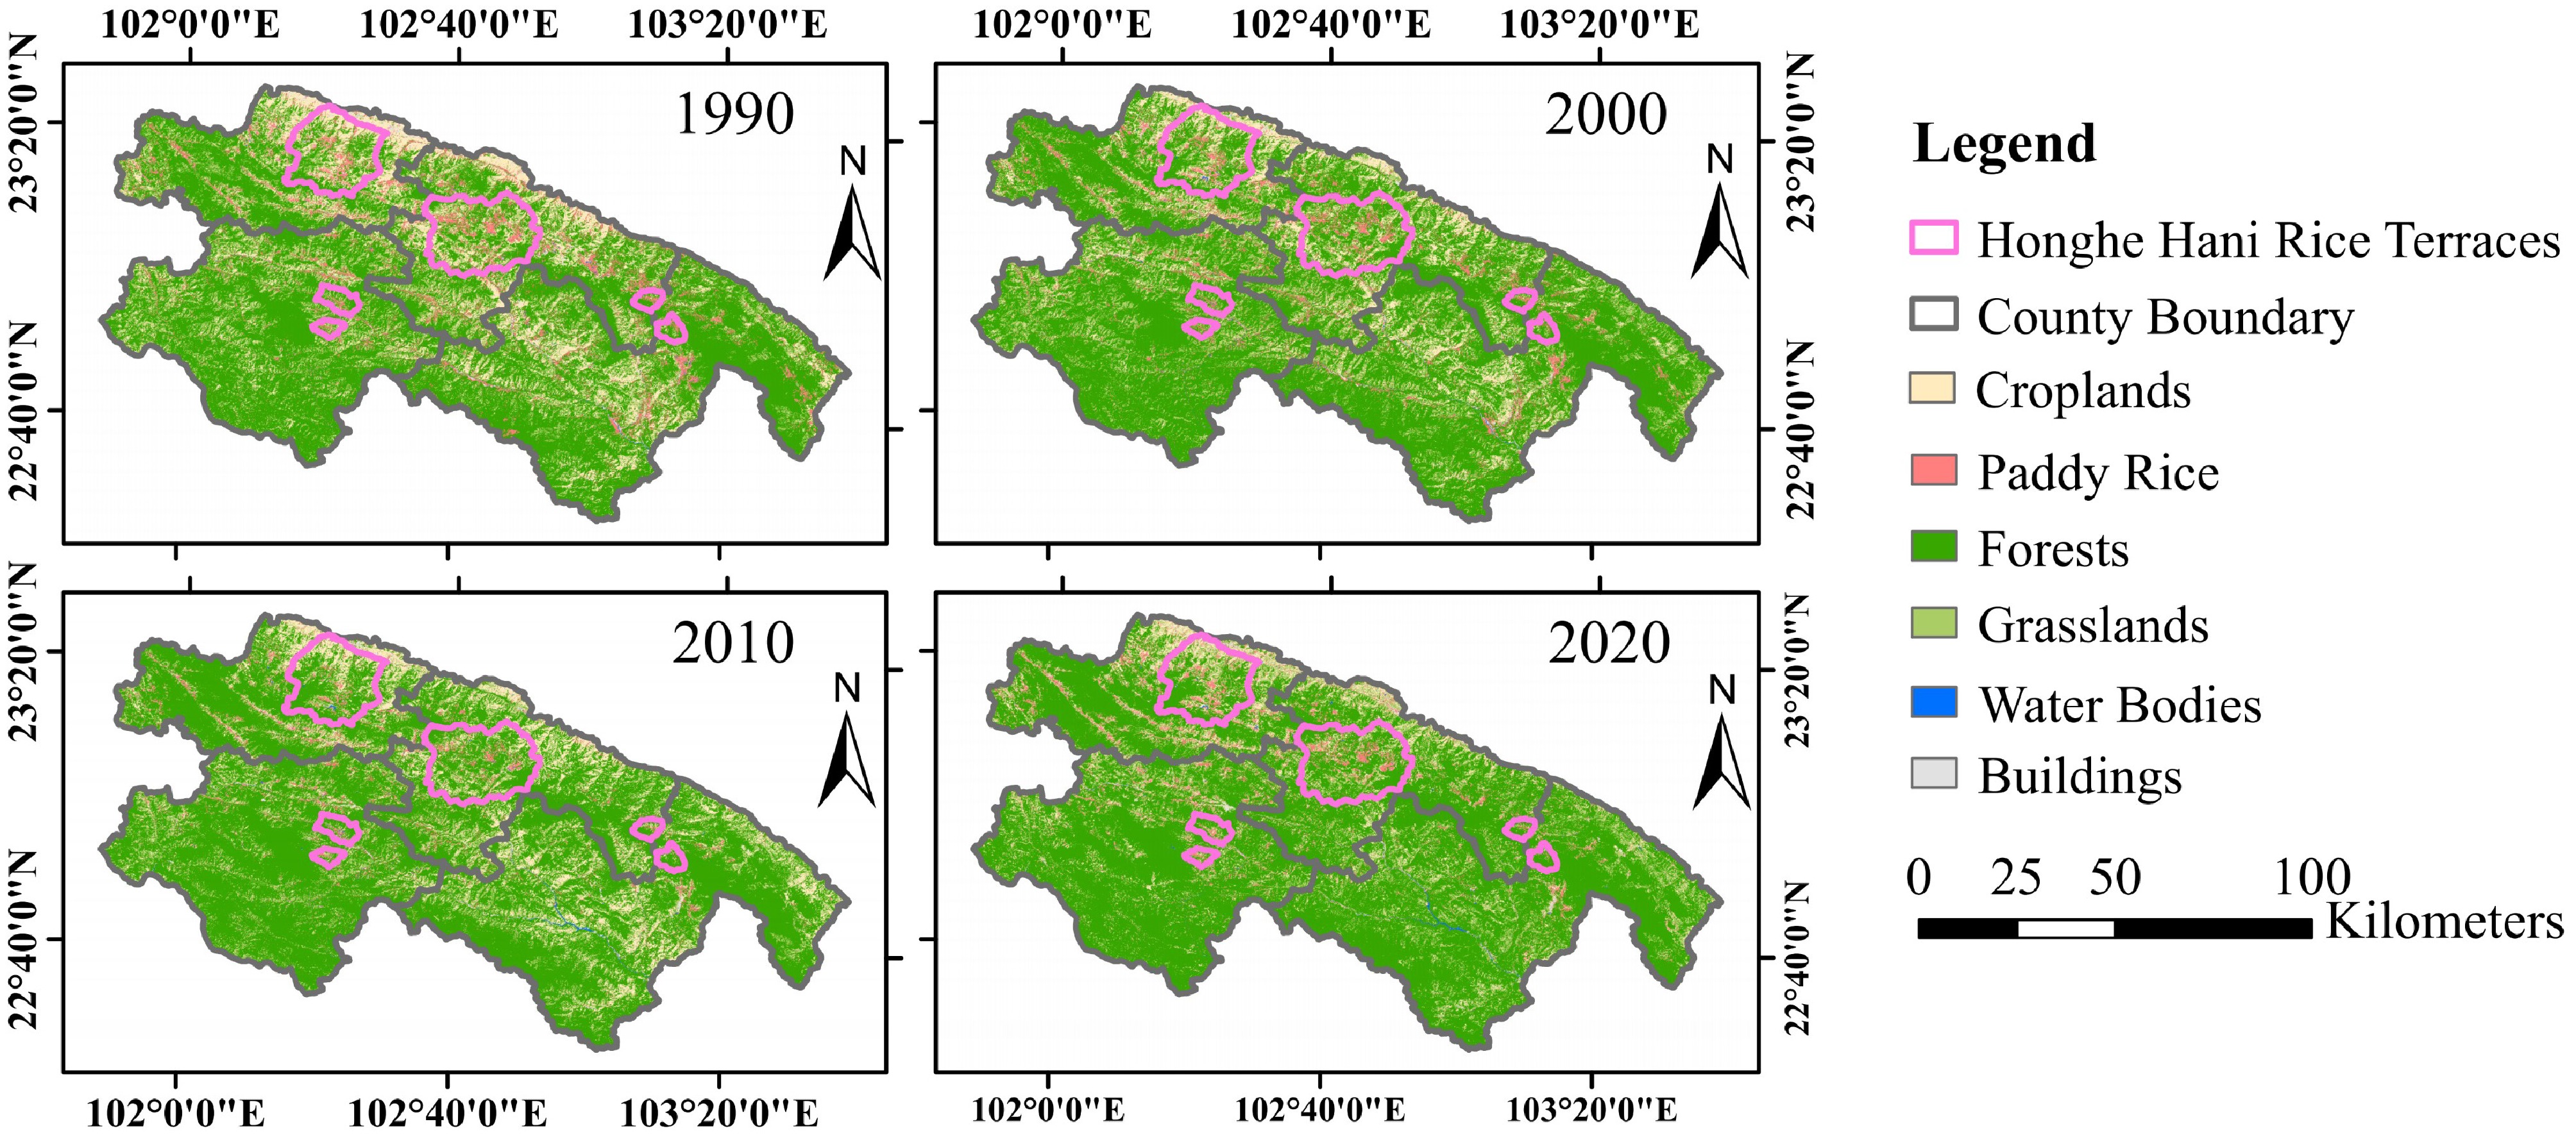
Figure 2.
Land use cover changes in the study area from 1990–2020.
-
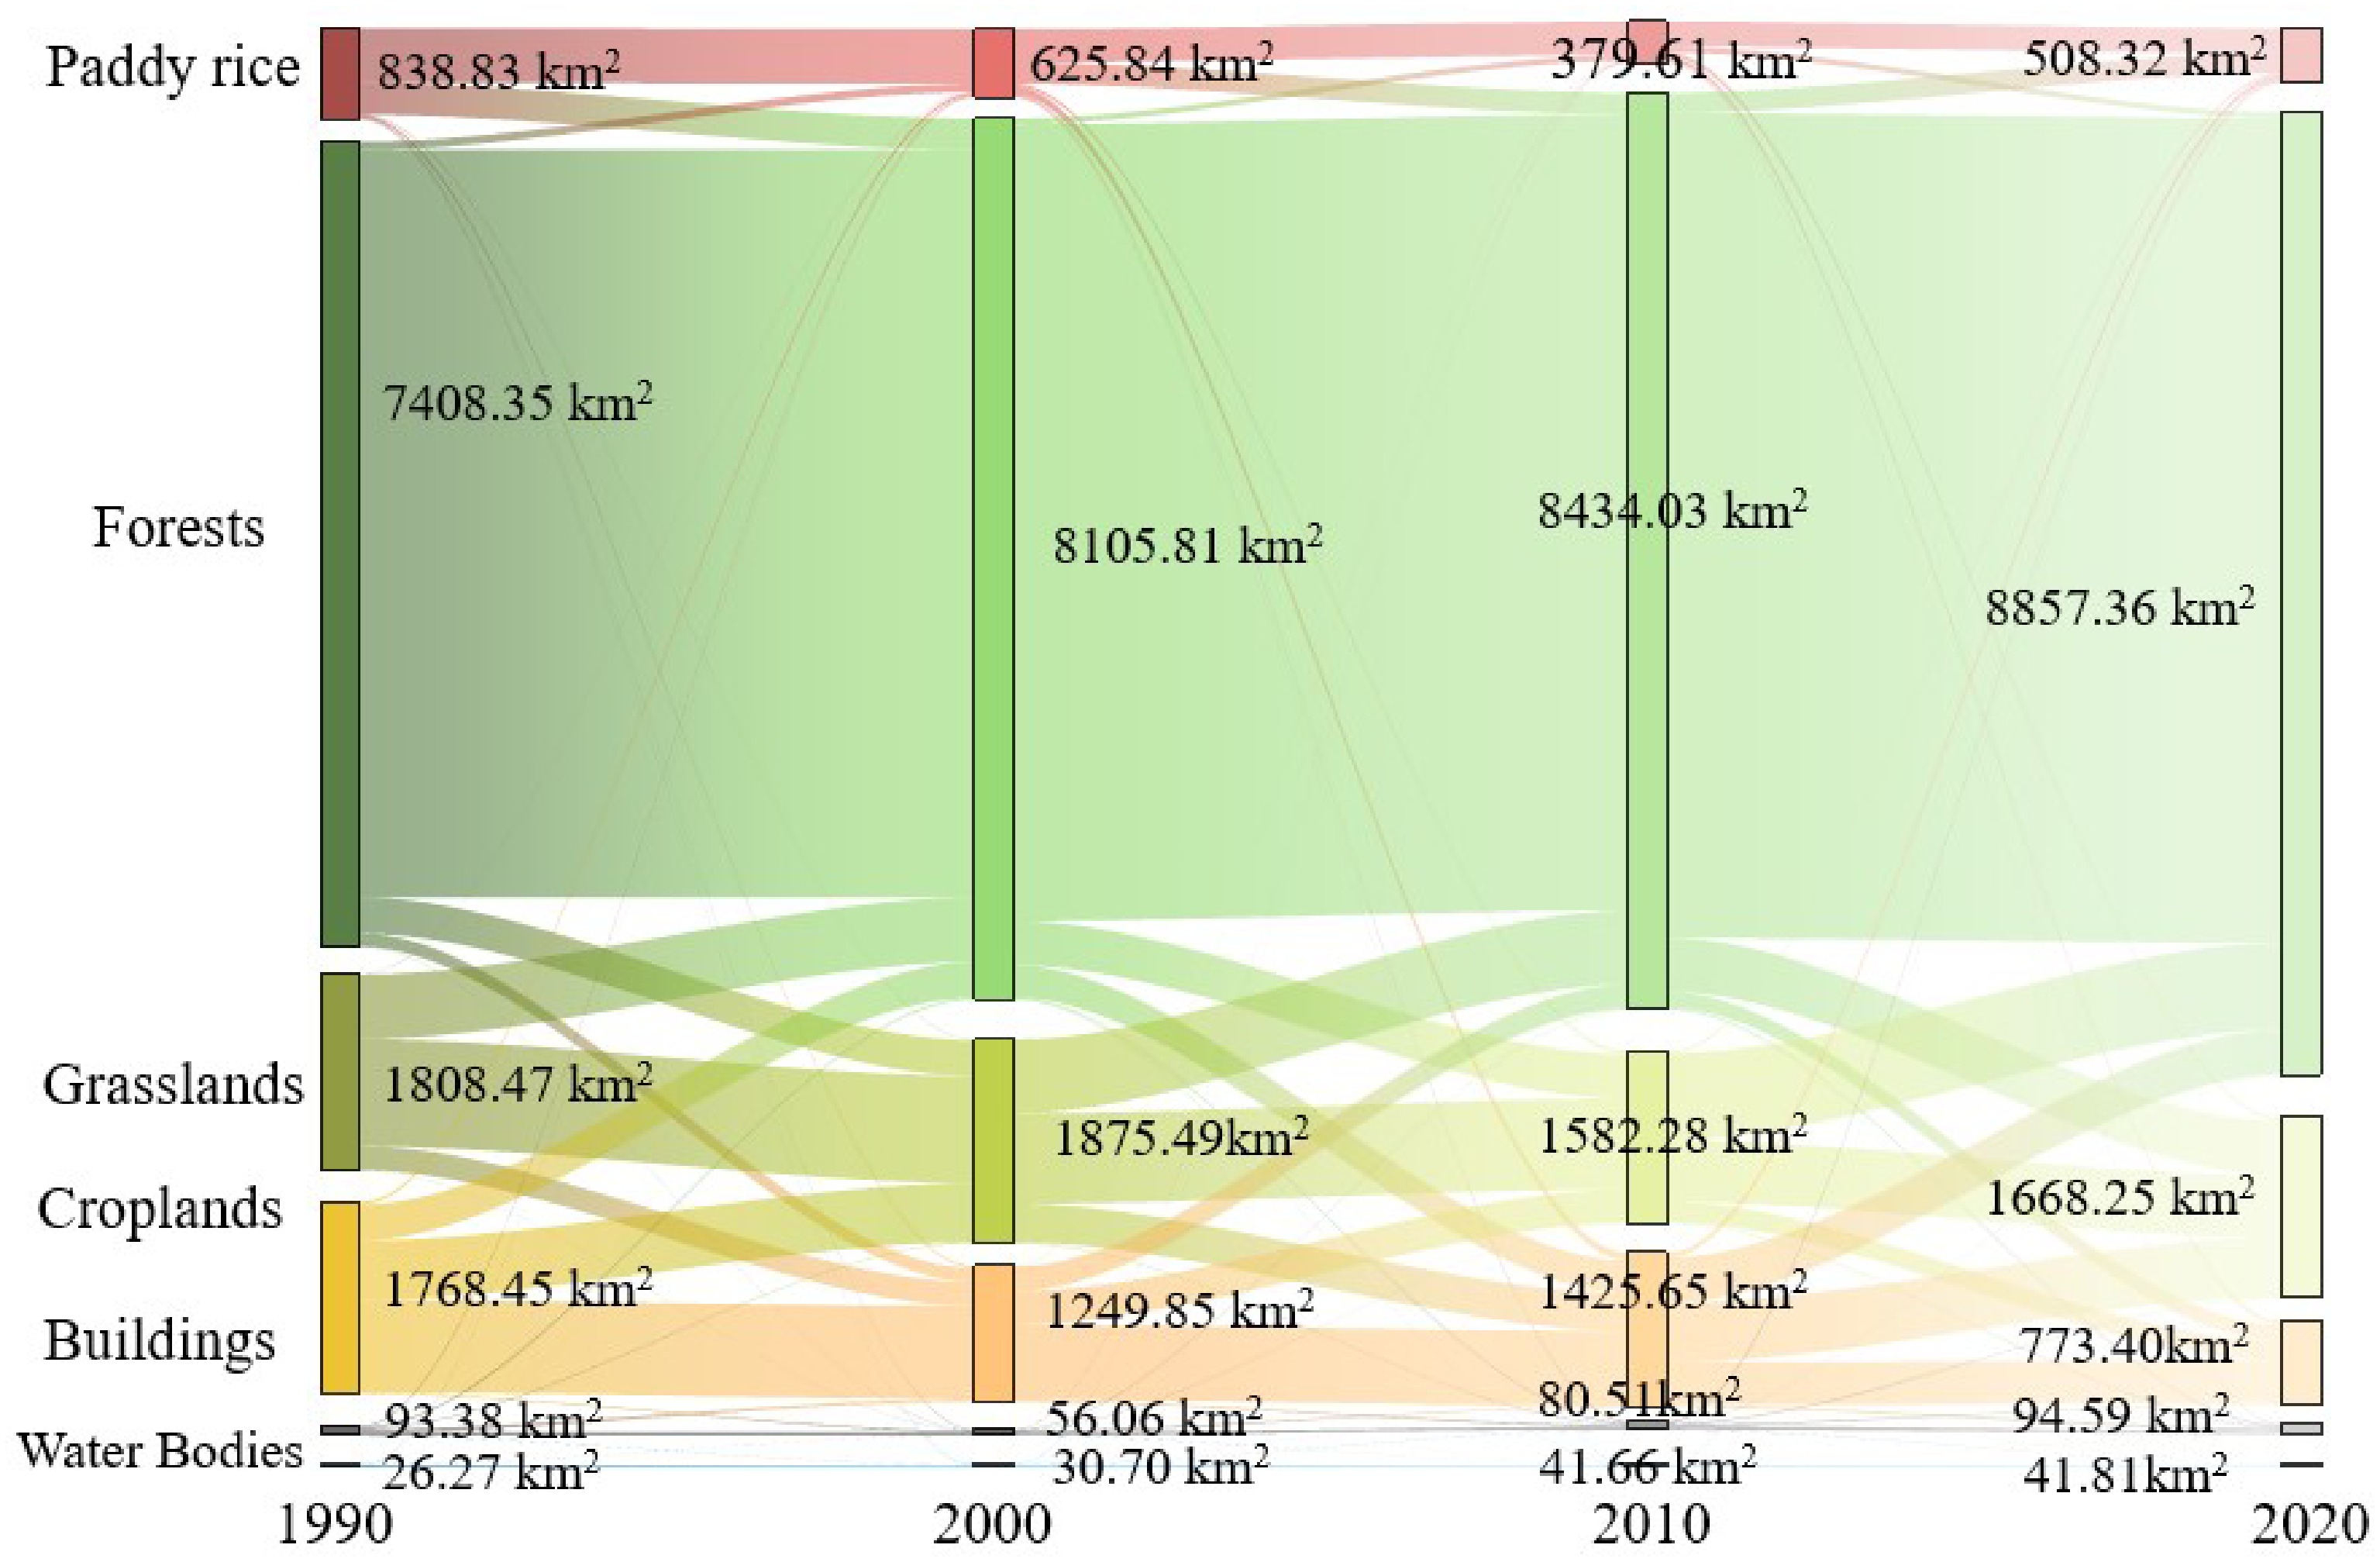
Figure 3.
Sankey diagram of the land use transfer matrix, 1990–2020.
-
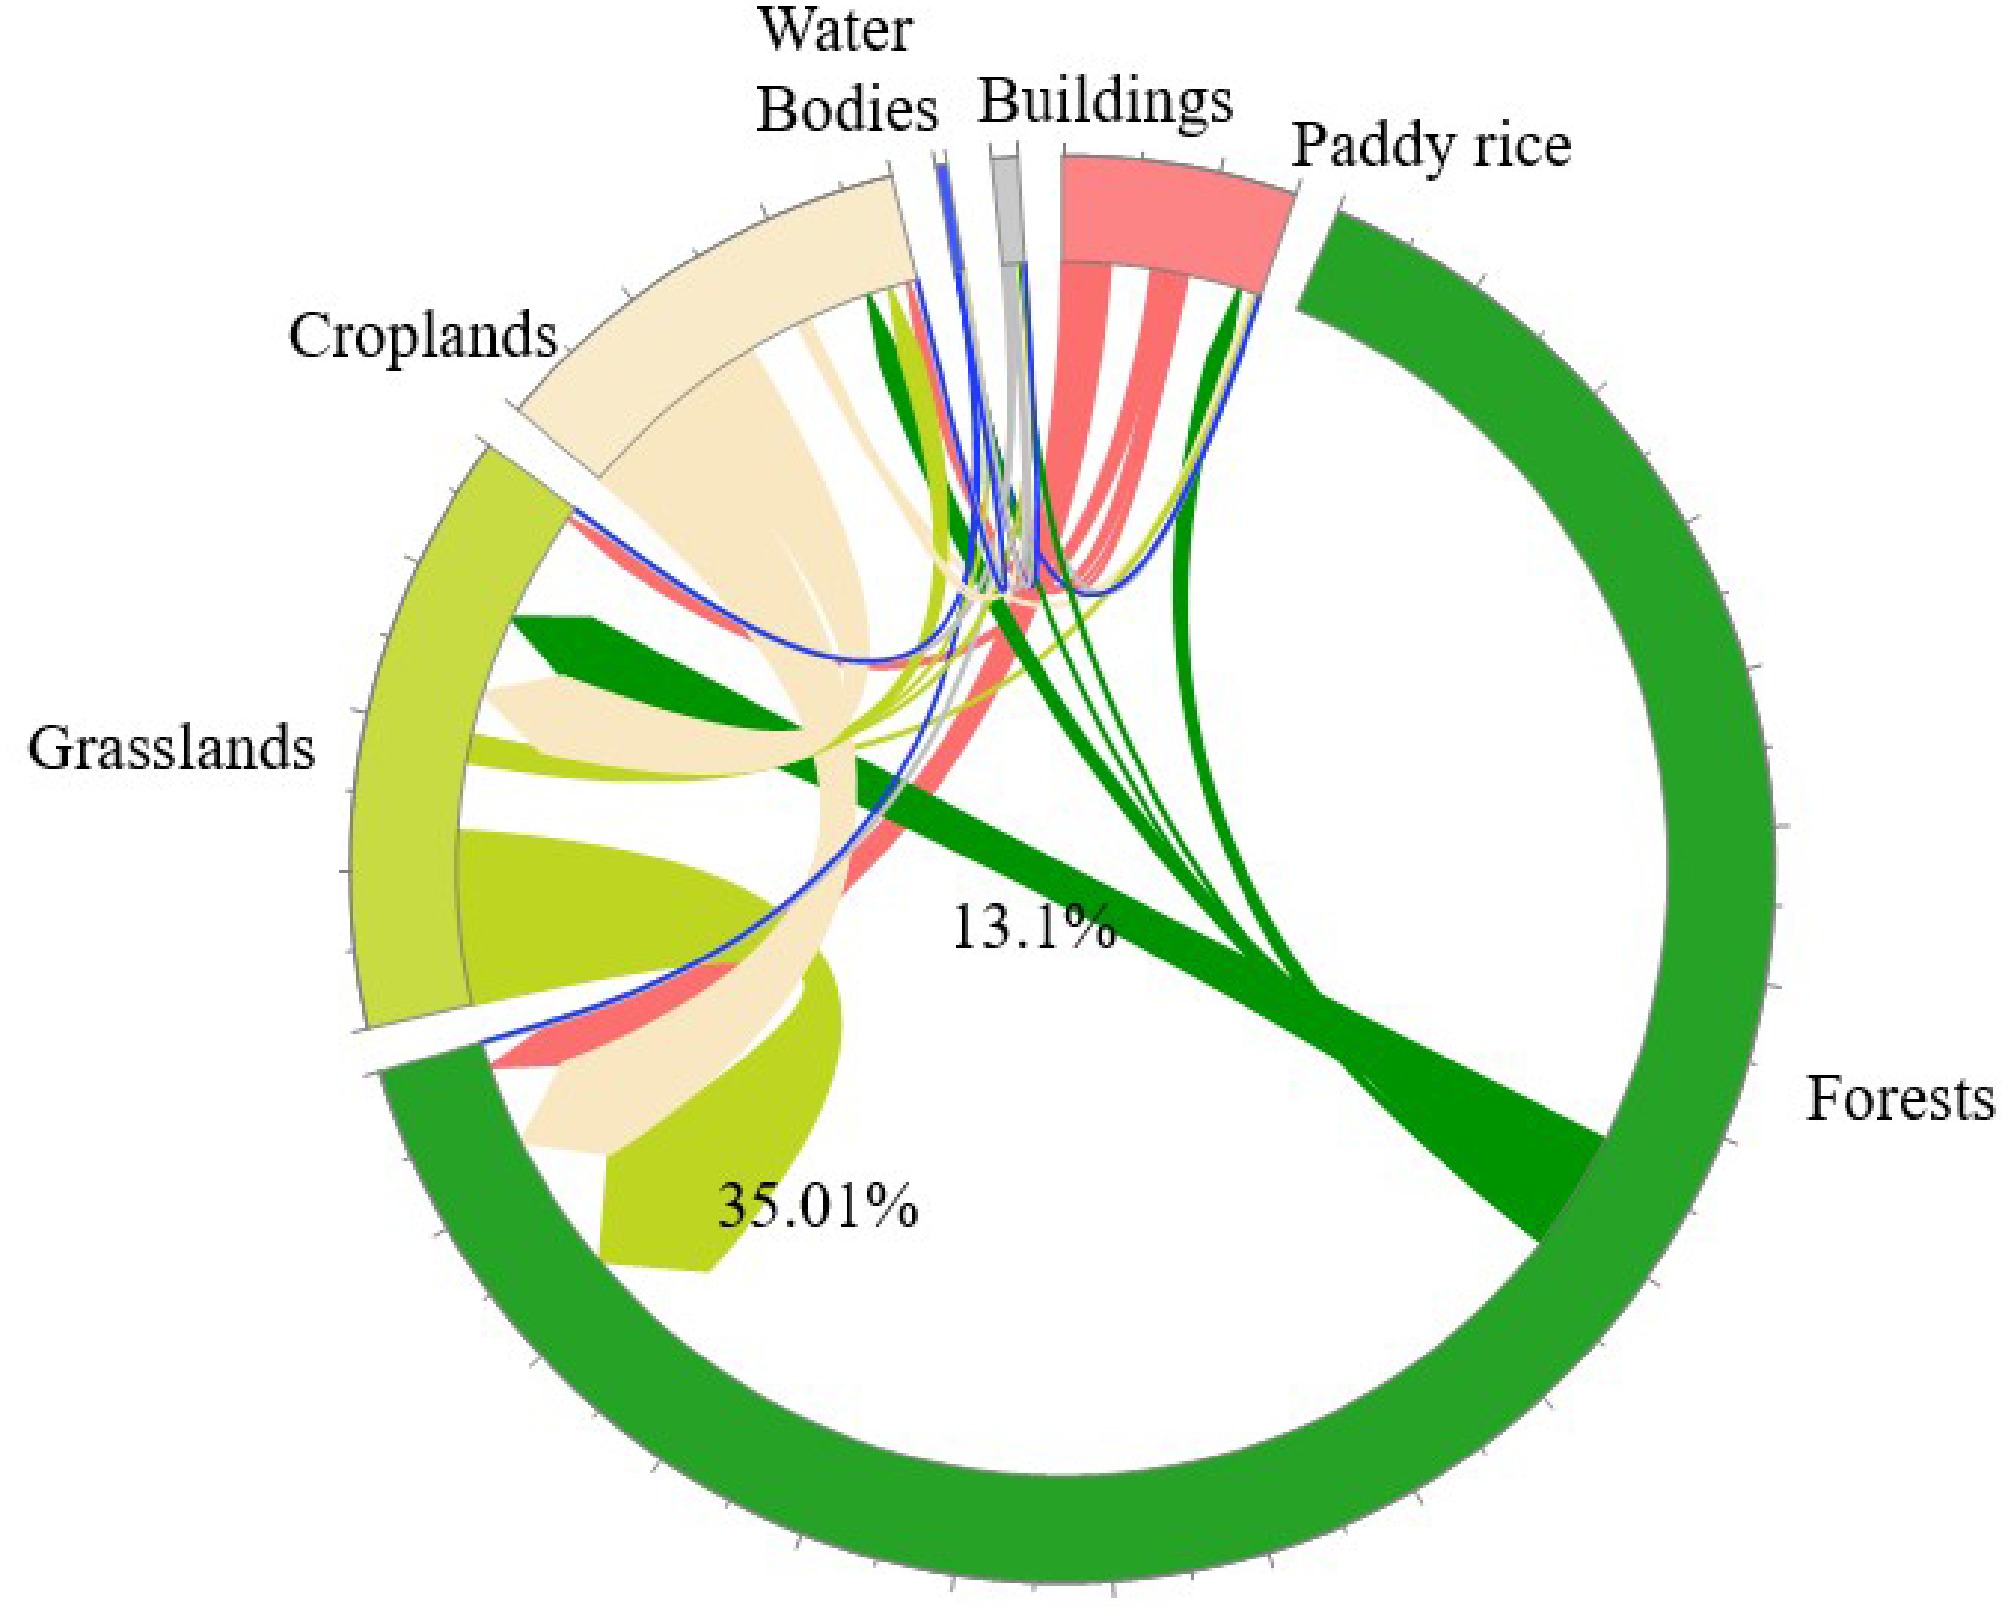
Figure 4.
Chordal diagram of land use transfer matrix, 1990–2020.
-
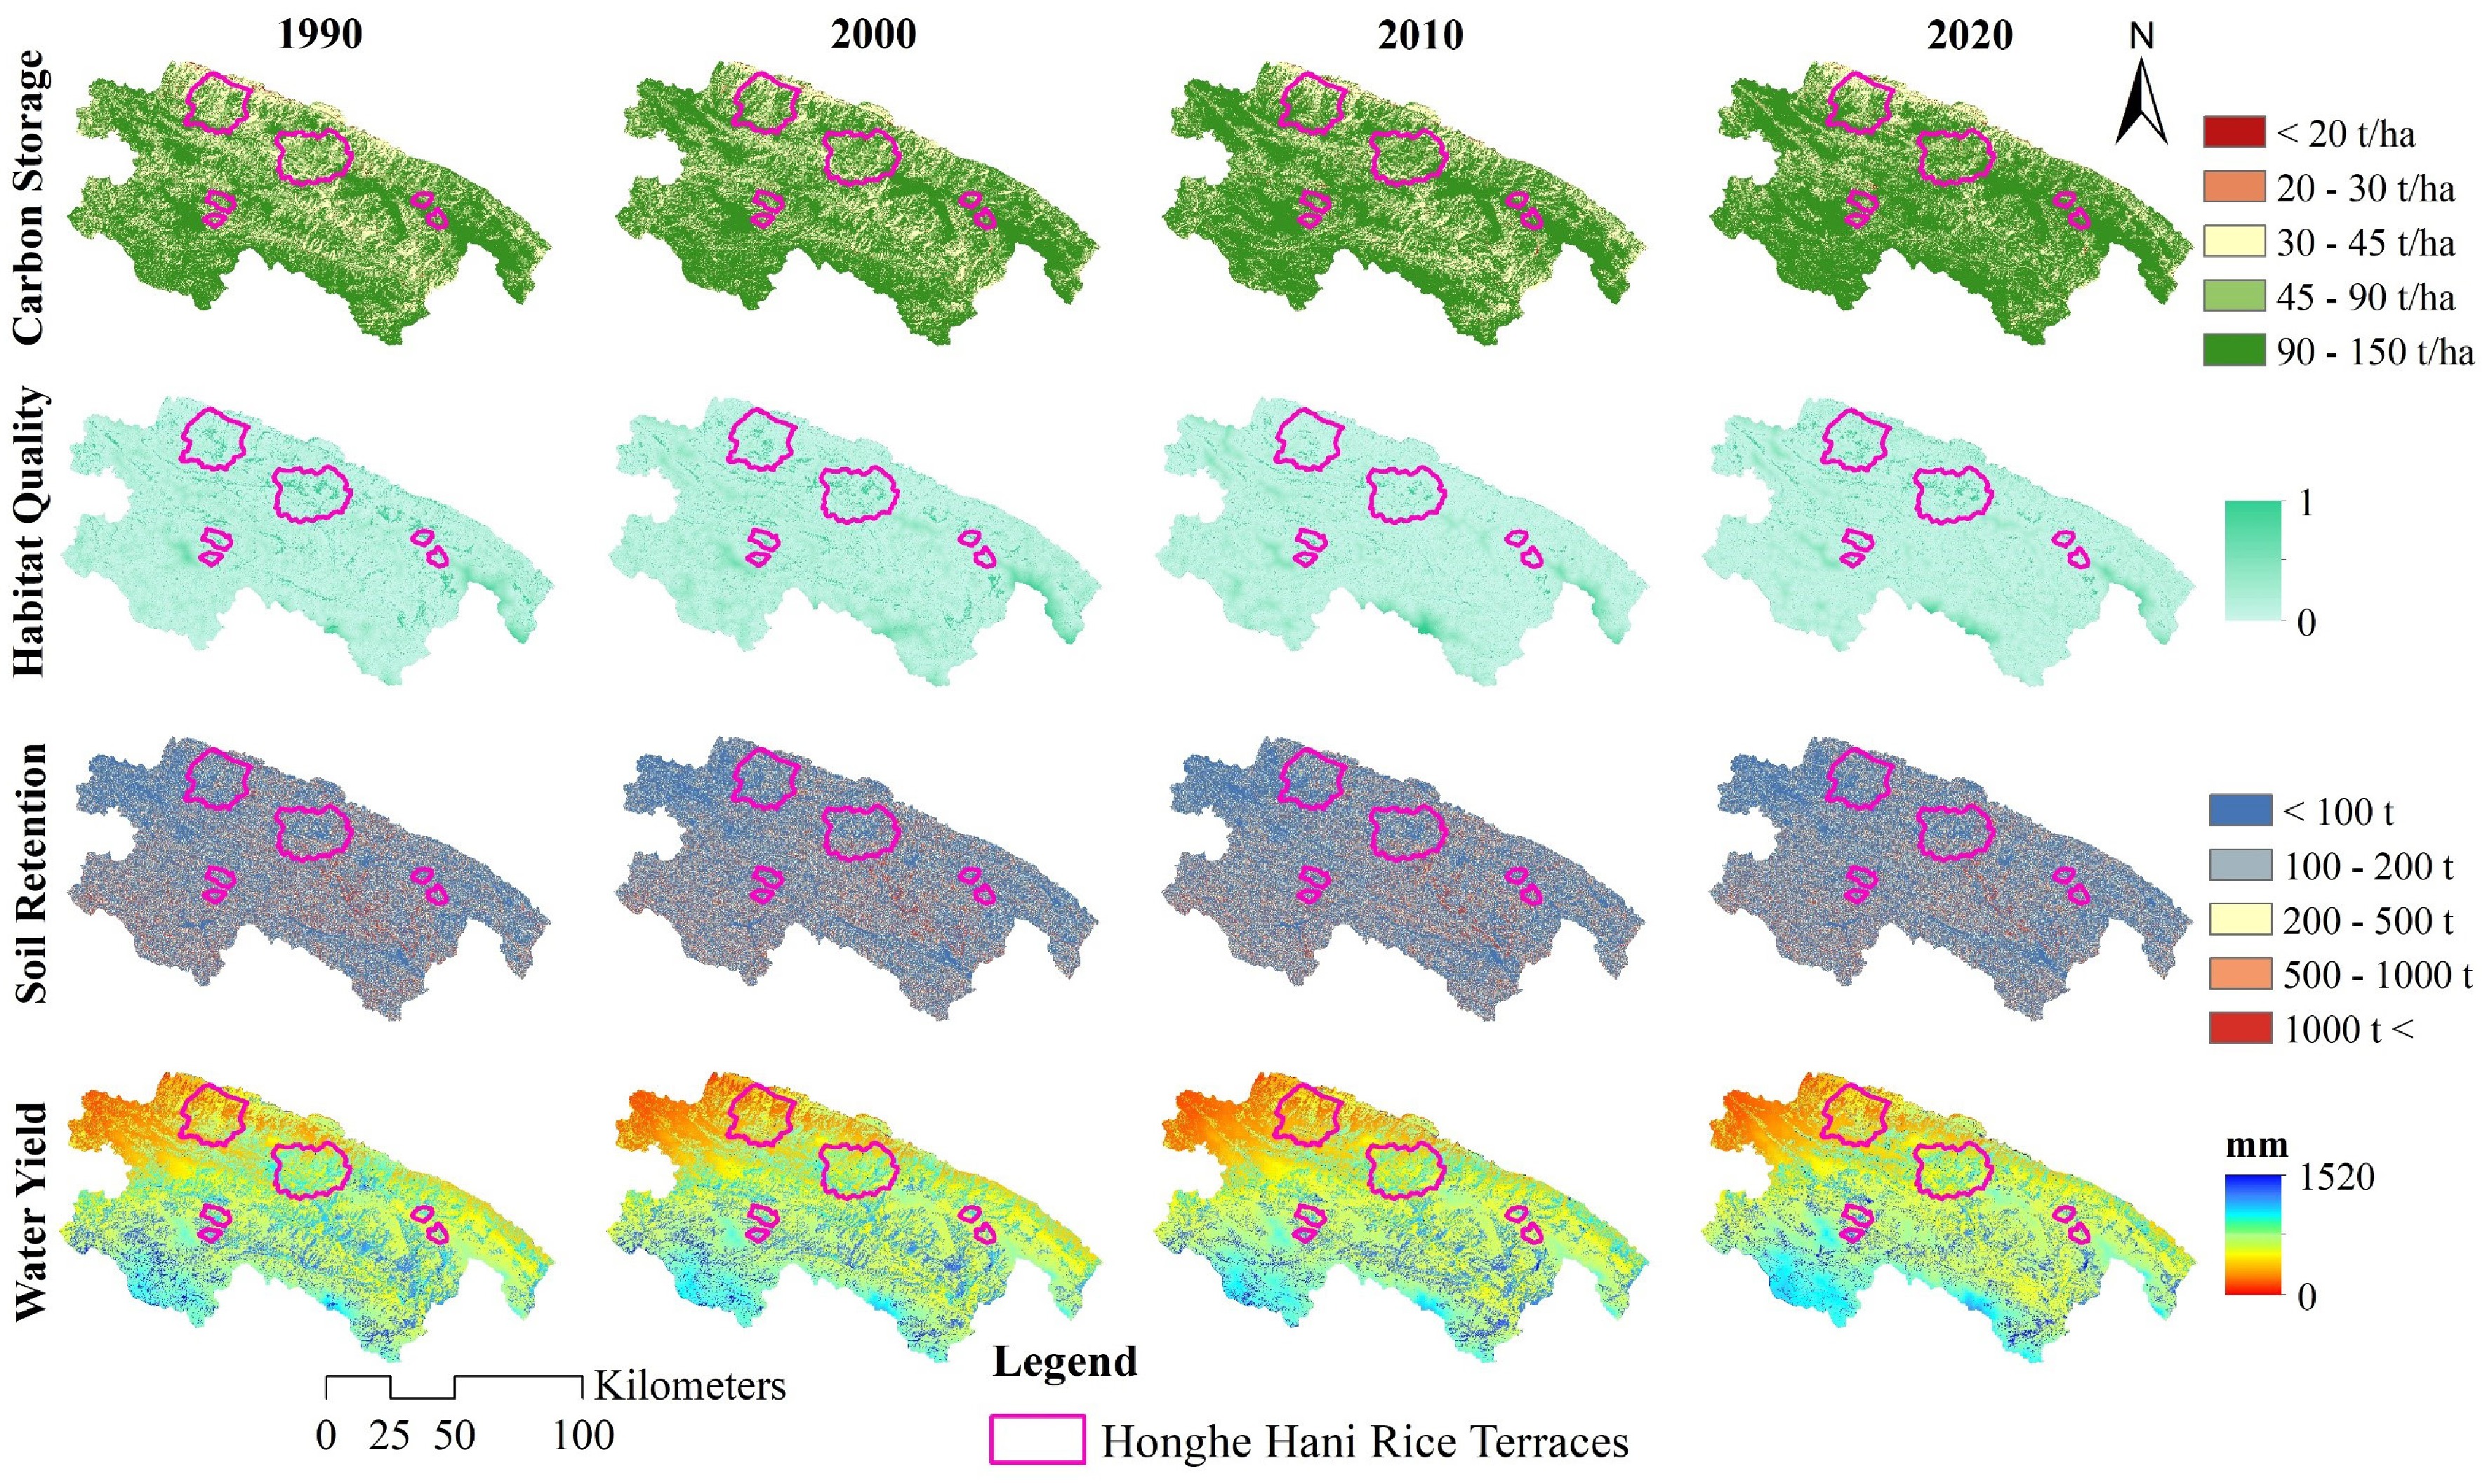
Figure 5.
Spatial distribution of ecosystem services in the HHRT, 1990–2020.
-
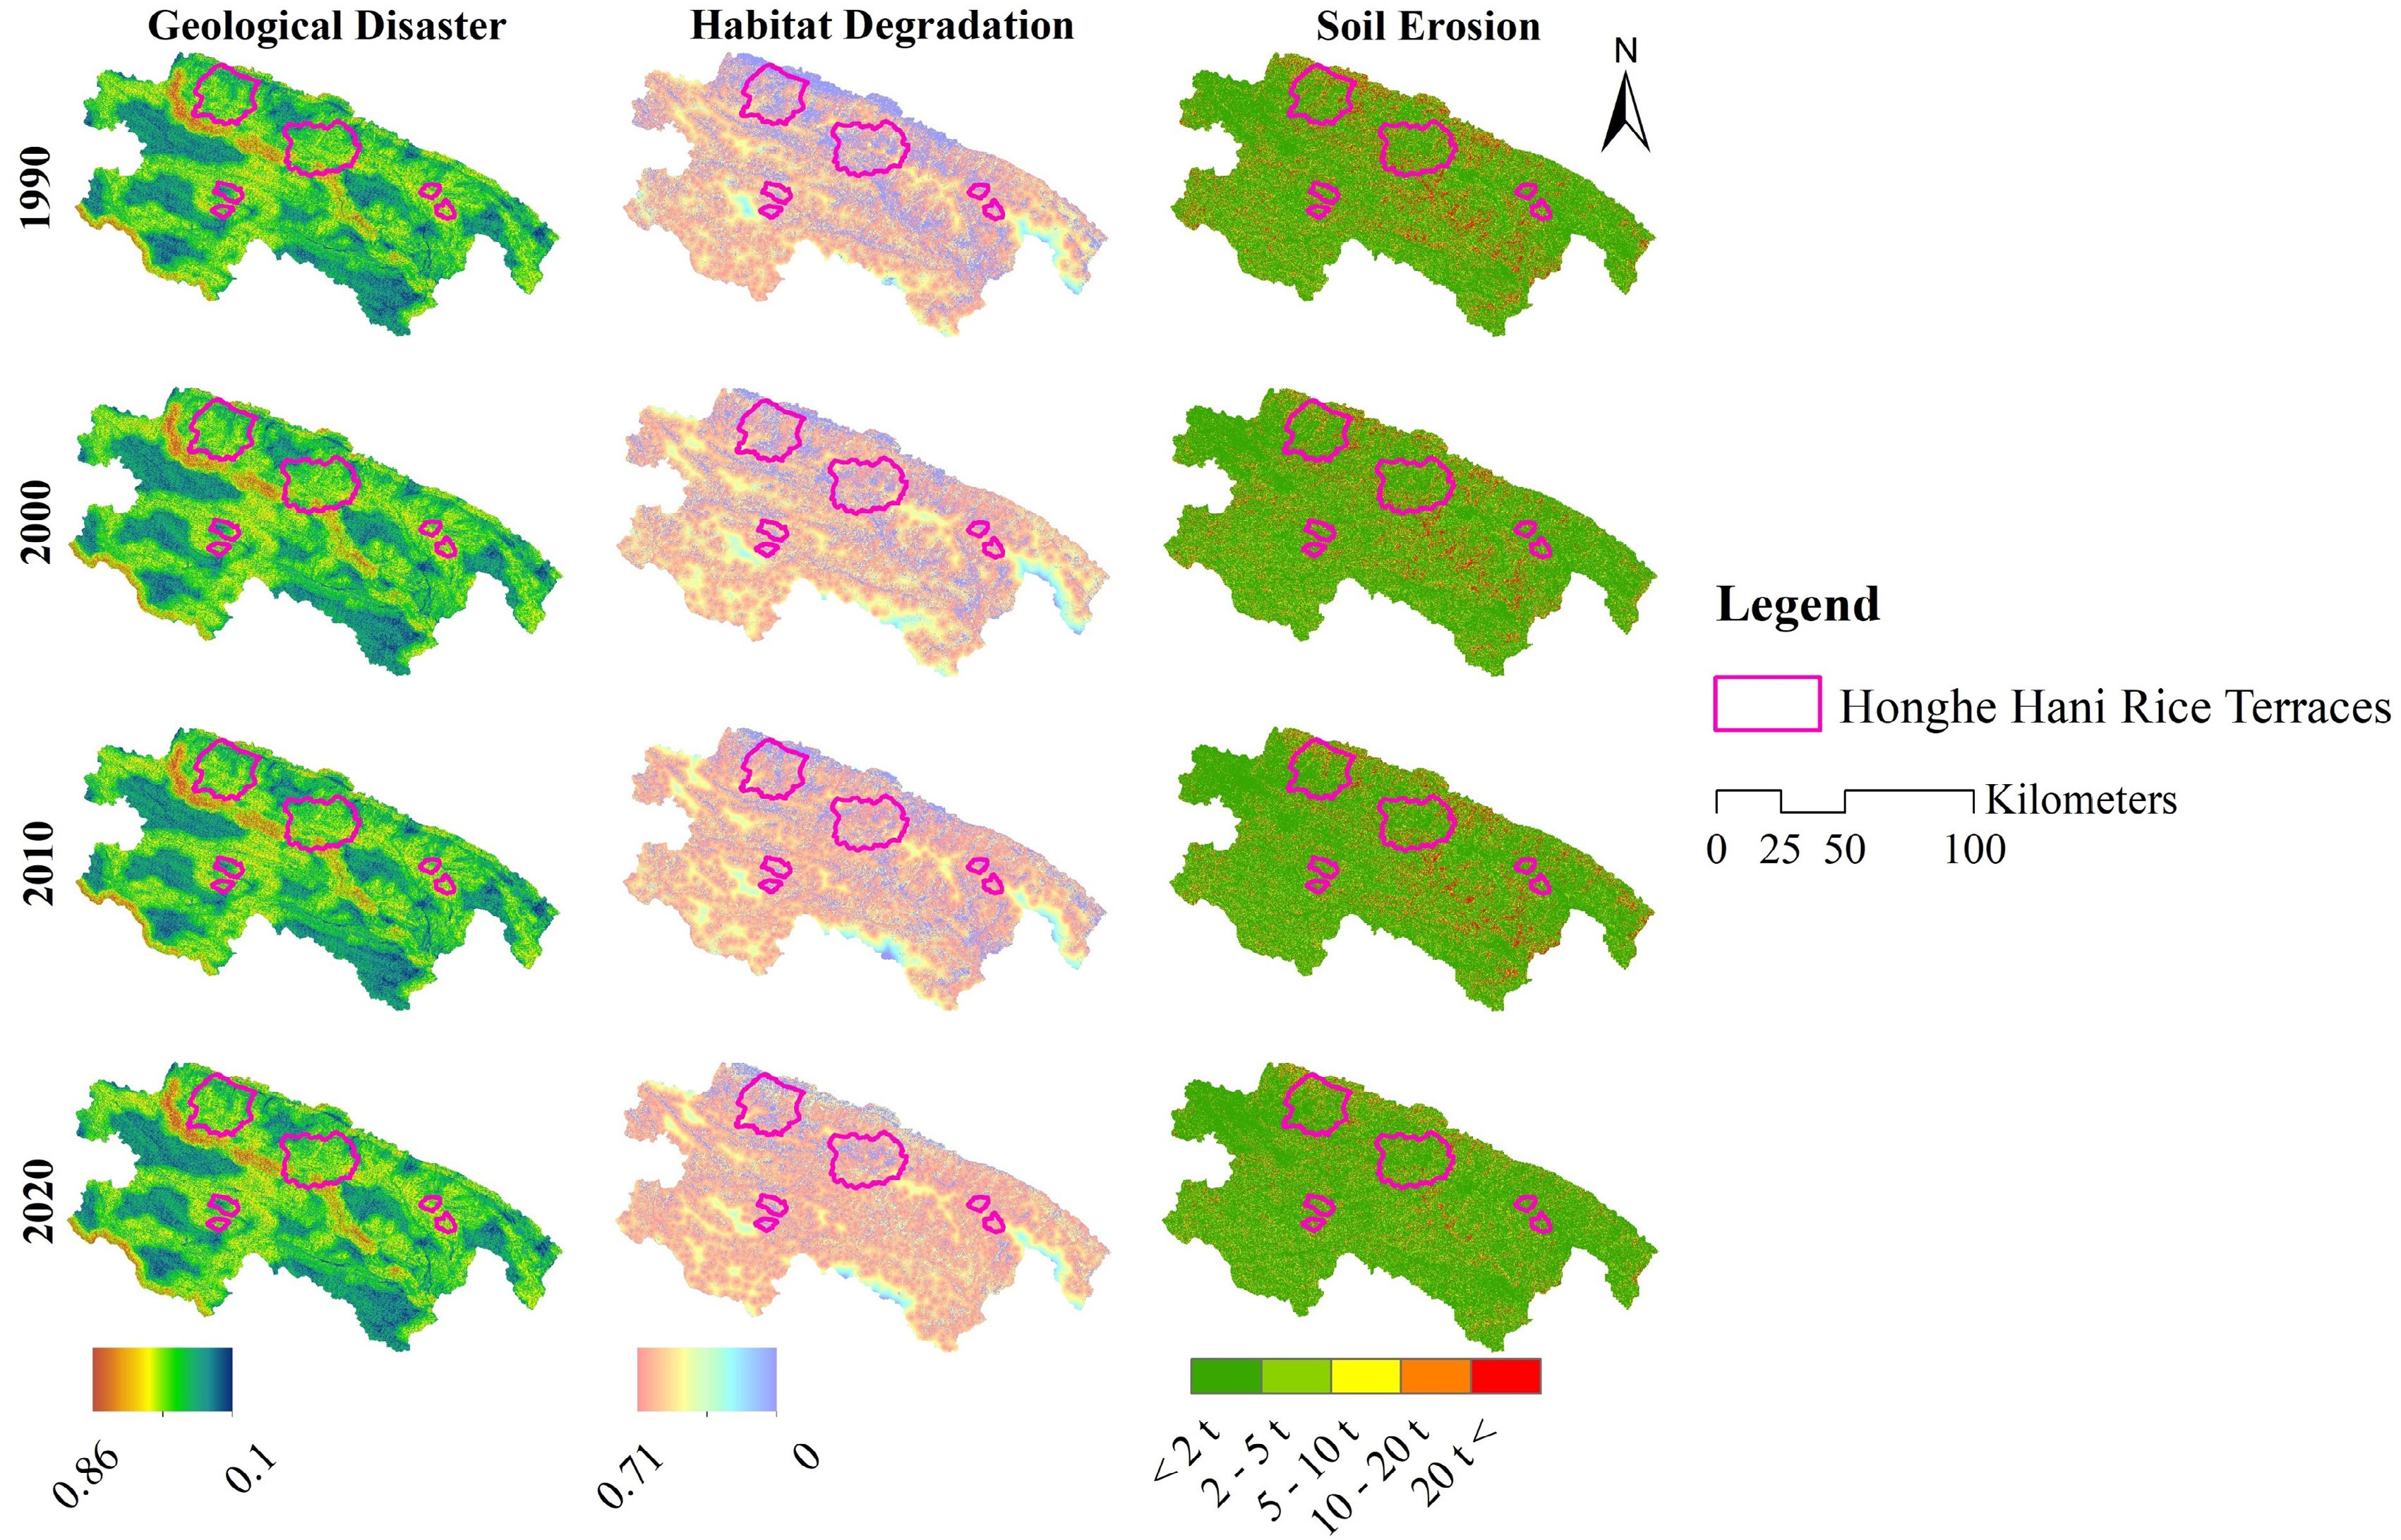
Figure 6.
Changes in ecological sensitivity of the HHRT, 1990–2020.
-
Data Type Data source Spatial resolution Related model Watersheds Shape file http://ngcc.sbsm.gov.cn/article/xxfw/bgxz/ WY Land use type Raster Google Earth Engine[20] 30 m CS, SDR, WY, HQ,
GD, HD, SEDigital elevation model Raster http://www.gscloud.cn/ 30 m SDR, GD Reference evapotranspiration Raster http://www.cgiar-csi.org/data/global-aridity-and-pet-database Resampled to 30 m WY Depth to root restricting layer Raster Defined from land use types and InVEST user's guide Resampled to 30 m WY Annual average precipitation Raster http://www.worldclimate.com/ Resampled to 30 m WY Precipitation erosivity Raster https://gda.bnu.edu.cn/sypt/sjgx/tdlytdfgsjj/index.html Resampled to 30 m SDR, SE Soil erodibility Raster https://gda.bnu.edu.cn/sypt/sjgx/tdlytdfgsjj/index.html Resampled to 30 m SDR, SE Biophysical table CSV file Defined from literature and field work, including each land use types attributes of Kc (the plant evapotranspiration coefficient), load of nutrients, efficiency of nutrient retention, carbon density SDR, WY Plant available water fraction Raster Defined from land use types and InVEST user's guide Resampled to 30 m WY Carbon pools CSV file Defined from InVEST user's guide CS Threats table CSV file Defined from InVEST user's guide HQ, HD Sensitivity table CSV file Defined from InVEST user's guide HQ, HD Notes: WY, water yield. CS, carbon storage. SDR, sediment delivery ratio. HQ, habitat quality. GD, geological disaster. HD, habitat diversity. SE, sensitivity evaluation. Table 1.
Data input for land use map and ecosystem service evaluation.
-
Index Extremely low sensitivity (0.1) Low sensitivity (0.3) Medium sensitivity (0.5) High sensitivity (0.7) Extremely high sensitivity (0.9) DEM (m) < 500 500–1,000 1,000–1,500 1,500–2,000 > 2,000 Slope (°) < 15 15–25 25–35 35–45 > 45 Buffer of roads (m) > 4,000 4,000–3,000 3,000–2,000 2,000–1,000 < 1,000 Buffer of water (m) > 3,000 3,000–2,000 2,000–1,000 1,000–500 < 500 LULC Buildings Croplands Grasslands Forests Paddy rice, water bodies Final result 0–0.25 0.25–0.35 0.35–0.45 0.45–0.55 0.55–1 Table 2.
Geological hazard sensitivity evaluation index system.
Figures
(6)
Tables
(2)