-
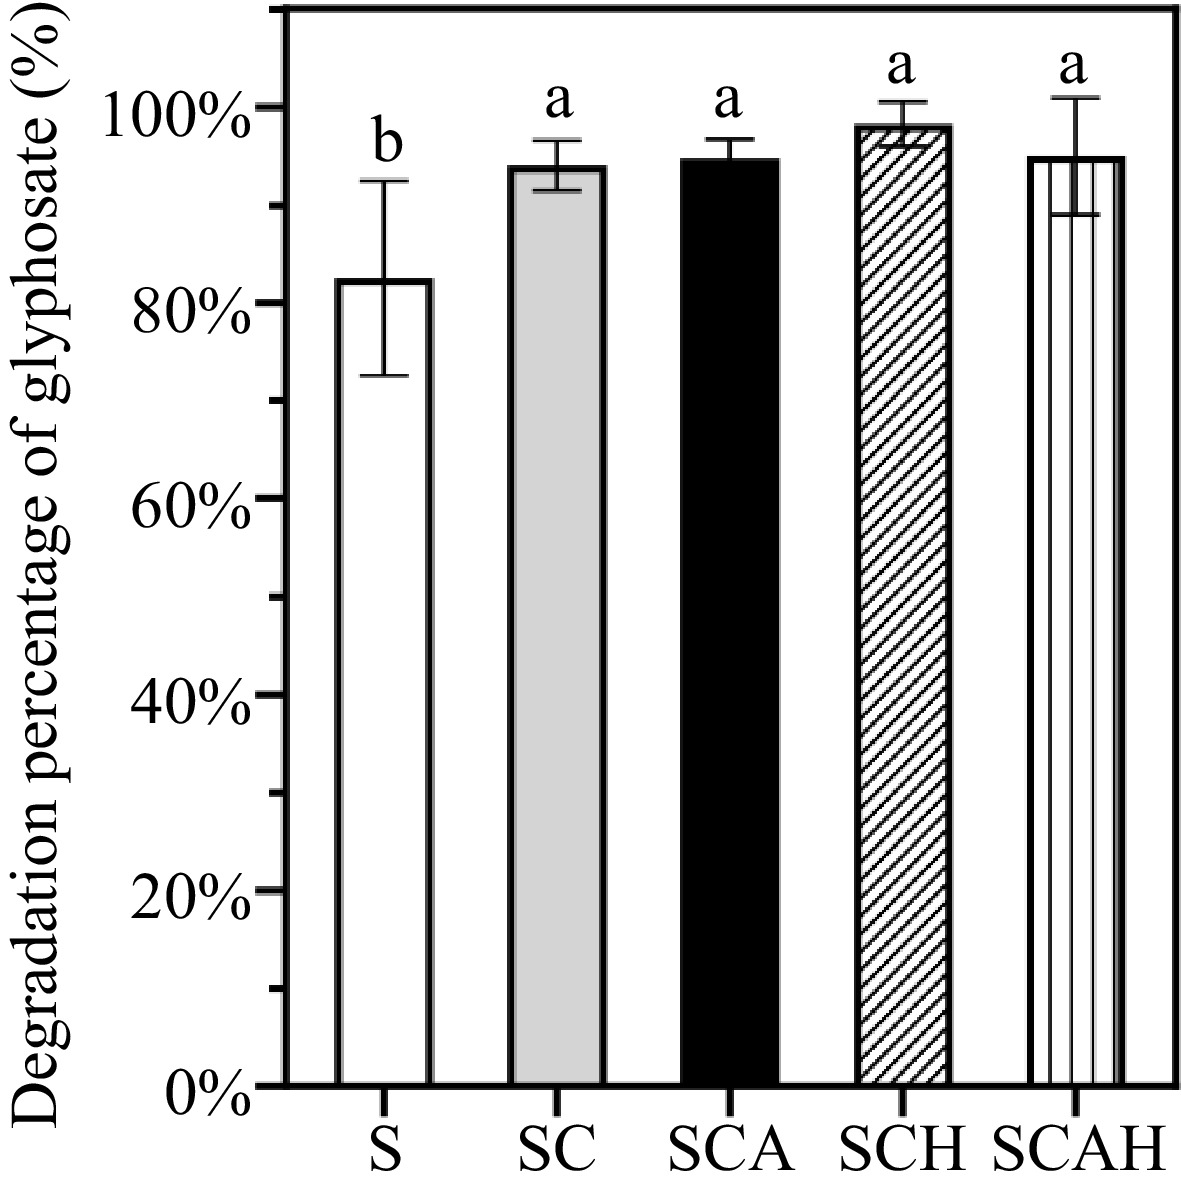
Figure 1.
Degradation percentages of glyphosate in topsoil under different treatments in the coffee plantation. Note: There were three replicates for each treatment (n = 3). Univariate analysis of variance (ANOVA) and Duncan's Multiple Range test were used to assess the significance of the difference. Different letters indicate statistically significant differences (p < 0.05). S, untreated soil; SC, soil with compost; SCA, soil with compost and A. subrufescens inoculation; SCH, soil with compost and high glyphosate concentration; SCAH, soil with compost, A. subrufescens, and high glyphosate concentration.
-
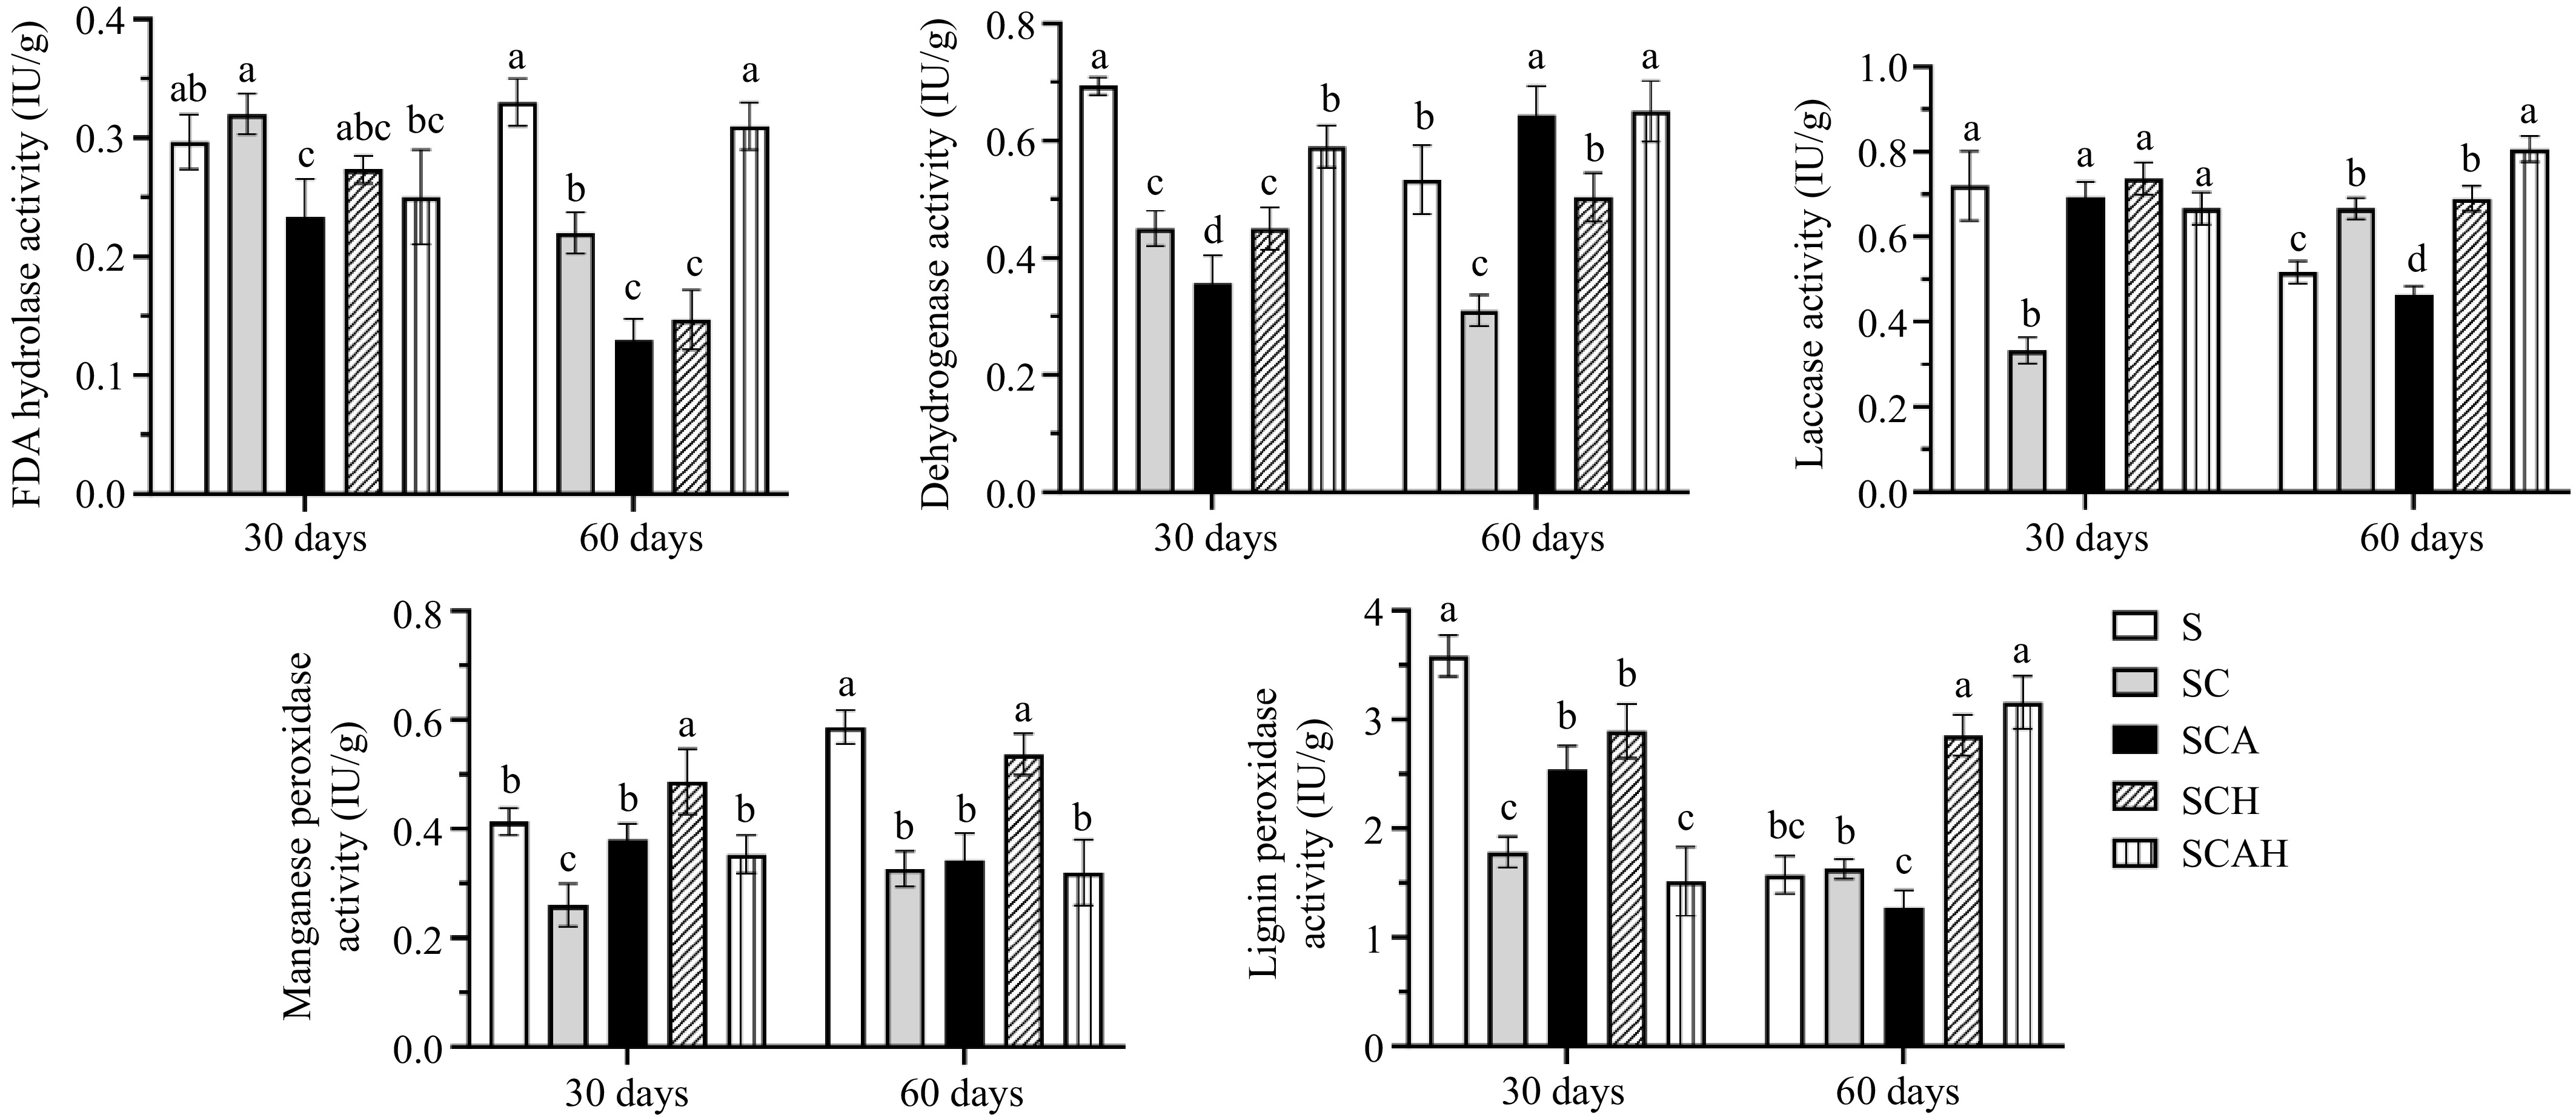
Figure 2.
Changes in soil enzyme activity during cultivation of Agaricus subrufescens in the coffee plantation. Note: There were three replicates for each treatment (n = 3). Univariate analysis of variance (ANOVA) and Duncan's Multiple Range test were used to assess the significance of differences. Different letters indicate statistically significant differences (p < 0.05). S, untreated soil; SC, soil with compost; SCA, soil with compost and A. subrufescens inoculation; SCH, soil with compost and high glyphosate concentration; SCAH, soil with compost, A. subrufescens, and high glyphosate concentration.
-
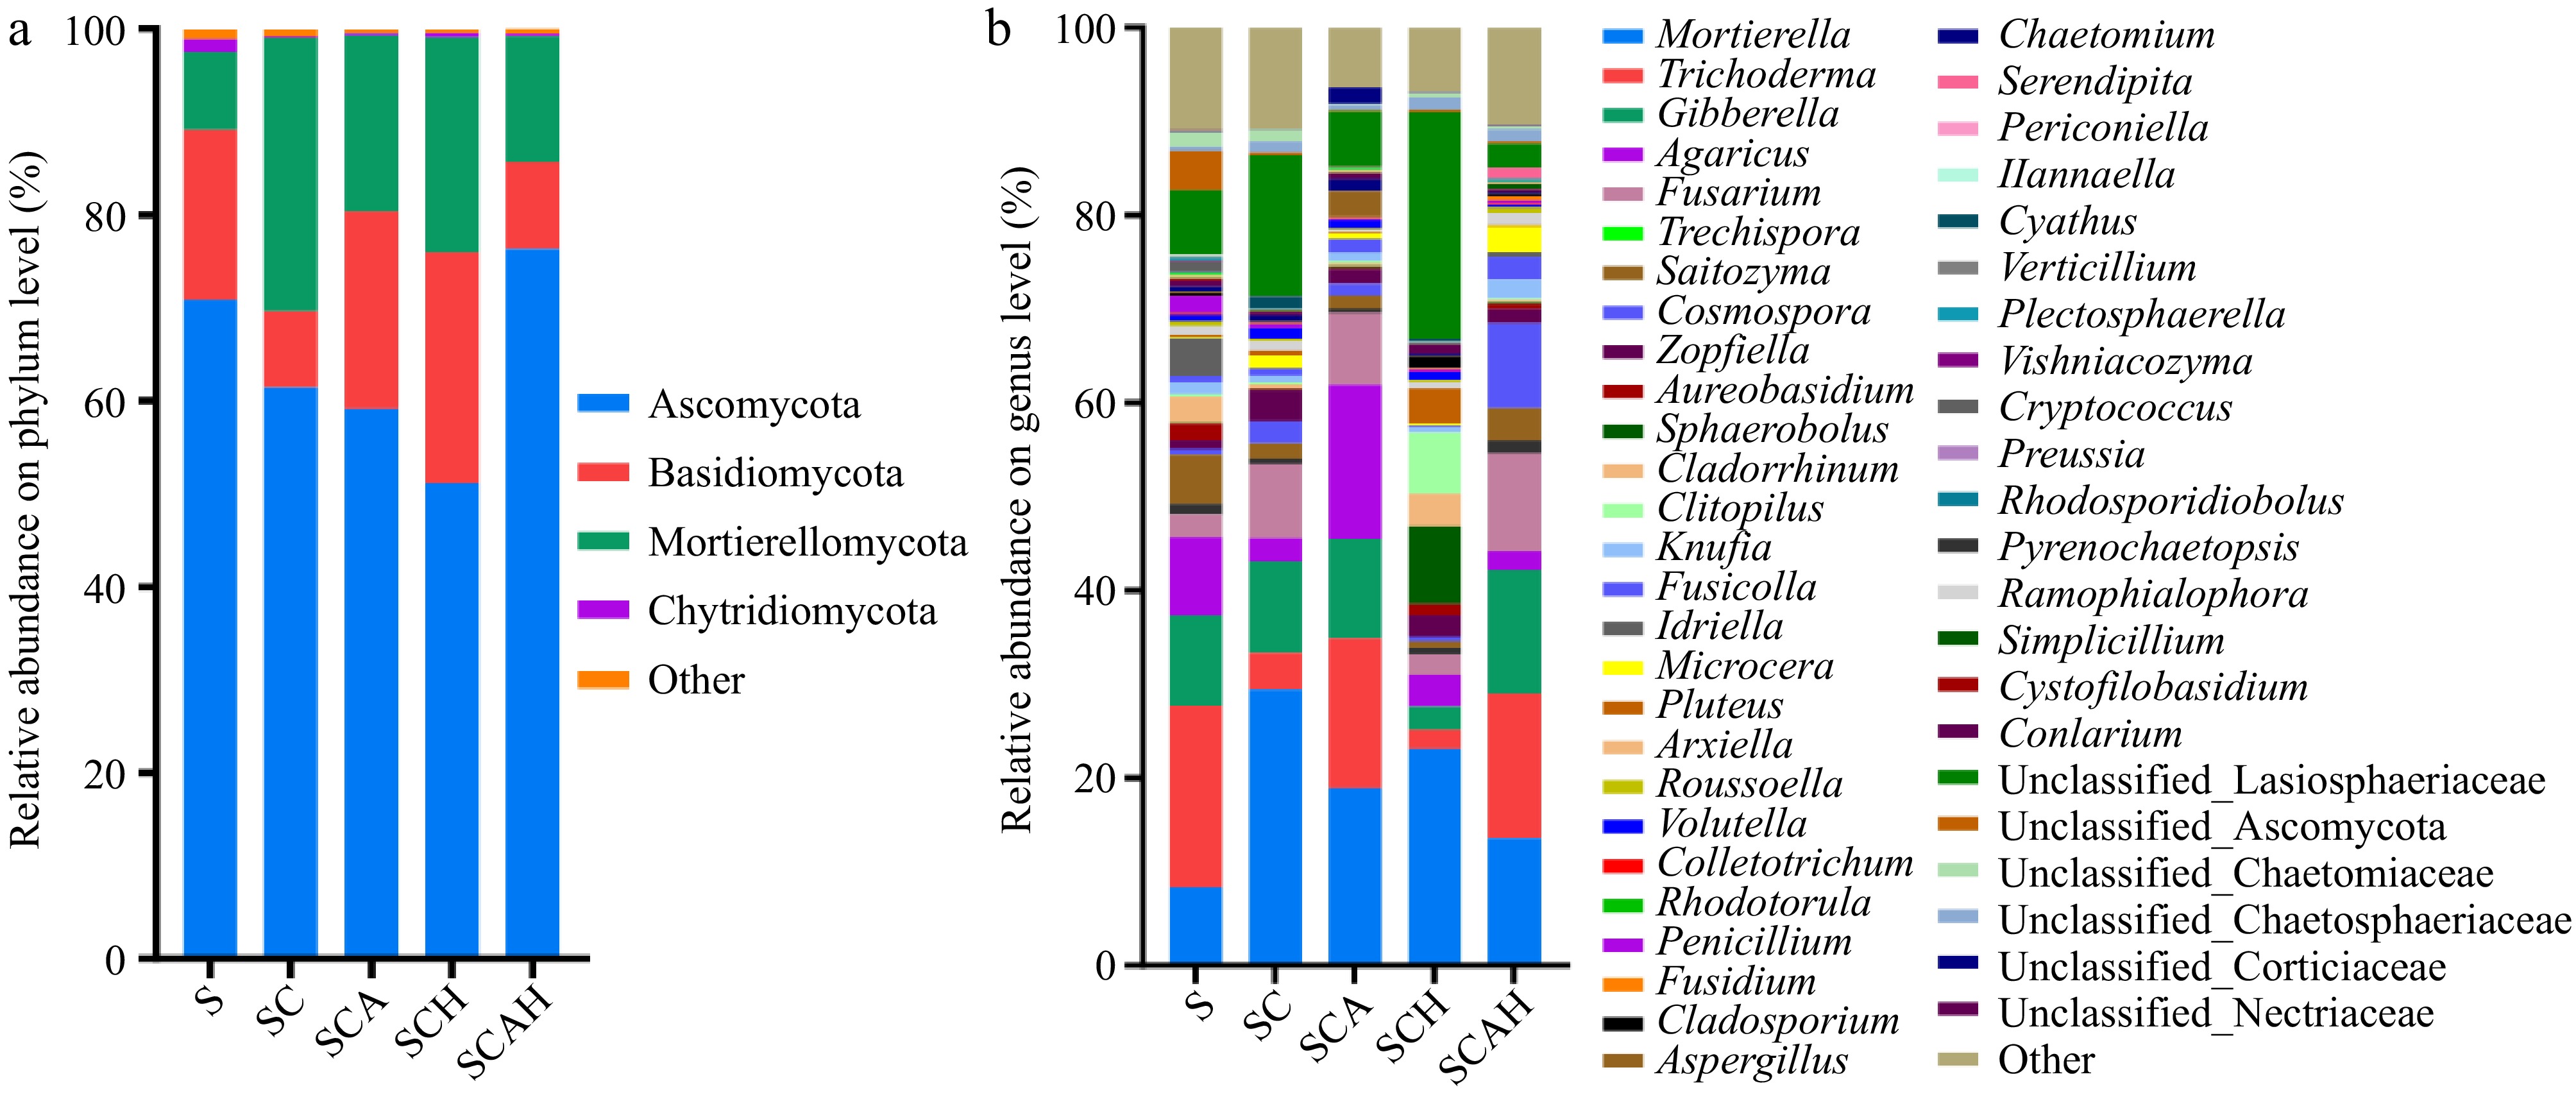
Figure 3.
Composition of soil fungal communities at the (a) phylum, and (b) genus levels. Soil samples were taken from the respective treatments in the coffee plantation at the experimental site in Pu'er, Yunnan. S, untreated soil; SC, soil with compost; SCA, soil with compost and A. subrufescens inoculation; SCH, soil with compost and high glyphosate concentration; SCAH, soil with compost, A. subrufescens, and high glyphosate concentration.
-
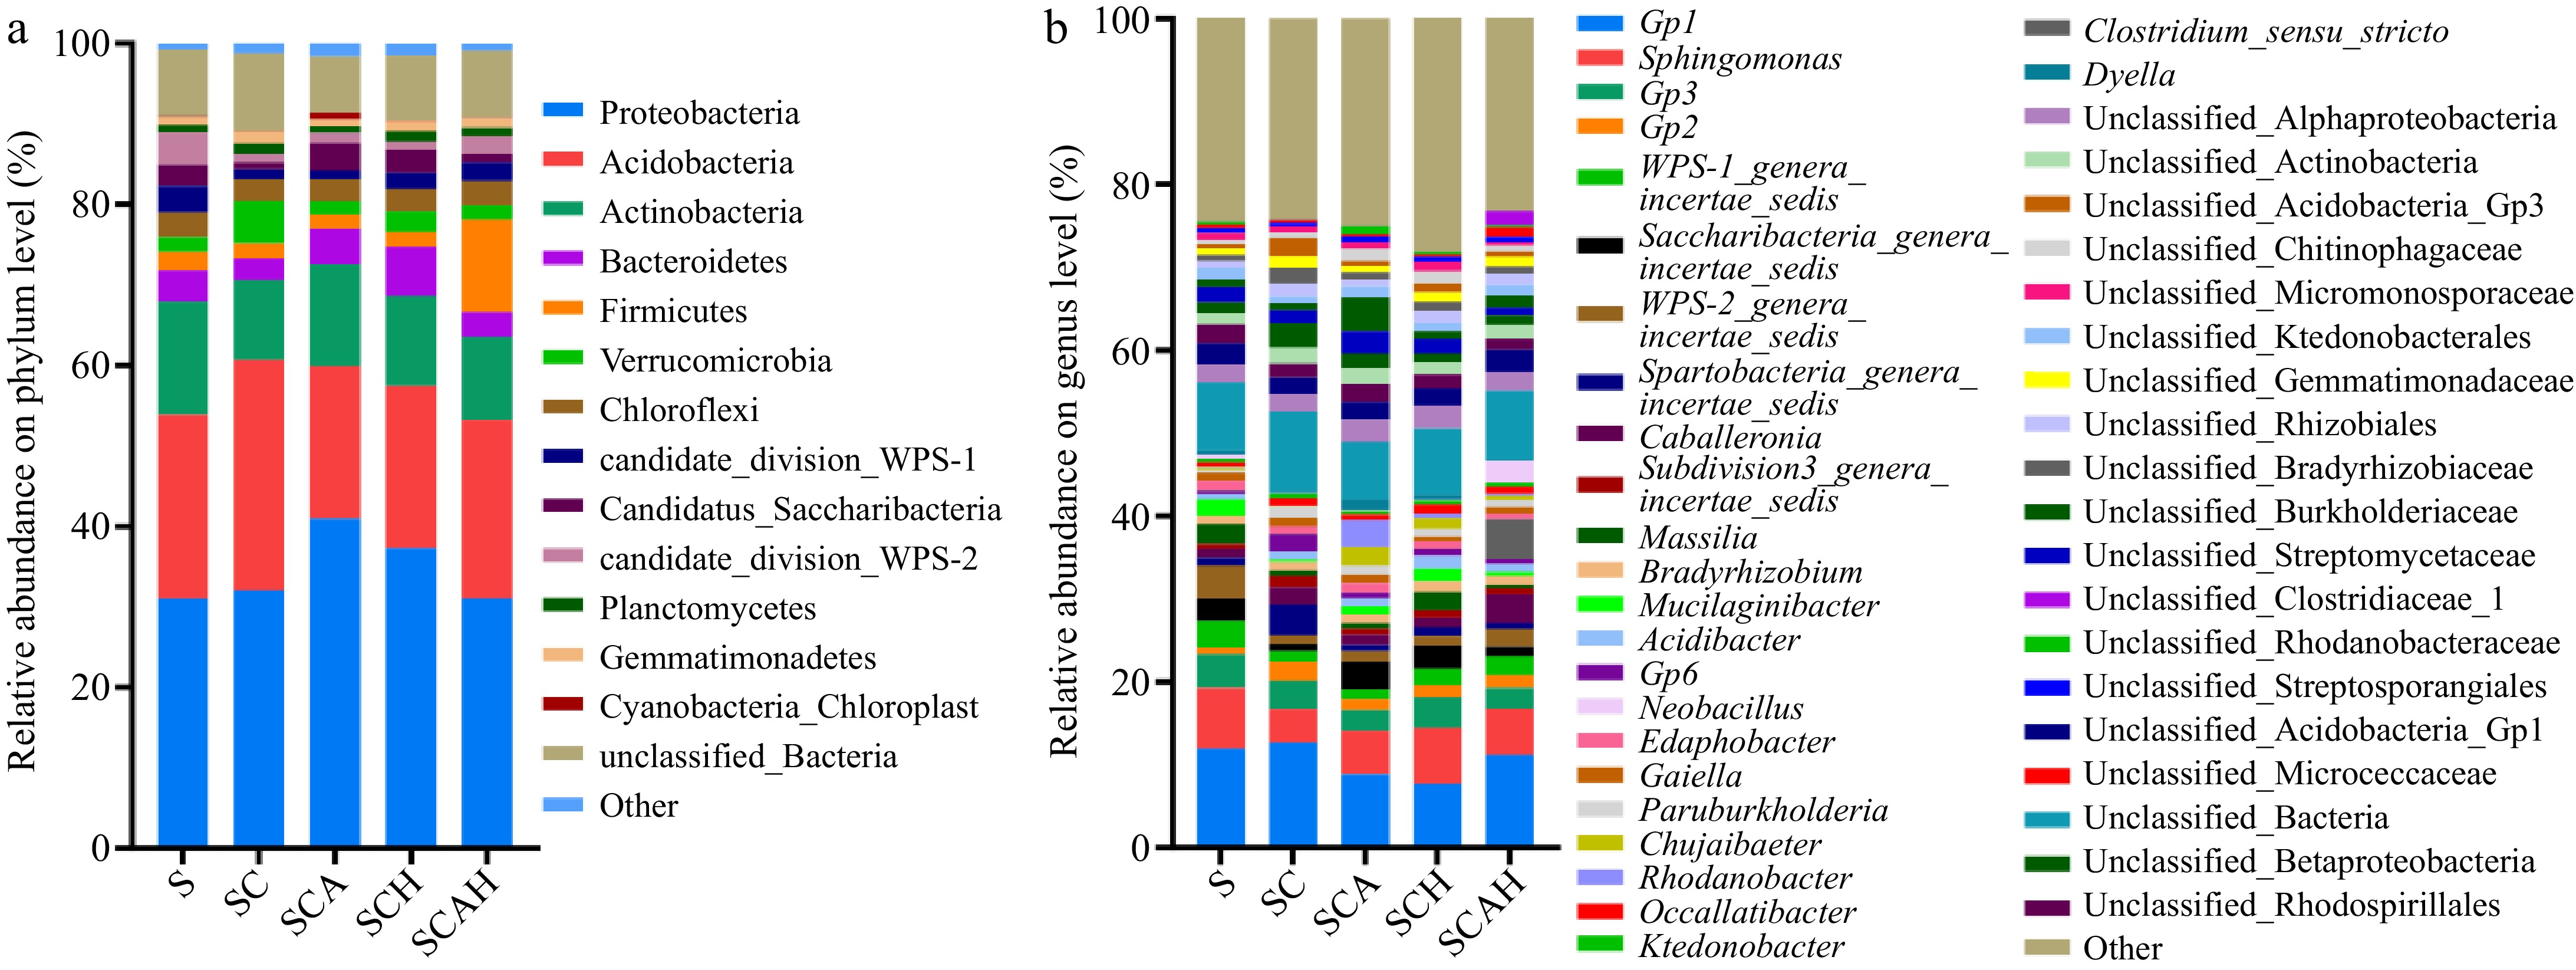
Figure 4.
Composition of soil bacterial communities at the (a) phylum, and (b) genus levels. Soil samples were taken from the respective treatments in the coffee plantation at the experimental site in Pu'er, Yunnan. S, untreated soil; SC, soil with compost; SCA, soil with compost and A. subrufescens inoculation; SCH, soil with compost and high glyphosate concentration; SCAH, soil with compost, A. subrufescens, and high glyphosate concentration.
-
Sample code Unit Value (before the experiment begins) Value (12 months after the experiment) 1 mg/kg 0.048 < 0.01 2 mg/kg < 0.01 < 0.01 3 mg/kg 0.074 < 0.01 4 mg/kg < 0.01 < 0.01 5 mg/kg 0.105 < 0.01 6 mg/kg 1.06 < 0.01 7 mg/kg 0.028 < 0.01 8 mg/kg 0.027 < 0.01 9 mg/kg 0.021 < 0.01 Table 1.
Glyphosate residue levels in coffee fruits from the experimental site.
-
Alpha index S SC SCA SCH SCAH Shannon 3.25 ± 0.83a 3.22 ± 0.51a 2.81 ± 0.18a 2.68 ± 0.4a 3.27 ± 0.81a Chao1 803.6 ± 120.1a 725.2 ± 43.1a 650.0 ± 82.3a 682.3 ± 48.7a 667.1 ± 17.8a Coverage 99.93% 99.92% 99.91% 99.91% 99.92% Data represent the means ± standard deviations (n = 3). The results of multiple comparisons are marked with different letters to indicate significant differences (p < 0.05). Soil samples were taken from the respective treatments in the coffee plantation at the experimental site in Pu'er, Yunnan. S, untreated soil; SC, soil with compost; SCA, soil with compost and A. subrufescens inoculation; SCH, soil with compost and high glyphosate concentration; SCAH, soil with compost, A. subrufescens, and high glyphosateconcentration. Table 2.
Alpha diversity indices of the soil fungal communities for each treatment.
-
Alpha index S SC SCA SCH SCAH Shannon 6.18 ± 0.16abc 6.43 ± 0.31ab 5.98 ± 0.31c 6.57 ± 0.15a 6.03 ± 0.10bc Chao1 4789.8 ± 329.2ab 4905.6 ± 437ab 4245.7 ± 510.4b 5216.8 ± 28.1a 4544.1 ± 372.4ab Coverage 98.85% 98.70% 98.84% 98.76% 98.85% Data represent the means ± standard deviations (n = 3). The results of multiple comparisons are marked with different letters to indicate significant differences (p < 0.05). Soil samples were taken from the respective treatments in the coffee plantation at the experimental site in Pu'er, Yunnan. S, untreated soil; SC, soil with compost; SCA, soil with compost and A. subrufescens inoculation; SCH, soil with compost and high glyphosate concentration; SCAH, soil with compost, A. subrufescens, and high glyphosateconcentration. Table 3.
Alpha diversity indices of the soil bacterial communities for each treatment.
Figures
(4)
Tables
(3)