-
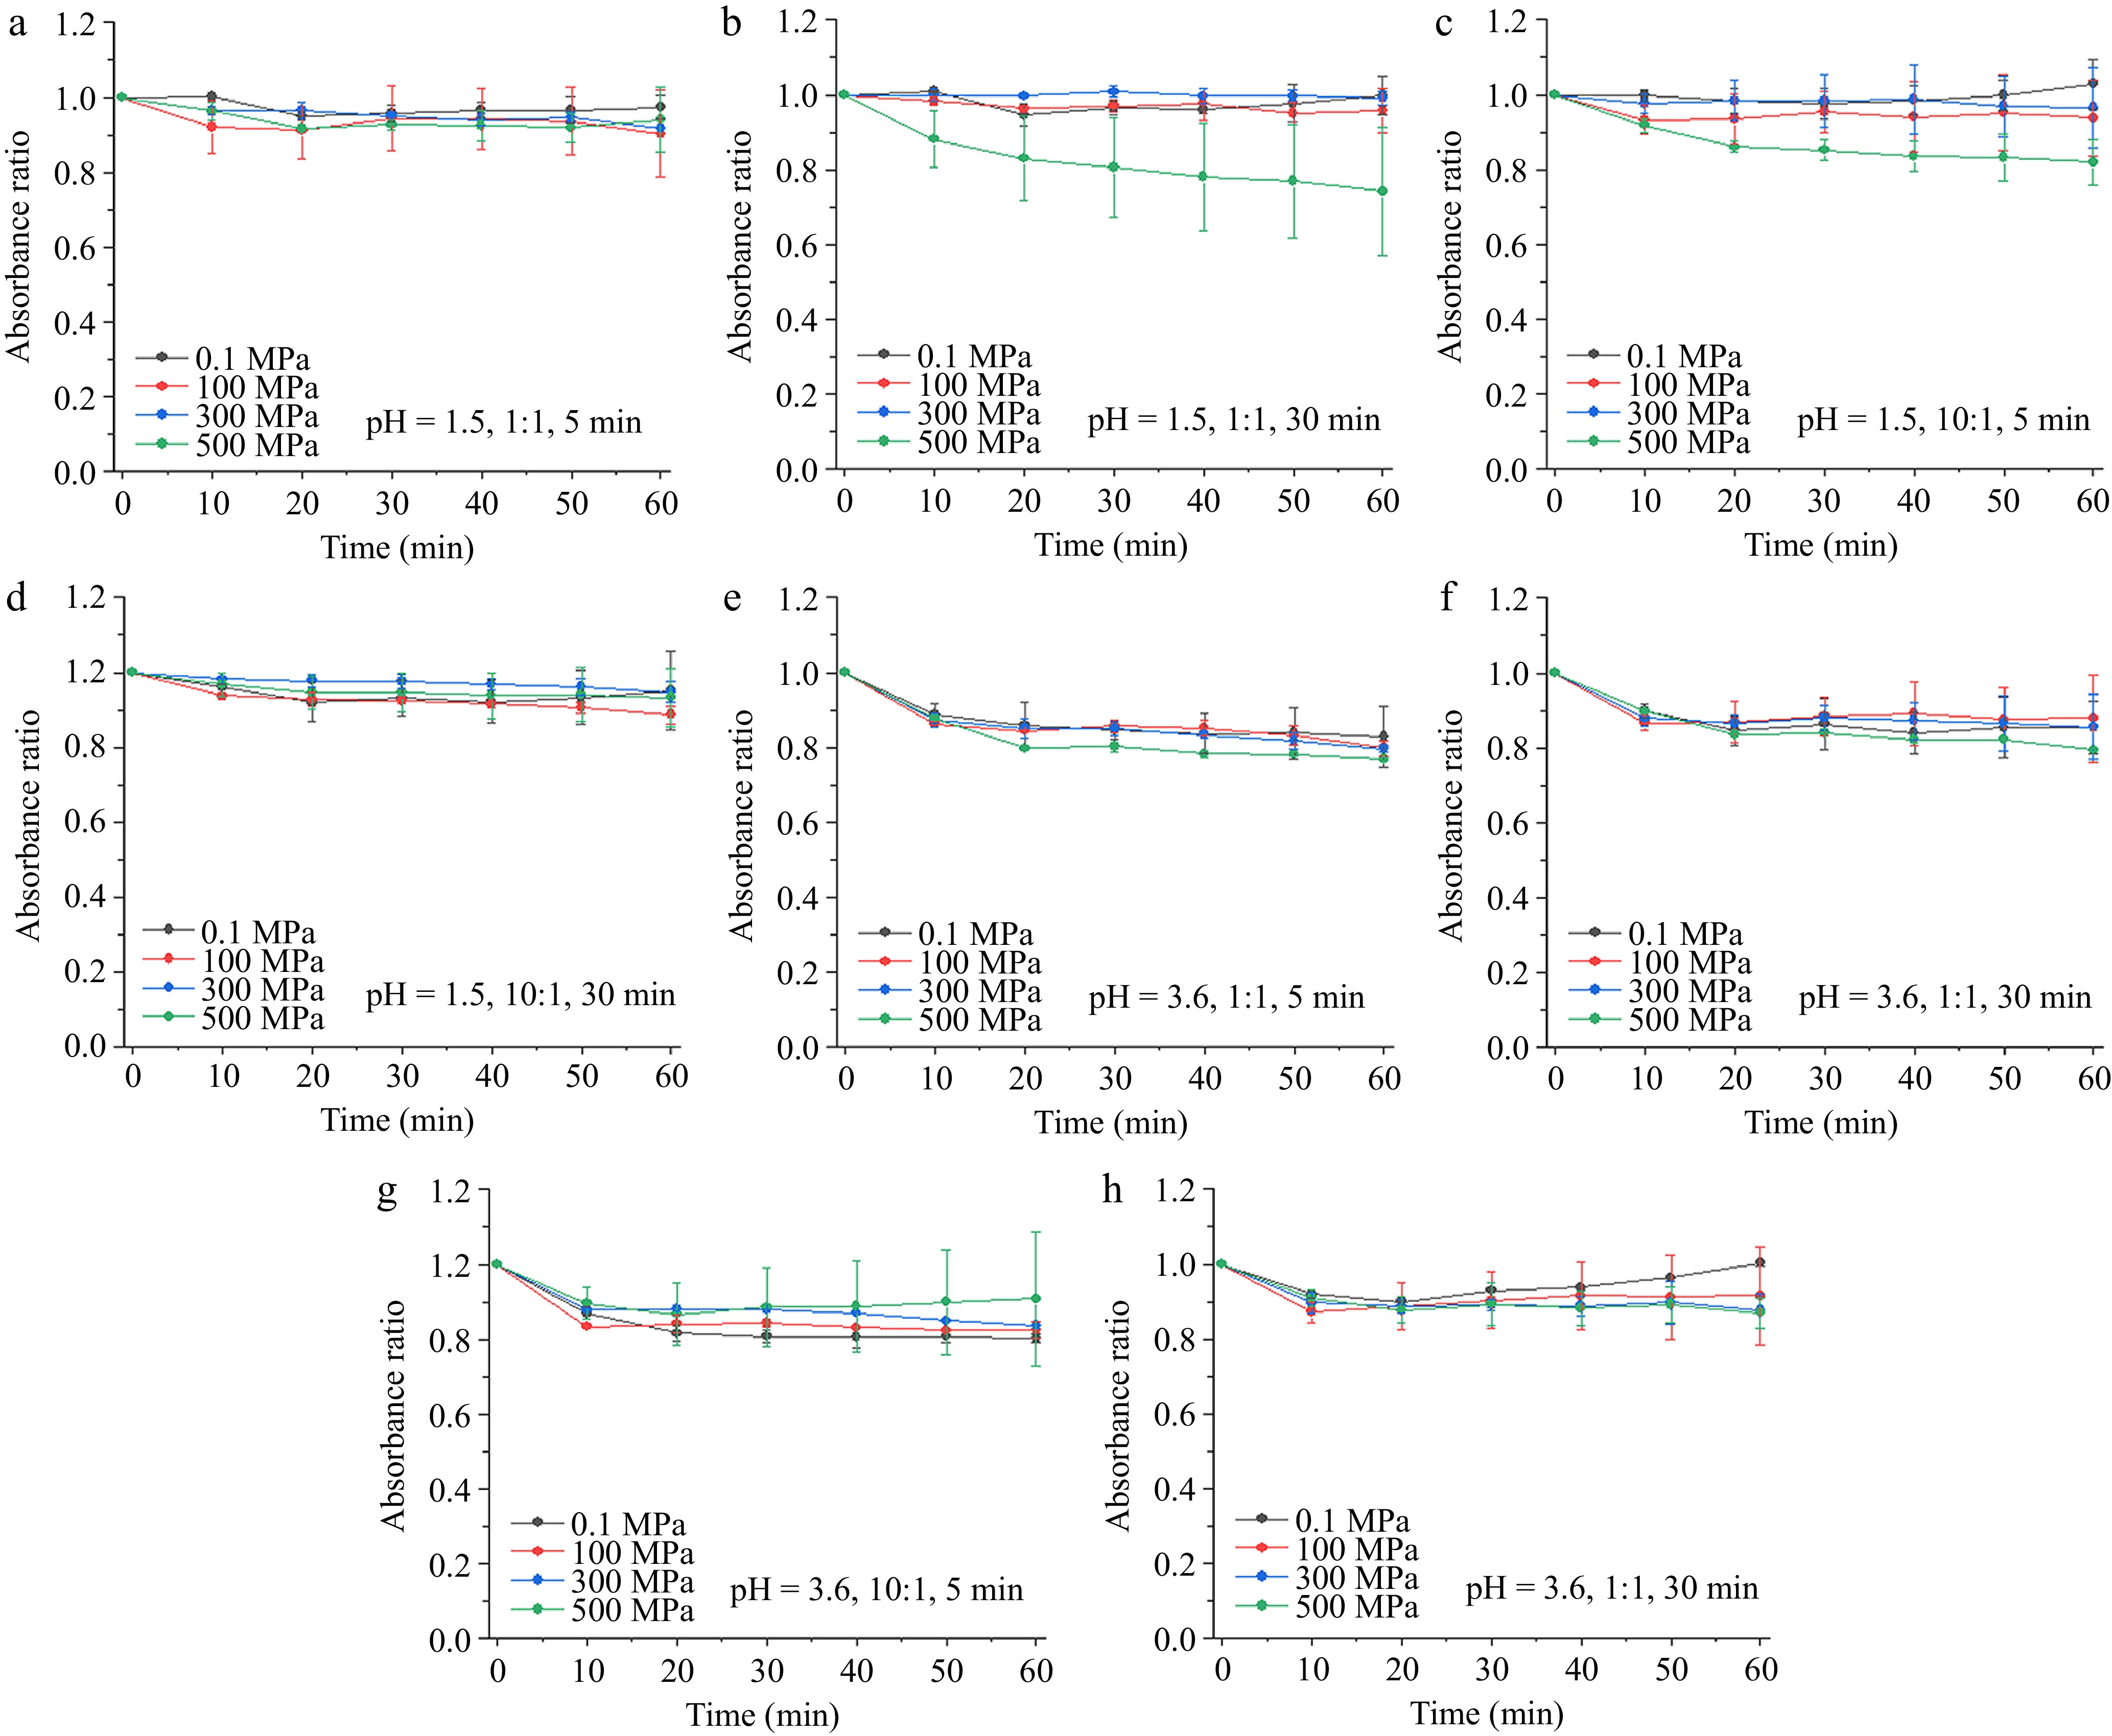
Figure 1.
Thermal processing on the absorbance changes of pelargonidin-3-glucoside/catechin complex. (a)−(d) Copigmentation conditions: pressures of 0.1, 100, 300, and 500 MPa, processing time of 5 and 30 min, solution pH of 1.5 and catechin/pelargonidin-3-glucoside ratios of 1:1 and 10:1. (e)−(h) Copigmentation conditions: pressures of 0.1, 100, 300, and 500 MPa, processing time of 5 and 30 min, solution pH of 3.6 and catechin/pelargonidin-3-glucoside ratios of 1:1 and 10:1.
-
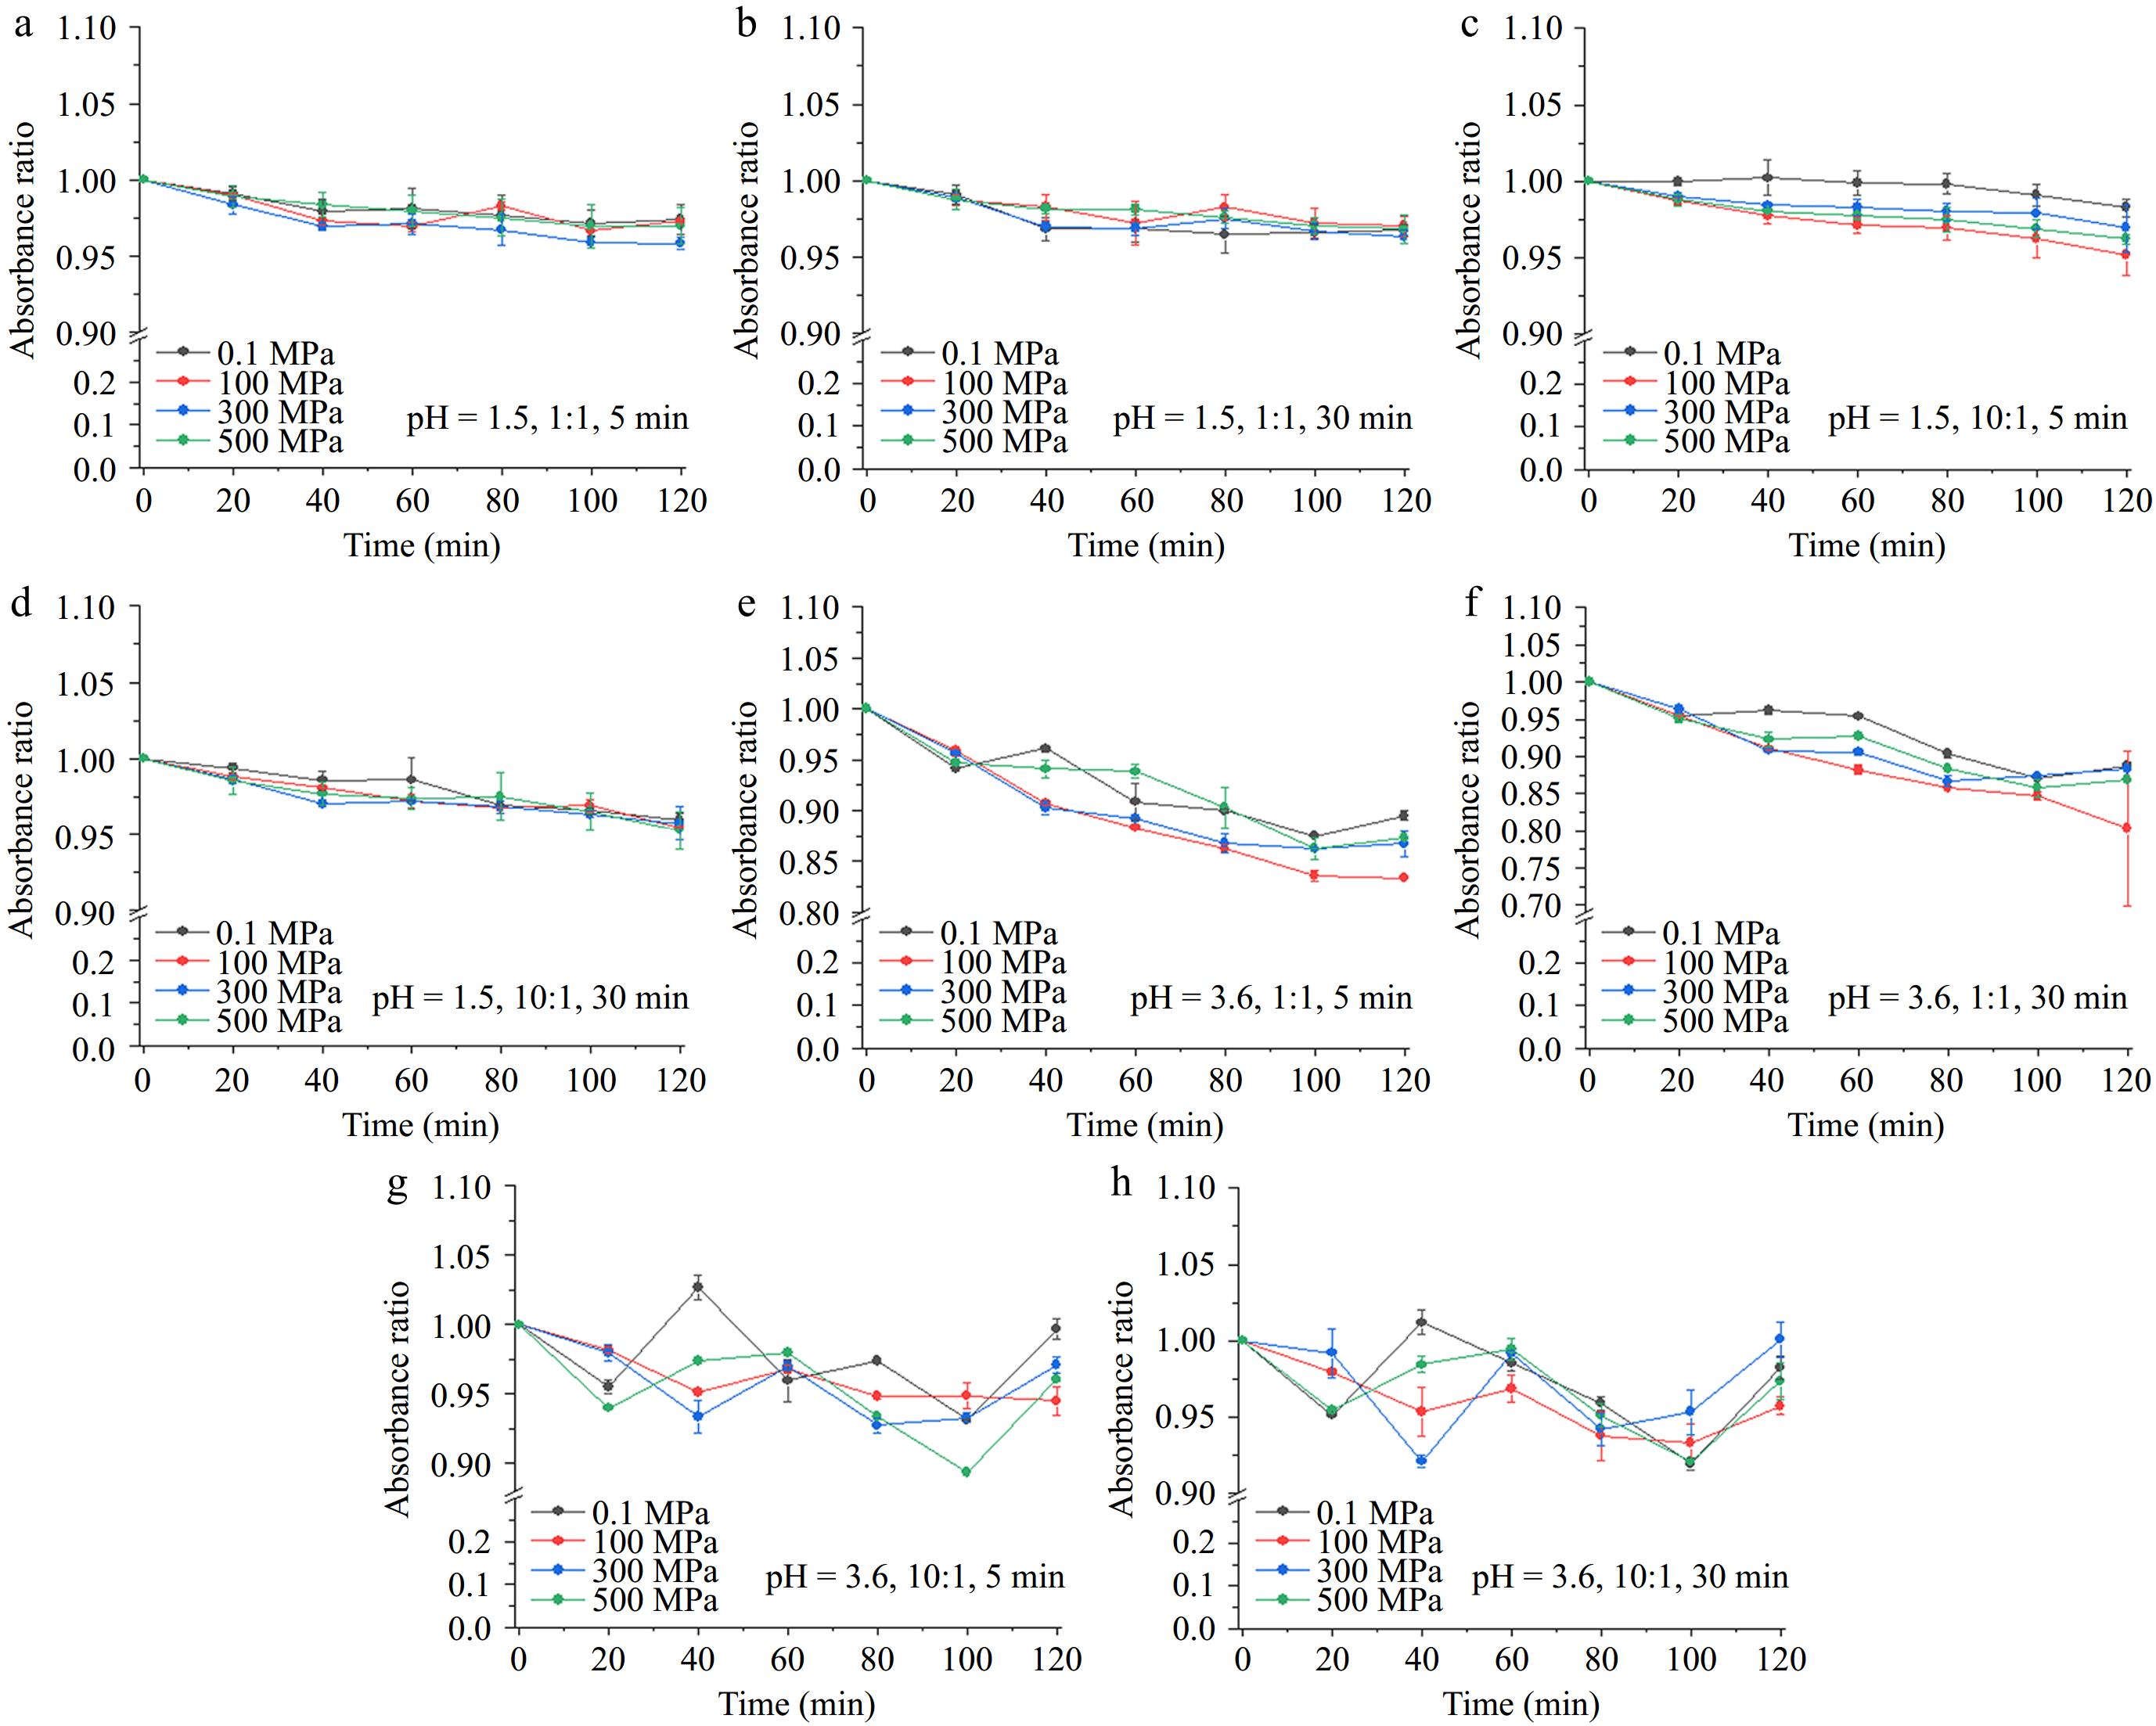
Figure 2.
Light processing on the absorbance changes of pelargonidin-3-glucoside/catechin complex. (a)−(d) Copigmentation conditions: pressures of 0.1, 100, 300, and 500 MPa, processing time of 5 and 30 min, solution pH of 1.5 and catechin/pelargonidin-3-glucoside ratios of 1:1 and 10:1. (e)−(h) Copigmentation conditions: pressures of 0.1, 100, 300, and 500 MPa, processing time of 5 and 30 min, solution pH of 3.6 and catechin/pelargonidin-3-glucoside ratios of 1:1 and 10:1.
-
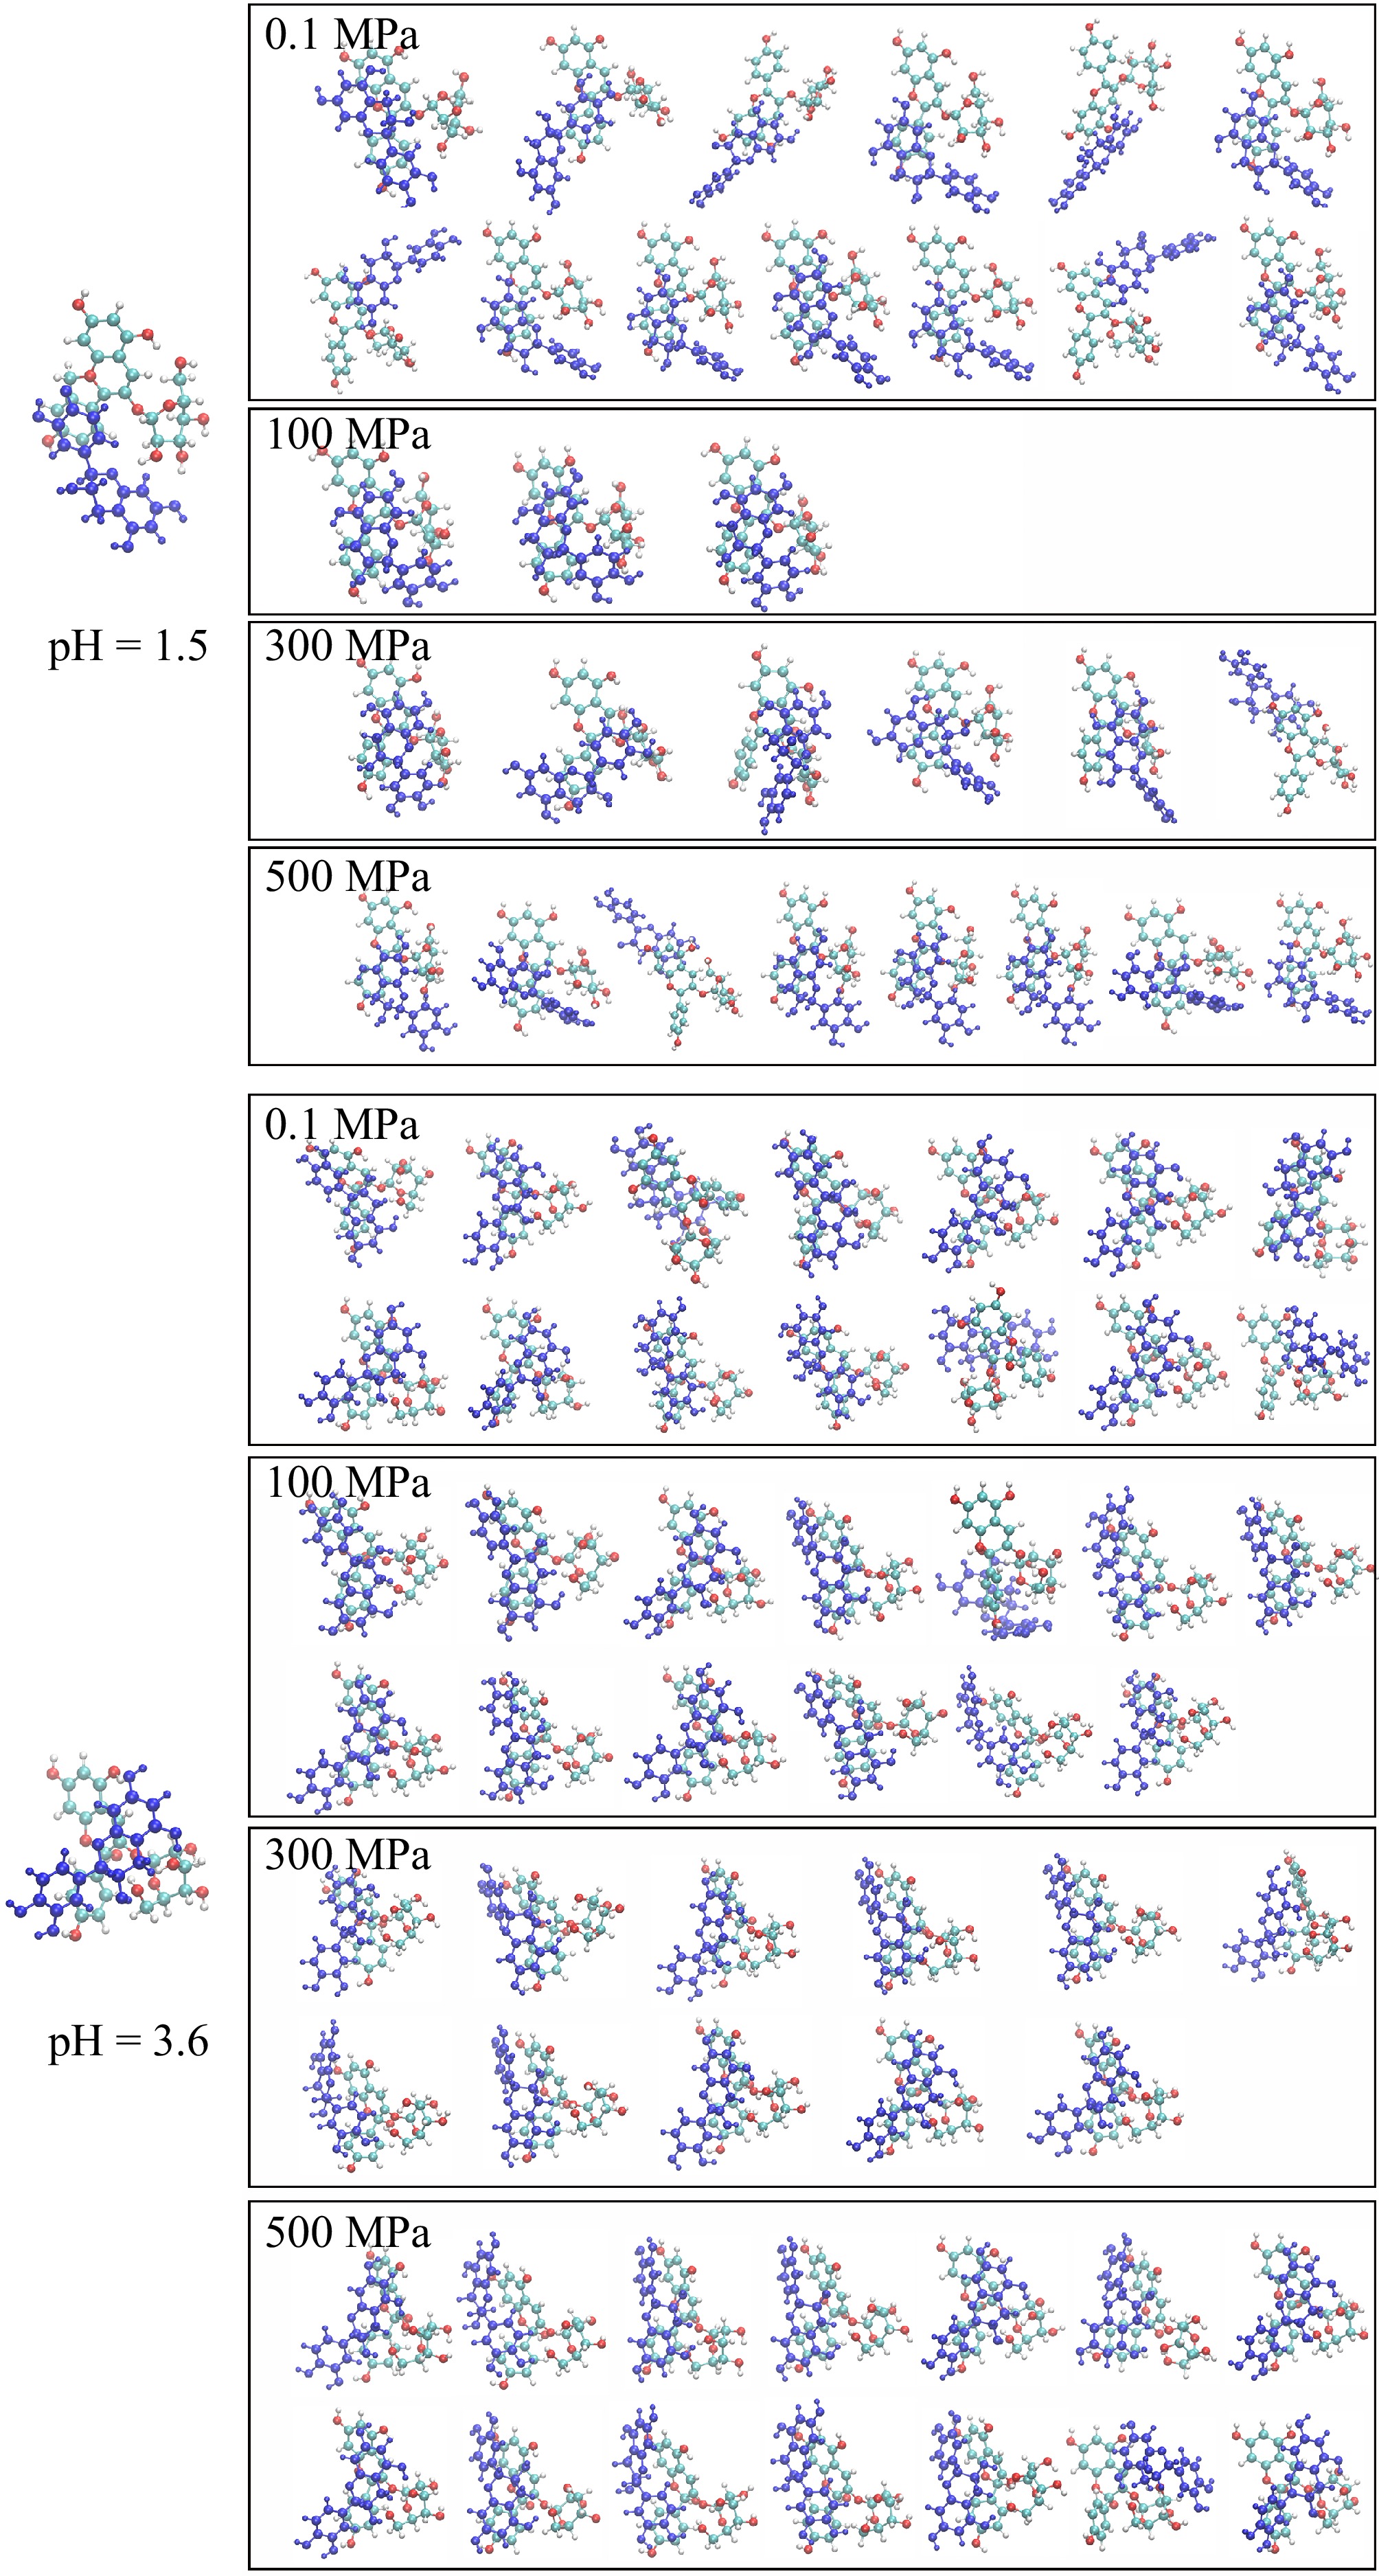
Figure 3.
Theoretic conformation structures of copigmentation complex at different pH (pH 1.5 and 3.6) and pressures (0.1, 100, 300, and 500 MPa).
-
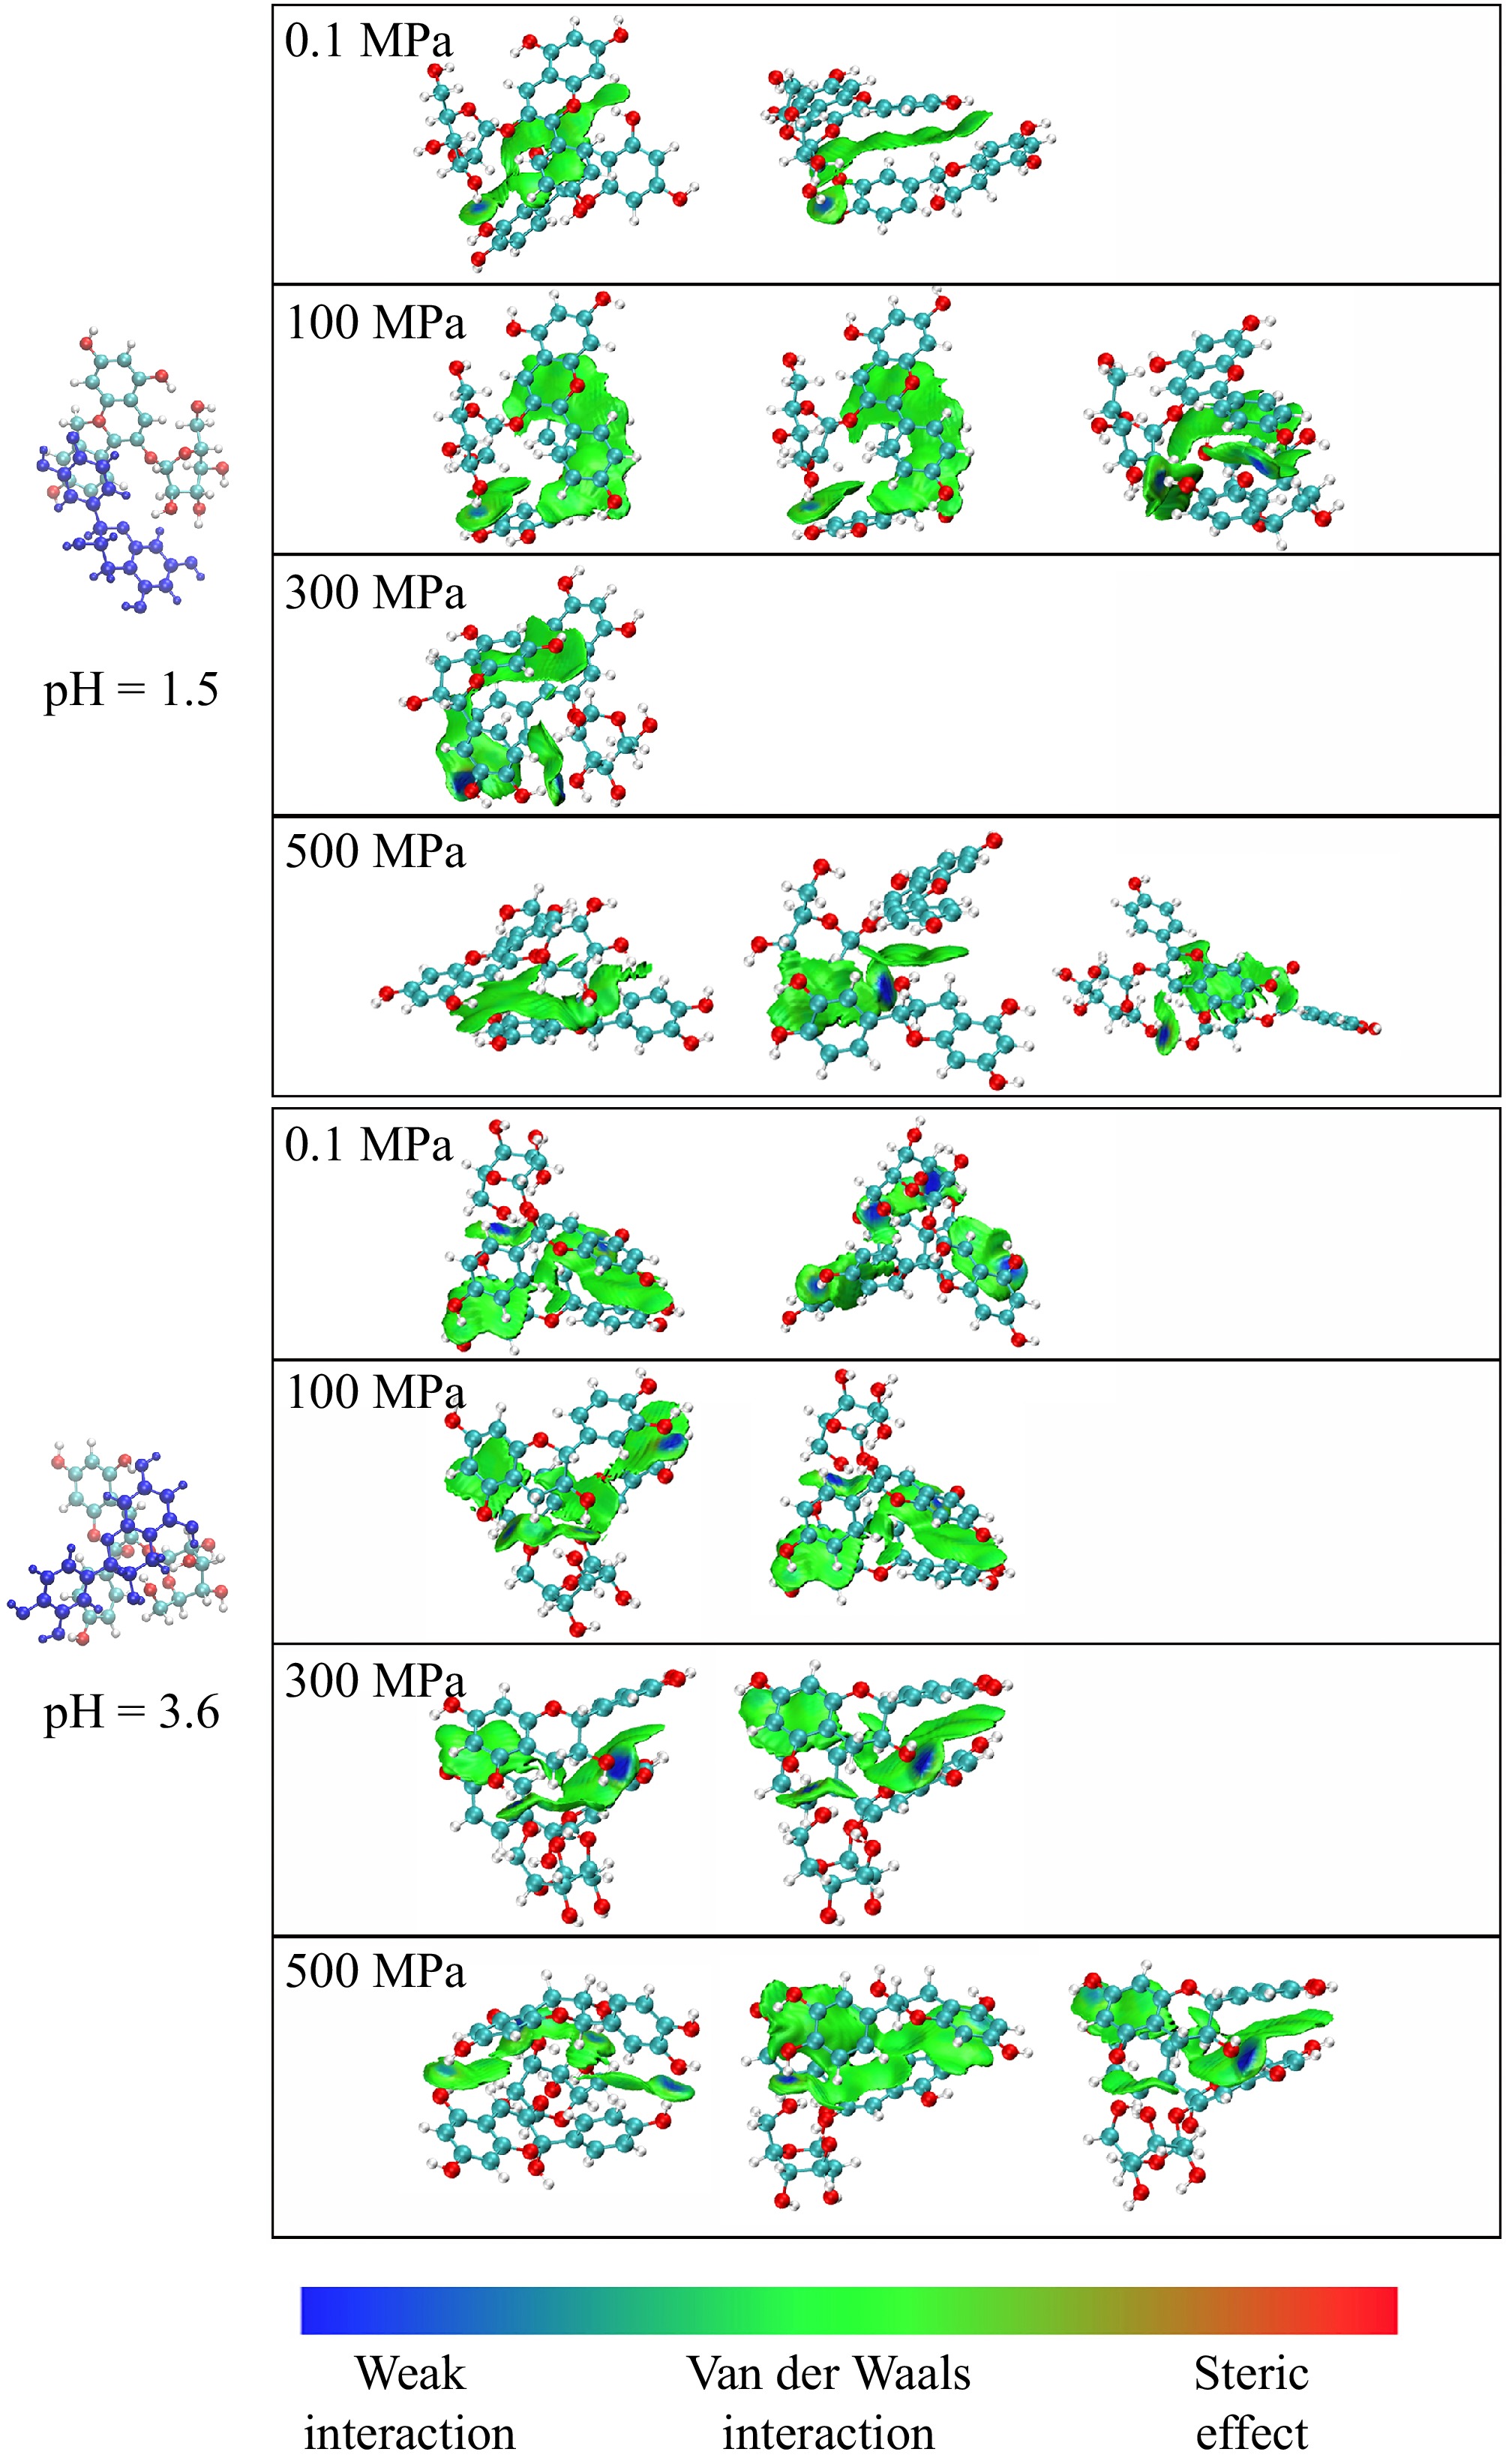
Figure 4.
IGMH analysis of the copigmentation complexes. Blue for prominent attractive weak interactions (i.e., hydrogen bond interactions), green for van der Waals interactions, and red for prominent repulsion interactions.
-
Anthocyanin form Pressure Binding energy (ΔE (Kcal/mol)) /
Boltzmann distribution proportion (%)Flavonoid cations (pH 1.5) 0.1 0/41.99% + 1.62/19.74% 100 0/62.24% + 2.39/24.62% + 2.45/10.72% 300 0/88.92% 500 0/22.56% + 1.39/20.25% + 2.15/18.54% Hemiketals (pH 3.6) 0.1 0/34.56% + 2.65/12.30% 100 0/26.48% + 0.40/20.57% 300 0/29.64% + 0.39/24.86% 500 0/15.53% + 1.01/12.62% + 2.00/12.05% The values for each cluster's binding energy are given as differences from the energy of the first cluster. Table 1.
Binding energy and proportion of catechin and pelargonidin-3-glucoside copigmentation complex analysis.
-
Anthocyanin form Pressure Excitation energy (kcal/mol) / f value Flavonoid cations
(pH 1.5)0.1 −1,629,053.23/0.0124; −1,629,055.289/0.0145 100 −1,629,051.52/0.0167; −1,629,051.02/0.0163; −1,629,054.80/0.0206 300 −1,629,053.84/0.0205 500 −1,629,050.78/0.0108; −1,629,058.72/0.0205; −169,058.75/0.0159 Hemiketals (pH 3.6) 0.1 −1,676,566.20/0.2953; −1,676,555.15/0.4919 100 −1,676,558.15/0.3658; −1,676,566.23/0.2882 300 −1,676,565.66/0.3675; −1,676,566.22/0.2954 500 −1,676,555.15/0.4918; −1,676,565.75/0.3438; −1,676,561.94/0.3165 The values for each cluster's excitation energy are given as differences from the energy of the first cluster. Table 2.
Excitation energies and f values of catechin and pelargonidin-3-glucoside copigmentation complex analysis.
Figures
(4)
Tables
(2)