-
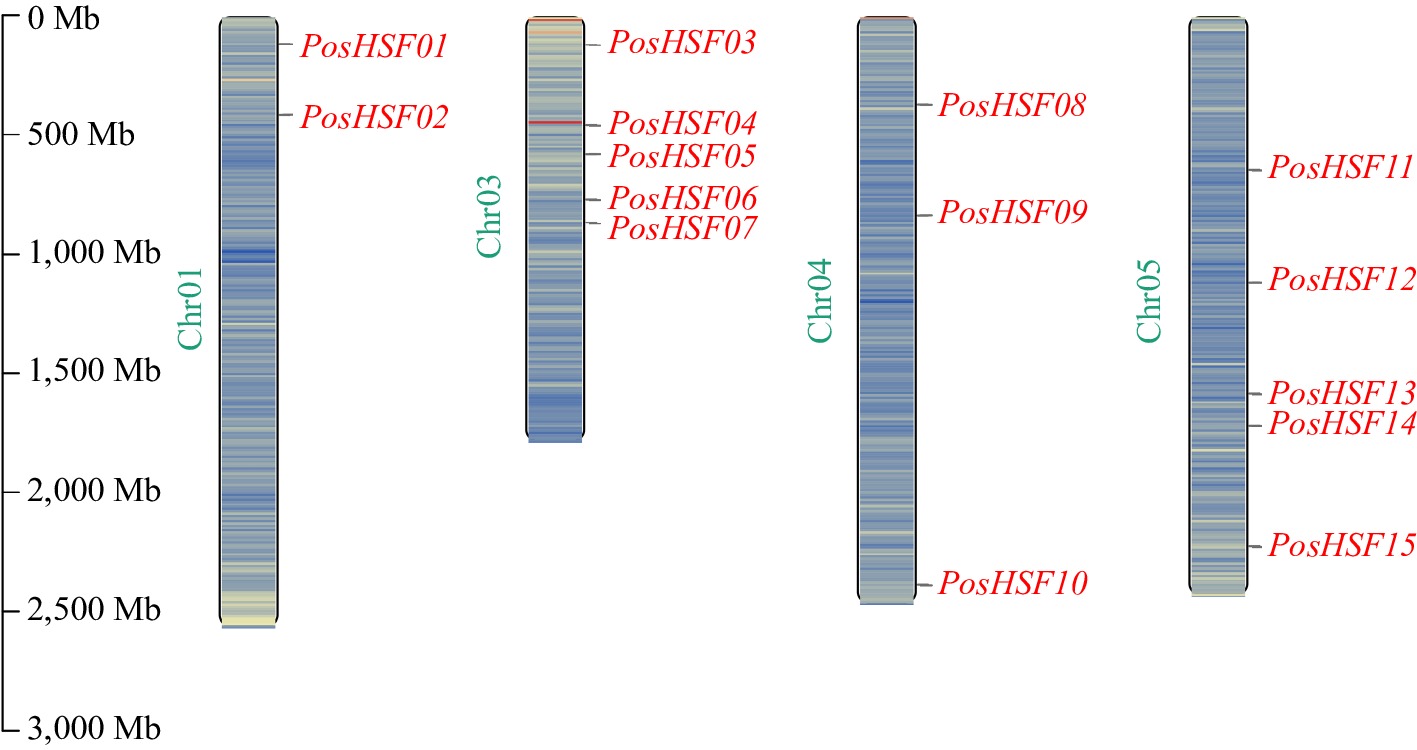
Figure 1.
Chromosomal localization of PosHSF genes in P. suffruticosa.
-
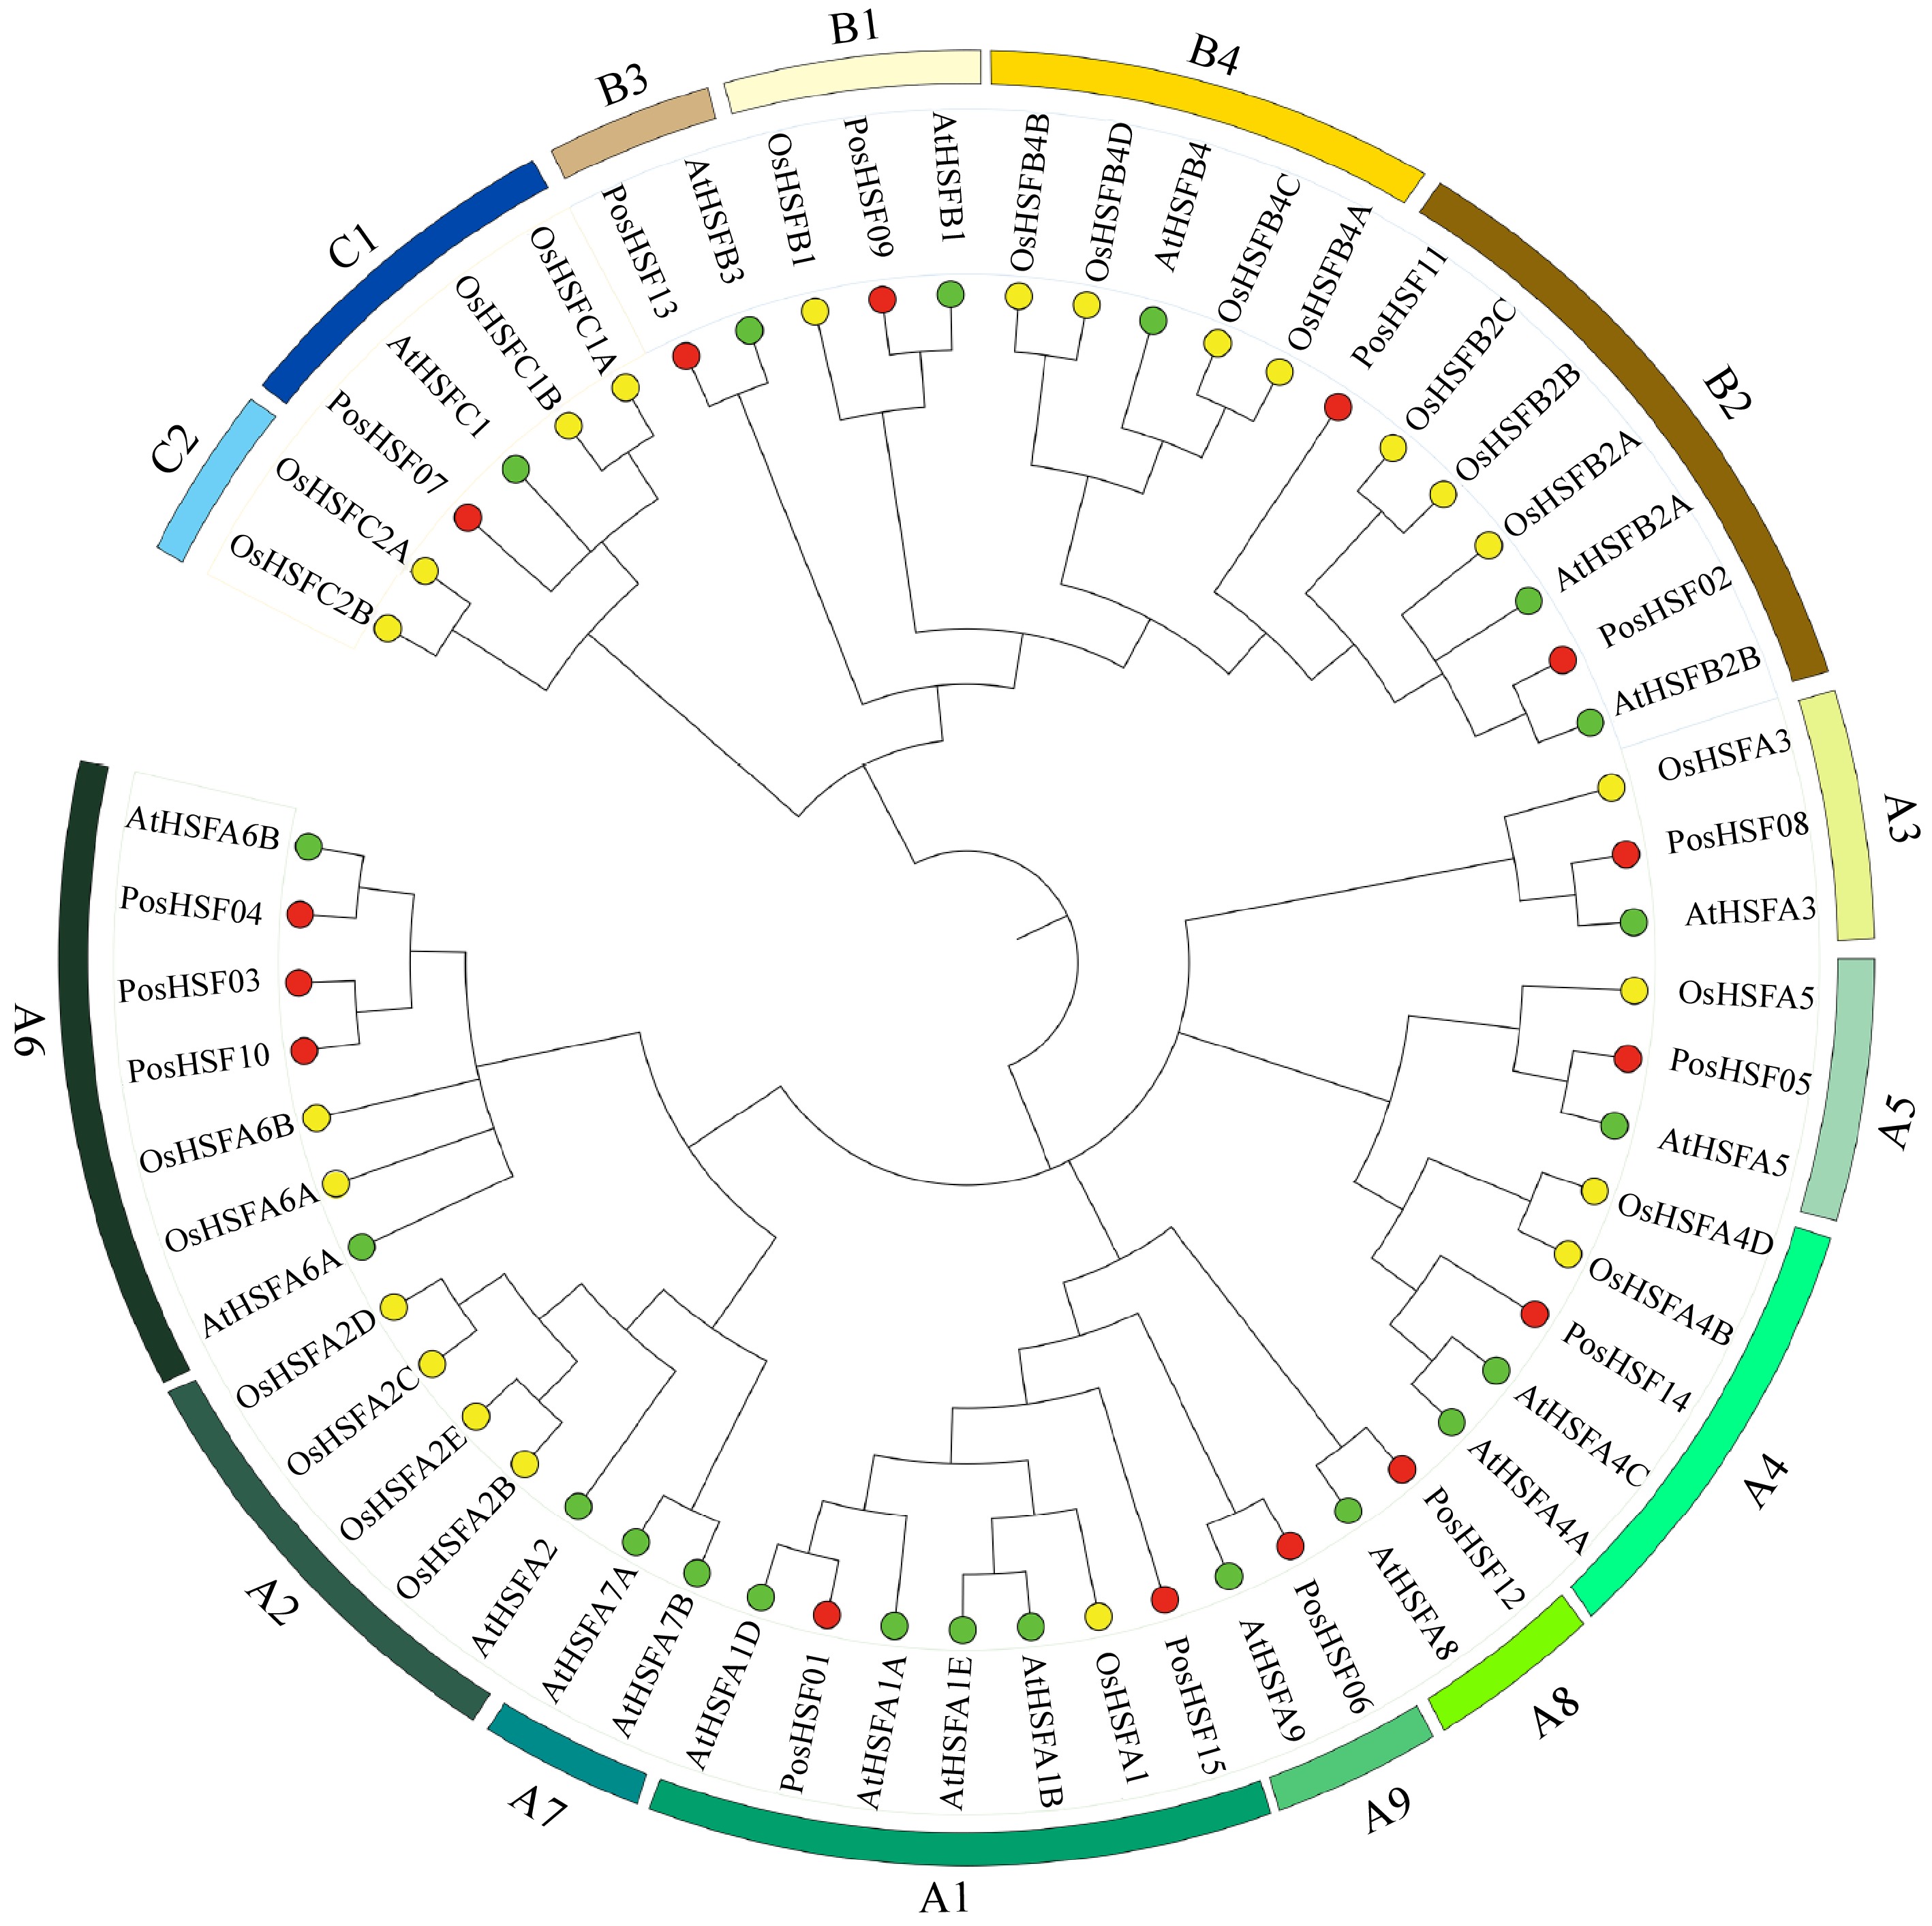
Figure 2.
Phylogenetic relationships of HSF proteins across P. suffruticosa, A. thaliana, and O. sativa.
-
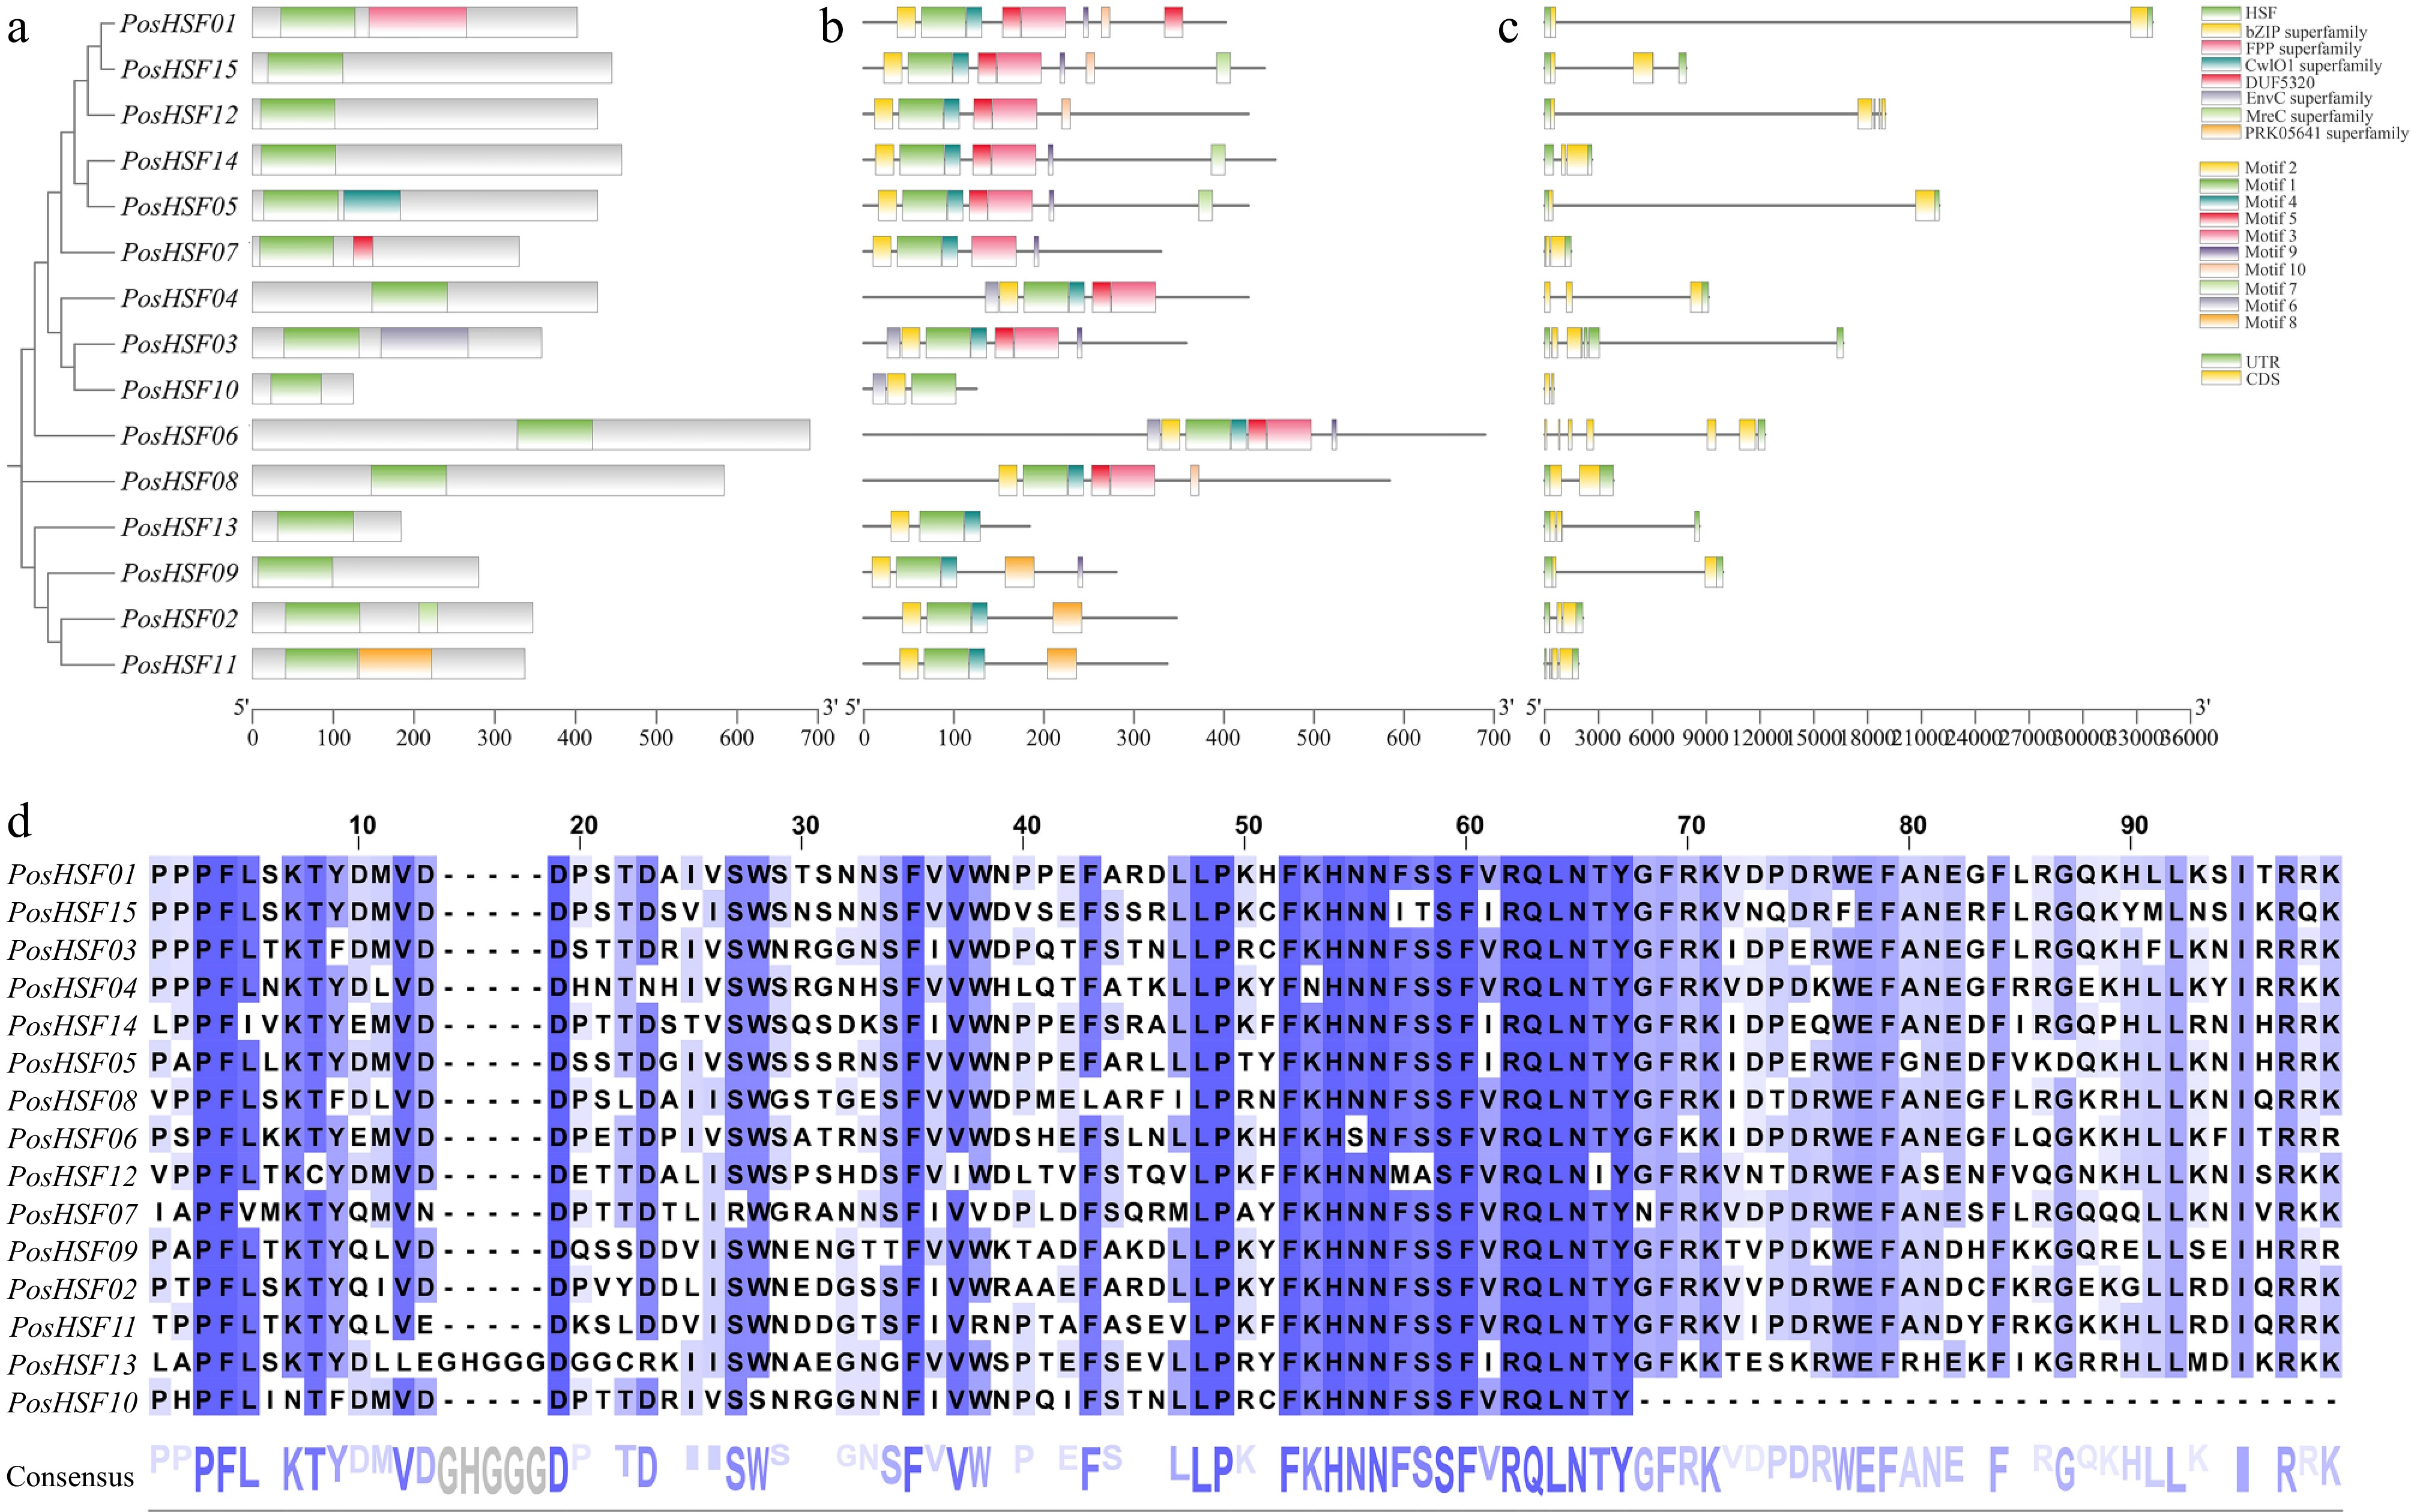
Figure 3.
Characterization of PosHSF genes. (a) Conserved protein structural domains: the green color indicates the most conserved DBD structural domain in the HSF protein. (b) Amino acid motifs in PosHSF: motifs 1−10 in PosHSF are numbered and analyzed. (c) Gene structure of PosHSF, overview of the gene structure in PosHSF genes. (d) Multiple sequence alignment of the DBD structural domain in PosHSF proteins.
-
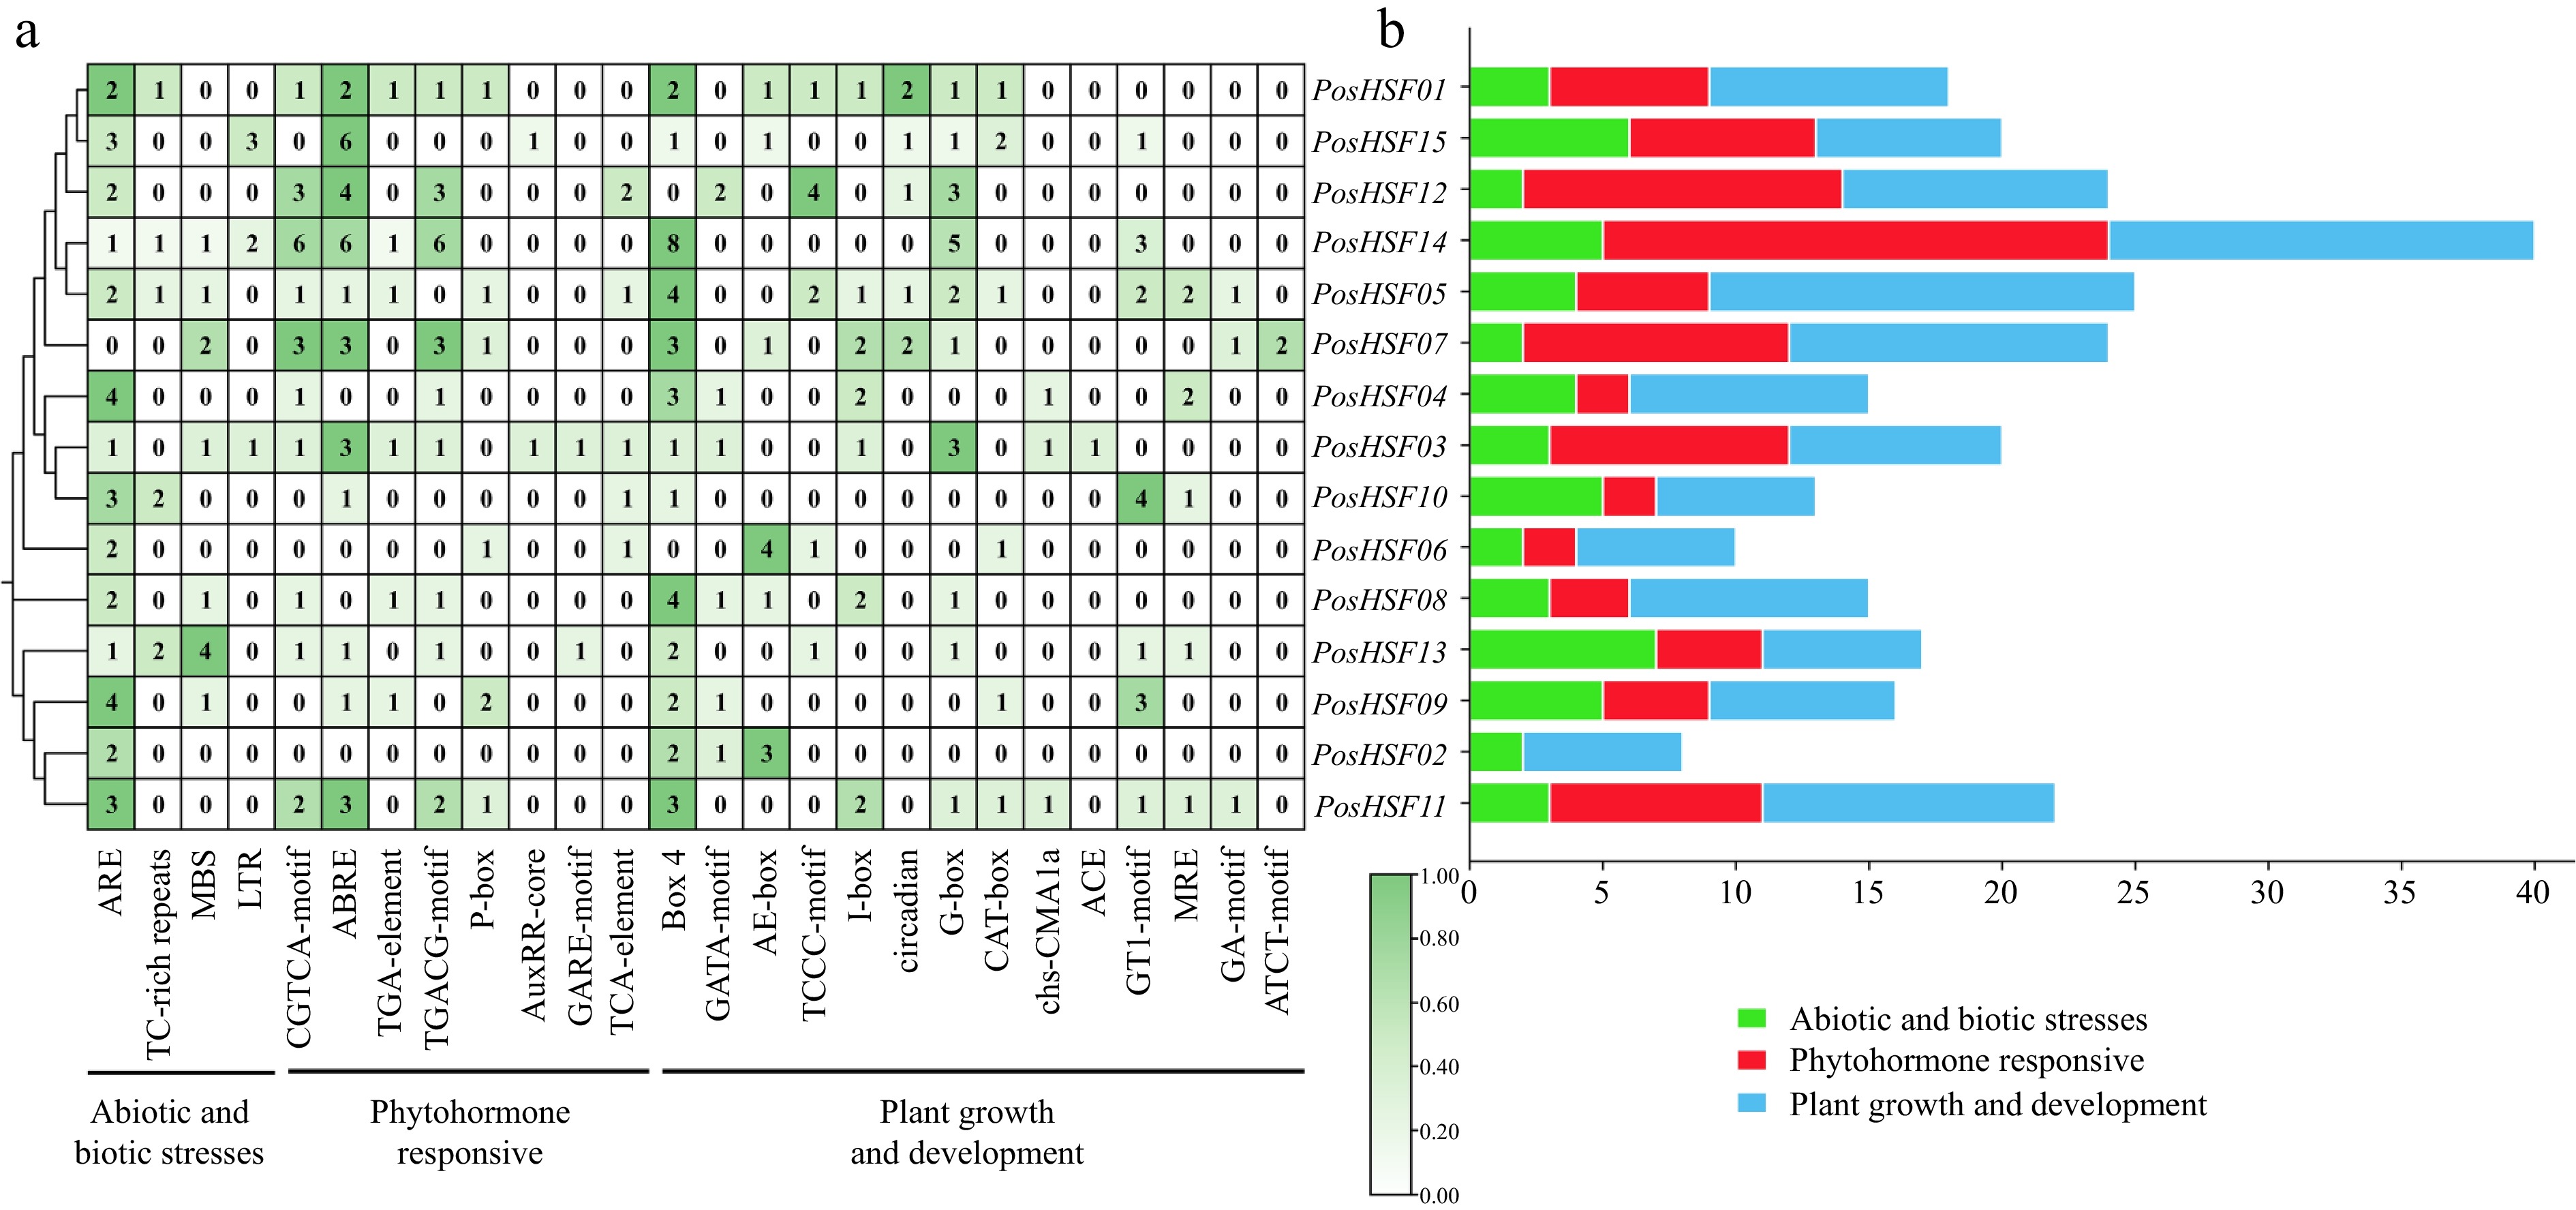
Figure 4.
Analysis of promoter cis-acting elements of PosHSF. (a) Heat map and categorization of PosHSF promoter cis-acting elements. (b) Distribution numbers of the three categories of promoter cis-acting elements in the PosHSF gene.
-
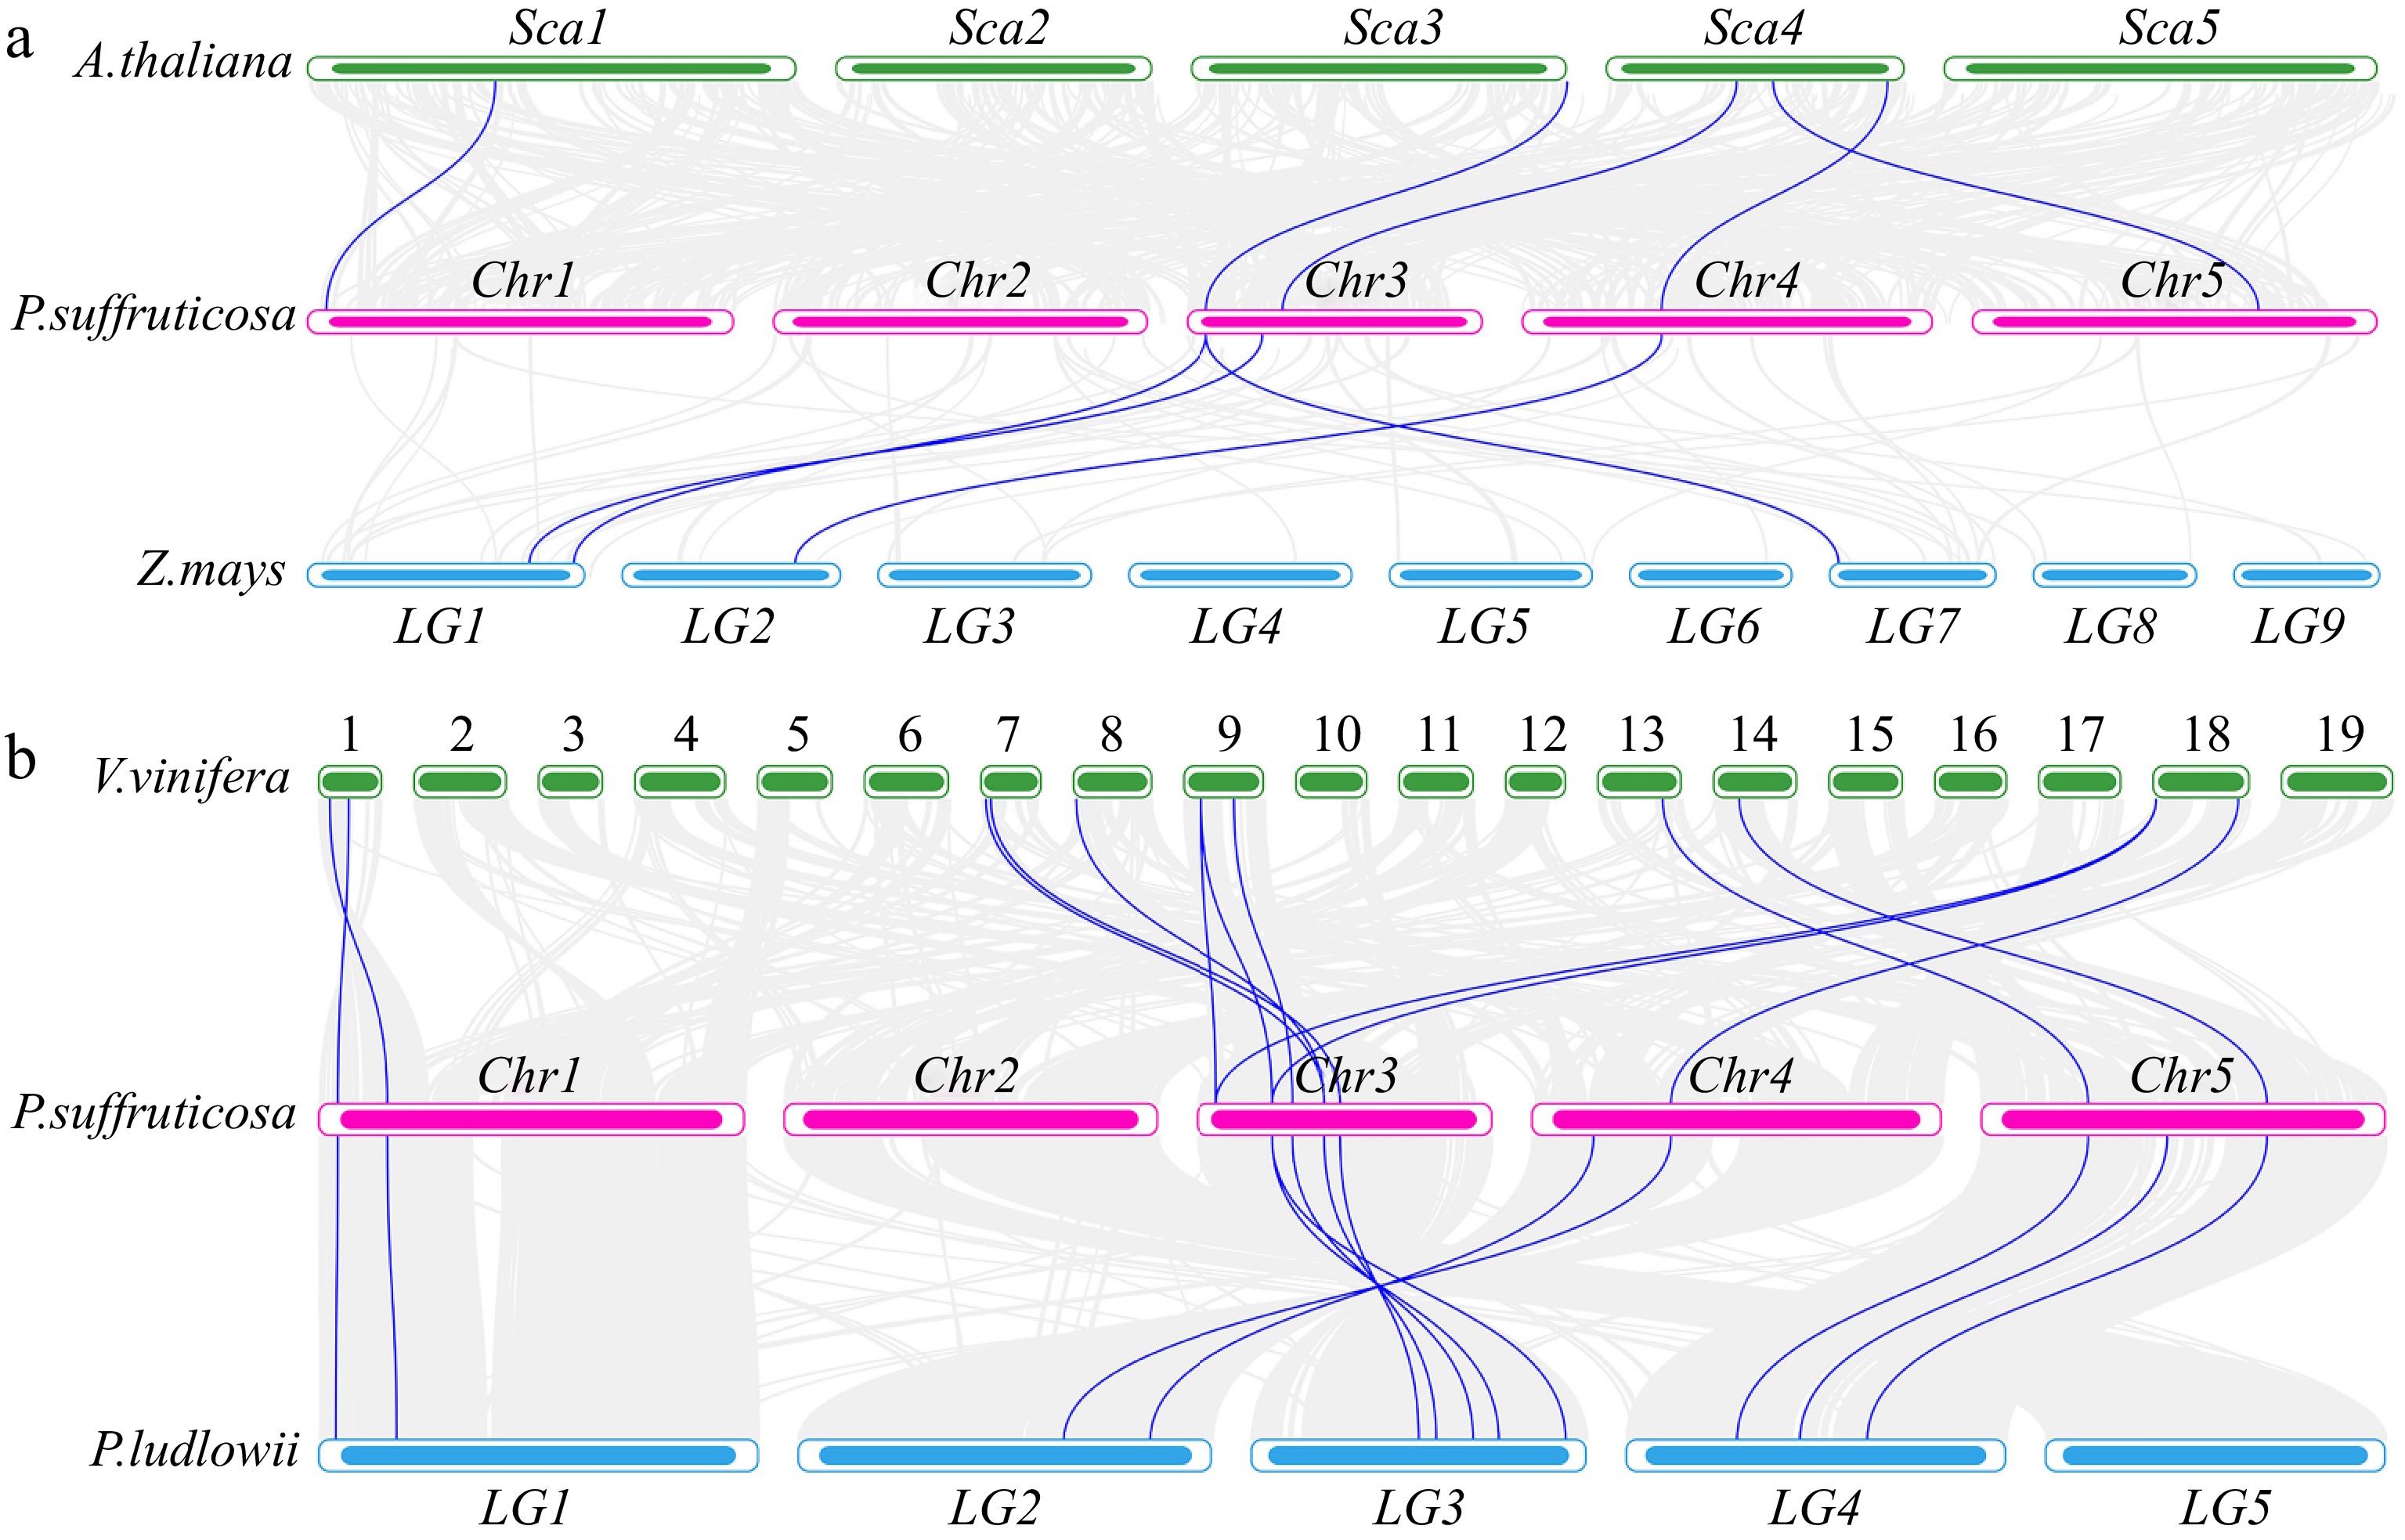
Figure 5.
(a) Synteny analysis of HSF genes in P. suffruticosa, A. thaliana, and Z. mays. (b) Synteny analysis of HSF genes in P. suffruticosa, P. ludlowii, and V. vinifera.
-
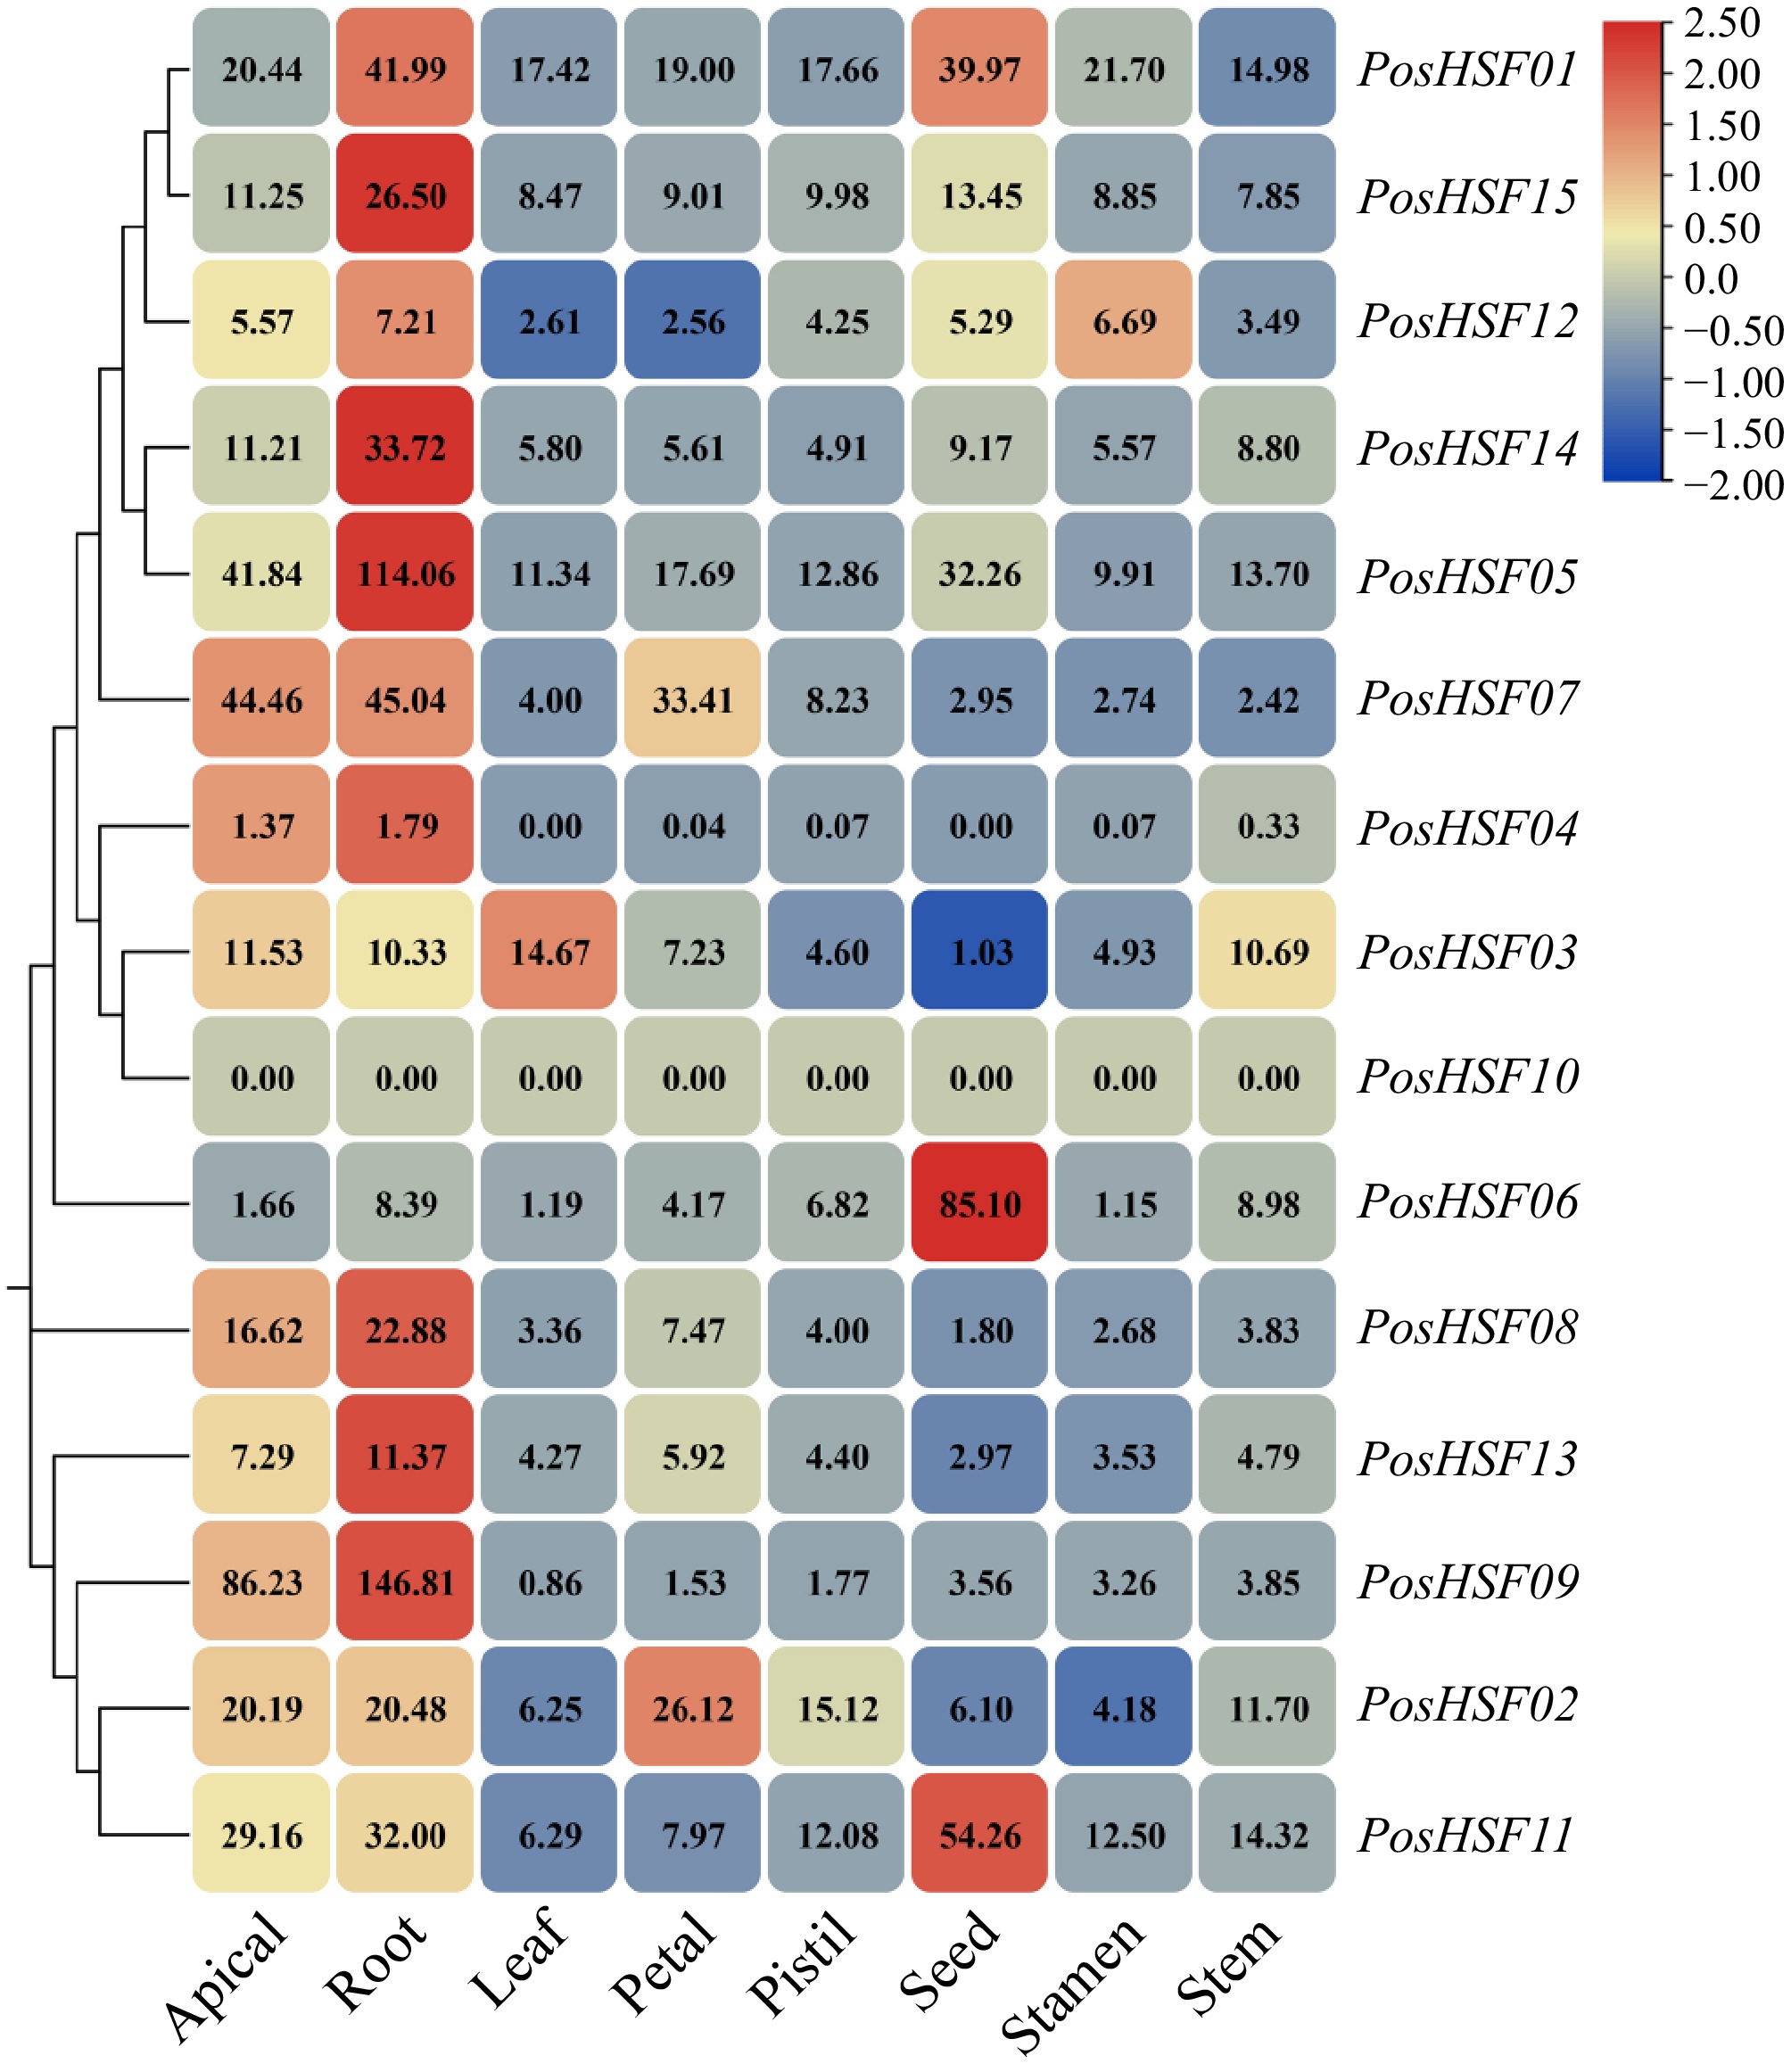
Figure 6.
Expression profiles of tissue-specific PosHSF genes in different tissues.
-
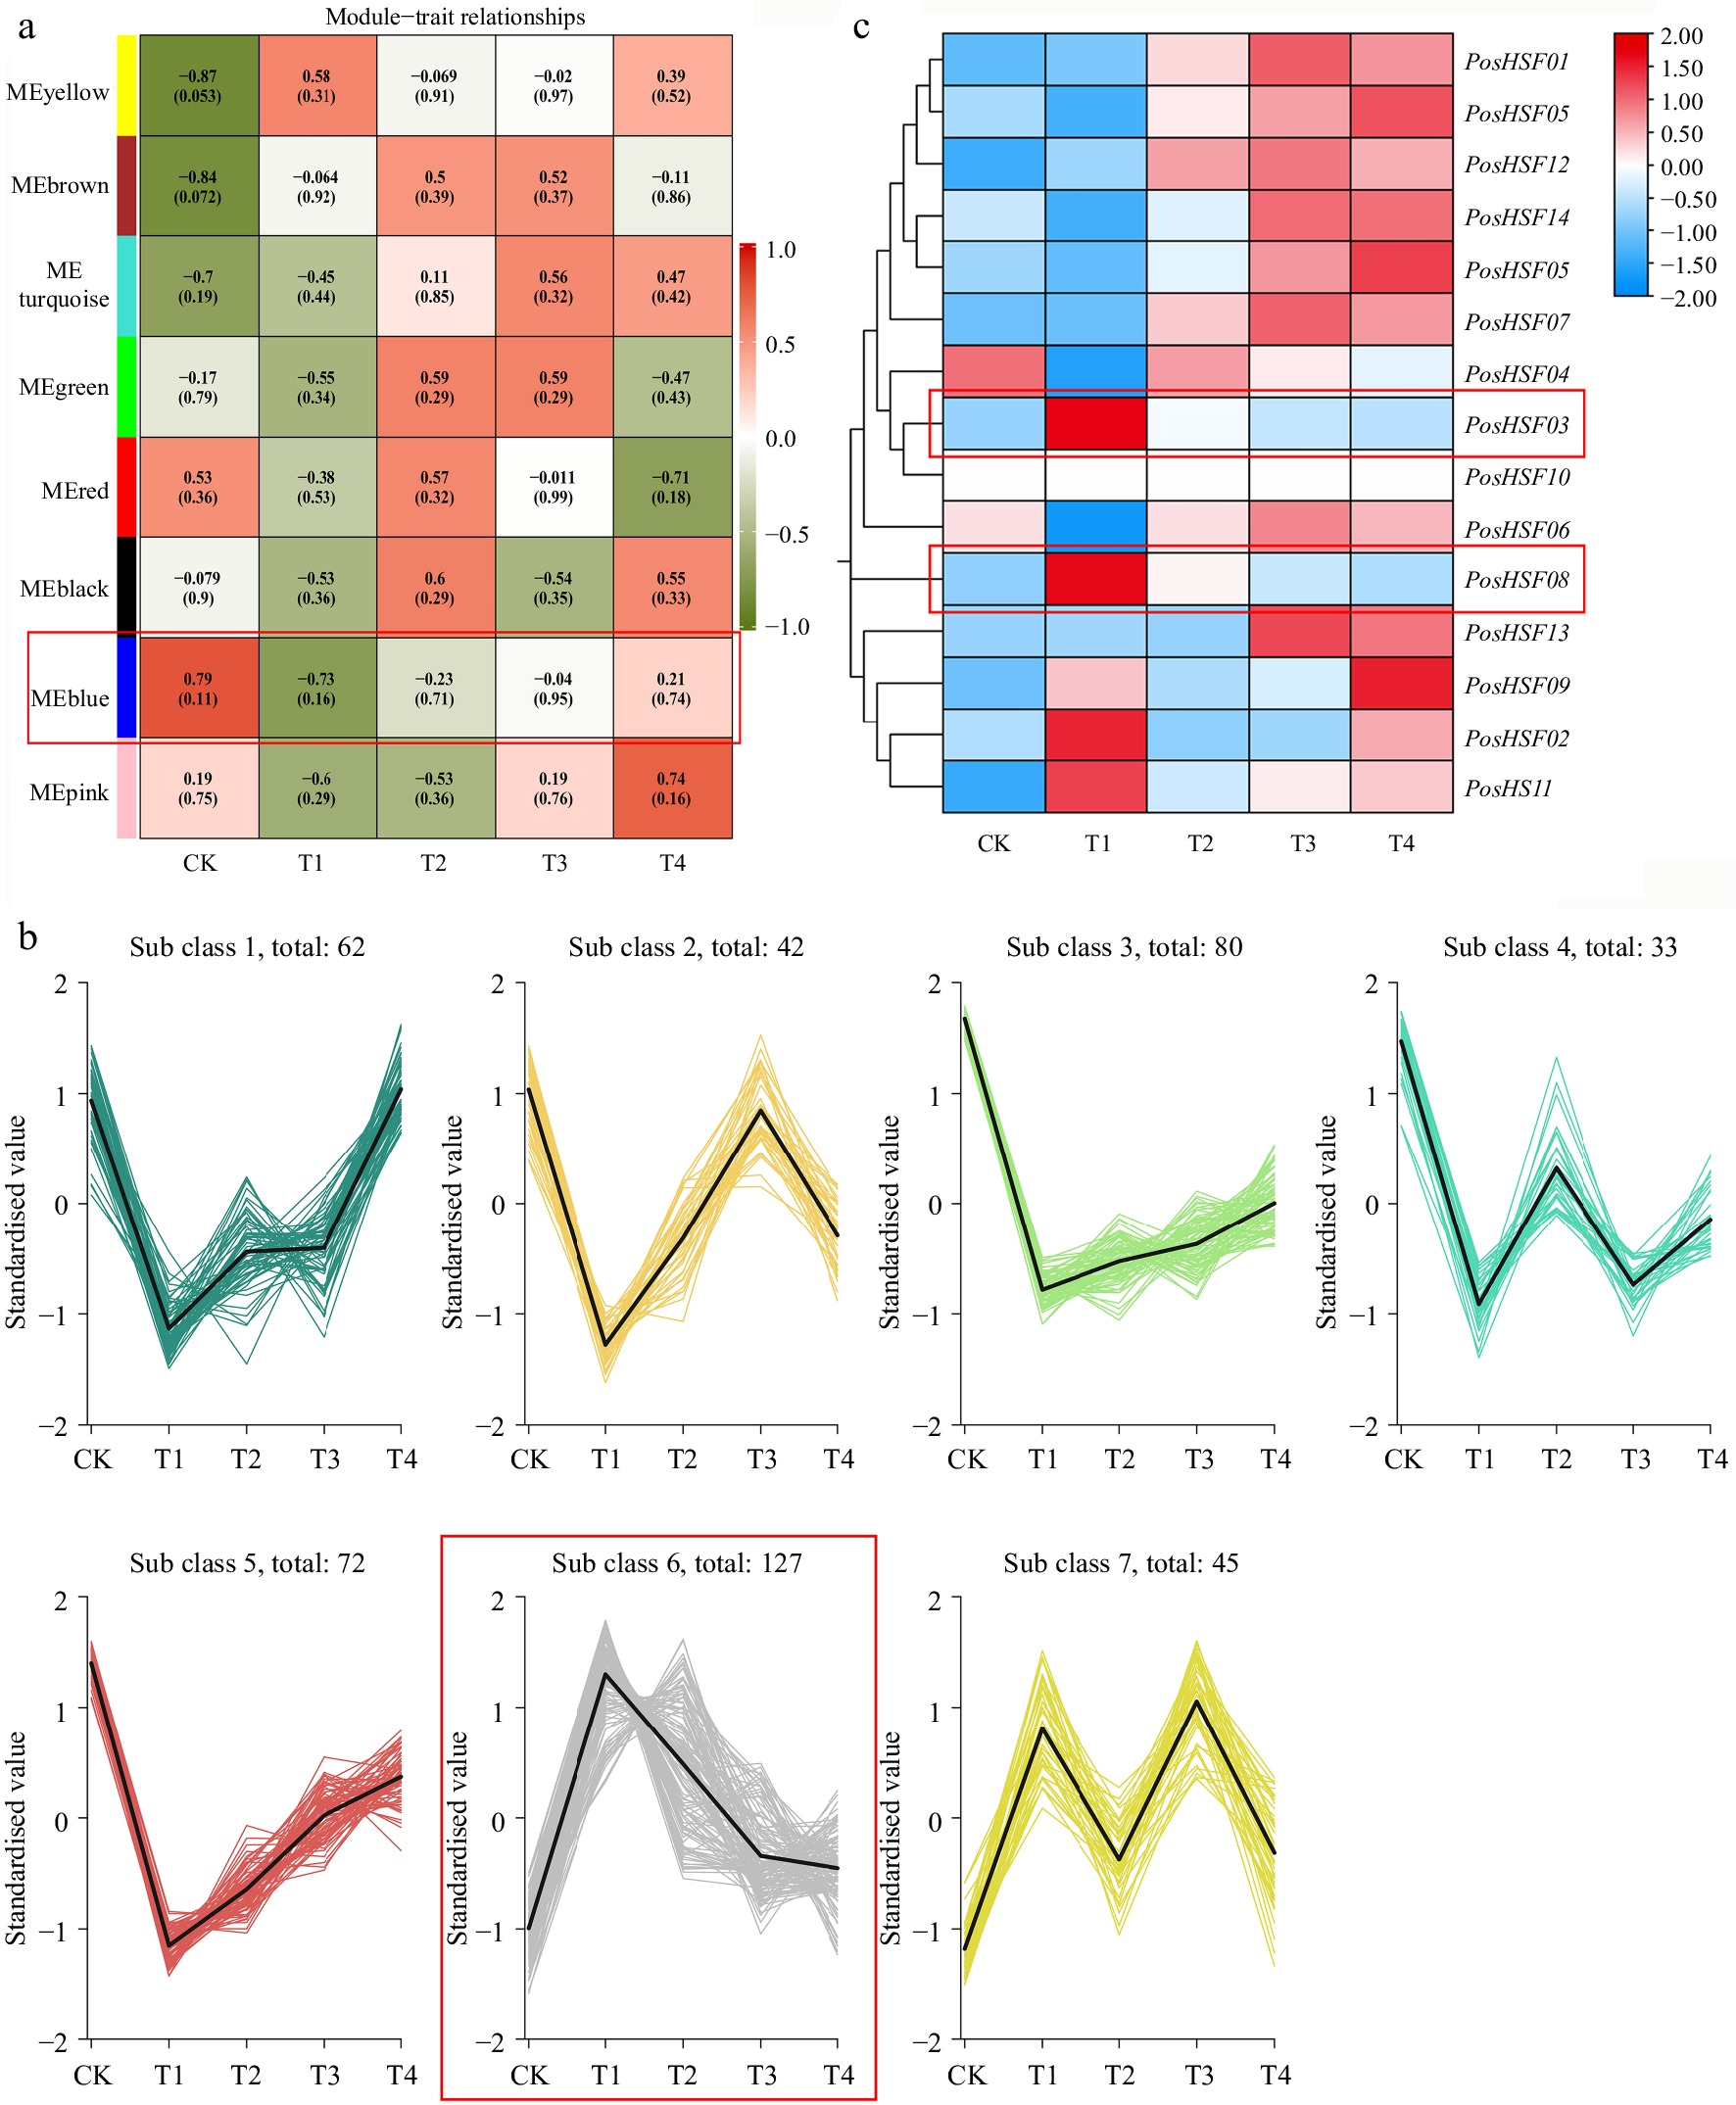
Figure 7.
Analysis of heat tolerance transcriptome data in P. suffruticosa. (a) WGCNA heatmap of module-trait correlations. (b) K-means clustering of gene expression in the blue module. (c) Heatmap of PosHSF expression under high-temperature treatment. Red boxes indicate the modules of focus.
-
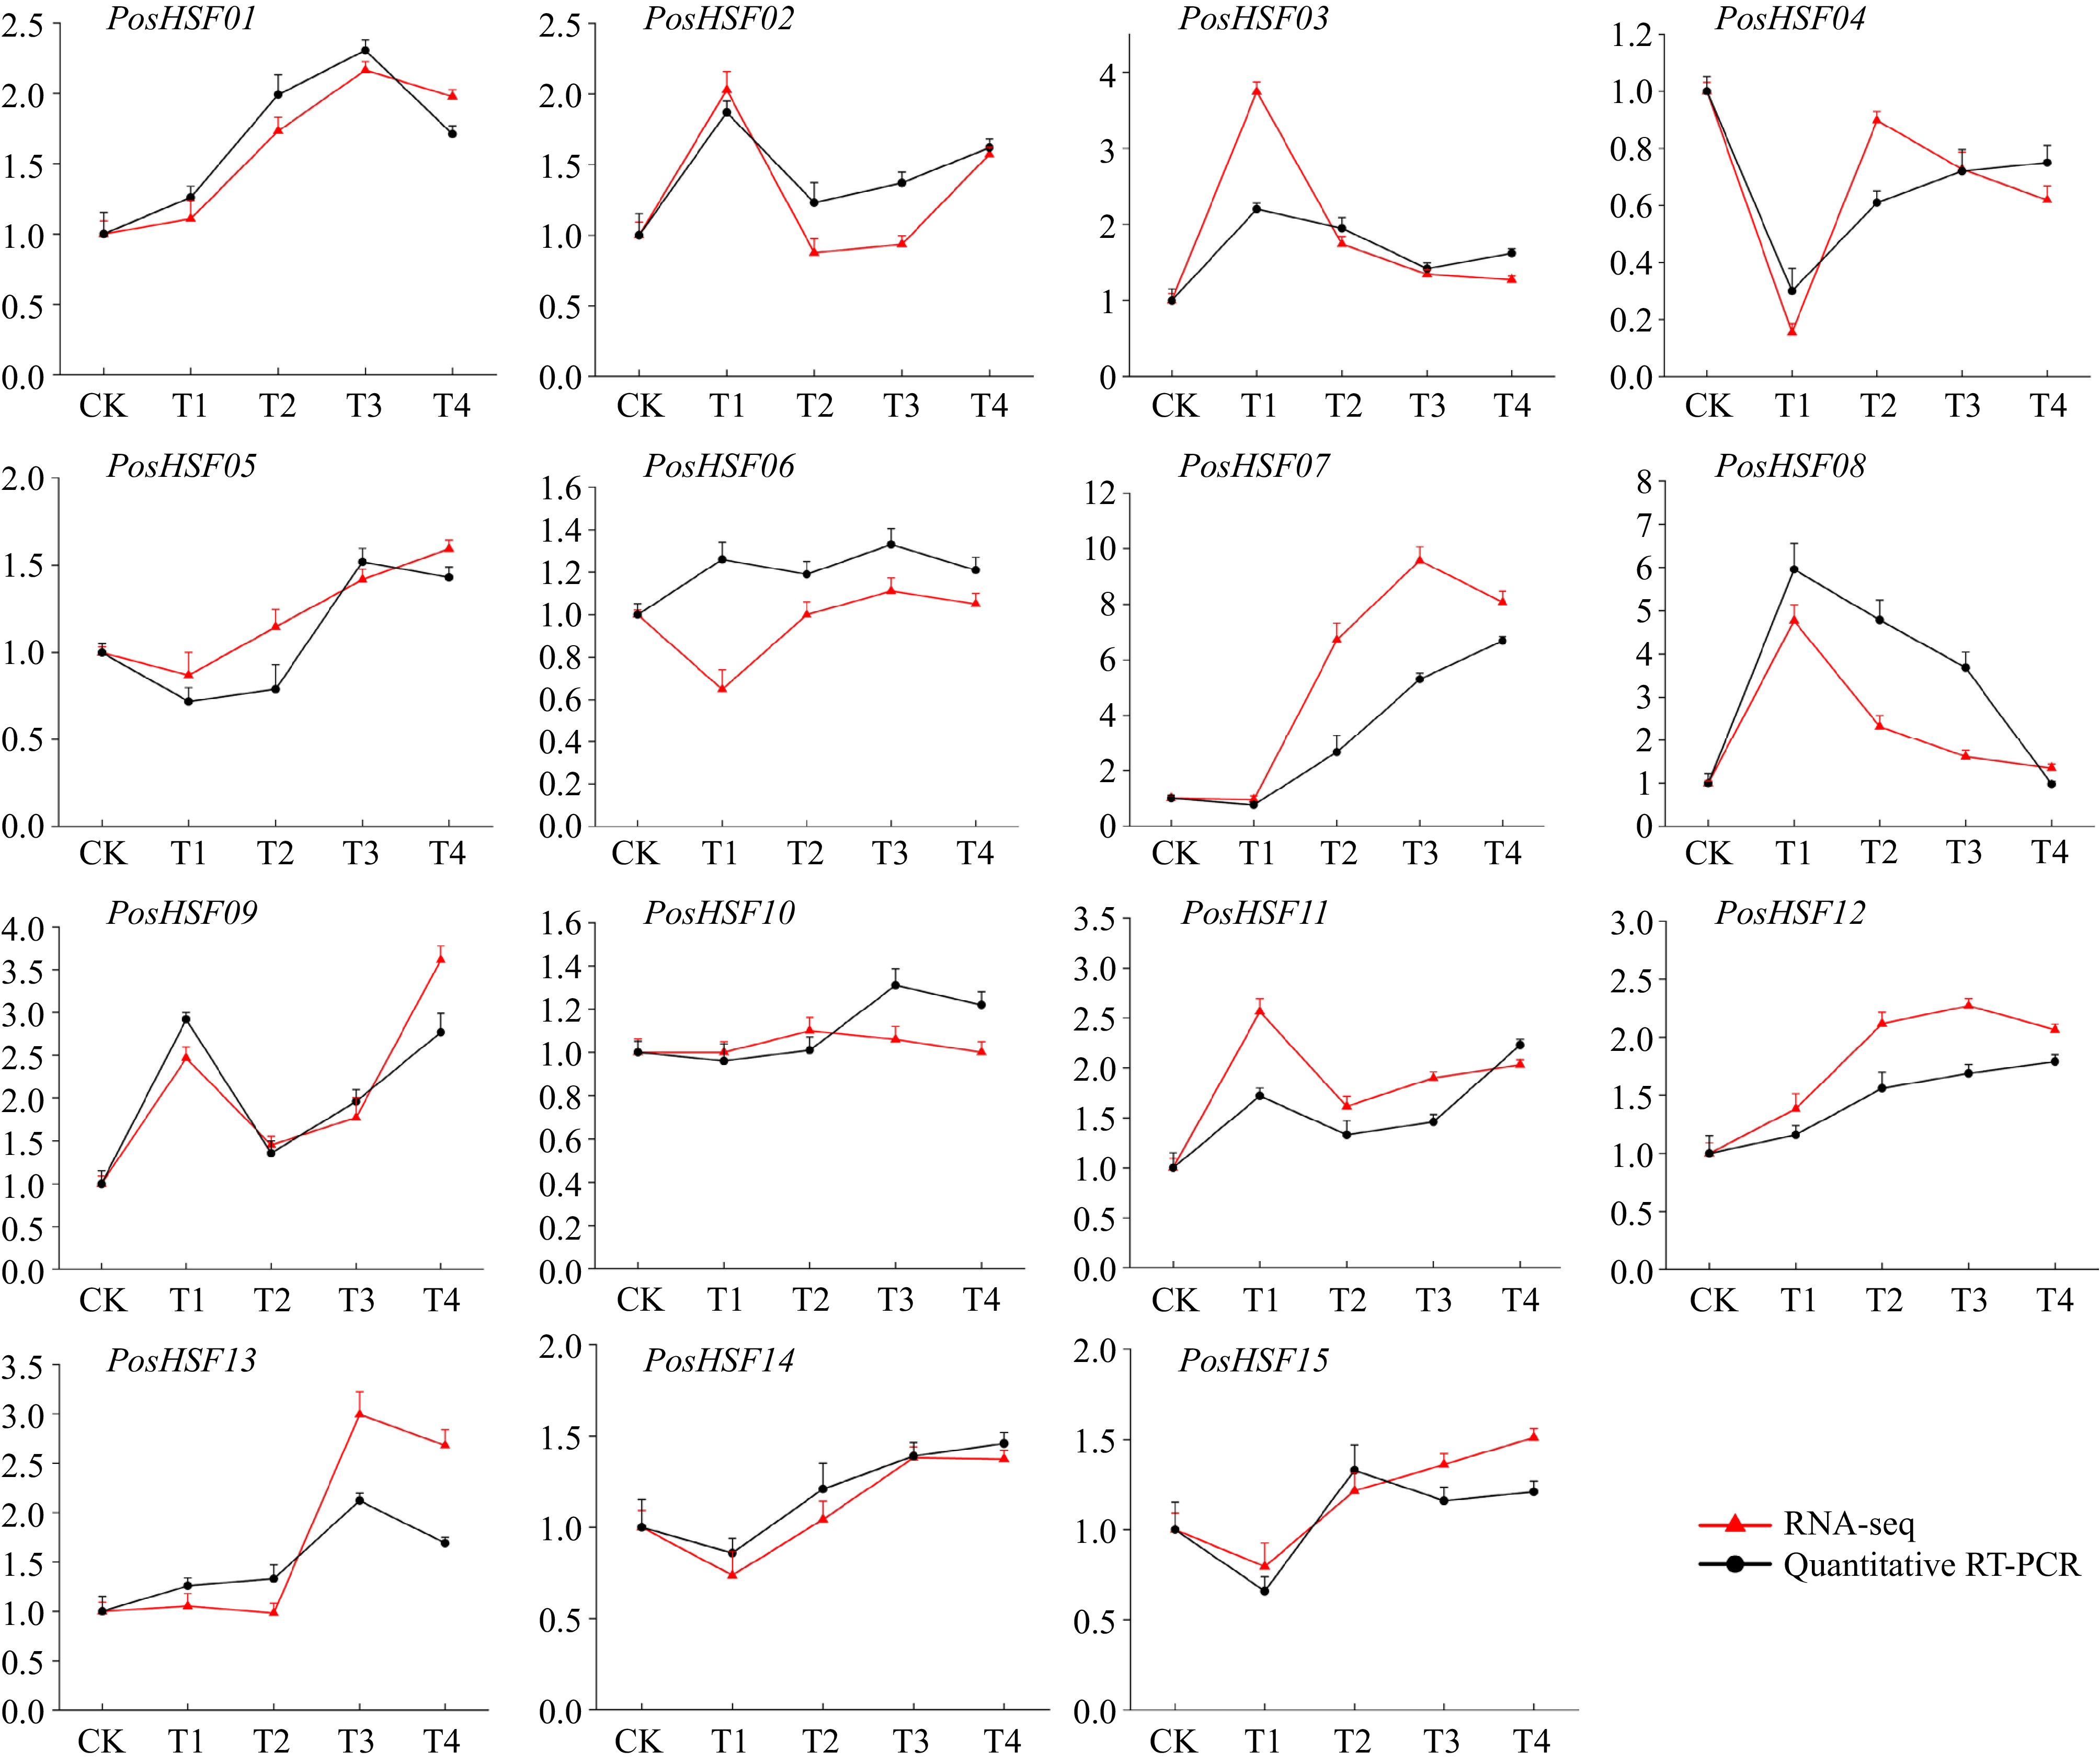
Figure 8.
Expression levels of 15 HSF members of P. suffruticosa in RNA-seq and qRT-PCR. The red line represents the results of RNA-seq, and the black line represents qRT-PCR.
Figures
(8)
Tables
(0)