-
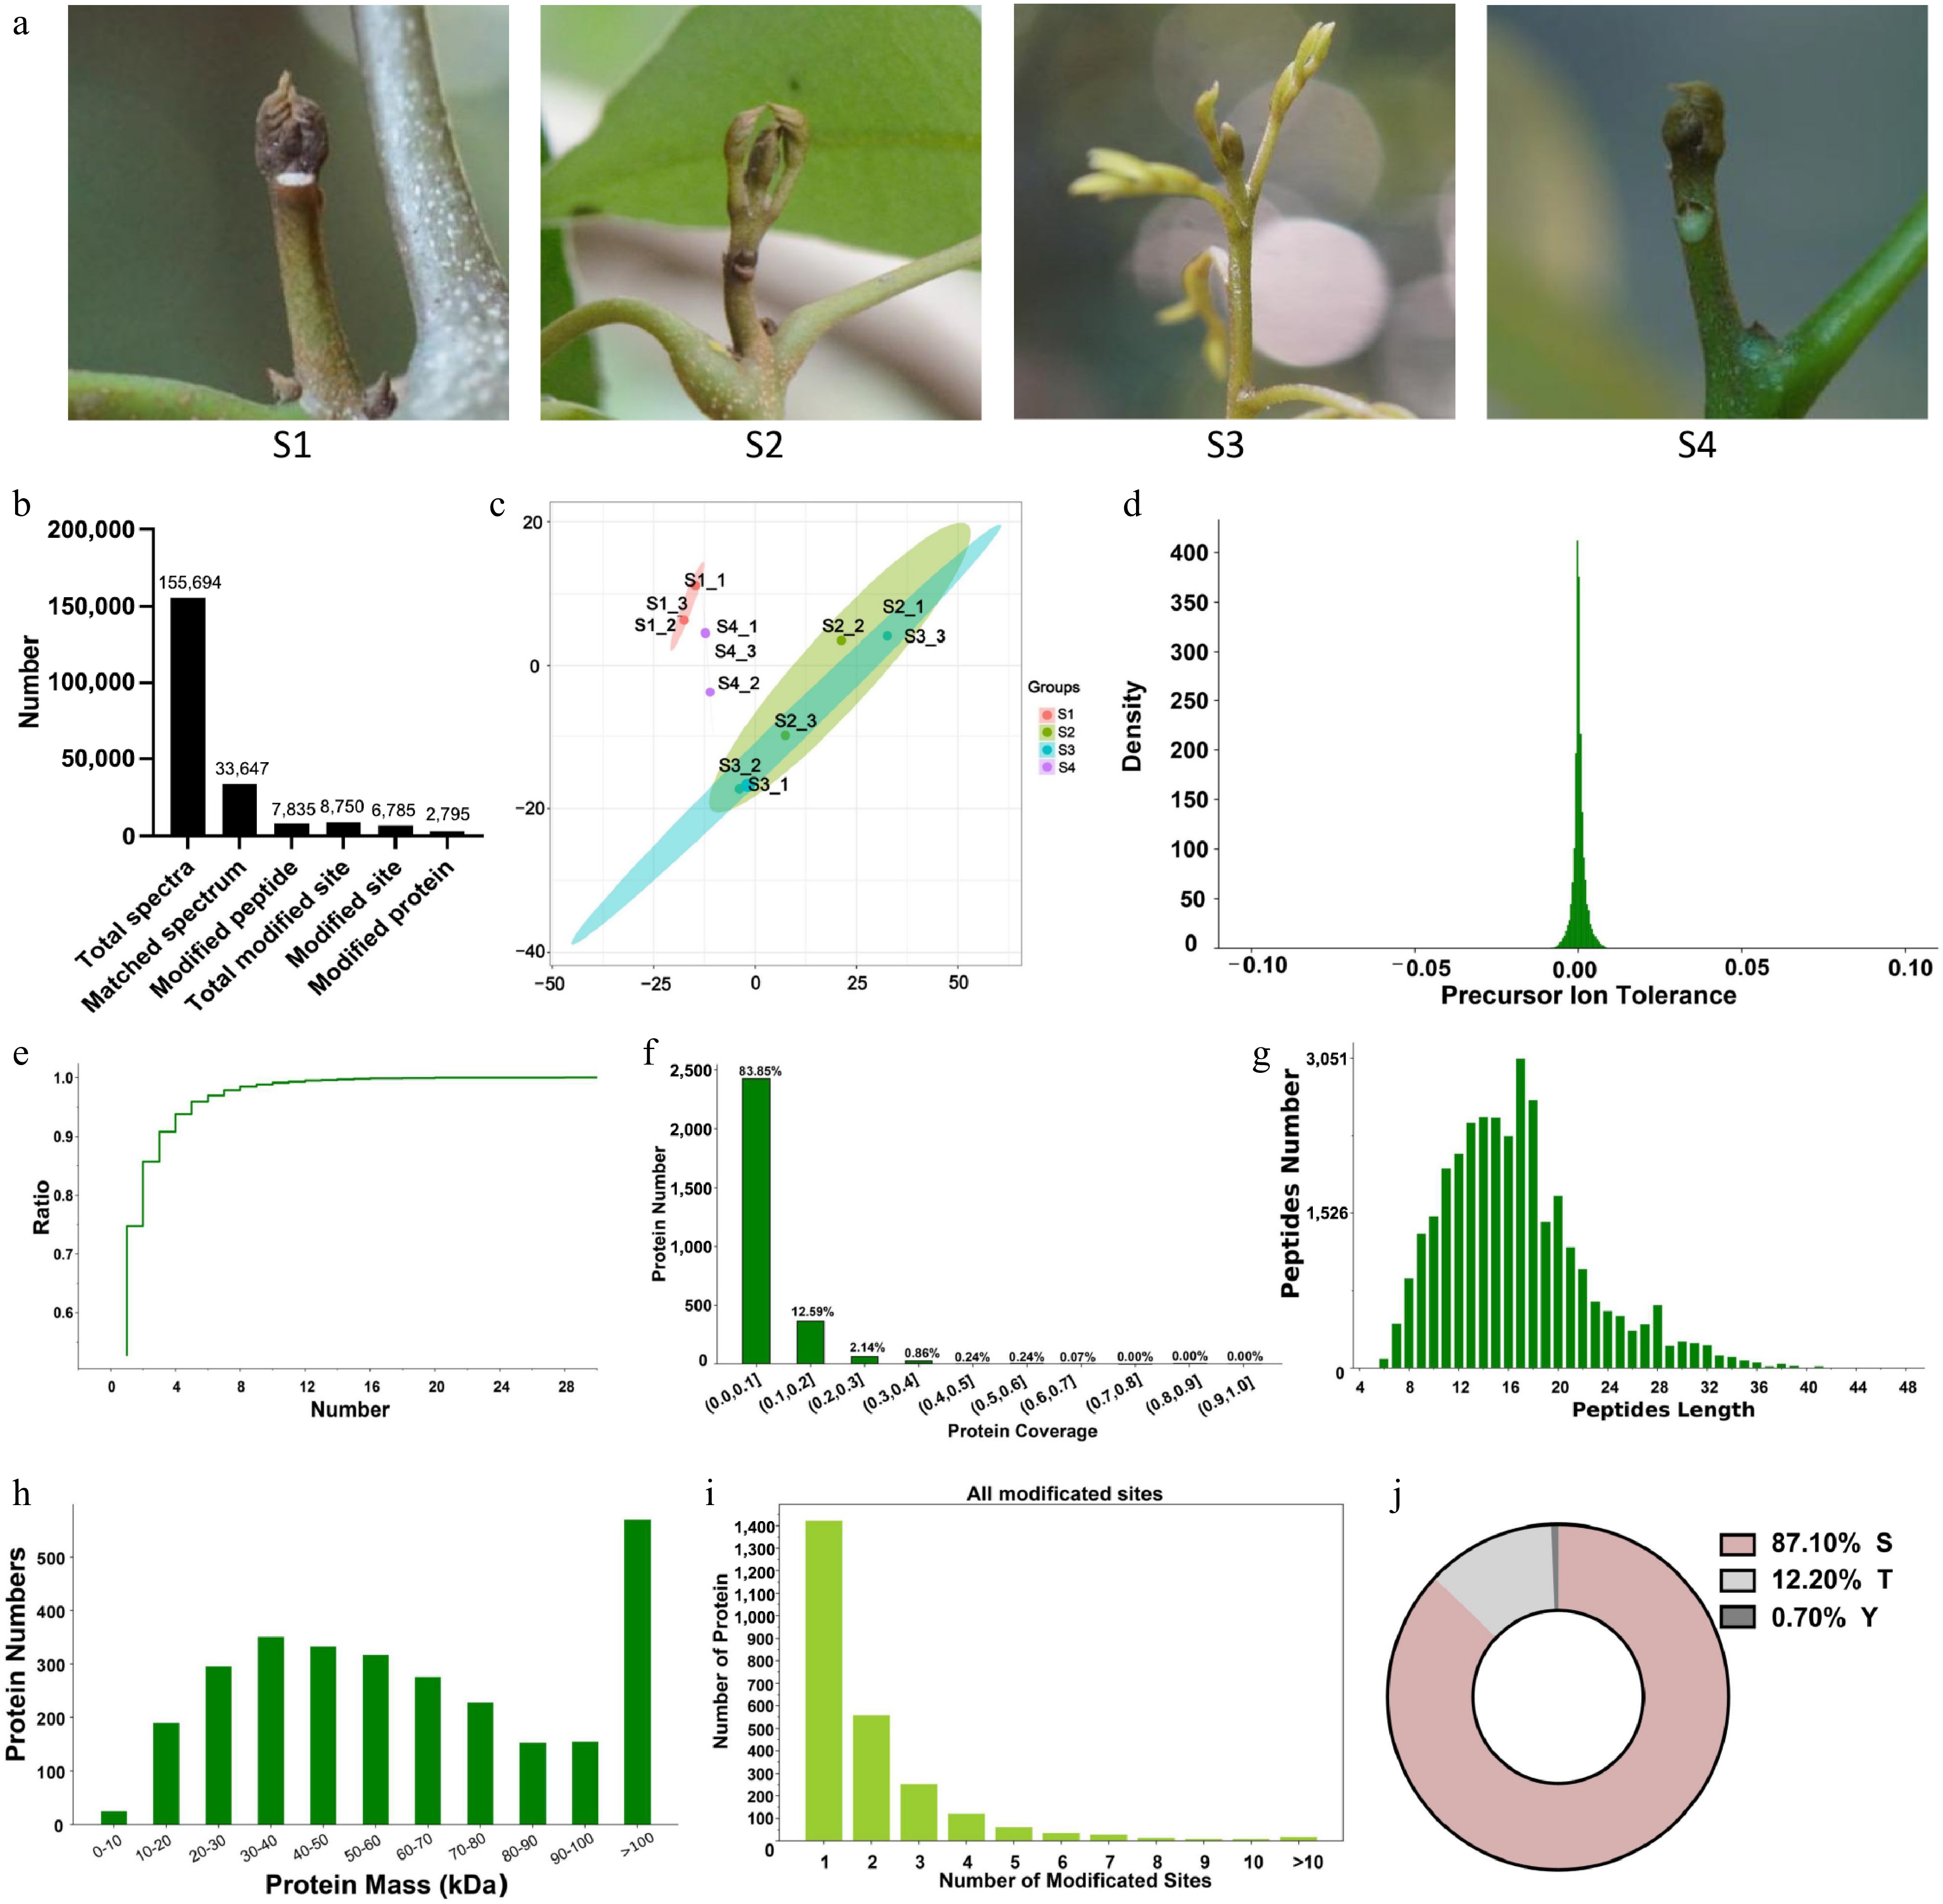
Figure 1.
Characterization and identification of differentially regulated phosphoproteins (DRPs) in litchi buds. (a) Litchi terminal buds at different developmental stages. S1: Stage 1, represents the dormancy stage; S2: Stage 2, represents the bud breaking stage; S3: Stage 3, represents the rapid growth stage; S4: Stage 4, represents the growth arrest stage prior to reentry of dormancy. (b) The number of different types of proteins identified from different developmental stages of litchi buds using phosphoproteomics. (c) Principal Component Analysis of phosphopeptides of biological triplicates of three cell types to depict variability between the groups. (d) Mass tolerance distribution of parent ions. (e) Unique peptide segment curve analysis. (f) Protein coverage distribution. (g) Length distribution of phosphorylated peptides. (h) The distribution of DRPs quantities of different sizes. (i) Distribution of phosphorylation sites per protein.(j) Percentage distribution of the amino acid residues for all detected DRPs.
-
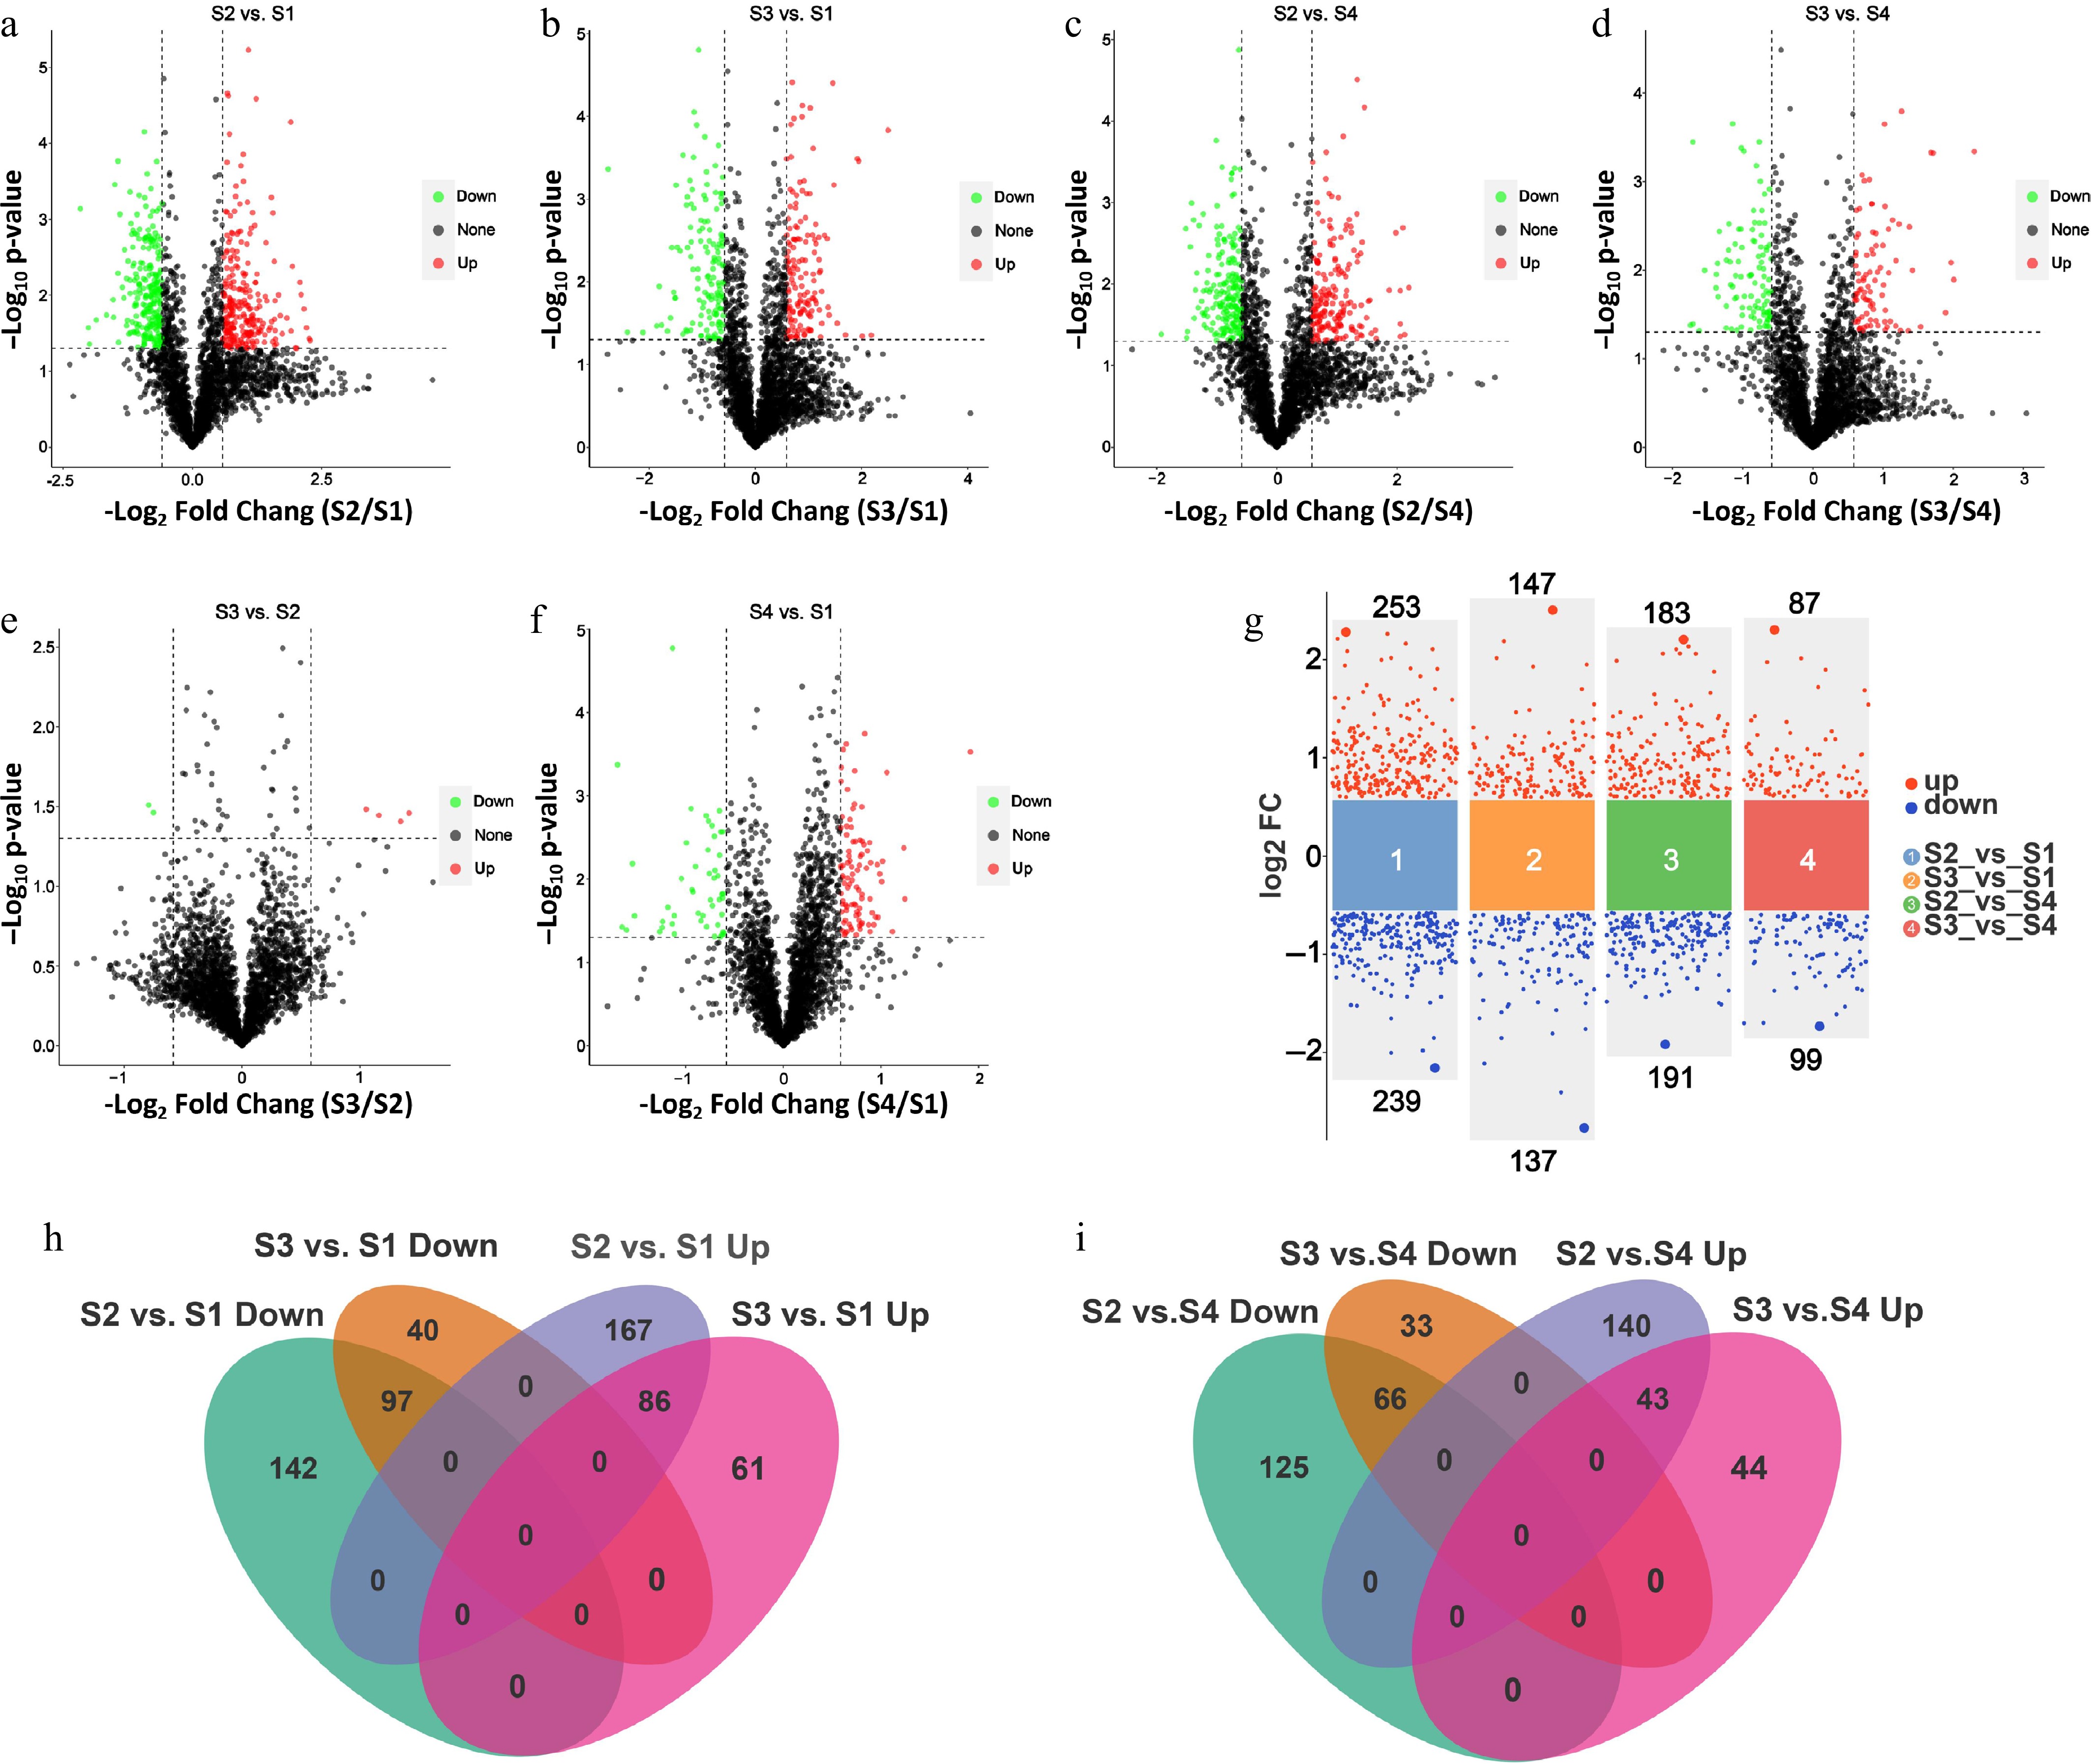
Figure 2.
Differential protein analysis of phosphoproteome in litchi buds at different developmental stages. Volcano plots show the indicated numbers of upregulated and downregulated phosphosites in (a) S2 vs S1, (b) S3 vs S1, (c) S2 vs S4, (d) S3 vs S4, (e) S3 vs S2, and (f) S4 vs S1. (g) Volcano plots show the numbers of upregulated and downregulated phosphosites in S2 vs. S1, S3 vs S1, S2 vs S4, and S3 vs S4 base on log2FC (the significance threshold of p < 0.05 and the FC of 1.5). FC, folds of change. (h) Venn diagrams showing the number of overlapping DRPs from S3 vs S1 and S2 vs S1 pairwise comparisons. (i) Venn diagrams showing the number of overlapping DRPs from S2 vs S4 and S3 vs S4 pairwise comparisons.
-
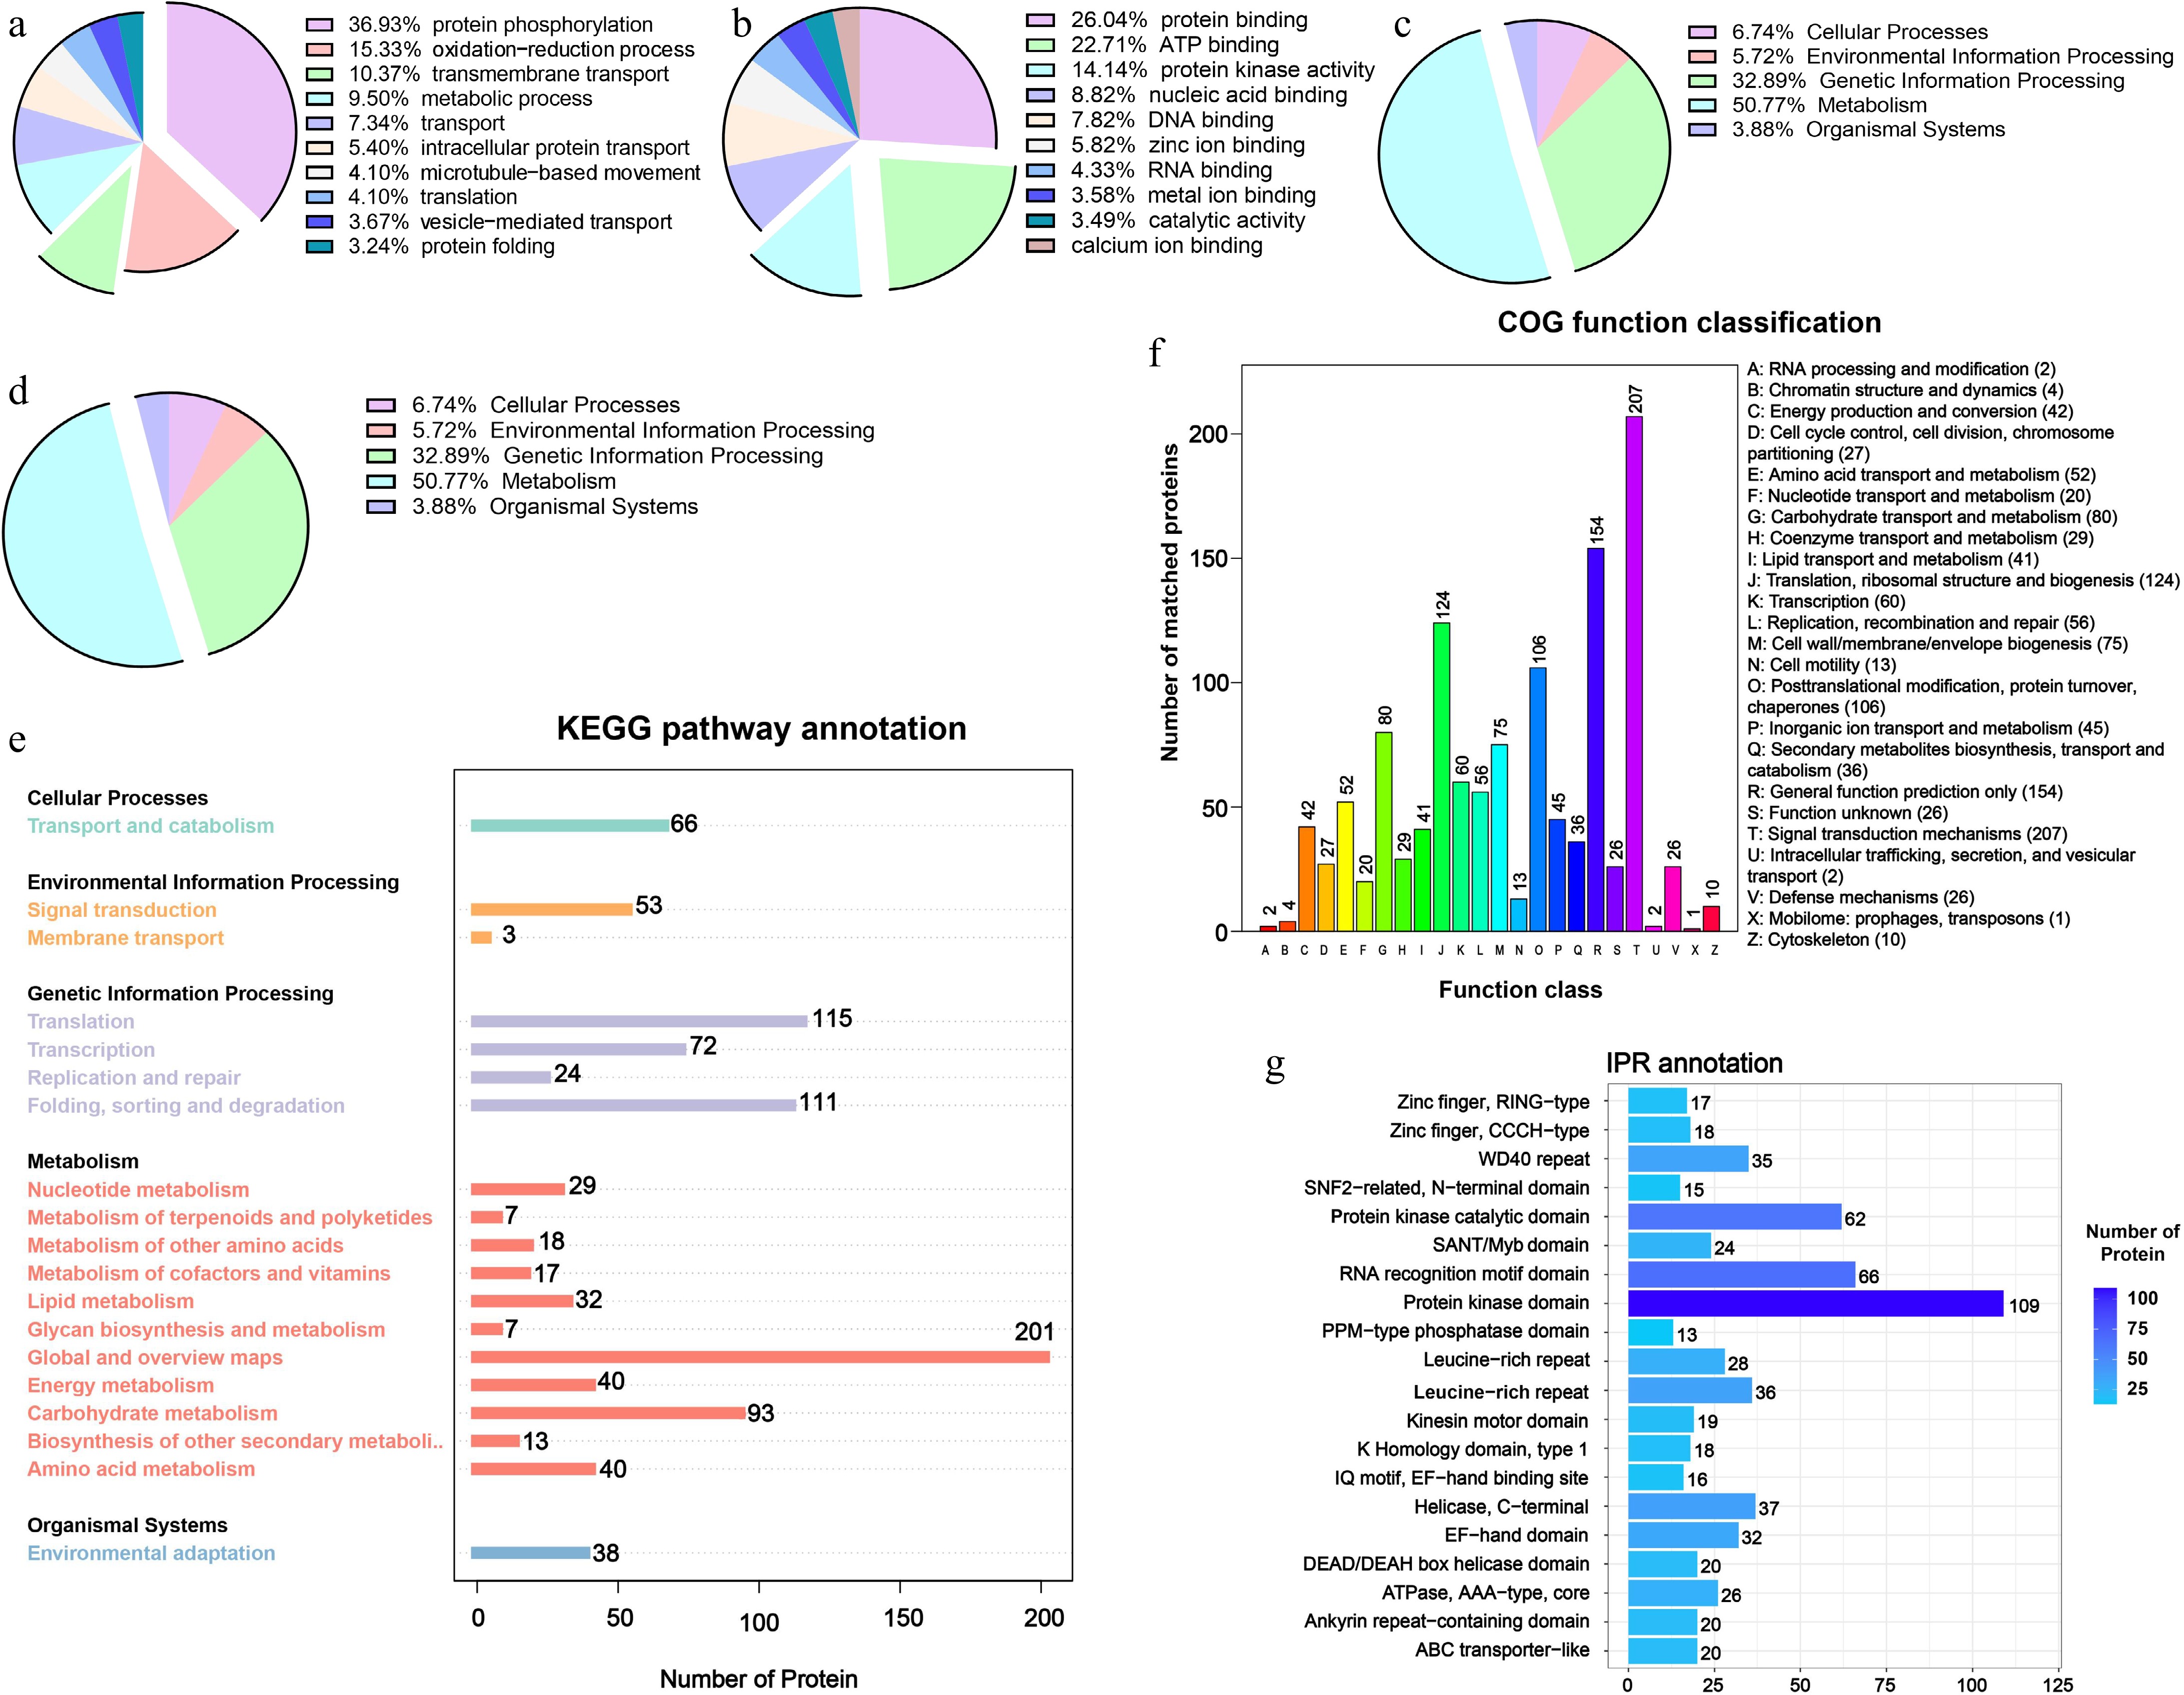
Figure 3.
Functional characterization of DRPs with significant changes in phosphorylation during litchi bud development. GO enrichment analysis of the DRPs identified in this study. Based on GO slim terms all DRPs were assigned to (a) BP, (b) MF, and (c) CC GO categories. BP, biological process; MF, molecular function; CC, cellular component. (d), (e) KEGG pathway analysis of DRPs identified. (f) Clusters of Orthologous Groups functional classification of DRPs. (g) InterPro annotation of DRPs.
-
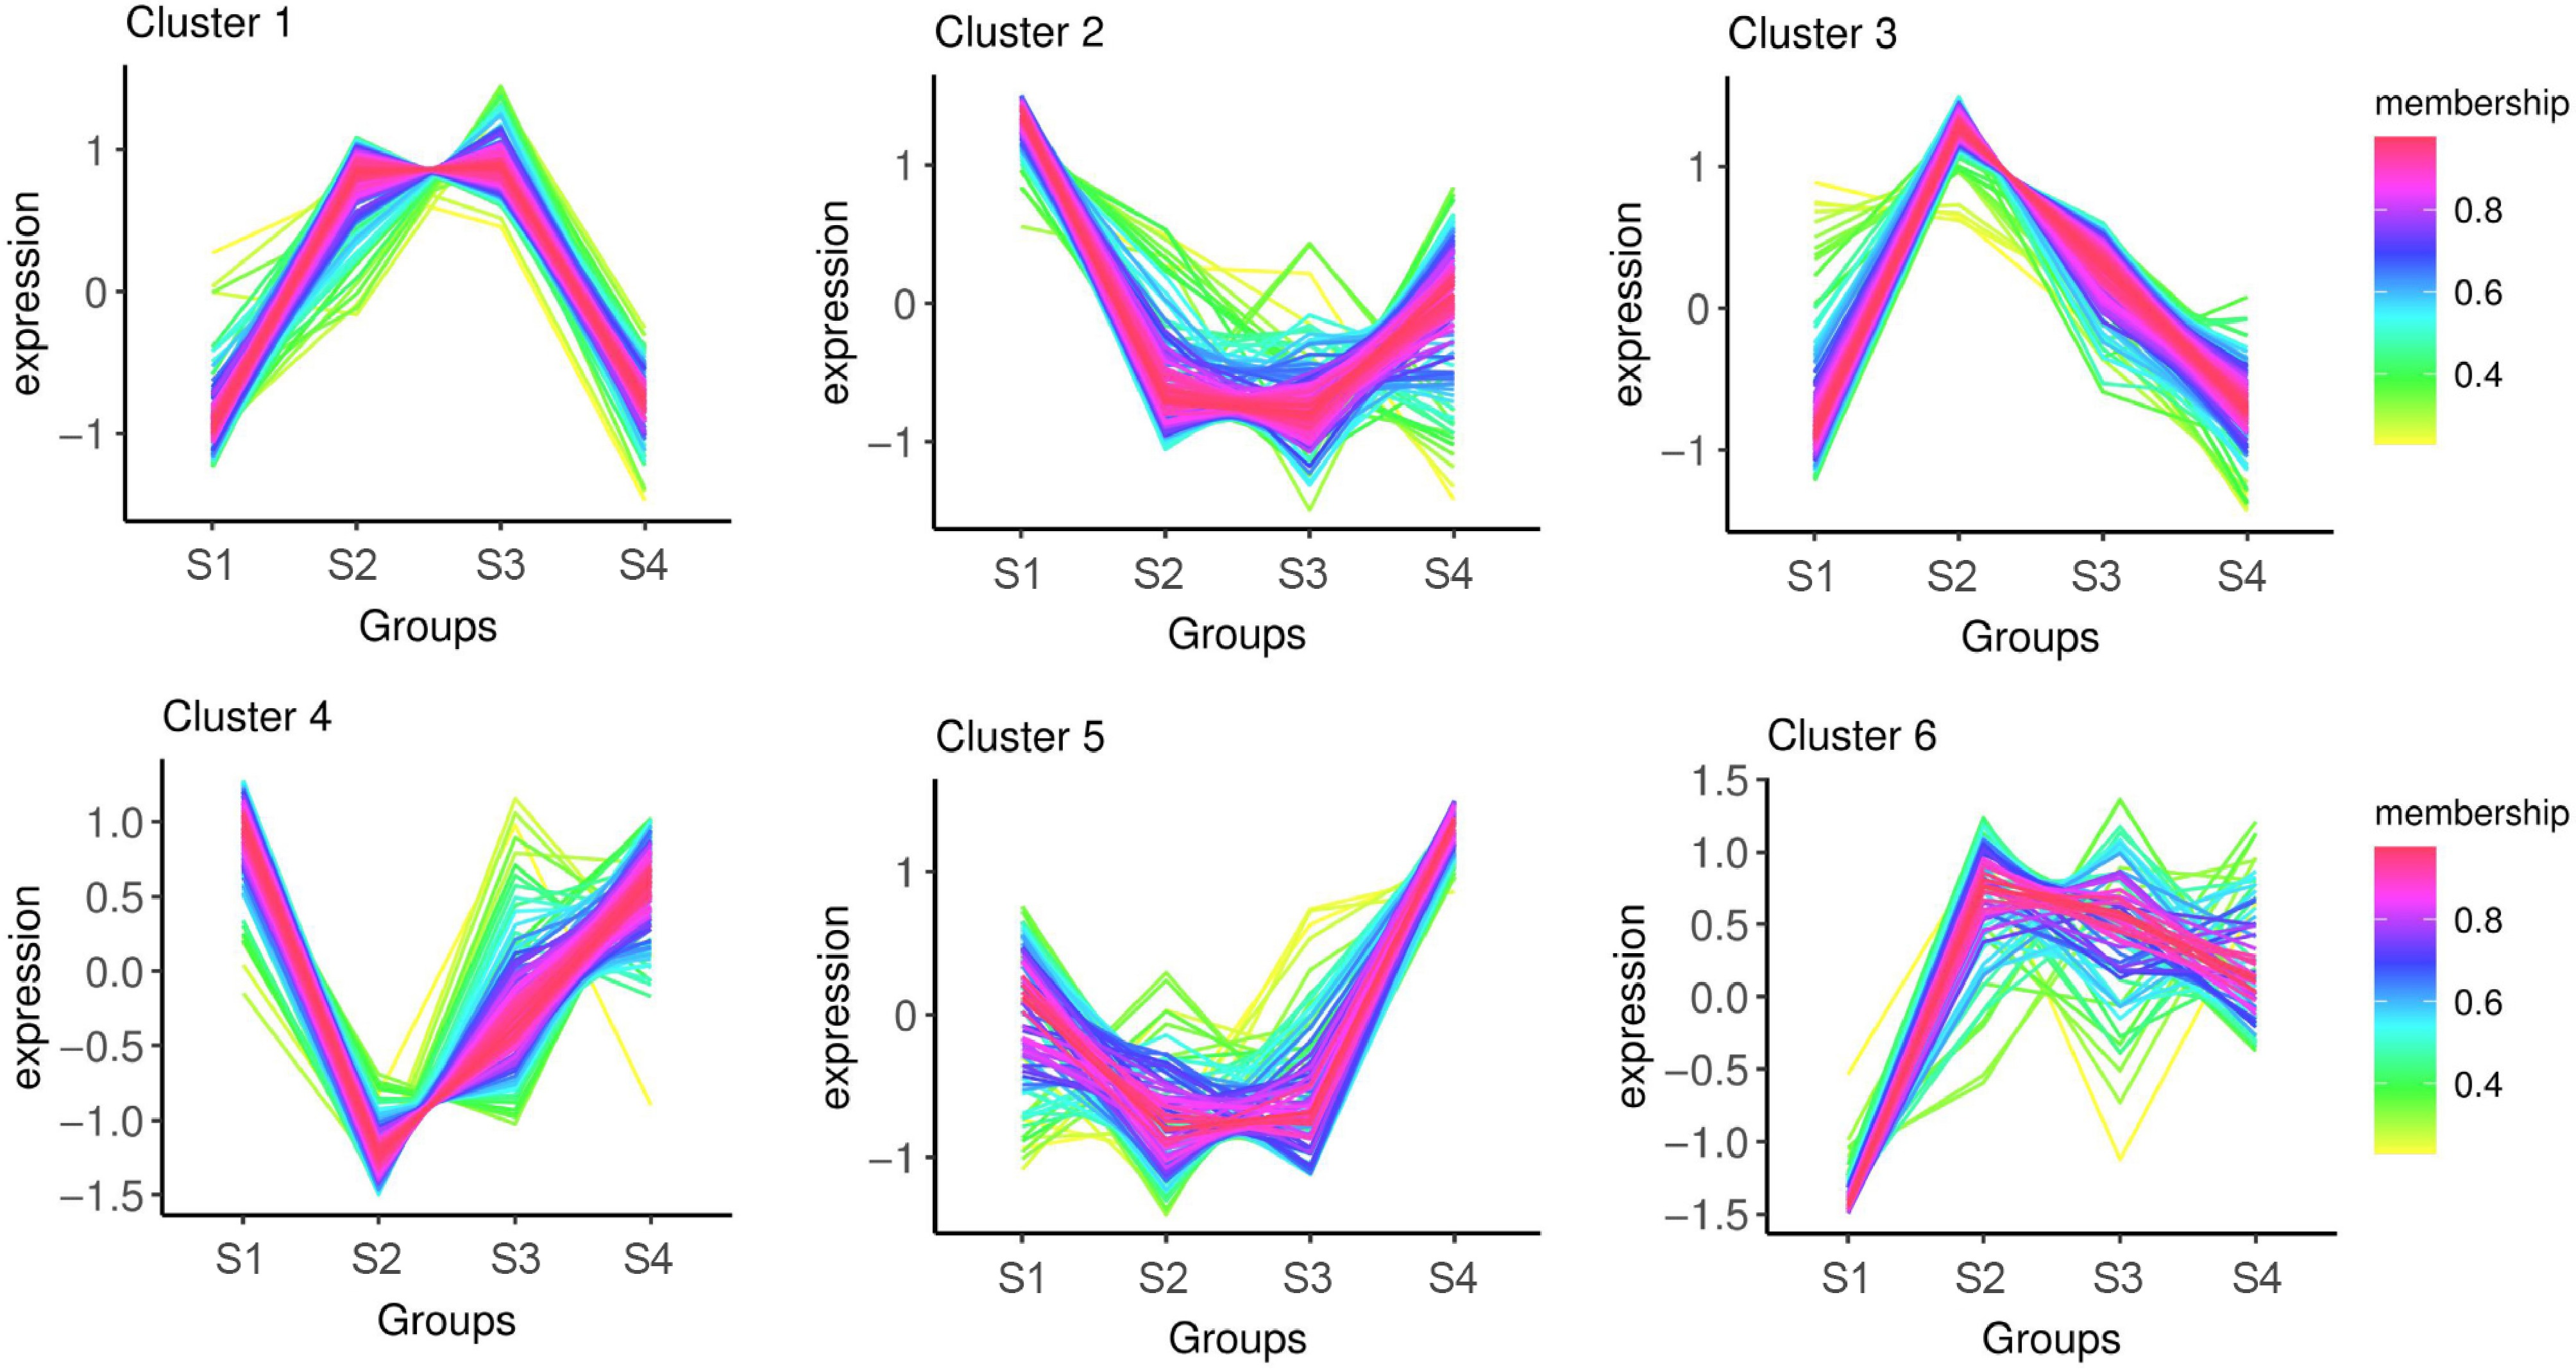
Figure 4.
Cluster analysis of DRPs in phosphoproteome of litchi buds at different developmental stages.
-
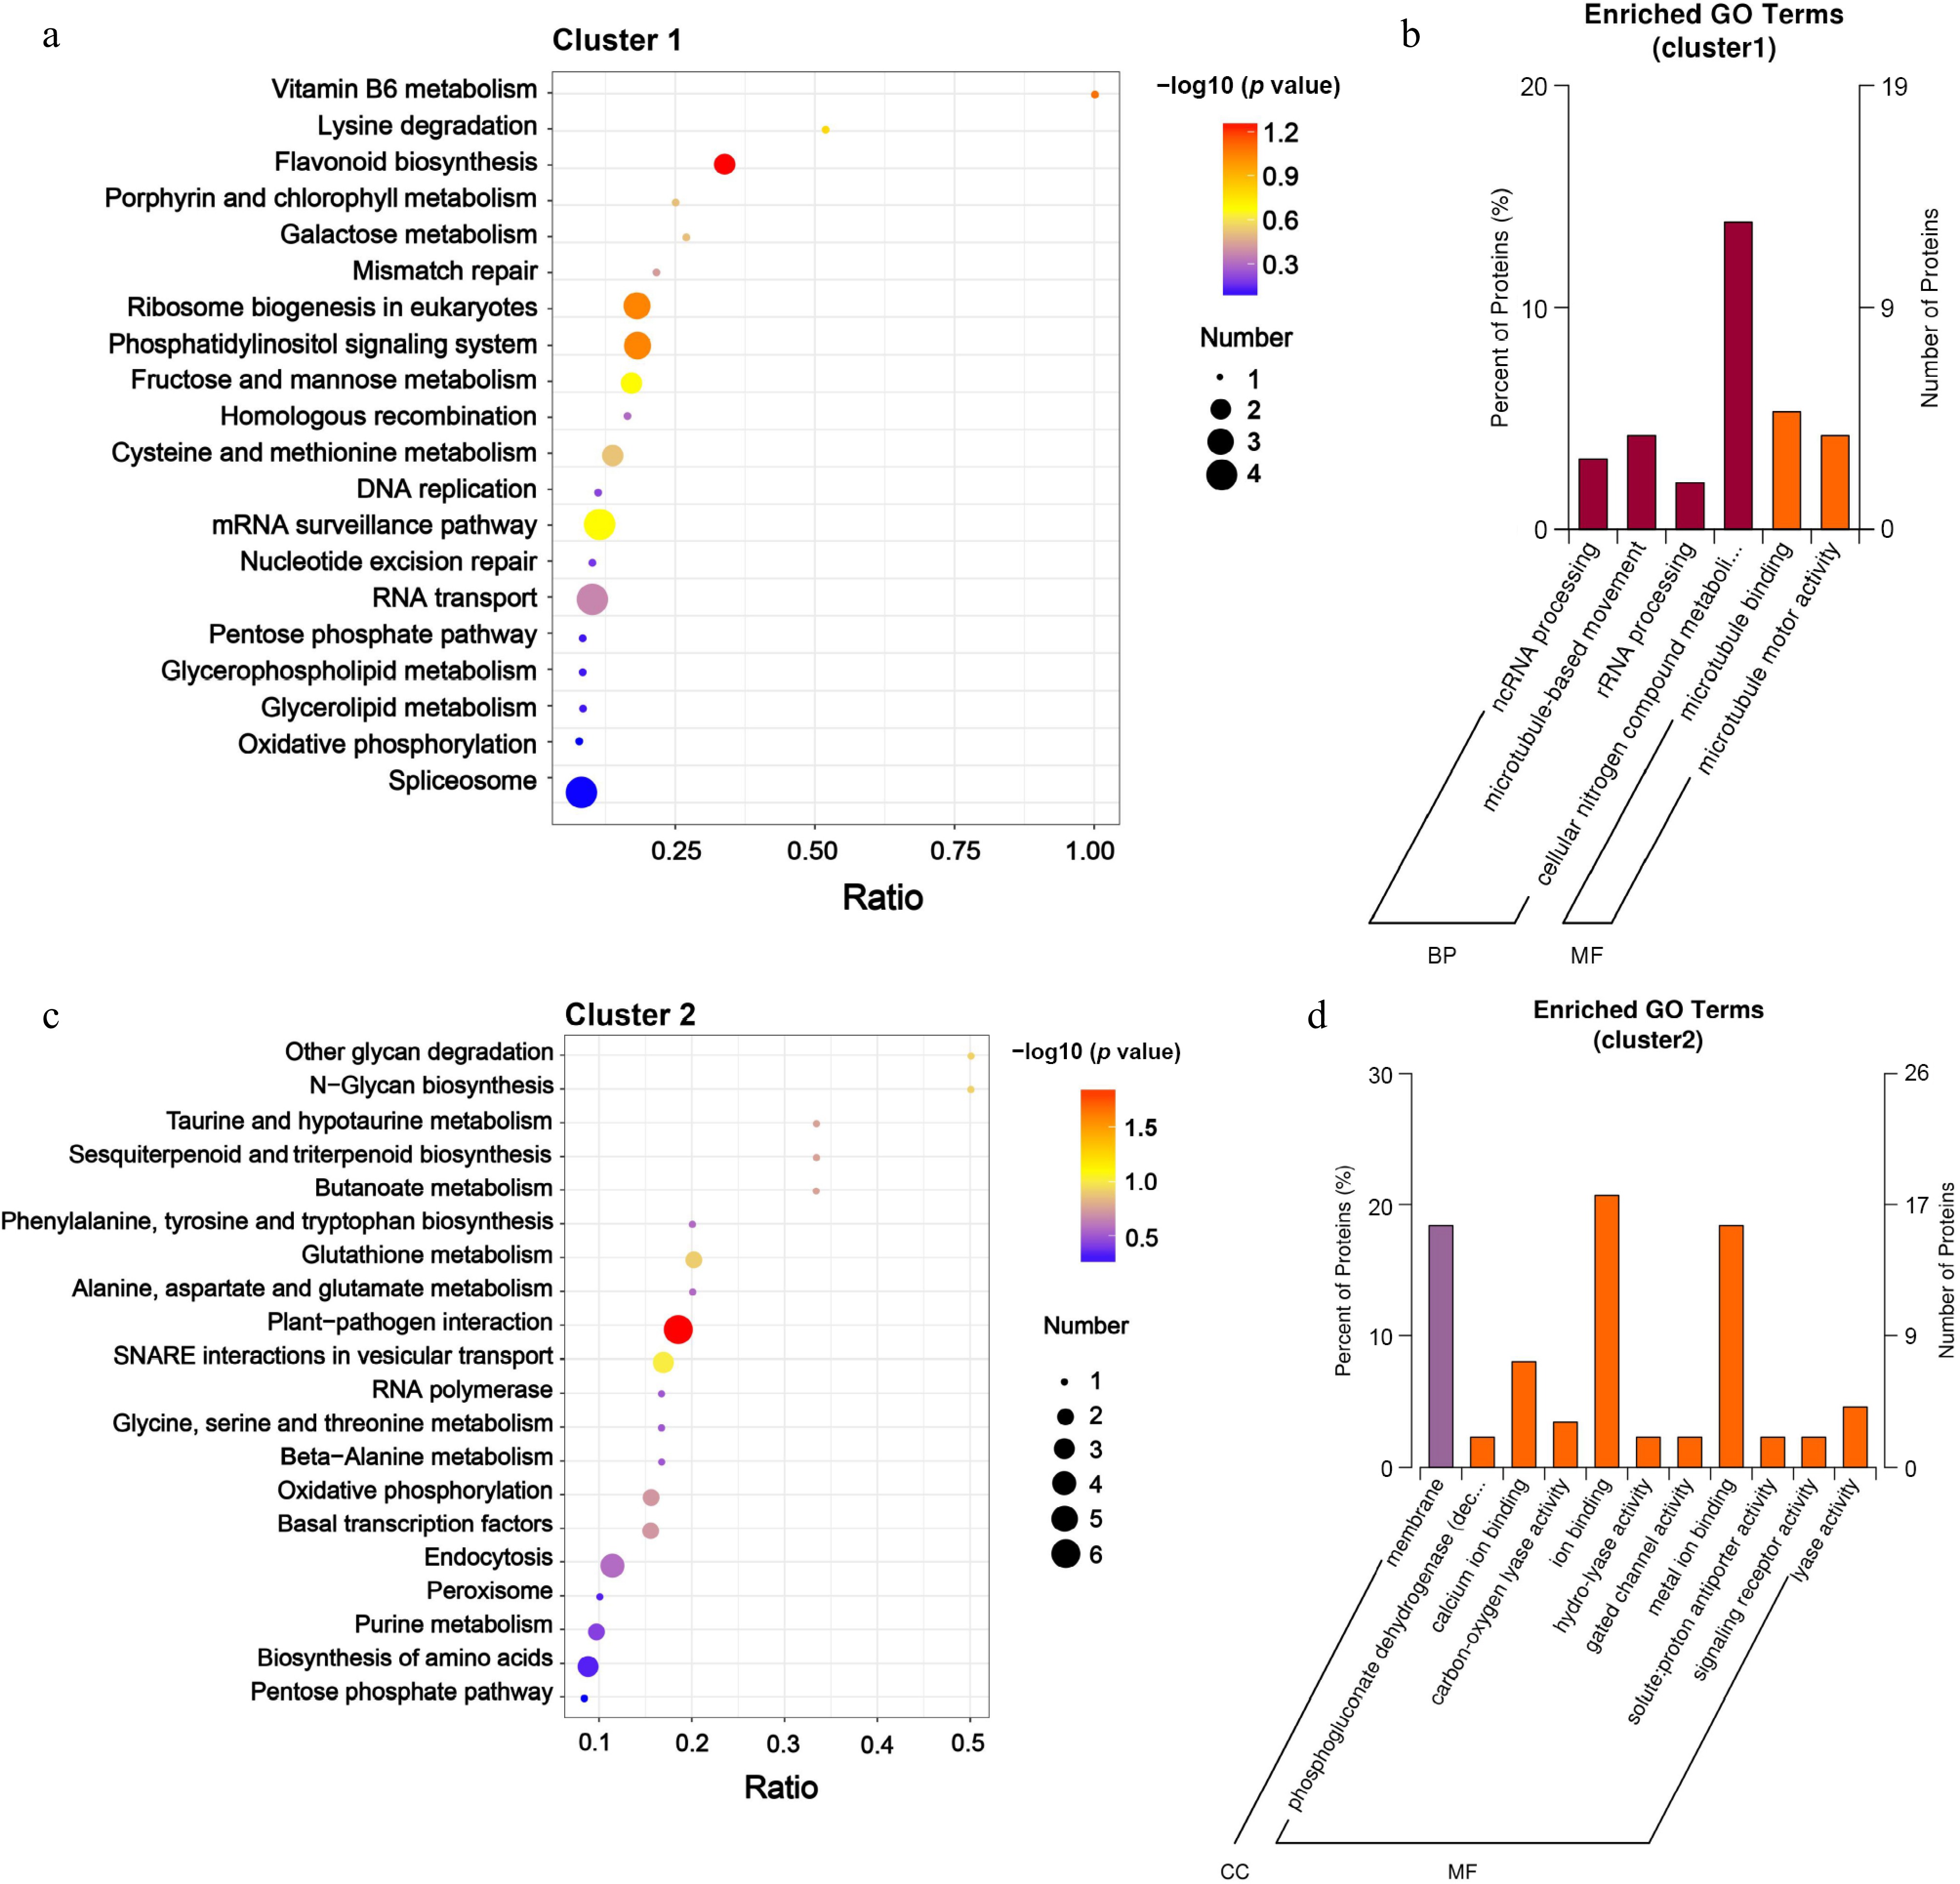
Figure 5.
KEGG analysis and the enrichment of GO categories for DRPs in Clusters 1 and Clusters 2. (a) KEGG analysis, and (b) the enrichment of GO categories for DRPs in Clusters 1 were conducted; (c) KEGG analysis, and (d) the enrichment of GO categories for DRPs in Clusters 2 were conducted. The significantly enriched terms in DRPs (with an adjusted FDR of ≤ 0.05) are presented. The protein ratio indicates the proportion of DRPs associated with a specific GO term (adjusted FDR ≤ 0.05) relative to the total number of proteins.
-
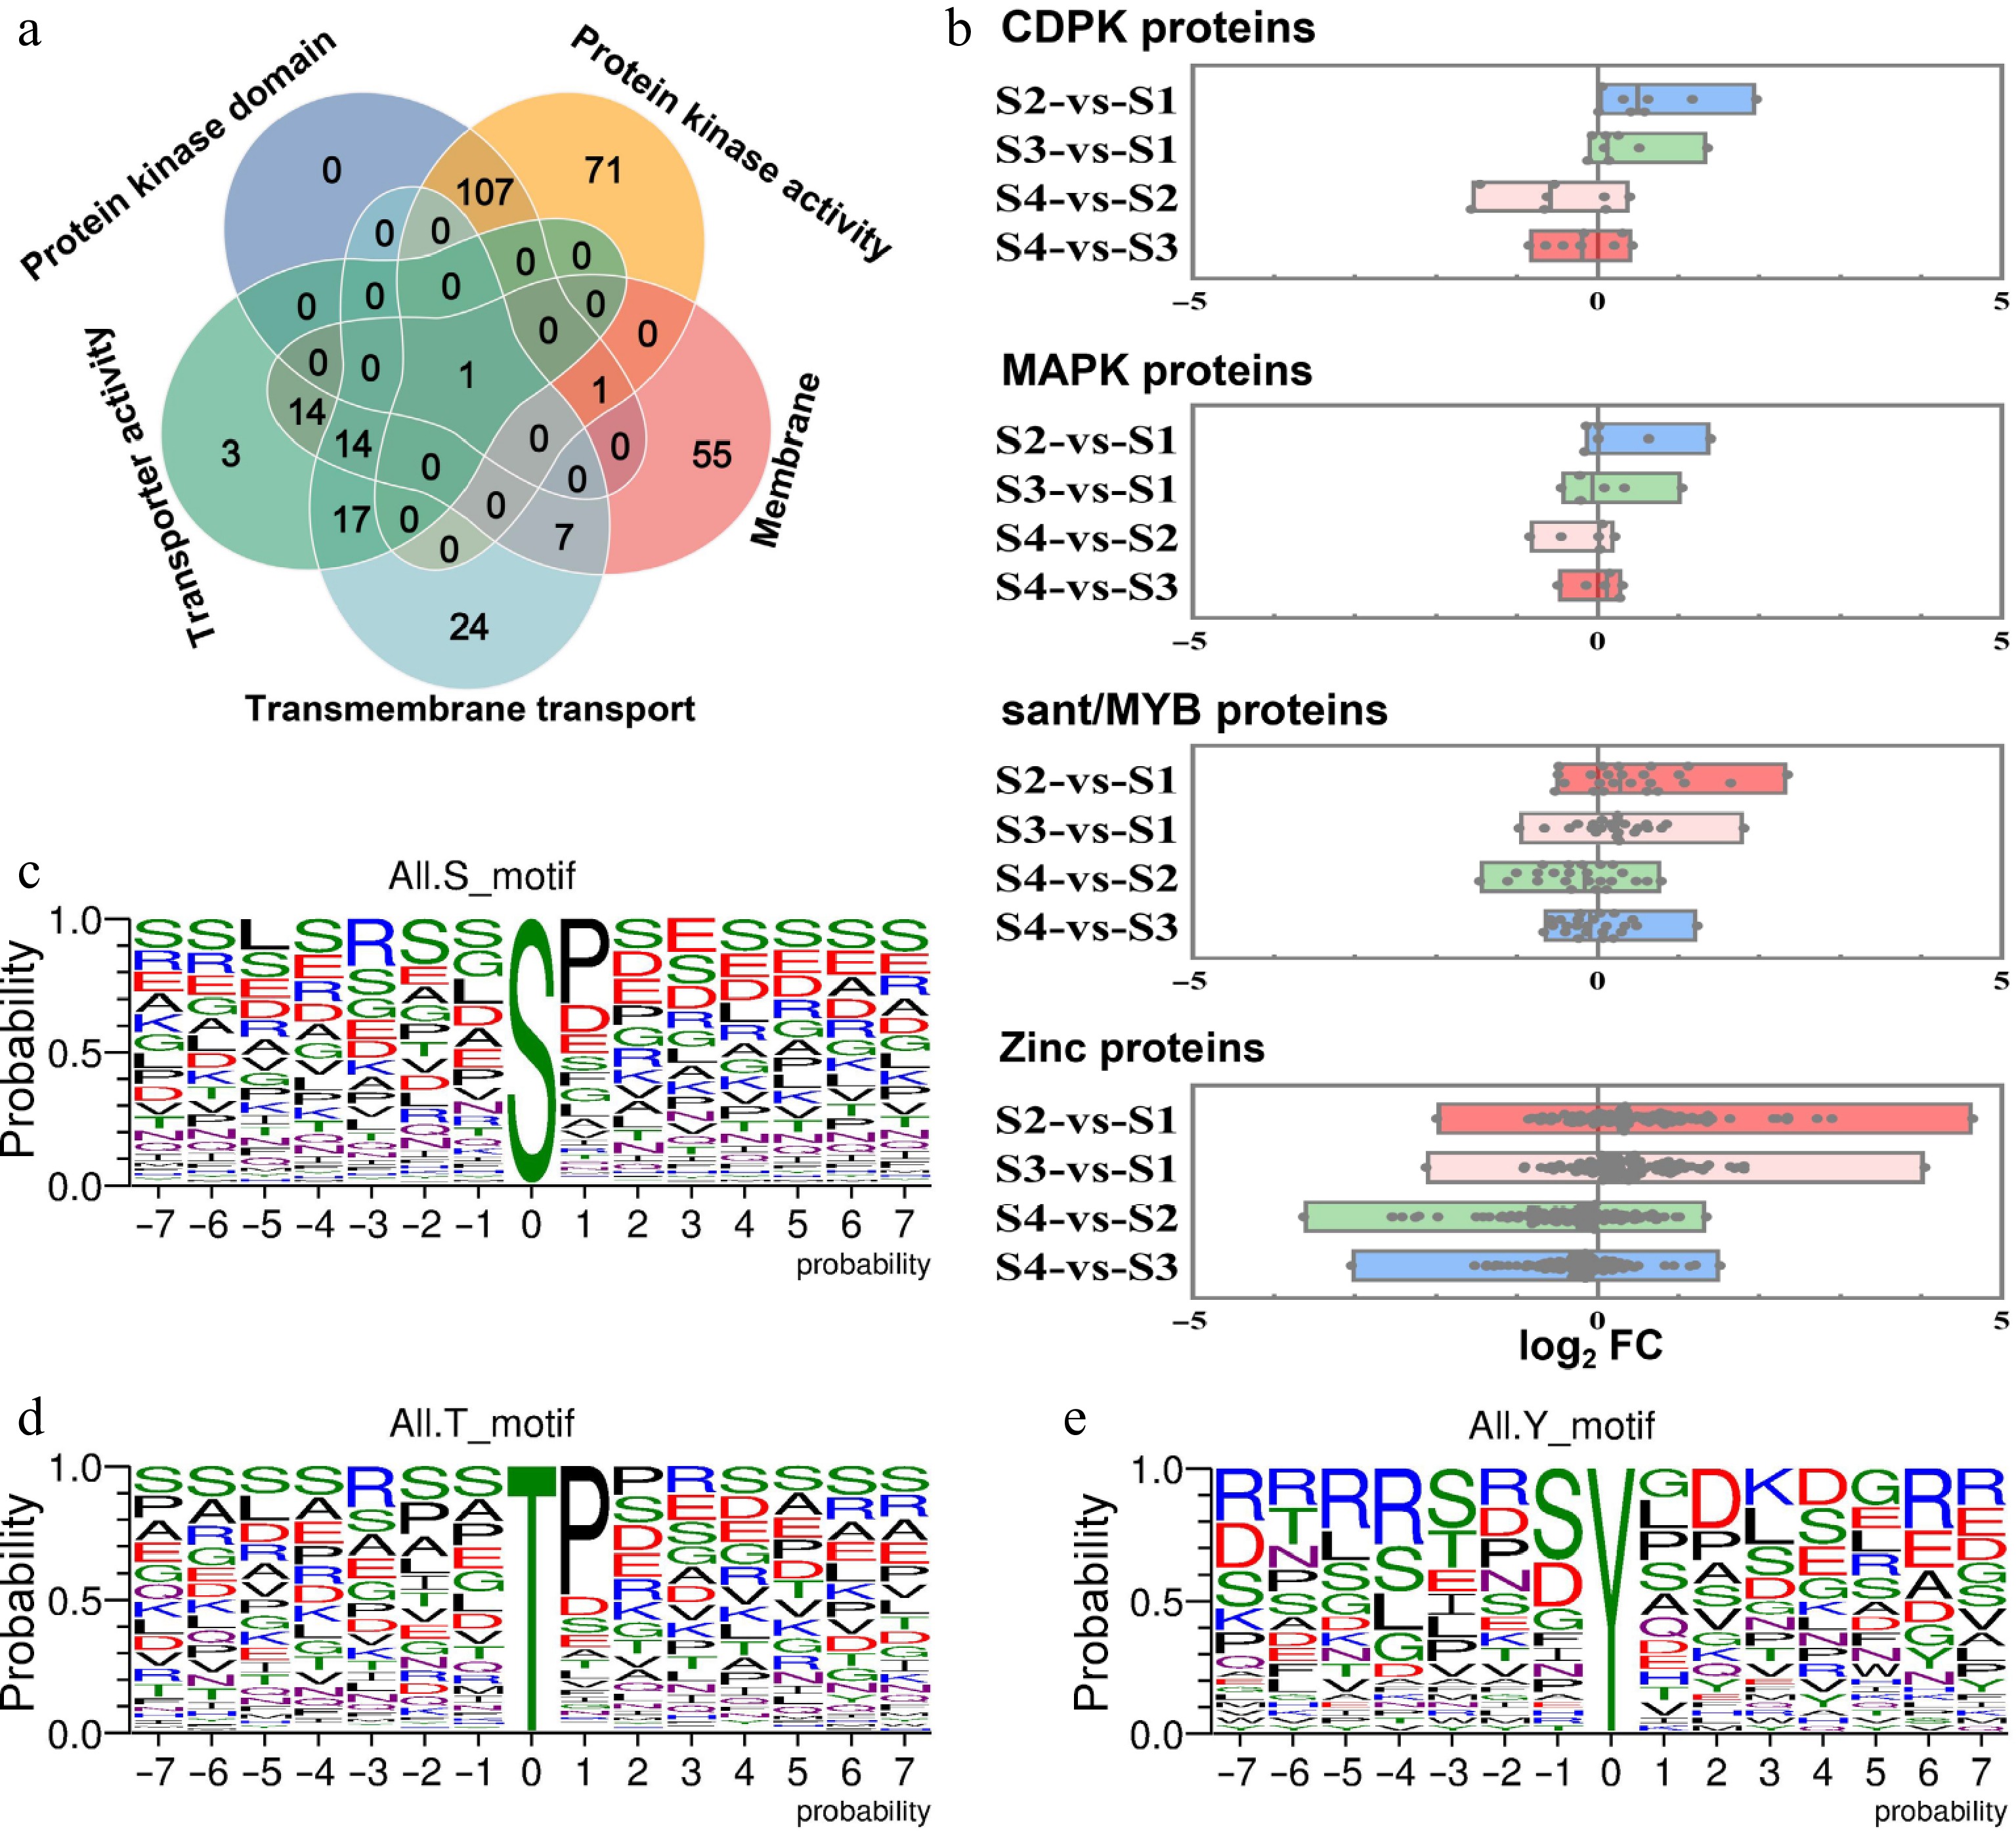
Figure 6.
Analysis of the fold change levels in the expression abundance of related DRPs between dormancy and growth stages, as well as phosphorylation sites of phosphorylated proteins. (a) Venn diagrams illustrating the number of overlapping proteins among those with kinase domains and kinase activity, membrane, transmembrane transporters, and transporter activity proteins. (b) Analysis of the expression abundance of phosphorylated proteins, including CDPK, MAPK, sant/MYB, and zinc across the four different development stages of litchi bud. A single point represents a protein. The vertical axis represents the combination names for comparison, while the horizontal axis denotes log2FC, FC: the fold change in expression abundance of DRPs between the two groups represented on the vertical axis. Single phosphorylation motifs were identified, with overrepresented motifs for (c) S, (d) T, and (e) Y being extracted.
-
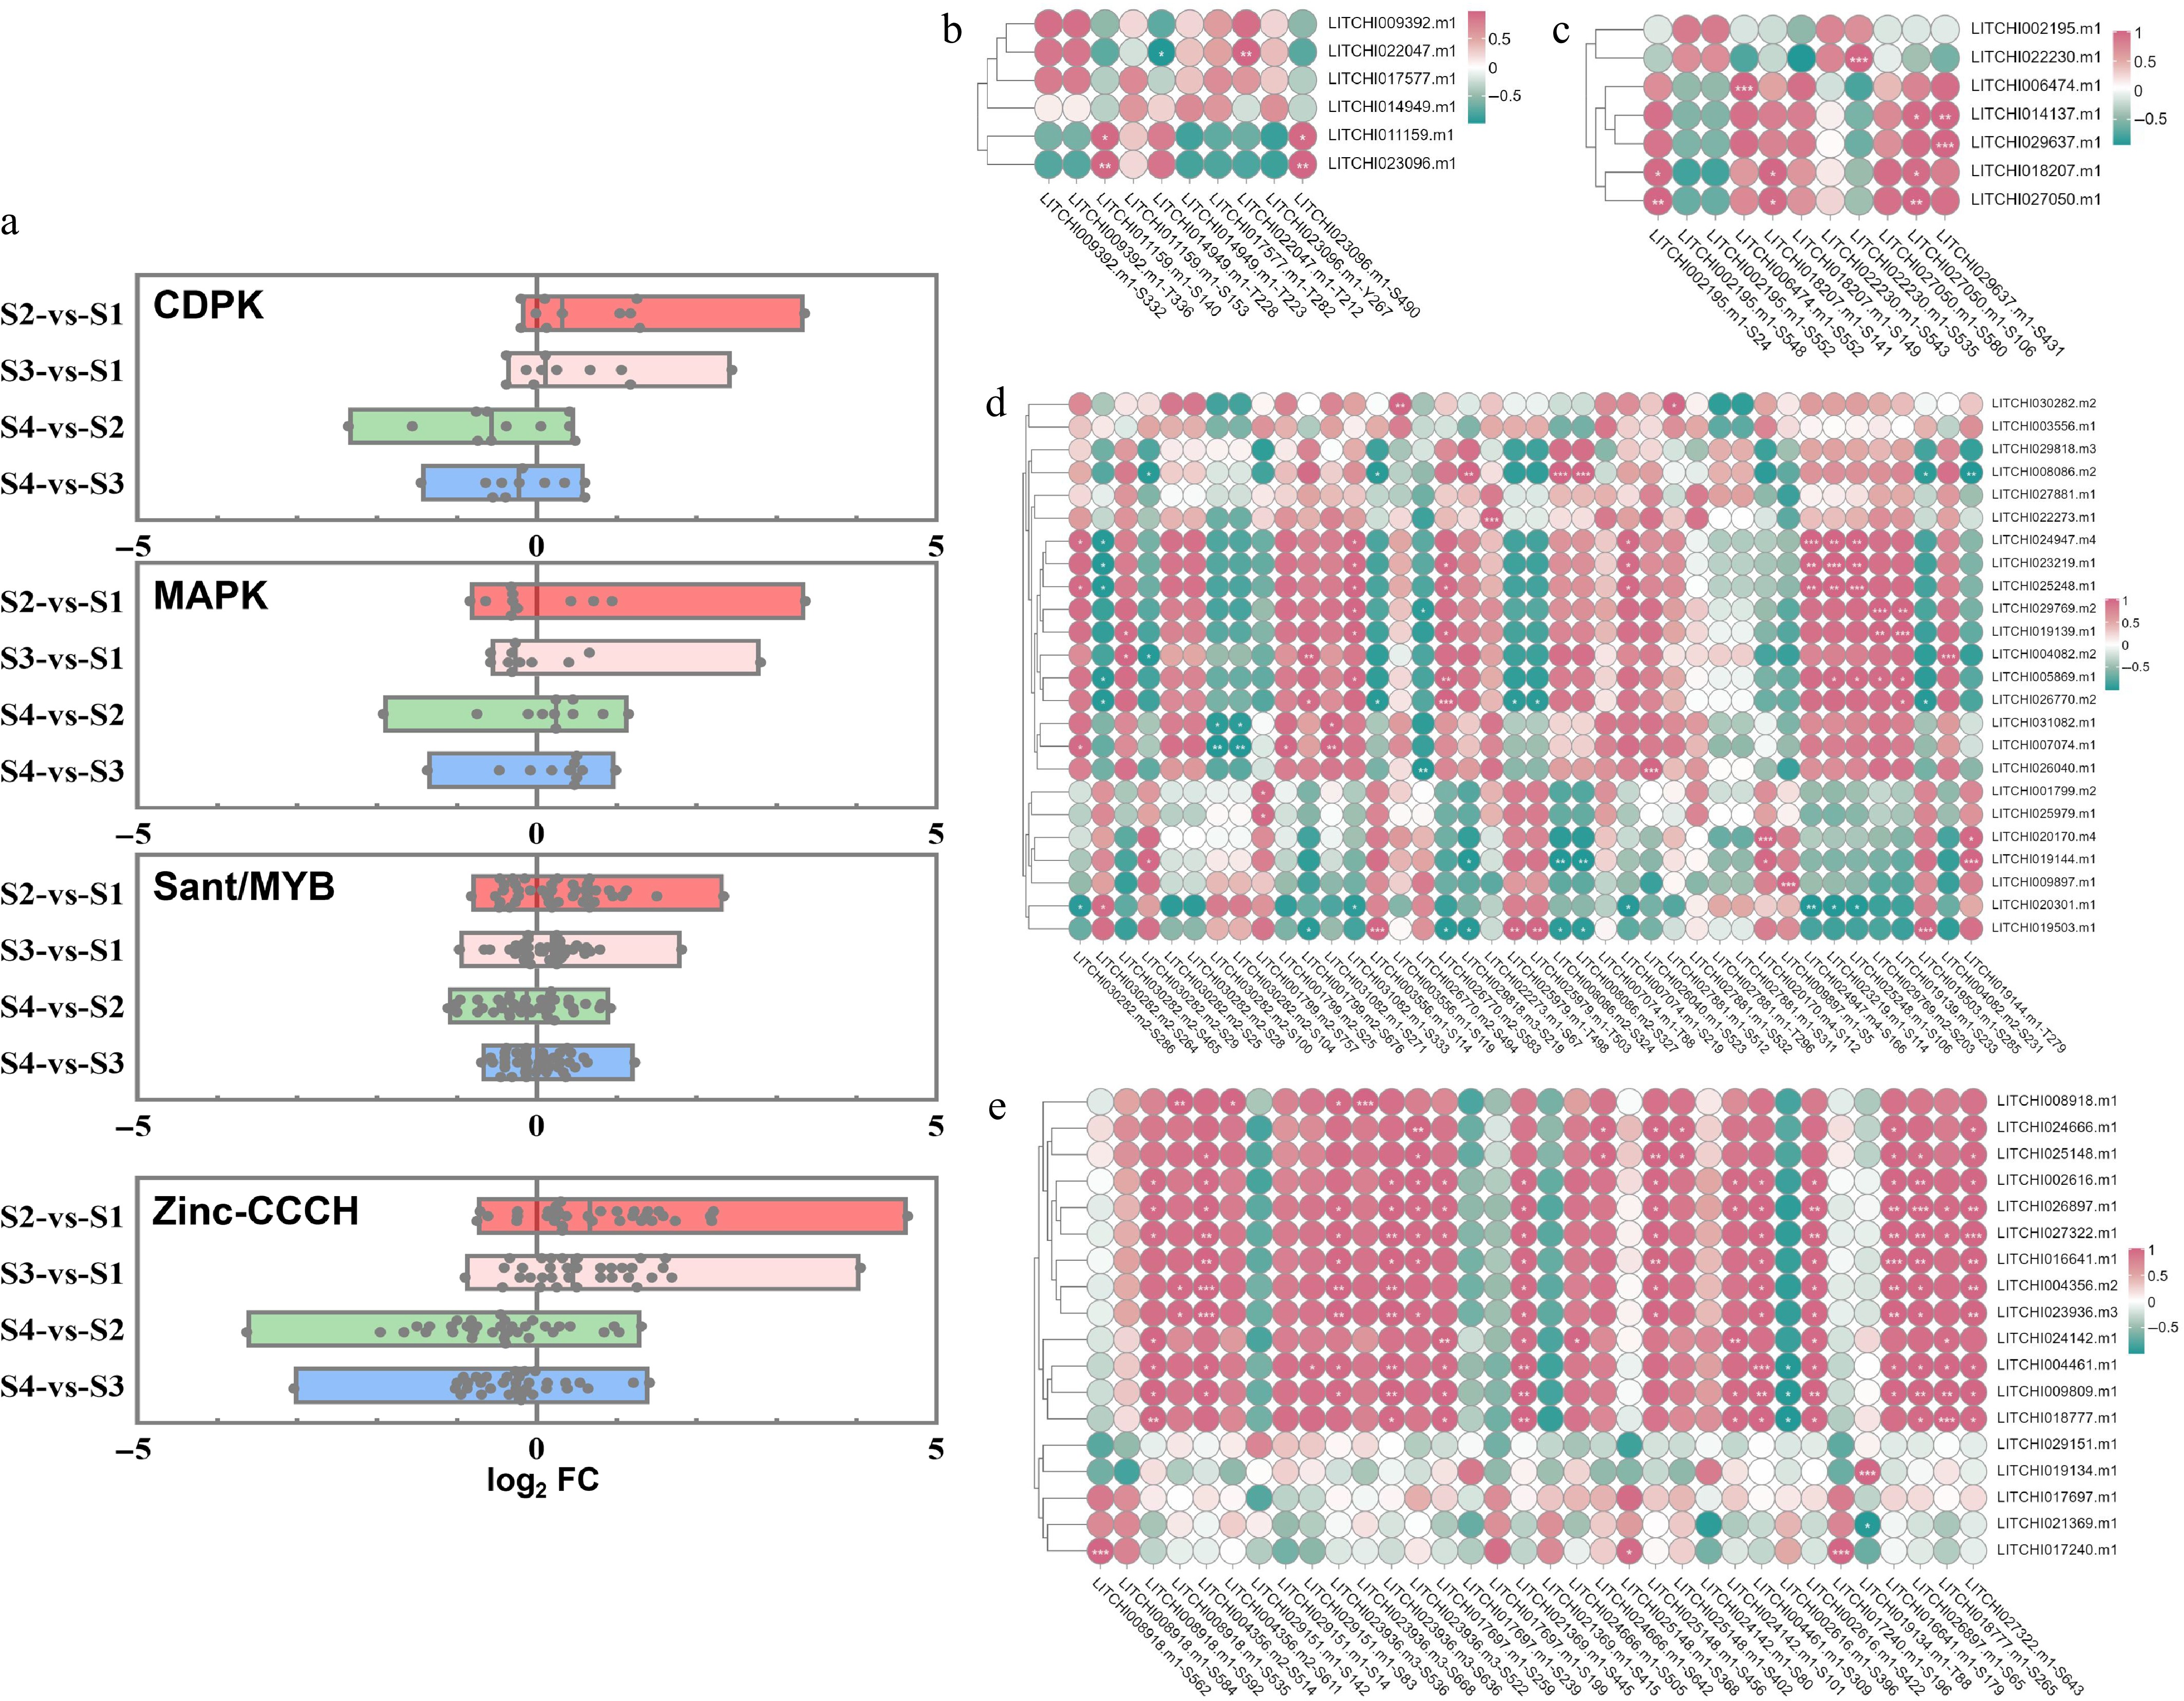
Figure 7.
Correlation analysis between the abundance and phosphorylation modification levels of related motifs/sites across different developmental stages of litchi buds. (a) Analysis of phosphorization motifs modification levels of CDPK, MAPK, sant/MYB, and zinc proteins between dormancy and growth stages. A single point represents a motif site on the proteins. The vertical axis represents the combination names for comparison, while the horizontal axis denotes log2FC, FC: the fold change in expression abundance of phosphorylation motif/site on DRPs between the two groups represented on the vertical axis. Heatmap of correlation analysis between phosphorylation motifs and their predicted kinases (b) CDPK, (c) MAPK, (d) TF MYB, and (e) zinc. The correlation score was used for heat mapping.
-
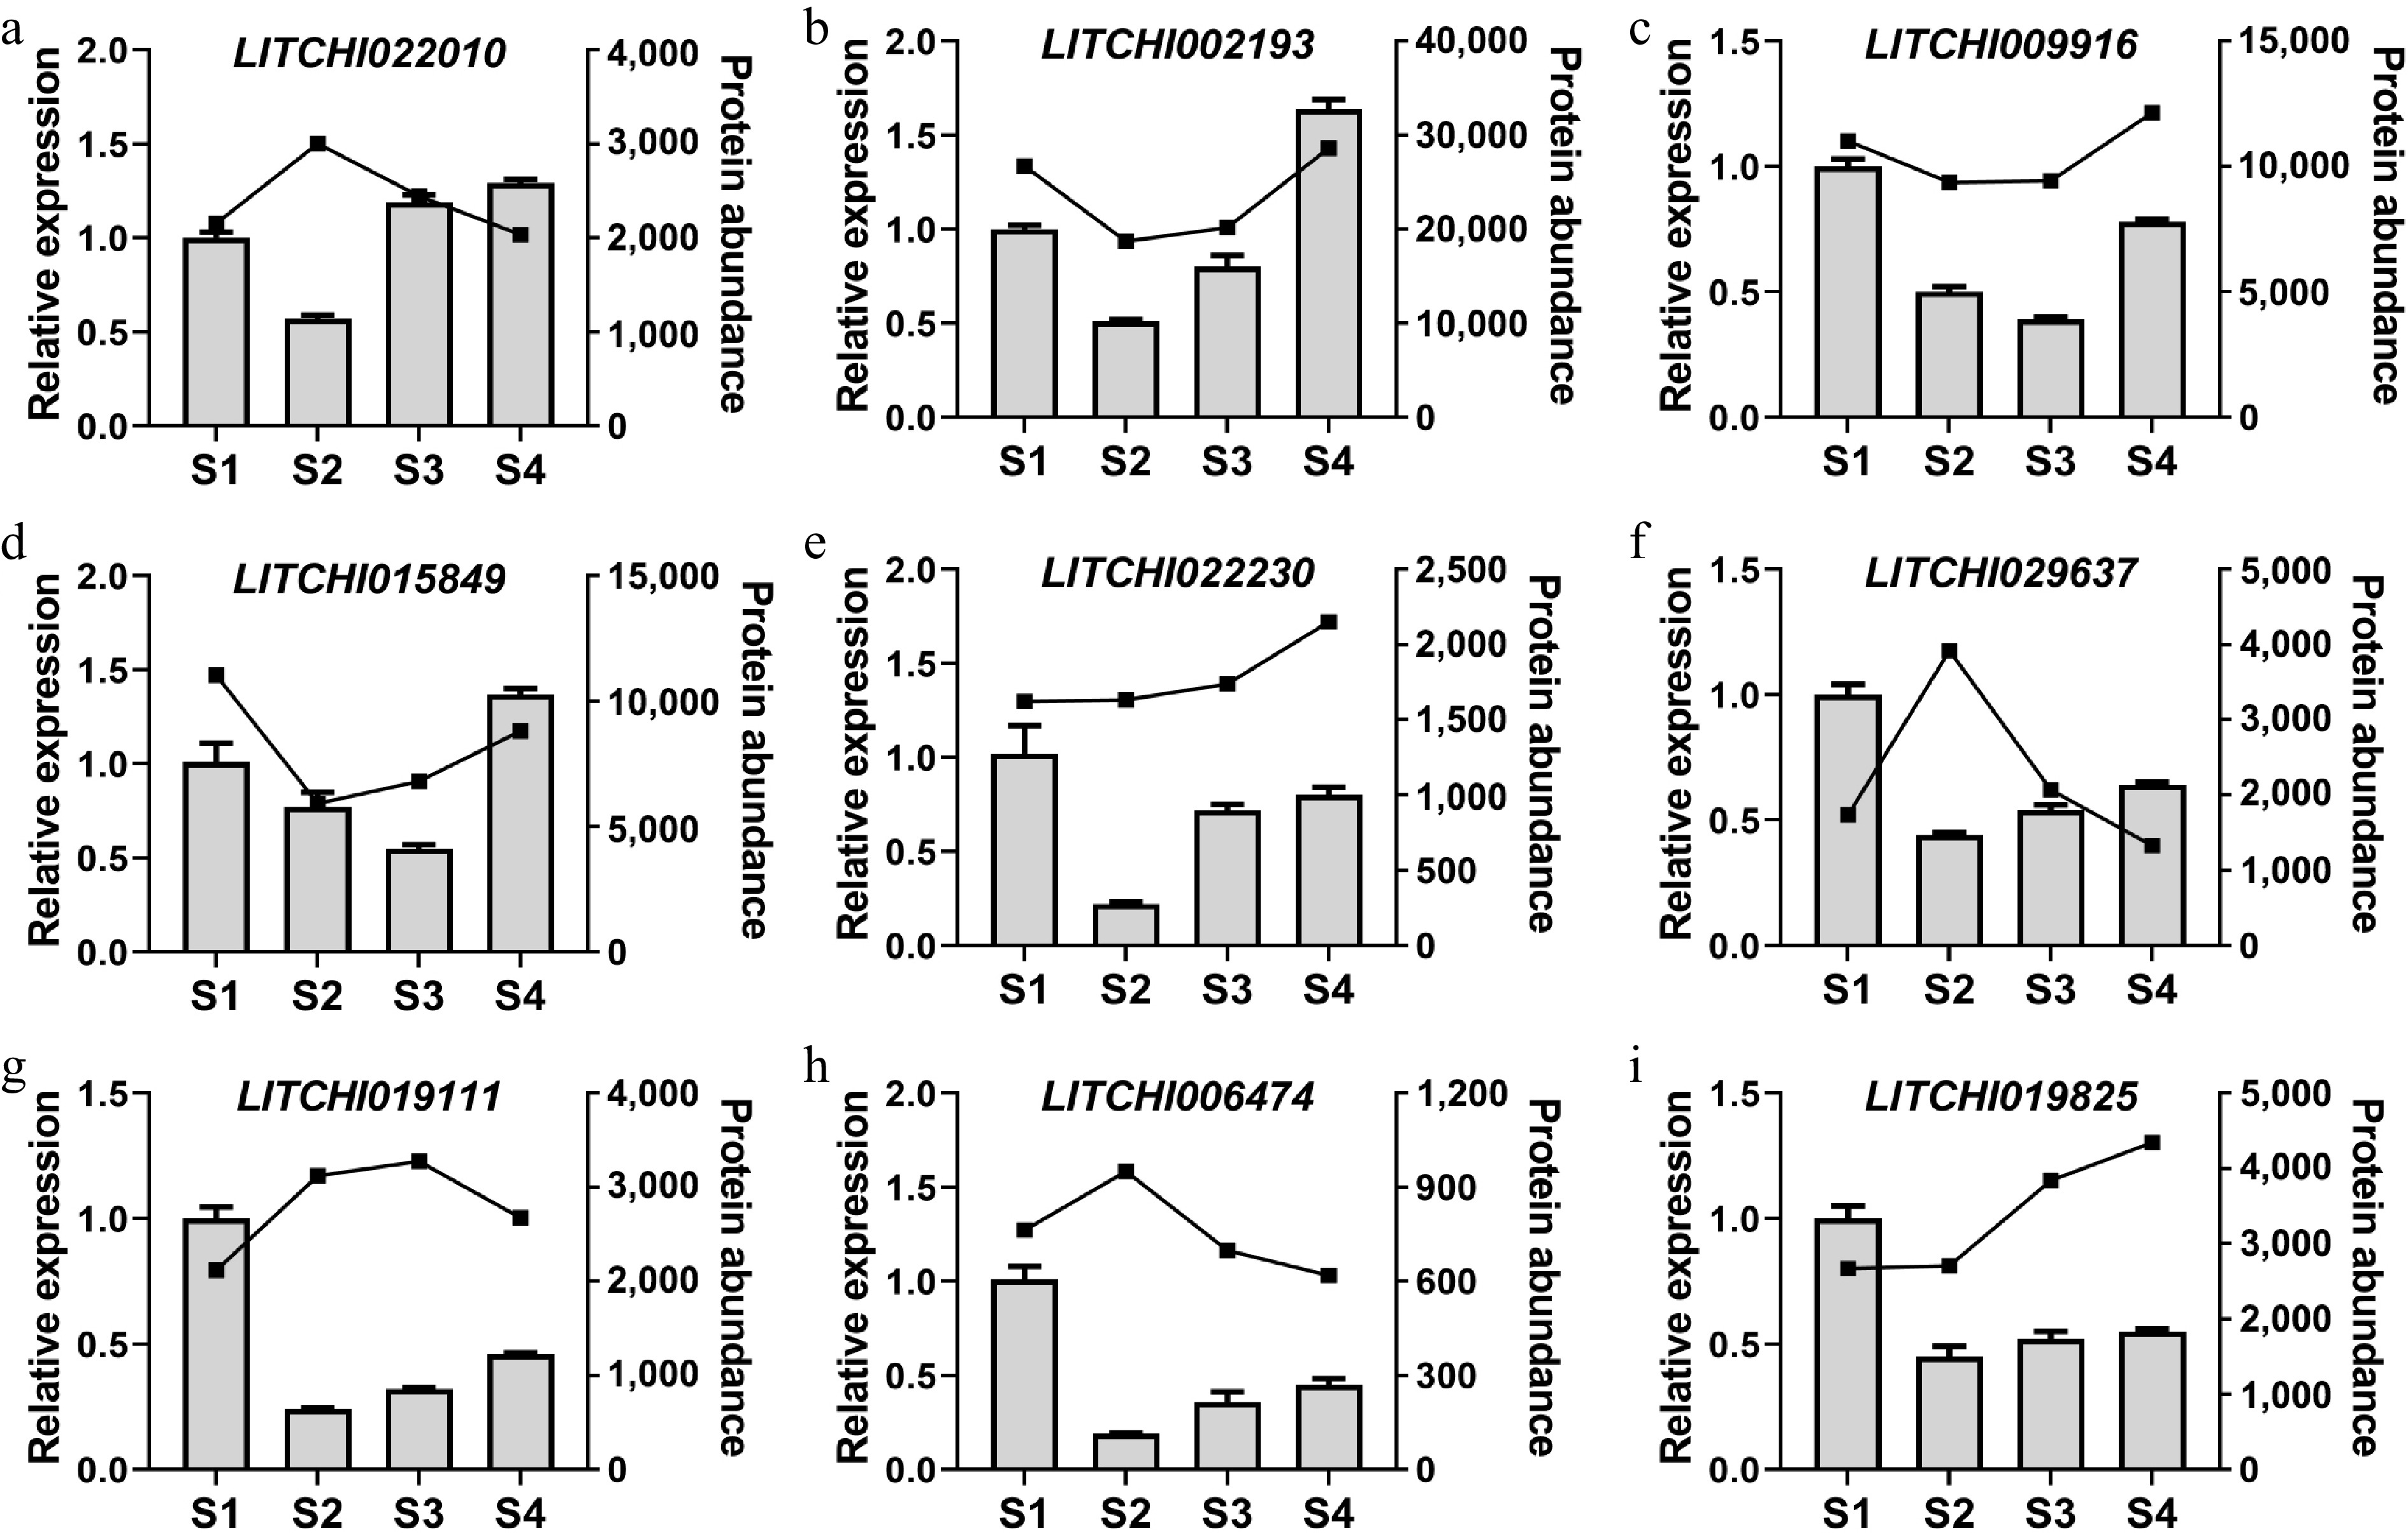
Figure 8.
Analysis of gene expression patterns in litchi buds at different stages. The expression levels of (a) LITCHI022010, (b) LITCHI022010, (c) LITCHI009916, (d) LITCHI015849, (e) LITCHI022230, (f) LITCHI019111, (g) LITCHI029637, (h) LITCHI006474, and (i) LITCHI019825 were measured from S1 to S4. Error bars represent standard error of means (n = 3).
Figures
(8)
Tables
(0)