


-
Litchi (Litchi chinensis), belonging to the Sapindaceae family, is a typical subtropical evergreen fruit known for its high nutritional value, agreeable flavor, and significant commercial value. Throughout its annual growth cycle, the terminal buds of the litchi undergo intermittent growth, alternating between dormancy and active growth. The dormancy onset and removal of the terminal bud not only influences shoot growth rhythm but is also intricately linked to the flowering process, ultimately impacting litchi yield.
Dormancy is a crucial stage in bud development that plants adopt as a survival strategy to cope with harsh seasonal conditions. In temperate deciduous trees, winter dormancy helps them to withstand freezing temperatures[1,2]. Conversely, plants in Mediterranean climates experience summer dormancy to survive the intense heat and drought[3]. Although winter dormancy and summer dormancy share many common characteristics, the complex regulatory mechanisms underlying summer dormancy remain unclear. In tropical and subtropical evergreen plants, intermittent bud dormancy seems to have not evolved for harsh conditions like coldness, heat, and drought, as it may happen even in growth-favorable conditions, and has not yet been comprehensively studied[1,4]. Previous studies have demonstrated that litchi shoot terminal buds exhibit an alternating cyclical growth pattern of 'growth-dormancy', even in a stable, controlled environment. This phenomenon is particularly evident during the summer growth cycle, suggesting that this intermittent summer dormancy mechanism may be governed by an intrinsic rhythm rather than environmental factors[5]. It is worth mentioning that the terminal buds of these species alternate between growth and rest stages more frequently than those of deciduous trees[6]. Many researchers referred to the growth pause between these flushes as 'shoot dormancy'[7], which is also known as 'terminal bud dormancy'[8,9]. However, limited information is available regarding the regulation of bud dormancy in tropical evergreen species.
Studies have shown that the dormancy regulation of buds in plants is influenced by various factors, including temperature, light, and the regulation of associated transcription factors (TFs)[10]. Research indicates that post-translational modifications (PTMs) of proteins are also involved in dormancy regulation in plants, but relevant studies primarily focused on the seed dormancy of annual plants[11−14]. The underlying mechanisms in perennial species remain largely unexplored. Phosphorylation serves as a crucial PTM that influences protein functions across various biological pathways. This modification is both dynamic and reversible, playing a significant role in numerous signaling processes, regulated by the activities of numerous kinases (which facilitate phosphorylation), and phosphatases (which mediate dephosphorylation). It can modulate interactions between proteins, between proteins and membranes, subcellular localization of proteins, and protein stability in response to both external and internal cues[15,16]. A study on tea plants revealed that the genes associated with the oxidative phosphorylation pathway exhibit increased activity during the spring bud break, indicating that PTMs may be involved in the regulation of bud dormancy release in the tea plants[17]. However, this regulatory process has not been thoroughly elucidated.
To understand the phosphorylation mechanism, it is essential to identify the specific residues involved, such as serine (S), threonine (T), or tyrosine (Y), within a phosphopeptide. Various approaches have been proposed to extract phosphorylation motifs from extensive datasets of phosphorylated peptides. For instance, motif-X identifies motifs that are significantly over-represented in large-scale phosphoproteomics studies, thereby providing insights into kinase-substrate specificity[16,18]. The Arabidopsis genome comprises around 1,100 kinases and 100−200 phosphatases, representing about 5% of its total genomic content[19]. These kinases and phosphatases play a crucial role in the modification of protein phosphorylation. The phosphorylation of proteins typically involves more kinases than phosphatases because kinases are essential in responding to a diverse array of internal and external stimuli, whereas phosphatases primarily reverse the actions of kinases[20,21]. Calcium-dependent protein kinases (CDPKs) and mitogen-activated protein kinases (MAPKs) are two crucial types of protein kinases involved in the phosphorylation regulation of plant development. CDPKs are key players in plant signal transduction, regulating development by phosphorylating various substrates, including ion channels, TFs, and metabolic enzymes, which transmit calcium signals that elicit physiological responses[22]. Autophosphorylation also significantly affects the activity of CDPKs/CRKs[23]. Studies in Arabidopsis have indicated that mutations in the Ser residues at positions 228 and 318 of AtCPK28 prevent autophosphorylation and diminish kinase activity[23,24]. This suggests that these two Ser sites are critical for protein phosphorylation modification. MAPKs represent a highly conserved and functionally critical signaling module in eukaryotes, operating downstream of receptors and signal receptors to coordinate cellular responses essential for normal plant growth and development, immune responses, and reactions to abiotic stresses[25]. The MAPK cascade further transmits and amplifies these signals through the phosphorylation of MAPKKKs, MAPKKs, and MAPKs. The activated MAPKs subsequently phosphorylate the downstream substrates, resulting in alterations in cellular physiological activities[25]. Research on bananas has demonstrated that MaMPK14 plays a role in regulating banana ripening by directly interacting with MaMYB4 and phosphorylating MaMYB4 at the Ser160 residue[26]. Additionally, studies indicate that TFs such as sant/MYB, and zinc-finger proteins can regulate plant development through phosphorylation[27,28]. The zinc-finger protein RZFP34/CHYR1 has been reported to influence stomatal movement and drought resistance in Arabidopsis via SnRK2.6-mediated phosphorylation[27]. These findings suggest that protein phosphorylation modifications involving kinases are essential for the regulation of plant developmental processes.
Recently, phosphoproteomics has gained traction in studying PTM regulation of plant development[29]. Phosphoproteomics stands out as a powerful approach for investigating the extensive dynamics of phosphorylation events and PTMs[30,31]. While recent research has predominantly focused on rice and Arabidopsis, there remains a gap in studies concerning perennial woody fruit trees. In this study, we conducted an extensive analysis of the phosphoproteome at various developmental stages of the litchi terminal bud. Our primary objective was to gather information on the changes in protein phosphorylation during different bud development, especially during dormancy onset and removal. To the best of our knowledge, this research represents the first systematic exploration of the phosphoproteome relating to bud dormancy in litchi. The findings will illuminate the dormancy mechanisms of terminal buds in evergreen fruit trees and lay a theoretical foundation for understanding the regulatory mechanisms that govern the growth patterns of litchi shoots.
-
'Feizixiao' litchi trees were used in this study, which were cultivated in the litchi orchard at the South China Agricultural University in Guangzhou, Guangdong Province, China. In August 2022, terminal buds at the dormant stage (S1), bud-breaking stage (S2), rapid growth stage (S3), and growth cessation stage (S4) were collected. The bud status for these four stages was determined based on a previous study[32]. Three biological replicates were obtained for each growth stage, with each replicate comprising approximately 50 buds. The buds sampled were rapidly frozen in liquid nitrogen for total protein extraction.
Extraction of total protein
-
The extraction of total protein was performed following a previously reported method[33]. The samples were ground into a powder in liquid nitrogen, and an appropriate amount of protein lysis buffer (100 mM ammonium bicarbonate, 8 M urea, 0.2% SDS, and phosphatase inhibitor, pH = 8) was quickly added. The mixture was vortexed thoroughly and sonicated on ice for 5 min to ensure complete lysis of the sample. Subsequently, the mixture was centrifuged at 12,000 g for 15 min at 4 °C. The supernatant was collected, and 10 mM DTT was added. The solution was incubated at 56 °C for 1 h, followed by the addition of iodoacetamide and incubation at 25 °C in the dark for 1 h. Pre-cooled acetone was then added, and the mixture was precipitated at −20 °C for 2 h before centrifugation to collect the precipitate. Finally, the protein precipitate was dissolved in 6 M urea, 100 mM TEAB, phosphatase inhibitor, pH 8.5, resulting in the total protein solution.
Protein quality test
-
The concentration and quality of the extracted total protein were determined using the Bradford protein assay method[34,35]. A BSA standard protein solution was used to create a standard curve. The samples and standard protein solutions were added to a 96-well microplate, followed by the addition of 180 µL of G250 dye. The plate was incubated at room temperature for 5 min, and then the absorbance at 595 nm was measured, with each sample being repeated three times. A standard curve was constructed using the absorbance values of the standard protein solutions to calculate the protein concentration of the test samples. Approximately 15 µL of the protein samples were used for SDS-PAGE using a 12% gel, with electrophoresis carried out at 180 V for 60 min. After electrophoresis, the gel was stained with Coomassie Brilliant Blue R-250 at room temperature for 30 min, followed by destaining until the bands were visible.
Mass spectrometry analysis
-
In this study, liquid chromatography-tandem mass spectrometry (LC-MS/MS) was employed[36], and the specific operational procedure is illustrated in Supplementary Fig. S1. Mobile phases were prepared with mobile phase A being 0.1% formic acid dissolved in pure water, and mobile phase B consisting of 80% acetonitrile, and 0.1% formic acid. The lyophilized powder was reconstituted in 10 μL of solution A and centrifuged at 10,000 g for 5 min at room temperature. A 1 μg aliquot of the supernatant was used for analysis. Shotgun proteomics was conducted using an EASY-nLCTM 1200 UHPLC system (Thermo Fisher) coupled with a Q Exactive HF-X mass spectrometer (Thermo Fisher) operating in data-dependent acquisition (DDA) mode. A 1 μg sample was injected into a custom-made C18 Nano-Trap column (2 cm × 75 μm, 3 μm). Peptides were separated using a home-made analytical column (15 cm × 150 μm, 1.9 μm) through a linear gradient elution. The resulting peptides were analyzed by the Q Exactive HF-X, equipped with a Nanospray Flex™ (ESI) ion source, a spray voltage of 2.3 kV, and an ion transport capillary temperature of 320 °C. The full scan was conducted over a range of m/z 350 to 1500 with a resolution of 60,000 (at m/z 200), targeting an automatic gain control (AGC) value of 3 × 10⁶ and a maximum ion injection time of 20 ms. The 40 most abundant precursor ions identified in the full scan were selected for fragmentation via higher energy collisional dissociation (HCD) and analyzed in MS/MS mode, with a resolution of 45,000 (at m/z 200), an AGC target value of 5 × 10⁴, and a maximum ion injection time of 54 ms. The normalized collision energy was set to 32%, the intensity threshold was 10,000, and the dynamic exclusion duration was 20 s.
Bioinformatics and statistics
-
Bioinformatics and statistical evaluations were primarily conducted using Perseus[37]. A p-value of less than 0.05 from ANOVA and a fold change of 1.5 served as the criteria for identifying differentially expressed proteins or phosphosites. Gene Ontology (GO) analysis was carried out with DAVID[38], employing a significance threshold of p < 0.05 for enrichment. Pathway analysis utilized KEGG[39,40].
Motif analysis and analysis of kinase-substrate relationships
-
To discover motifs that are enriched in a collection of phosphosites, we employed the motif-x algorithm[41]. The analysis focused on seven residues surrounding the central residue, considering only those with occurrences greater than 20 and a p-value of less than 10−6. The motif illustrations were generated using WebLogo[42]. To infer kinase-substrate interactions, we evaluated all identified phosphorylation sites on S, T, and Y with the NetPhorest algorithm[43].
-
In the phosphoproteomic analysis of total protein extracted from litchi buds at different development stages (S1−S4) (Fig. 1a), we identified 7,835 modified peptide segments and a total of 8,750 modification sites. After removing duplicates, we identified 6,785 unique modification sites, which correspond to a total of 2,795 modified proteins (Fig. 1b). The quality of the samples of the S1 to S4 stages was assessed using principal component analysis (PCA), revealing that biological replicates at each stage clustered closely together and remained distinct from the other samples of the other stages, indicating high sample quality and good reproducibility (Fig. 1c). Among these stages, S2 and S3, which correspond to the bud break and growth stages, respectively, are particularly close. Therefore, this study focuses on the differences in protein phosphorylation between the dormancy stage (S1 or S4), and the bud break or growth stages.
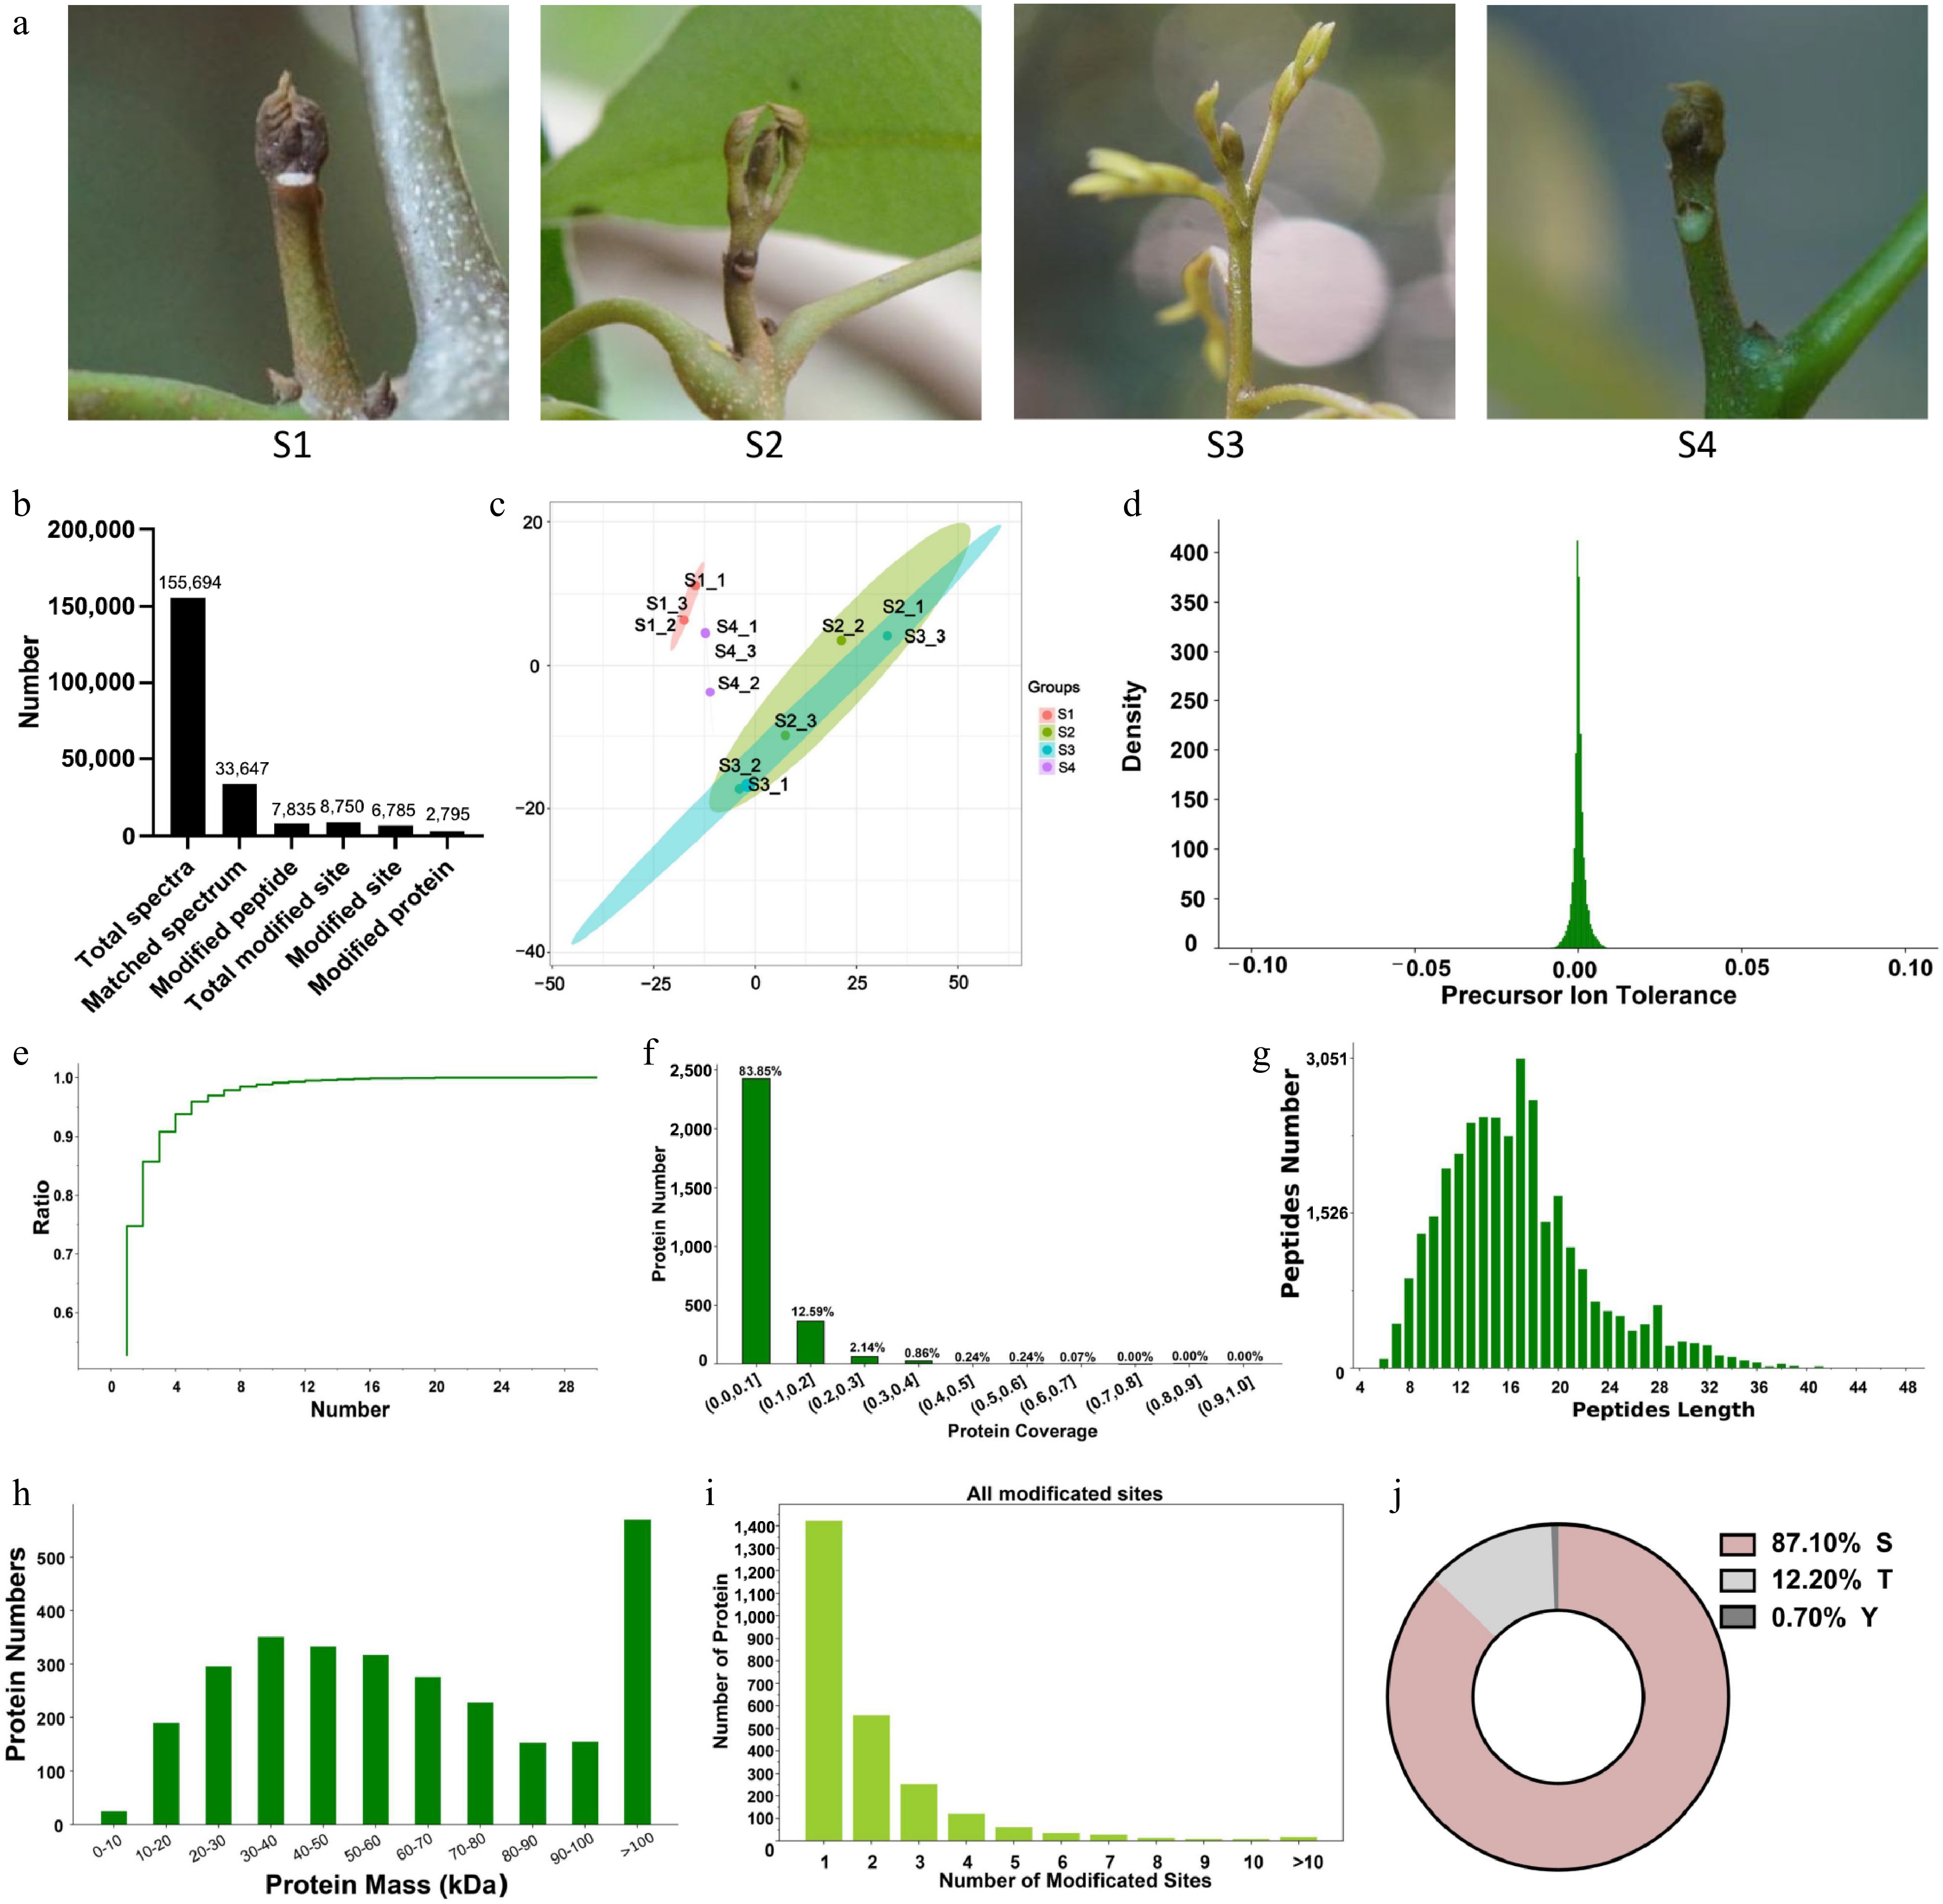
Figure 1.
Characterization and identification of differentially regulated phosphoproteins (DRPs) in litchi buds. (a) Litchi terminal buds at different developmental stages. S1: Stage 1, represents the dormancy stage; S2: Stage 2, represents the bud breaking stage; S3: Stage 3, represents the rapid growth stage; S4: Stage 4, represents the growth arrest stage prior to reentry of dormancy. (b) The number of different types of proteins identified from different developmental stages of litchi buds using phosphoproteomics. (c) Principal Component Analysis of phosphopeptides of biological triplicates of three cell types to depict variability between the groups. (d) Mass tolerance distribution of parent ions. (e) Unique peptide segment curve analysis. (f) Protein coverage distribution. (g) Length distribution of phosphorylated peptides. (h) The distribution of DRPs quantities of different sizes. (i) Distribution of phosphorylation sites per protein.(j) Percentage distribution of the amino acid residues for all detected DRPs.
The quality assessment of mass spectrometry results indicates that the mass tolerance distribution of peptide parent ions is predominantly centered around zero, signifying minimal mass deviation and high-quality mass spectrometry results (Fig. 1d). A slower increase in the unique peptide curve correlates with a greater number of unique peptide segments, suggesting the identification of more reliable proteins (Fig. 1e). Additionally, protein coverage serves as a reflection of the mass spectrometry results; specifically, the data shows that the coverage of most proteins was 83.85%, which confirms the high credibility of the mass spectrometry findings (Fig. 1f). Analysis of the peptide segments within the phosphoproteome revealed that the lengths of peptide segments in litchi bud predominantly ranged from 6 to 36 amino acids, with those ranging from 12 to 20 amino acids constituting more than half of the total (Fig. 1g). The proteins identified in the terminal buds of litchi exhibited relative molecular weights ranging from 0 to 100 kDa, with the highest quantity of proteins exceeding 100 kDa, followed by those in the 30−40 kDa range, while the lowest number of proteins was found within the 0−10 kDa category (Fig. 1h).
In addition, we analyzed the phosphorylation modification sites within the phosphoproteome and discovered that over half of the 2,795 modified proteins exhibited monophosphate modifications. Some proteins even contained multiple phosphorylation sites, as illustrated in Fig. 1i. Among the 6,785 phosphorylation sites, the S site was the most frequently modified residue, accounting for 87.1% of occurrences, followed by T (12.2%), and Y (3%) (Fig. 1j). Furthermore, from the 7,835 modified peptide segments, 34 significantly conserved motifs, comprising 31 phosphorylated S sites and three phosphorylated T sites were identified (Supplementary Fig. S2).
Differentially regulated phosphoproteins (DRPs) in litchi buds at different developmental stages
-
A total of 2,764 proteins with varying abundances were identified across the four different growth stages of litchi terminal buds. Further analysis revealed that the number of DRPs between the growth stages (S2 and S3) and the bud dormancy stages (S1 and S4) (S2 vs S1; S3 vs S1; S2 vs S4; S3 vs S4) was greater than that observed between the adjacent stages (S3 vs S2; S4 vs S1) (Fig. 2a−f, Supplementary Table S1). According to the volcano plot of the phosphoproteins, there were significantly more upregulated phosphoproteins in S2 compared to dormancy periods S1 and S4 (Supplementary Table S1). These findings suggest that the abundance of numerous proteins markedly increases when litchi buds enter the growth stage (Fig. 2a−f, Supplementary Table S1). Subsequently, we designated the bud dormancy stages S1 and S4 as the reference for screening, applying a significance threshold of p < 0.05 and a fold change of 1.5 (Fig. 2g). Our analysis revealed 253 upregulated DRPs and 239 downregulated DRPs in S2 vs S1; In S3 vs S1, there were 147 upregulated and 137 downregulated DRPs; in S2 vs S4, 183 DRPs were upregulated while 191 were downregulated; In S3 vs S4, there were 87 upregulated and 99 downregulated DRPs (Fig. 2g, Supplementary Table S1). The identified DRPs were further equated in pairwise comparisons with a Venn diagram. Among the upregulated DRPs identified in the comparisons of S2 vs S1 and S3 vs S1, there were 86 overlapping DRPs. Similarly, 97 DRPs were found to overlap among the downregulated DRPs in the same comparisons (Fig. 2h). Conversely, in the comparisons of S2 vs S4 and S3 vs S4, there were 43 overlapping DRPs within the upregulated DRPs, while the downregulated DRPs shared a total of 66 proteins (Fig. 2i).
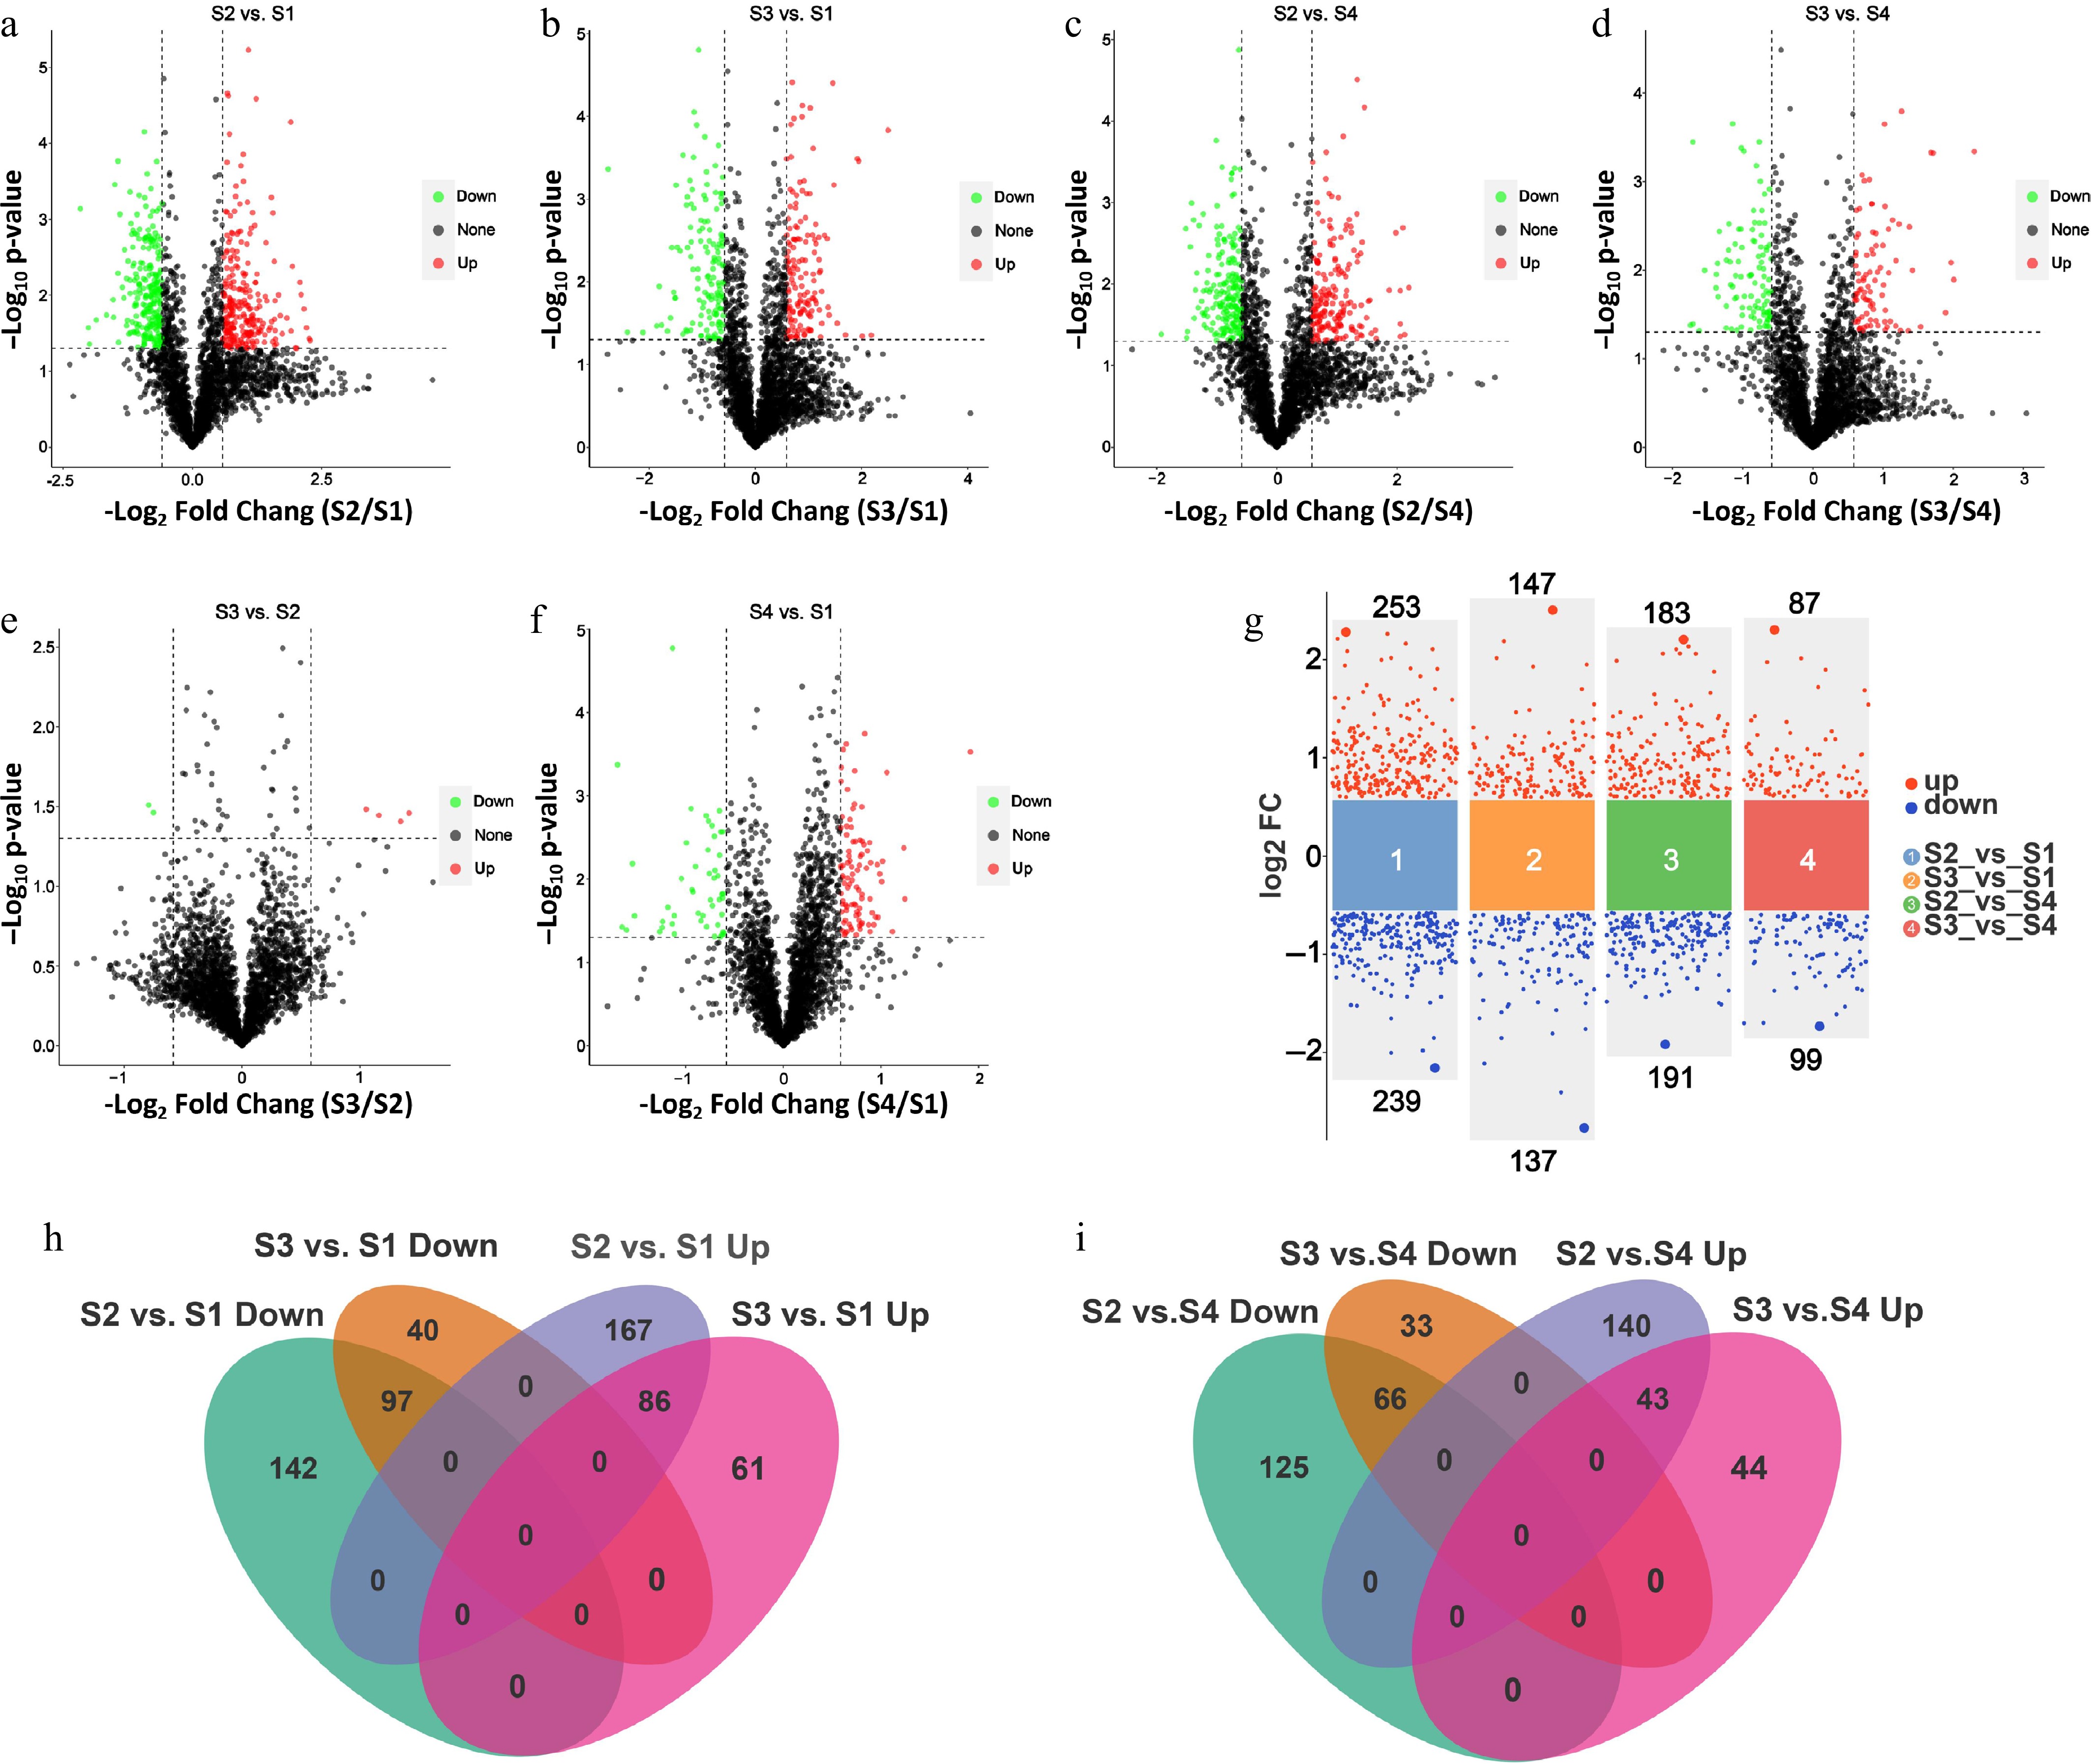
Figure 2.
Differential protein analysis of phosphoproteome in litchi buds at different developmental stages. Volcano plots show the indicated numbers of upregulated and downregulated phosphosites in (a) S2 vs S1, (b) S3 vs S1, (c) S2 vs S4, (d) S3 vs S4, (e) S3 vs S2, and (f) S4 vs S1. (g) Volcano plots show the numbers of upregulated and downregulated phosphosites in S2 vs. S1, S3 vs S1, S2 vs S4, and S3 vs S4 base on log2FC (the significance threshold of p < 0.05 and the FC of 1.5). FC, folds of change. (h) Venn diagrams showing the number of overlapping DRPs from S3 vs S1 and S2 vs S1 pairwise comparisons. (i) Venn diagrams showing the number of overlapping DRPs from S2 vs S4 and S3 vs S4 pairwise comparisons.
Composition and functional analysis of DRPs in litchi buds at different developmental stages
-
To elucidate the functional characteristics of DRPs, we conducted analyses of biological processes (BP), molecular functions (MF), and cellular components (CC) for the DRPs. The results revealed that protein phosphorylation constituted the highest proportion of BP at 36.93%, followed by proteins involved in oxidation-reduction processes and transmembrane transport, which accounted for 15.33% and 10.37%, respectively (Fig. 3a). The DRPs identified in the MF analysis primarily serve functions of protein binding (26.04%), ATPase binding (22.71%), and protein kinase activity (14.14%) (Fig. 3b). The results of the cellular component analysis revealed that these proteins were localized in the cell membrane, nucleus, and structures associated with the integral components of the membrane (Fig. 3c). The results of the KEGG pathway analysis indicated that proteins associated with metabolic processes constituted 50.77% of the total proteins (Fig. 3d). This group included proteins involved in nucleotide metabolism, terpenoid and ketone metabolism, amino acid and vitamin metabolism, as well as carbohydrate metabolism (Fig. 3e). In the functional classification of Clusters of Orthologous Groups (COG), the largest number of proteins identified were those associated with signal transduction mechanisms, totaling 207 proteins. Additionally, other proteins were significantly involved in ribosome processing, transport, and metabolism of carbohydrates, lipids, and secondary metabolites, as well as translation, PTMs, and organelle transport (Fig. 3f). The results of the InterPro (IPR) protein functional annotation predict that the majority of these DRPs' domains exhibit phosphate kinase function, along with proteins containing S/T kinase catalytic domains and RNA recognition motif domains (Fig. 3g).
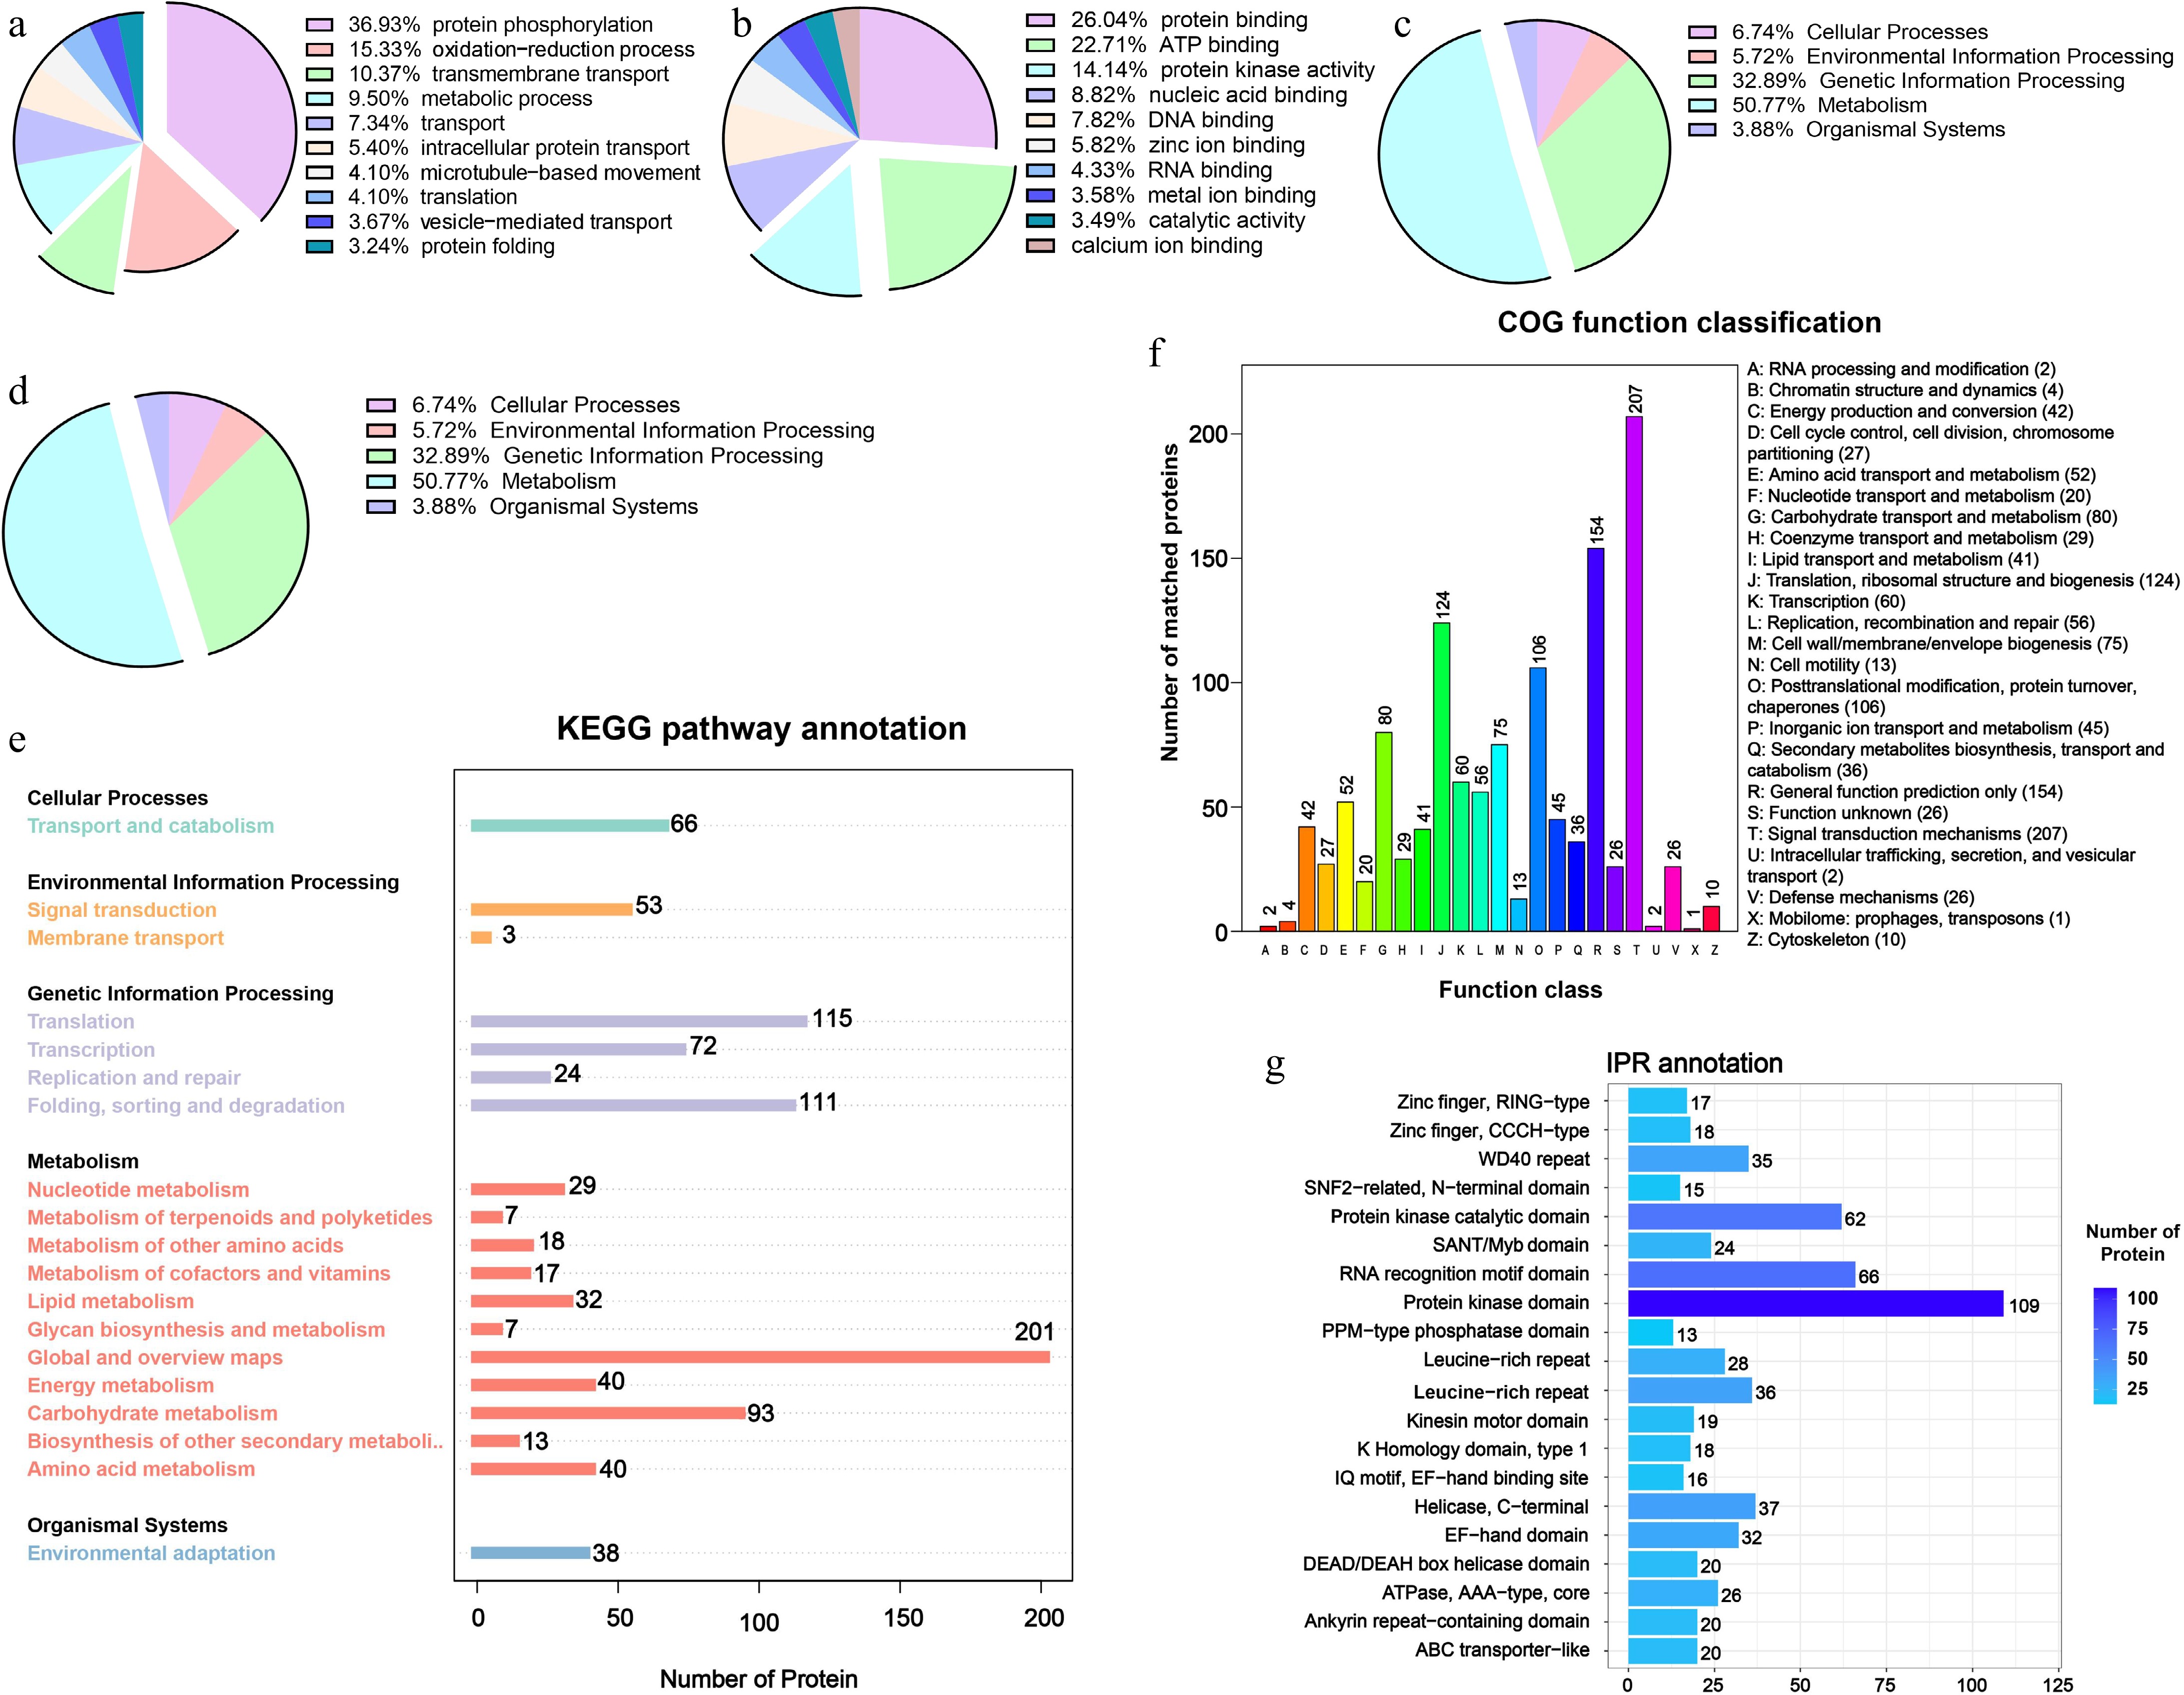
Figure 3.
Functional characterization of DRPs with significant changes in phosphorylation during litchi bud development. GO enrichment analysis of the DRPs identified in this study. Based on GO slim terms all DRPs were assigned to (a) BP, (b) MF, and (c) CC GO categories. BP, biological process; MF, molecular function; CC, cellular component. (d), (e) KEGG pathway analysis of DRPs identified. (f) Clusters of Orthologous Groups functional classification of DRPs. (g) InterPro annotation of DRPs.
Classification of differential expression trends of DRPs at different bud stages
-
Based on the phosphoproteomic analysis of litchi terminal buds at the four stages, the expression trends of phosphorylated proteins could be classified into six patterns (Clusters 1 to 6) (Fig. 4; Supplementary Table S2). The DRPs that were highly expressed during the dormancy period (S1 and S4) and the growth period (S2 and S3) could be further categorized into three distinct clusters, respectively. Cluster 1 consisted of DRPs with high expression levels during the growth period. Cluster 2 included proteins that were highly expressed during the dormant stage (S1), showed decreased expression levels in the S2 and S3 stages, and subsequently increased again in the S4 stage. Cluster 3 contained proteins that were specifically highly expressed during the S2 stage. The expression trend in Cluster 4 was the opposite to that in Cluster 3, displaying low expression during the S2 stage and high expression in the other stages. Cluster 5 represented proteins that were specifically highly expressed during the S4 stage. Finally, Cluster 6 includes proteins that exhibited low expression specifically during the S1 stage.
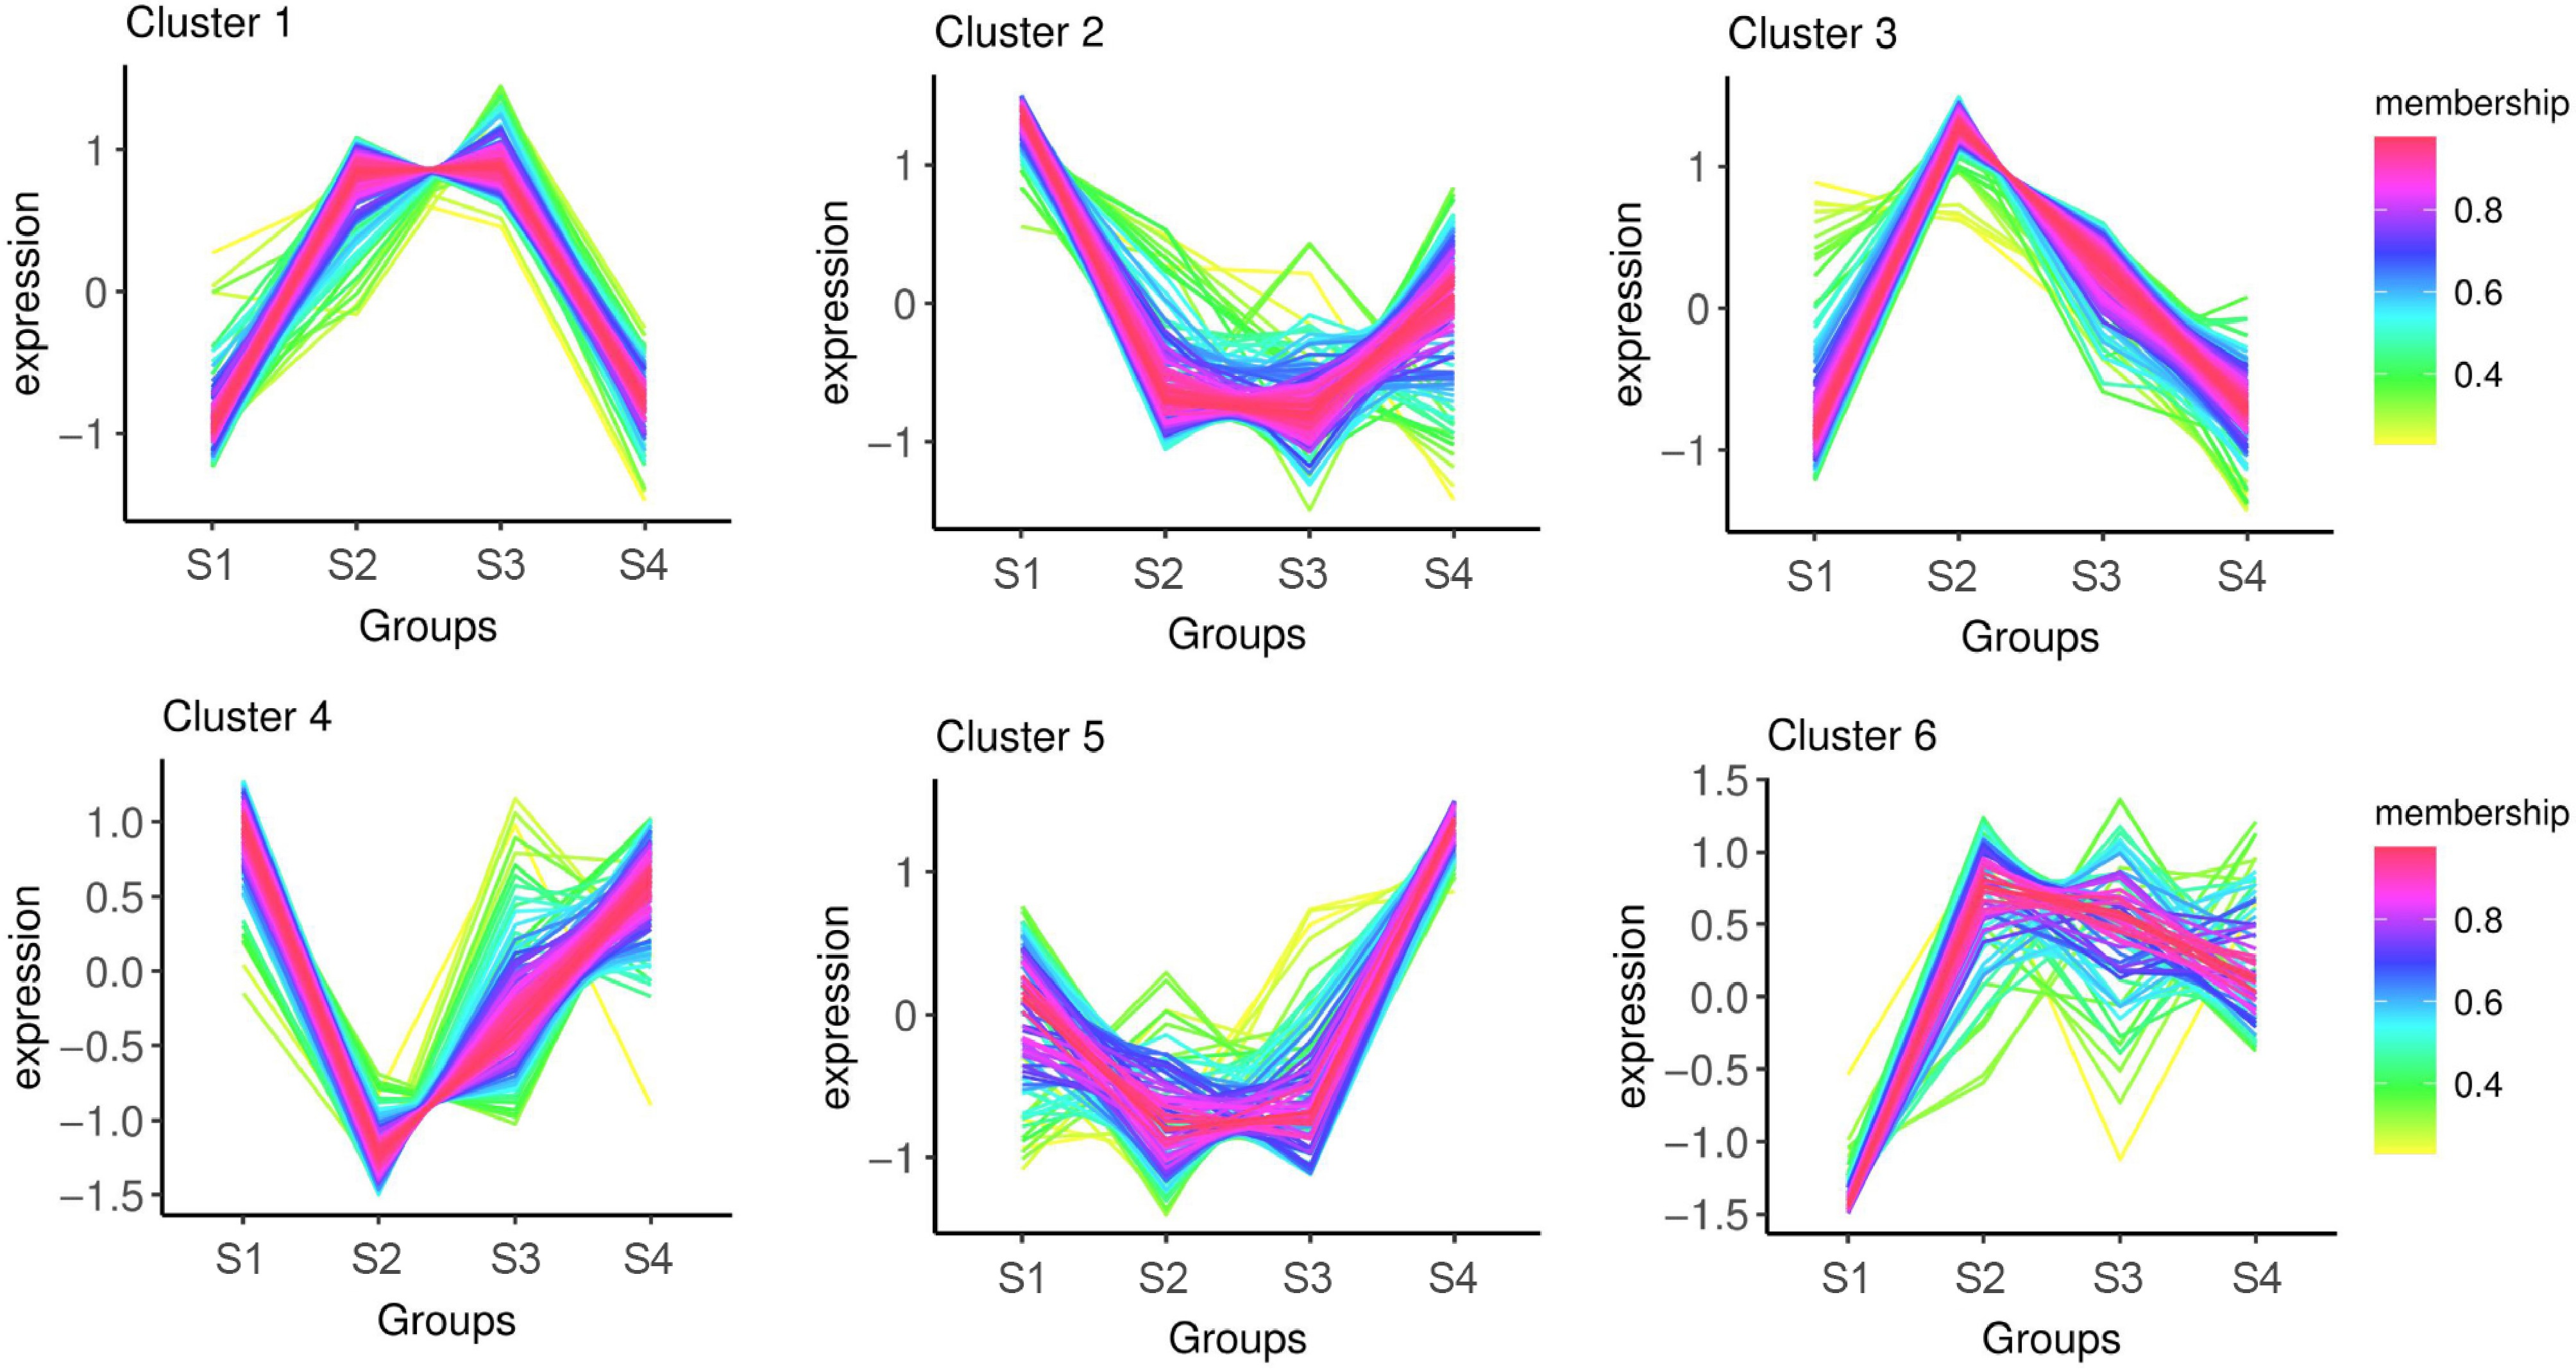
Figure 4.
Cluster analysis of DRPs in phosphoproteome of litchi buds at different developmental stages.
In addition, we focused on several homologous proteins associated with bud dormancy that have been reported in deciduous fruit trees among the DRPs during various developmental stages of litchi terminal buds, such as DAM and hormone-responsive proteins[10]. The heatmap results indicate that the abundance of these proteins varied across the four stages of litchi terminal bud development. Notably, the expression levels of DAM, IAA27, and GAI in the buds were quite high (Supplementary Fig. S3), suggesting that the phosphorylation modifications of these proteins might also play a role in regulating bud dormancy.
KEGG and GO analysis of DRPs in different clusters
-
To achieve a comprehensive understanding of DRPs, KEGG, and GO enrichment analyses were performed. The KEGG analysis revealed that among Cluster 1 DRPs, the pathways of flavonoid biosynthesis, ribosome biogenesis in eukaryotes, and phosphatidylinositol signaling system were significantly enriched (Fig. 5a). The GO enrichment results indicated that the DRPs in Cluster 1 were primarily associated with cellular nitrogen compound metabolism in cells, as well as microtubule-binding related proteins (Fig. 5b). In Cluster 2, the KEGG enrichment results indicated that the DRPs associated with the plant-pathogen interaction were significantly enriched (Fig. 5c). The GO enrichment results indicate that many proteins were membrane proteins, and in terms of function, Cluster 2 proteins were mainly related to ion binding, including some calcium ions and metal ions binding proteins (Fig. 5d). In Cluster 3, numerous DRPs were involved in processes such as endocytosis, as well as the post-translational processing and repair of specific proteins (Supplementary Fig. S4a). The results of the GO enrichment analysis indicate that a significant proportion of these proteins participated in molecular functional regulation (Supplementary Fig. S4b). In the KEGG pathway analysis for Cluster 4, several amino acid metabolic pathways were prominently represented and are also implicated in ubiquitination-mediated protein hydrolysis processes (Supplementary Fig. S4c). Additionally, the GO analysis results suggest that the DRPs within this cluster were associated with protein modification, metabolism, and transport, encompassing multiple metabolic processes (Supplementary Fig. S4d). The DRPs in Cluster 5 were primarily associated with metabolic processes (Supplementary Fig. S4e). In the BP category of GO terms, these DRPs were predominantly engaged in single-organism metabolic activities, as well as the transport of sugars, lipids, and metal ions (Supplementary Fig. S4f). Within the CC category of GO clustering, most proteins were involved in membrane composition and might be linked to transmembrane transport (Supplementary Fig. S4f). In terms of MF, they primarily participated in the transmembrane transport of substances (Supplementary Fig. S4f). In Cluster 6, several proteins were implicated in the spliceosome and mRNA surveillance pathway (Supplementary Fig. S4g). The results of the GO analysis indicate that these proteins were predominantly associated with intracellular components (Supplementary Fig. S4h). These results indicate that the DRPs in litchi terminal buds at various developmental stages were associated with multiple biological regulatory functions. The proteins that were highly expressed during the growth periods (S2 and S3) were predominantly related to ion binding and are involved in various metabolic processes as well as protein modification and transport. Conversely, the proteins that were highly expressed during the dormancy periods (S1 and S4) primarily participated in flavonoid biosynthesis, ribosome biogenesis, and the post-translational processing and repair of specific proteins.
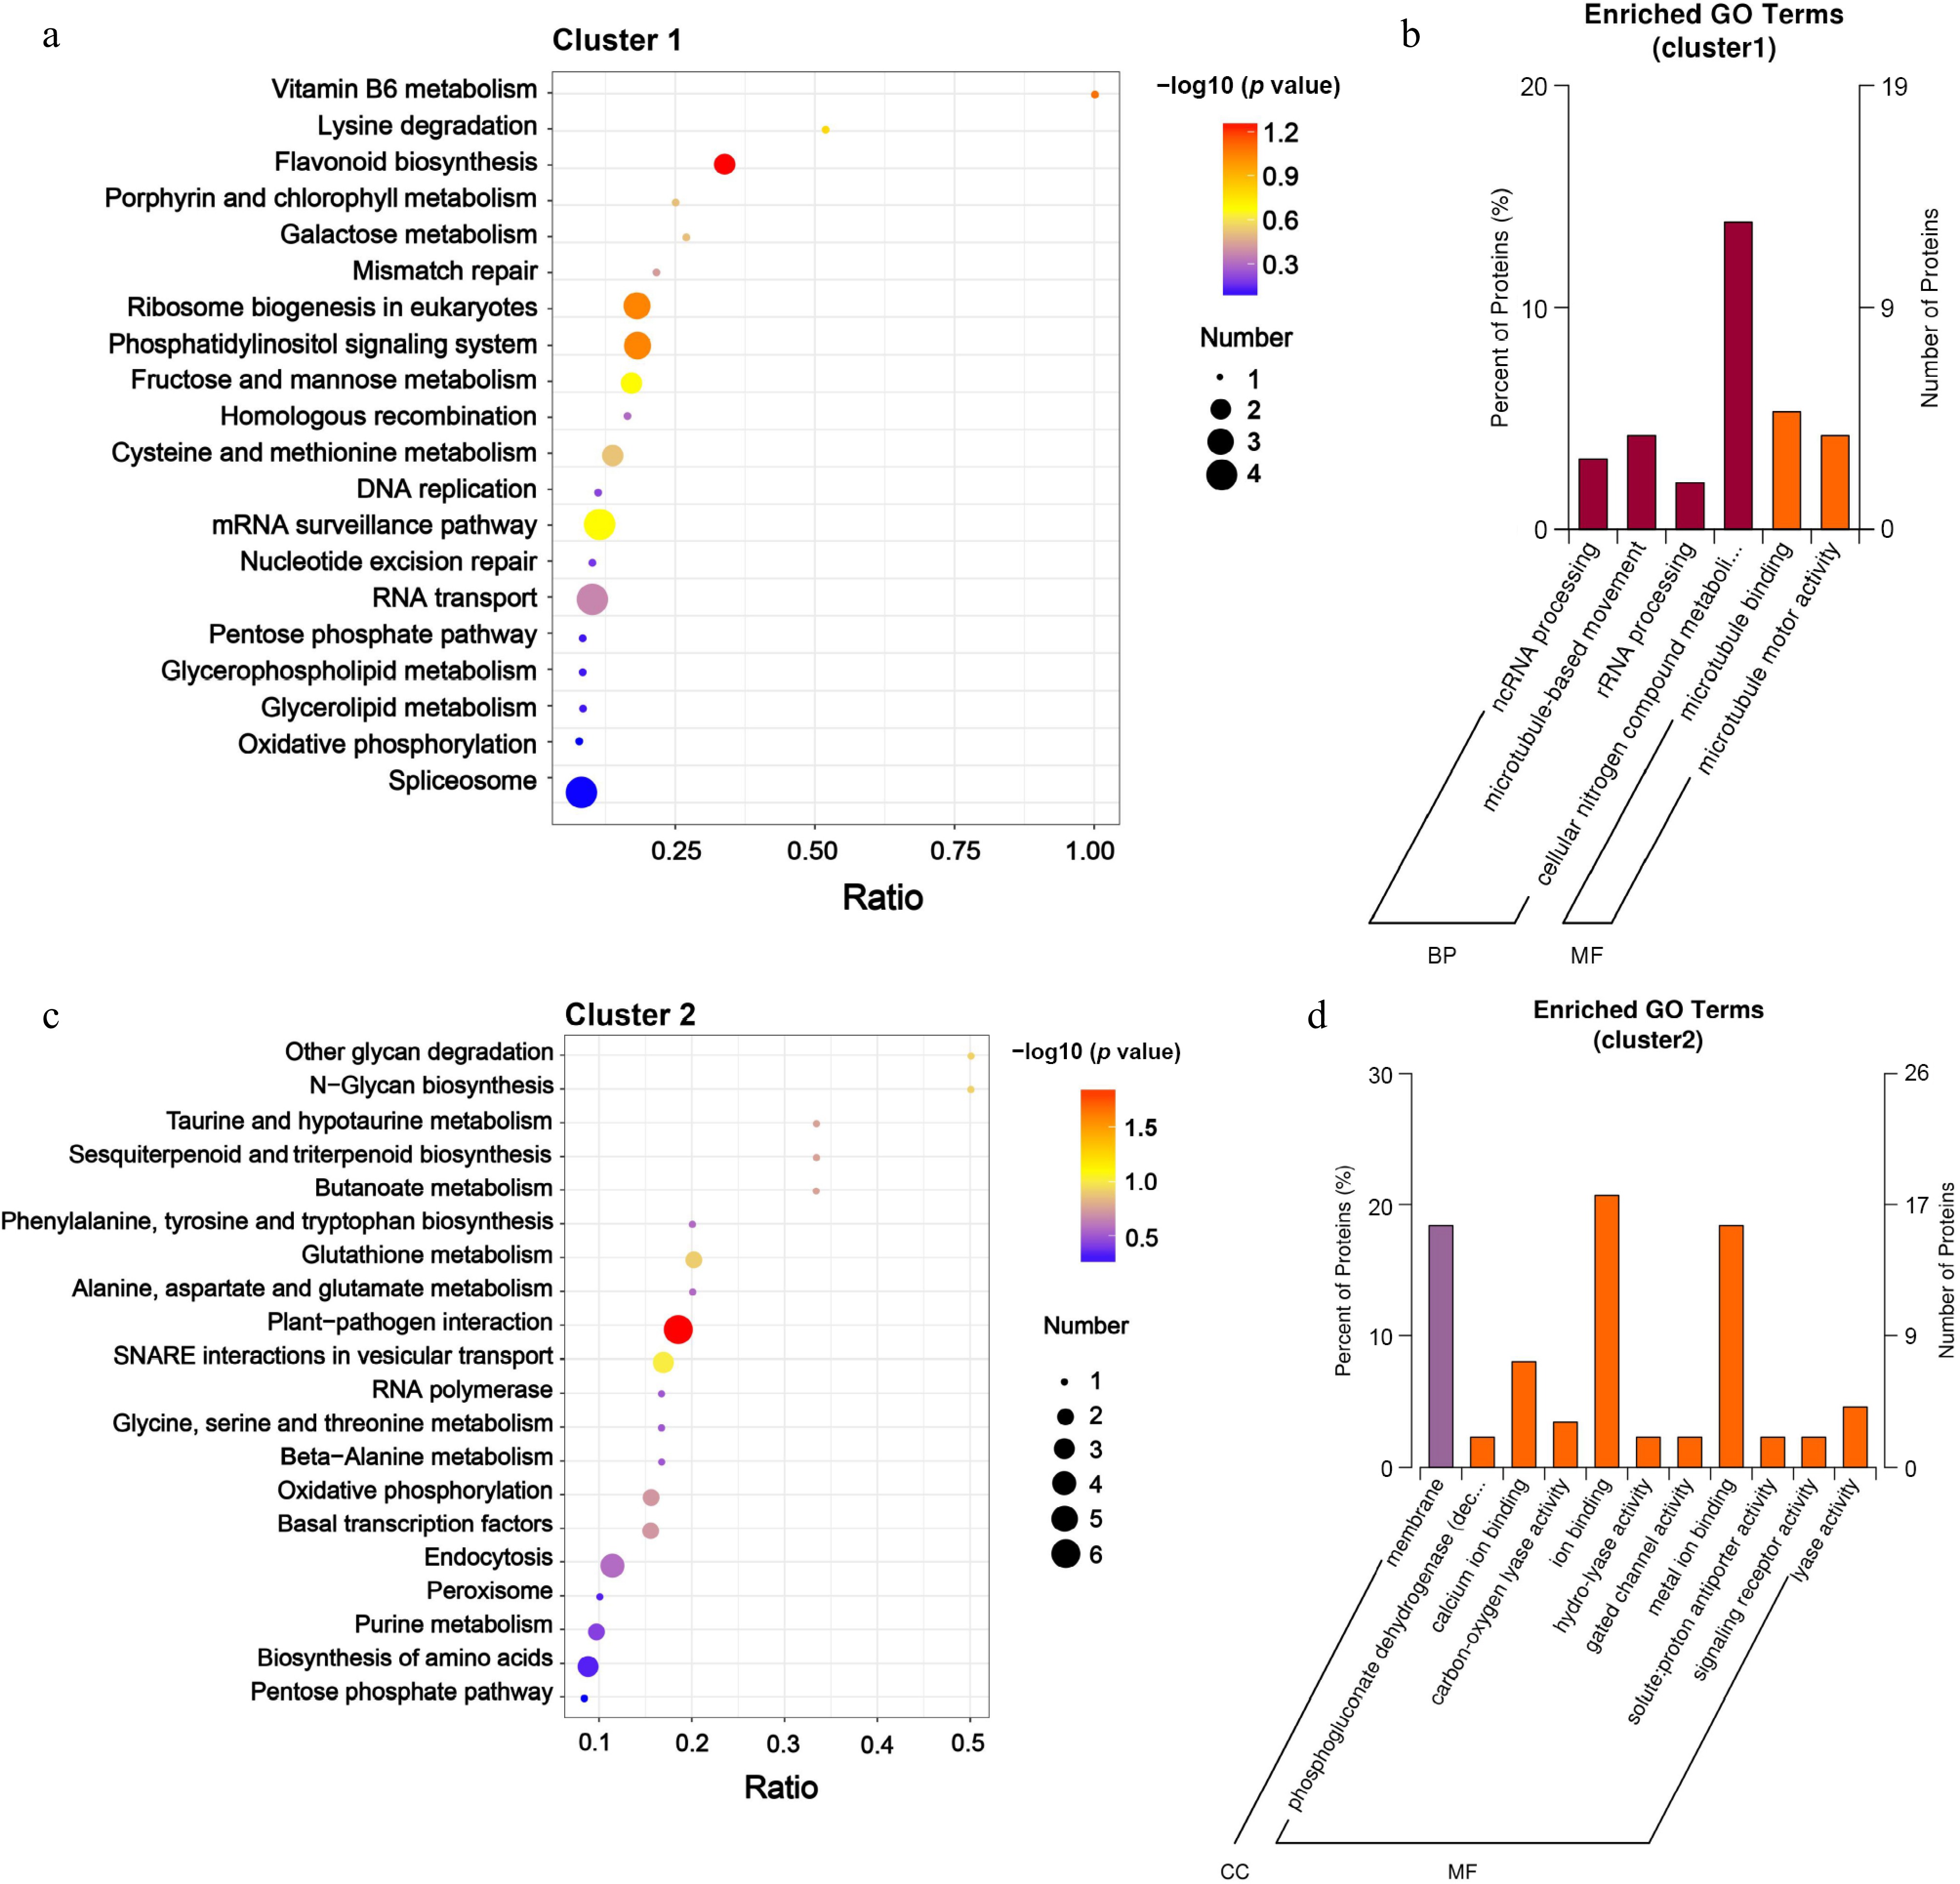
Figure 5.
KEGG analysis and the enrichment of GO categories for DRPs in Clusters 1 and Clusters 2. (a) KEGG analysis, and (b) the enrichment of GO categories for DRPs in Clusters 1 were conducted; (c) KEGG analysis, and (d) the enrichment of GO categories for DRPs in Clusters 2 were conducted. The significantly enriched terms in DRPs (with an adjusted FDR of ≤ 0.05) are presented. The protein ratio indicates the proportion of DRPs associated with a specific GO term (adjusted FDR ≤ 0.05) relative to the total number of proteins.
Screening of phosphorylated candidate proteins involved in regulating the dormancy of litchi buds
-
To further investigate the proteins potentially involved in the phosphorylation process and the regulation of litchi bud development, Venn analysis on DRPs related to the membrane, integral component of the membrane, transmembrane transport, and transporter activity were performed. The results indicated that relevant proteins were identified in pairwise intersection combinations; however, the target protein was not present in the common intersection set (Supplementary Fig. S5). The phosphorylation of proteins needs various protein kinases, primarily located within the cell membranes[44,45]. To examine whether kinases associated with protein phosphorylation play a role in the dormancy regulation of litchi terminal buds, we conducted Venn intersection analysis on differentially expressed kinase proteins (those possessing kinase domains and activity), membrane proteins, transmembrane transport, and transporter activity proteins. The findings revealed that only one protein was identified in their intersection (Fig. 6a). These results indicate that during the development of litchi buds, although multiple membrane-related proteins and kinases are involved, the correlation among these proteins was weak. Furthermore, the number of specific proteins engaged in phosphorylation regulation is limited, suggesting the existence of particular regulatory mechanisms.
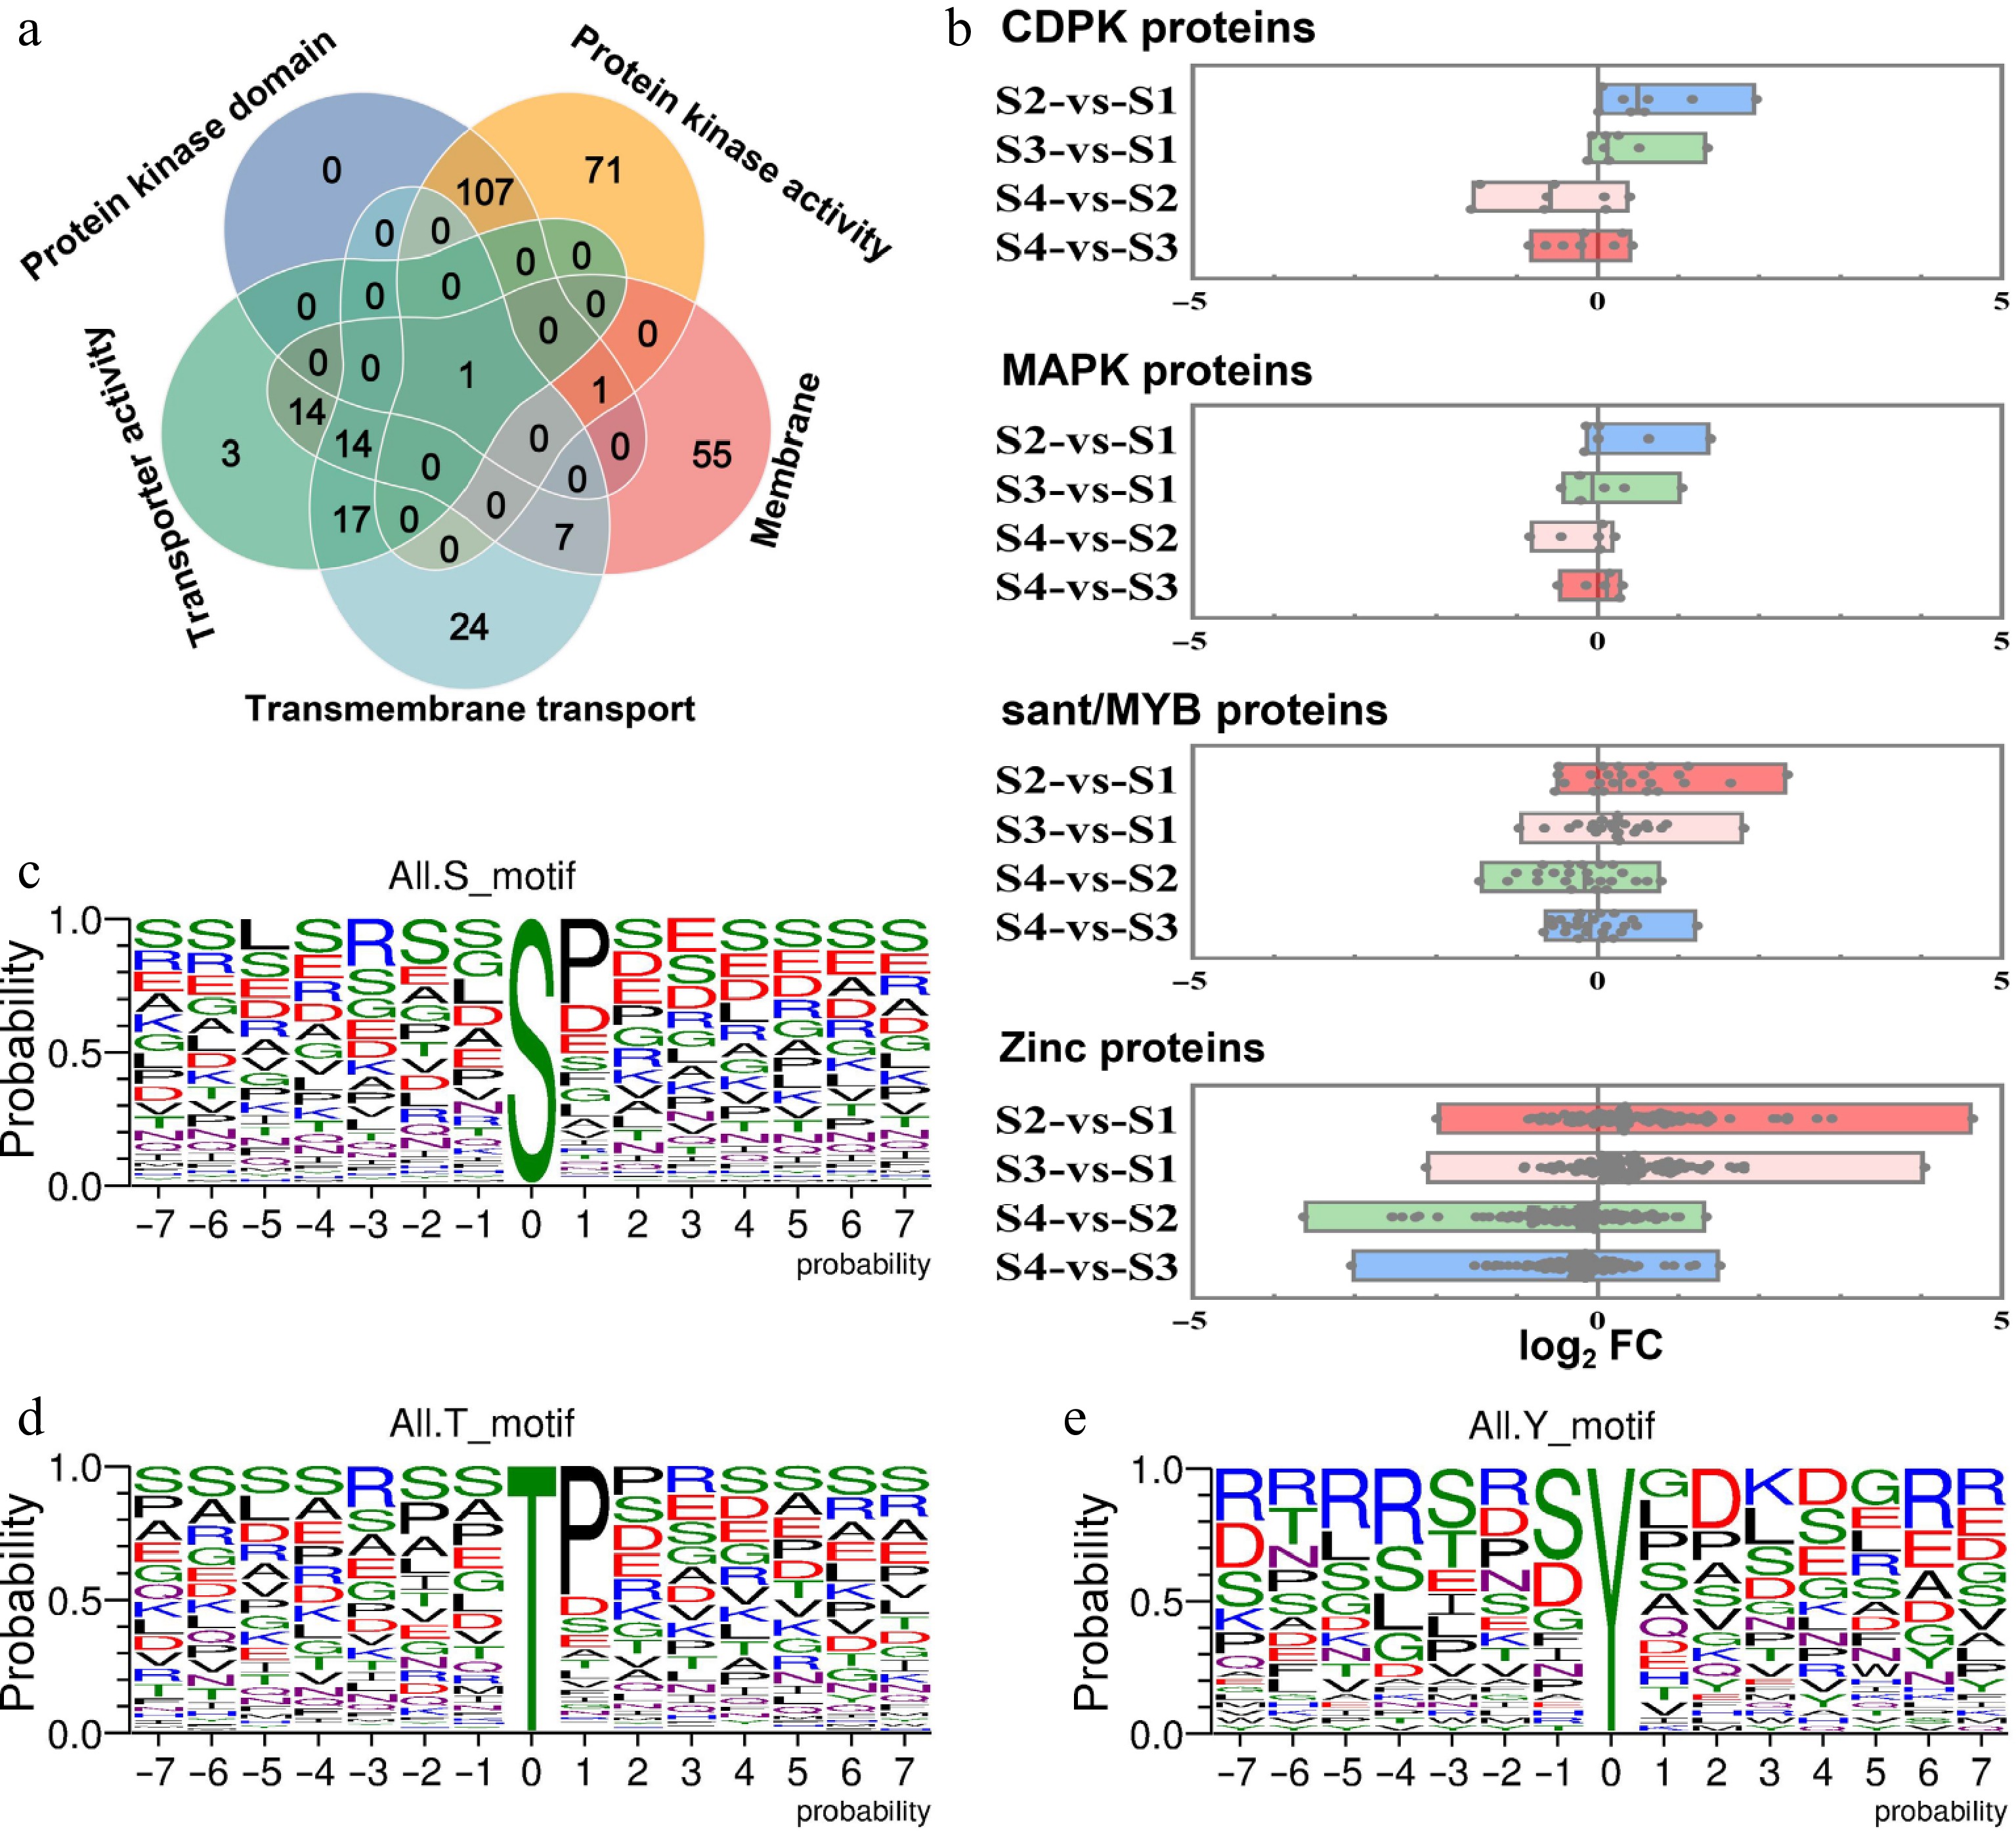
Figure 6.
Analysis of the fold change levels in the expression abundance of related DRPs between dormancy and growth stages, as well as phosphorylation sites of phosphorylated proteins. (a) Venn diagrams illustrating the number of overlapping proteins among those with kinase domains and kinase activity, membrane, transmembrane transporters, and transporter activity proteins. (b) Analysis of the expression abundance of phosphorylated proteins, including CDPK, MAPK, sant/MYB, and zinc across the four different development stages of litchi bud. A single point represents a protein. The vertical axis represents the combination names for comparison, while the horizontal axis denotes log2FC, FC: the fold change in expression abundance of DRPs between the two groups represented on the vertical axis. Single phosphorylation motifs were identified, with overrepresented motifs for (c) S, (d) T, and (e) Y being extracted.
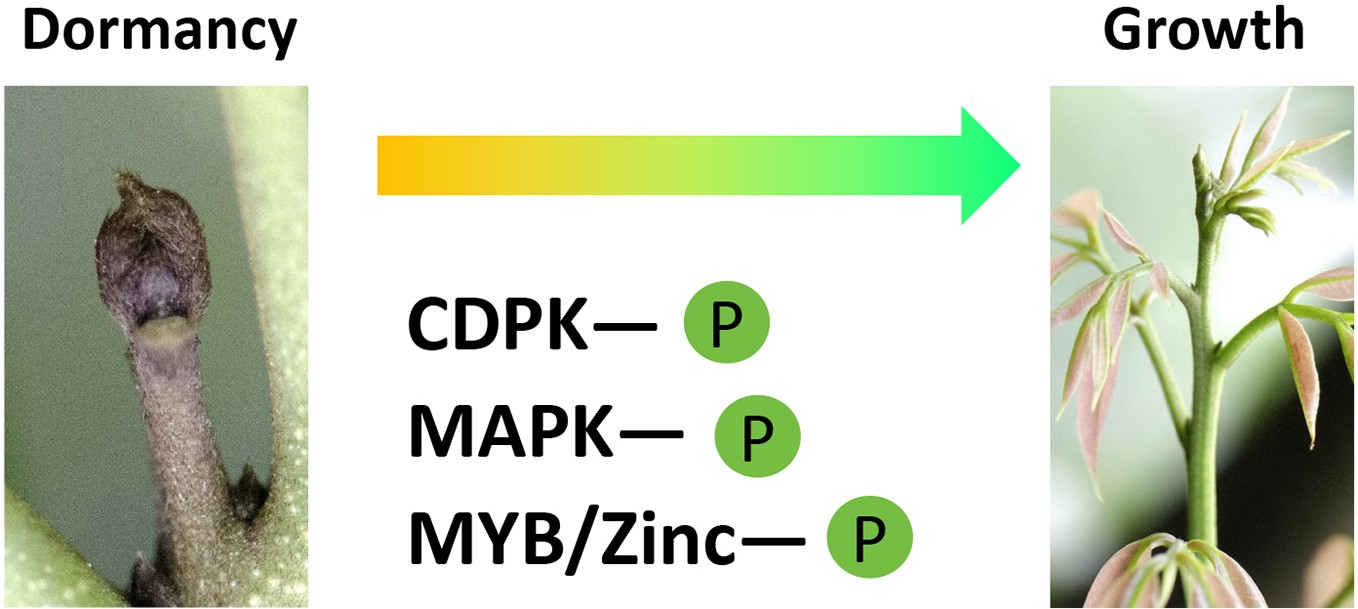
We further analyzed the expression levels of the protein kinases CDPK and MAPK, as well as related TFs such as sant/MYB and zinc proteins, which may be involved in phosphorylation processes. The results indicated that CDPK kinase expression was higher during the growth stages (S2 and S3) of litchi buds compared to the dormancy stages (S1 and S4). The expression trends for MAPK kinase, sant/MYB protein, and zinc proteins were found to be similar to that of CDPK kinase (Fig. 6b). These findings suggest that all these proteins may play a negative regulatory role in dormancy onset and promote budbreak in litchi. Further analysis of the phosphorylation sites of CDPK, MAPK, sant/MYB, and zinc proteins revealed that the common phosphorylation sites were S, T, and Y (Fig. 6c−e).
Correlation analysis of DRPs expression abundance and modification levels of sites among CDPK, MAPK, sant/MYB, and zinc proteins
-
According to the phosphoproteome date of litchi terminal buds, we further analyzed the phosphorylation modification levels of DRPs, including CDPK, MAPK, sant/MYB, and zinc proteins, at various developmental stages. The results indicated that most CDPK kinases, MAPK, and CCCH-type zinc proteins exhibited significantly higher levels of phosphorylation during the growth stages (S2 and S3) compared to the dormant stages (S1 and S4) of litchi buds (Fig. 7a). This suggests that these proteins undergo phosphorylation during the growth stage. In contrast, there was no significant difference in the modification levels of sant/MYB proteins between the growth and dormancy stages.
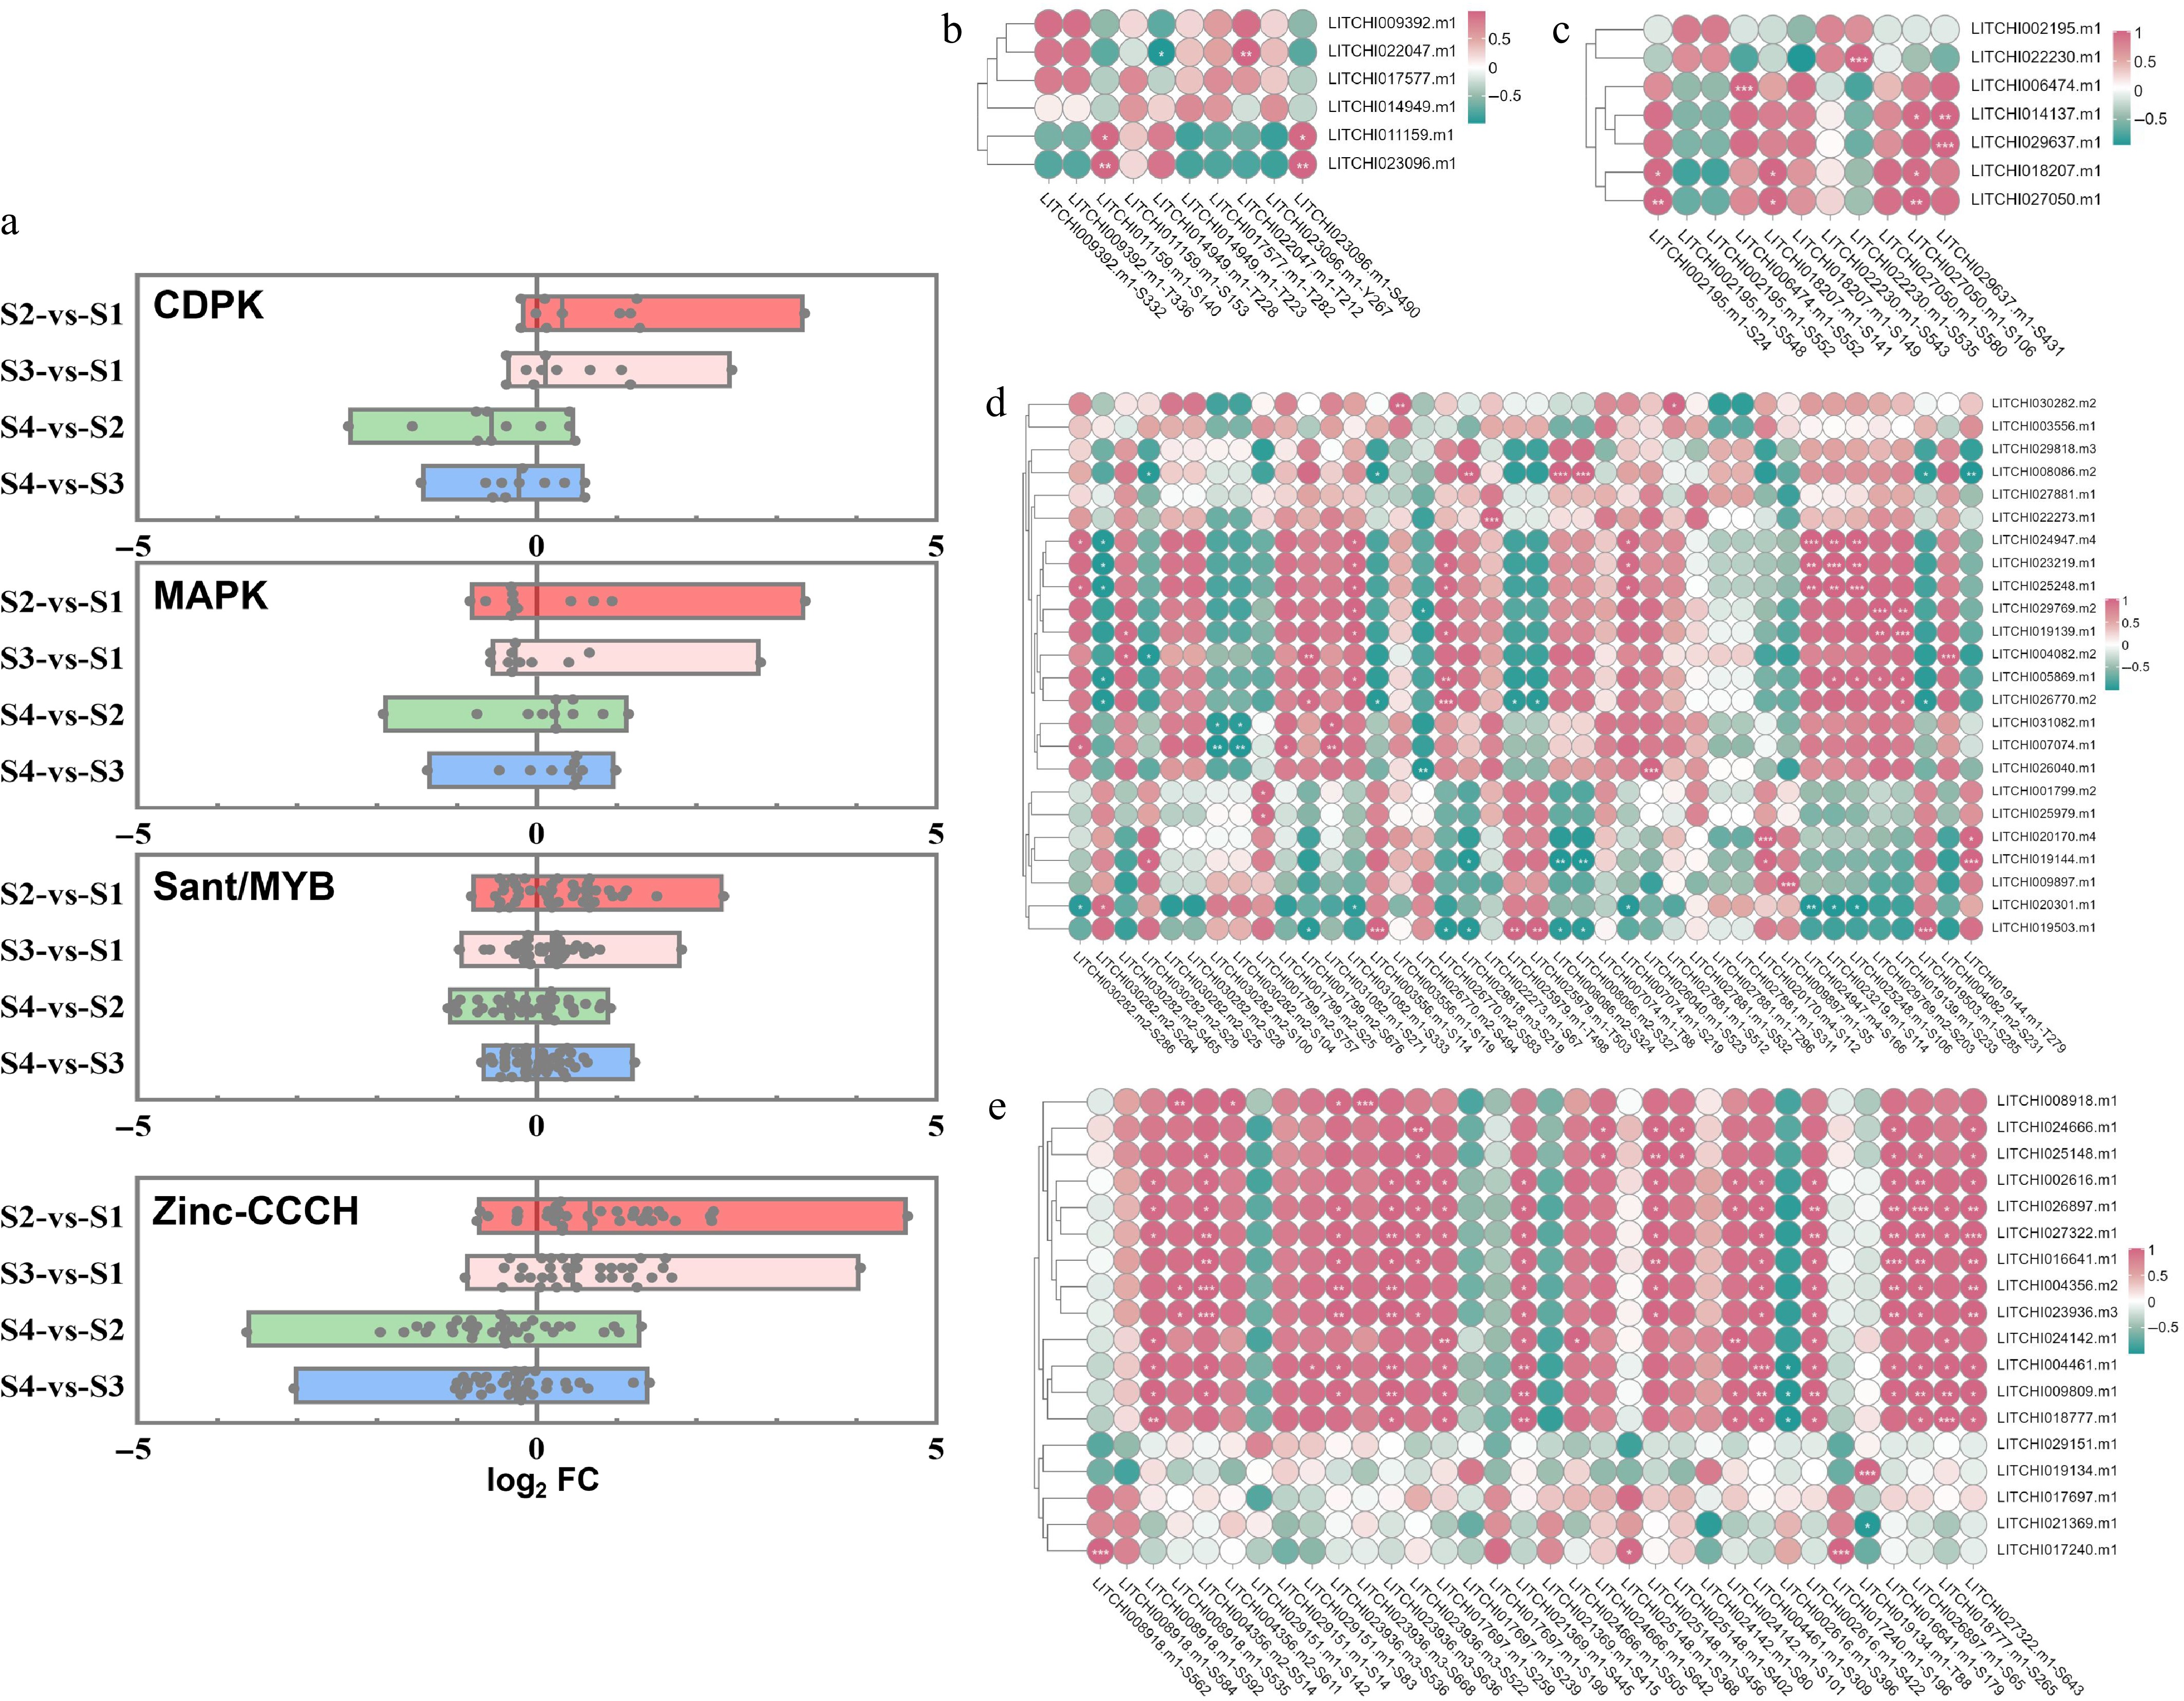
Figure 7.
Correlation analysis between the abundance and phosphorylation modification levels of related motifs/sites across different developmental stages of litchi buds. (a) Analysis of phosphorization motifs modification levels of CDPK, MAPK, sant/MYB, and zinc proteins between dormancy and growth stages. A single point represents a motif site on the proteins. The vertical axis represents the combination names for comparison, while the horizontal axis denotes log2FC, FC: the fold change in expression abundance of phosphorylation motif/site on DRPs between the two groups represented on the vertical axis. Heatmap of correlation analysis between phosphorylation motifs and their predicted kinases (b) CDPK, (c) MAPK, (d) TF MYB, and (e) zinc. The correlation score was used for heat mapping.
Correlation analyses between the protein expression abundance and site phosphorylation levels of CDPKs (Fig. 7b), MAPKs (Fig. 7c), sant/MYB TFs (Fig. 7d), and zinc-CCCH TFs (Fig. 7e) showed a significant correlation between the protein expression abundance of the MAPK kinase family member LITCHI023096.m1 and phosphorylation at the S490 site (Fig. 7b). Additionally, the degree of phosphorylation at T212 of LITCHI022047.m1 was significantly correlated with protein expression, and S153 of LITCHI011159.m1 also showed a significant correlation with protein expression abundance (Fig. 7b). Within the CDPK kinase family proteins, LITCHI006474.m1 was phosphorylated at S552, LITCHI022230.m1 at S535, LITCHI027050.m1 at S580, and LITCHI029637.m1 at S431 (Fig. 7c). In the sant/MYB family proteins, particular attention should be paid to the phosphorylation of LITCHI008086.m2 at S324 and S327, LITCHI022273.m1 at S67, LITCHI024947.m1 at S166, LITCHI023219.m1 at S114, LITCHI025248.m1 at S106, LITCHI029769.m2 at S203, LITCHI019139.m1 at S233, LITCHI004082.m2 at S231, LITCHI026770.m2 at S494, LITCHI026040.m1 at S523, and LITCHI020170.m4 at S112 (Fig. 7d). Furthermore, phosphorylation events at S112, T279 of LITCHI019144.m1, S5 of LITCHI009897.m1, and S285 of LITCHI009897.m1 were also noted (Fig. 7d). Analysis of CCCH type zinc proteins should particularly focus on the phosphorylation of LITCHI008918.m1 at S535, LITCHI025148.m1 at S456, LITCHI026897.m1 at S65, LITCHI027322.m1 at S643, LITCHI016641.m1 at S179, LITCHI004356.m2 at S514, LITCHI023936.m3 at S636, LITCHI024142.m1 at S101, LITCHI004461.m1 at S309, LITCHI018777.m1 at S265, and LITCHI019134.m1 at T88, as well as phosphorylation at S196 of LITCHI017240.m1 (Fig. 7e).
Analysis of the expression patterns of phosphorylated protein-coding genes at different developmental stages of litchi buds
-
To investigate differential expression of phosphorylated protein-coding genes during different development stages of litchi terminal buds, we randomly selected several genes for quantitative primer design. The primer sequences are presented in Supplementary Table S3. The real-time quantitative results indicate that the expression level of the LITCHI022010 gene during the bud break stage (S2) was lower than that during the other stages (Fig. 8a). Furthermore, the expression levels of the LITCHI022010, LITCHI009916, and LITCHI015849 genes were higher in the dormancy stage (S1), and growth arrest stage (S4) compared to the S2, and fast growth stage (S3) (Fig. 8b−d), suggesting that these three genes may play a positive regulatory role in the onset of litchi bud dormancy. The expression trend of the LITCHI022230 gene mirrored that of LITCHI022010, exhibiting lower expression levels at the S2 stage (Fig. 8e). Additionally, LITCHI019111, LITCHI029637, LITCHI006474, and LITCHI019825 showed high expression levels at the S1 stage, indicating that these genes may be crucial for maintaining the dormancy of litchi buds. These results indicate that certain genes encoding DRPs demonstrate differential expression at the transcriptional level across the four stages of litchi terminal bud development, suggesting their potential molecular roles in regulating bud dormancy.
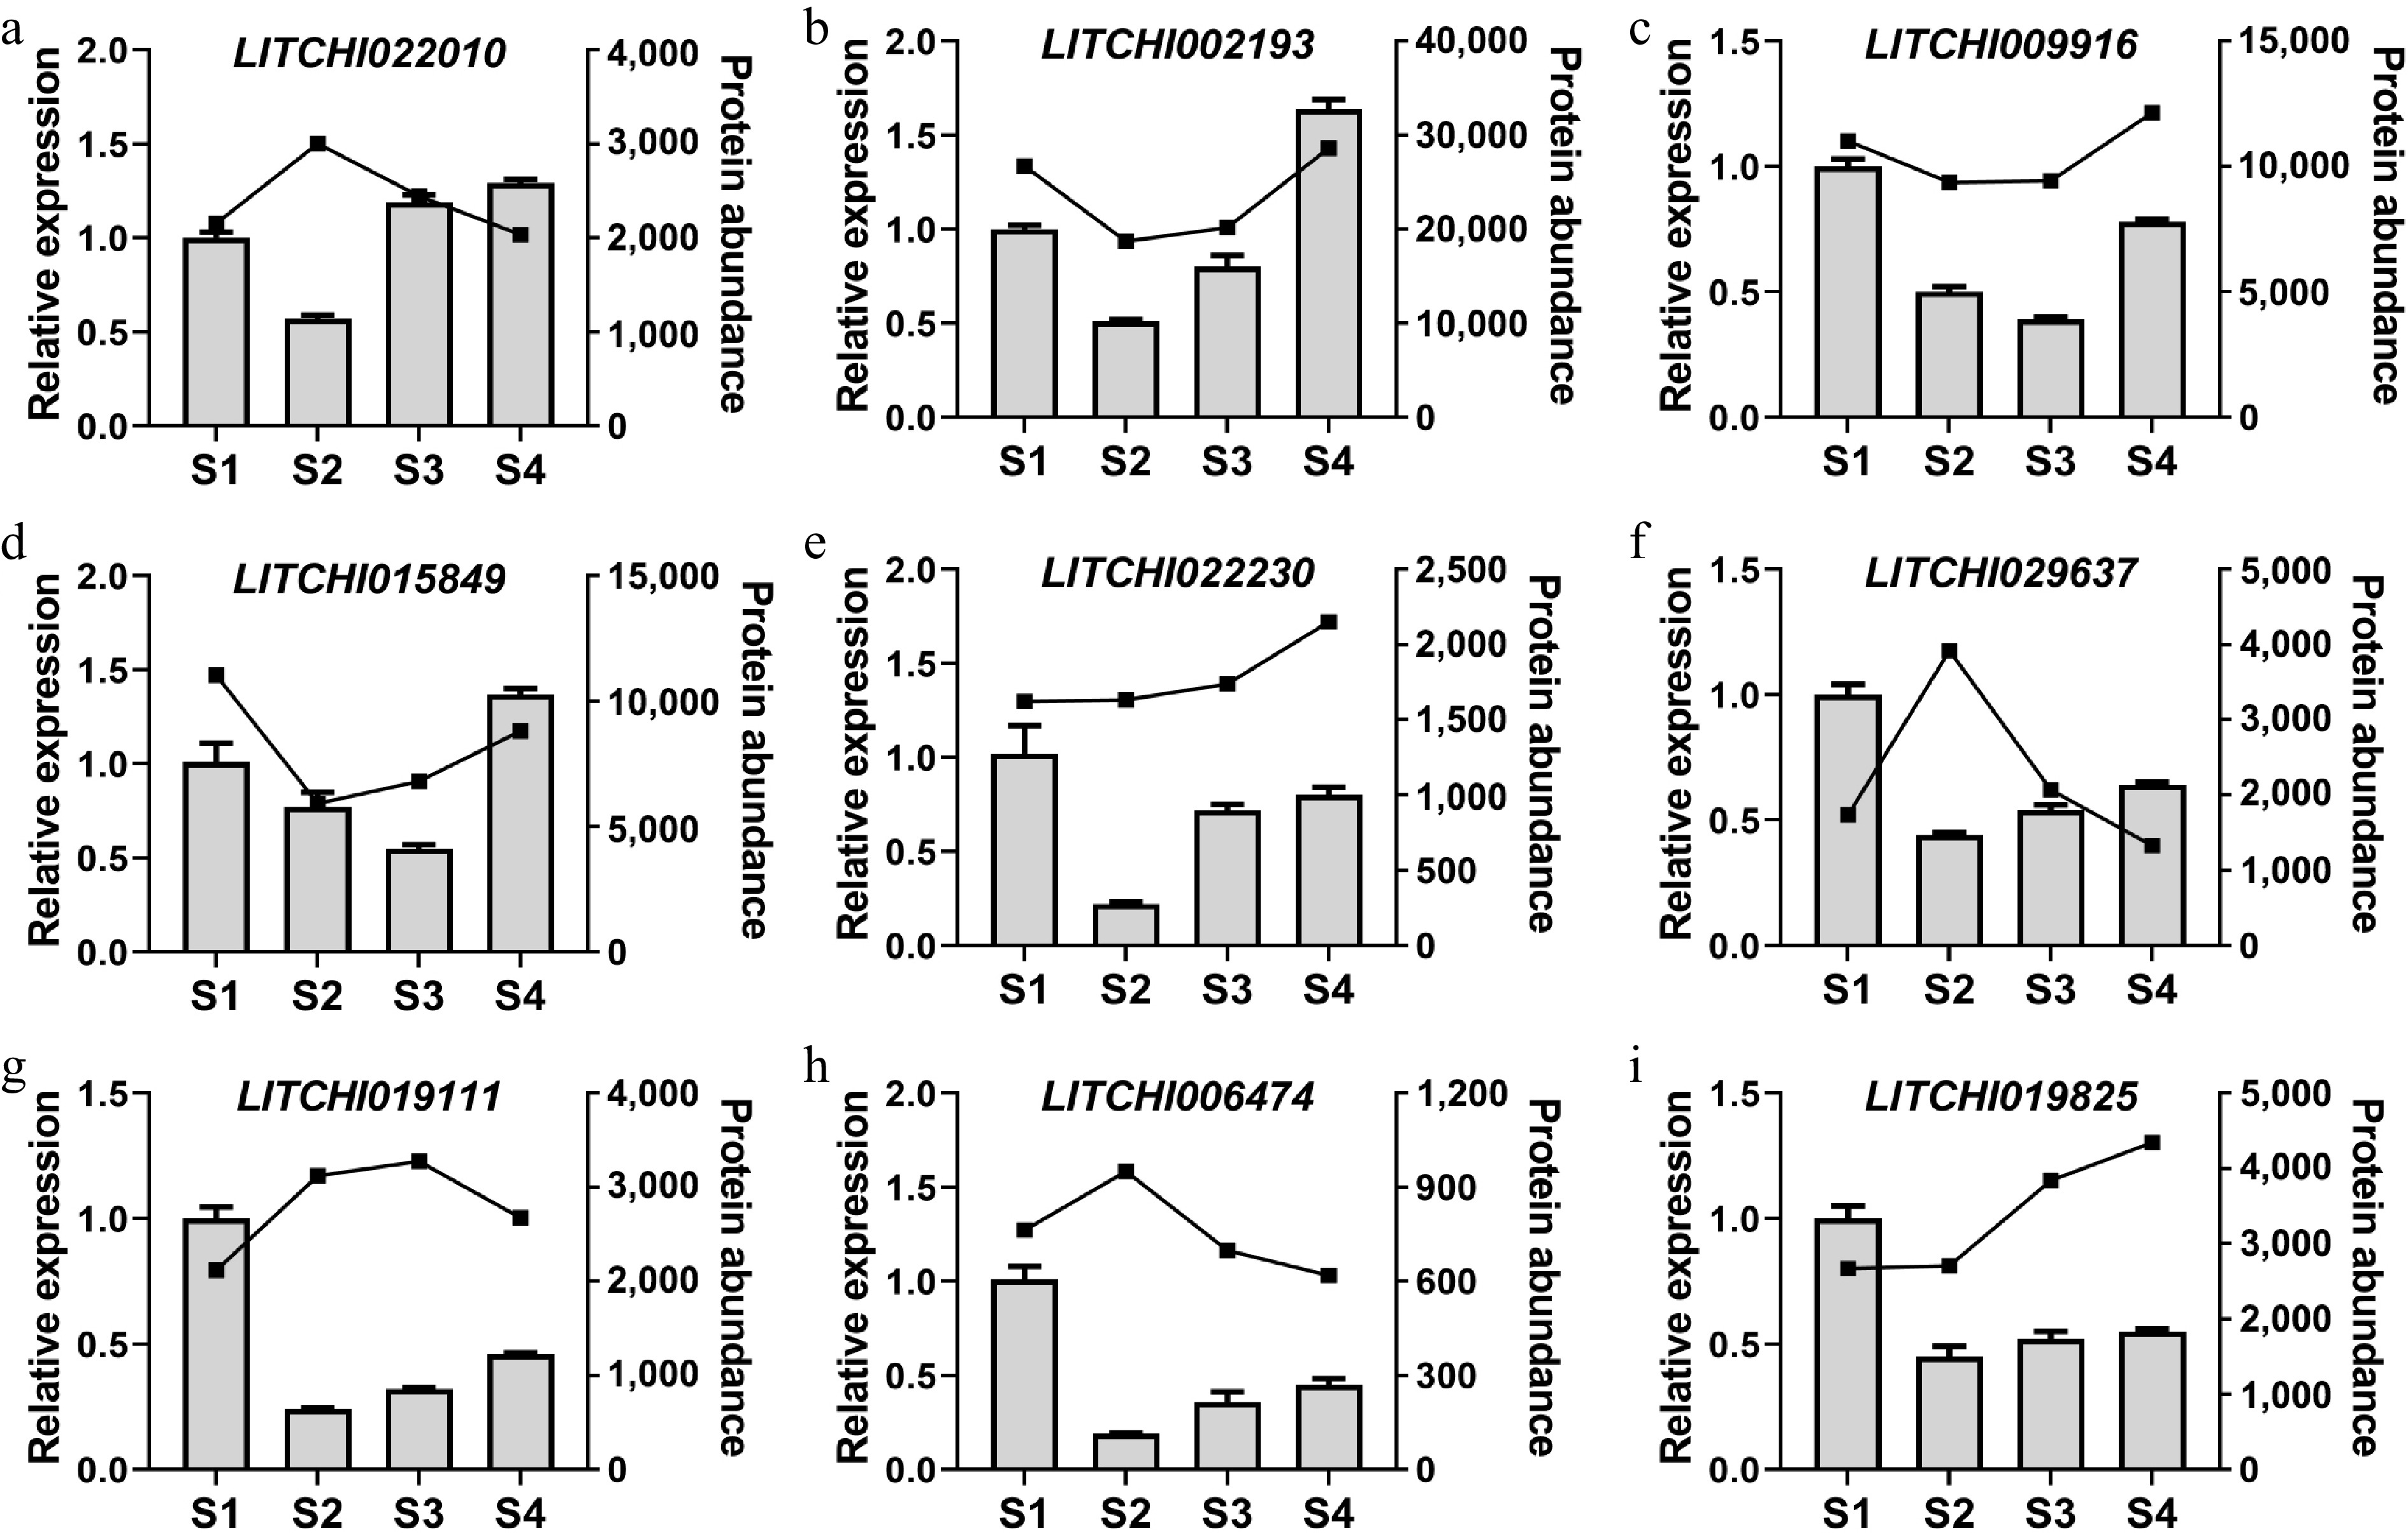
Figure 8.
Analysis of gene expression patterns in litchi buds at different stages. The expression levels of (a) LITCHI022010, (b) LITCHI022010, (c) LITCHI009916, (d) LITCHI015849, (e) LITCHI022230, (f) LITCHI019111, (g) LITCHI029637, (h) LITCHI006474, and (i) LITCHI019825 were measured from S1 to S4. Error bars represent standard error of means (n = 3).
-
The regulatory mechanism underlying litchi terminal bud dormancy is complex, with a notable lack of research focusing on PTM regulation. Consequently, the relevant PTM regulation mechanisms remain poorly understood. This study aims to conduct a comprehensive phosphoproteomic analysis of four different development stages (S1 to S4) of litchi terminal bud development, with the objective of elucidating the regulatory processes involved in this development at the level of protein PTMs.
Studies indicate that protein phosphorylation participates in regulating seed dormancy and other growth processes in plants[11]. In the study of grape bud dormancy release, treatment with hydrogen cyanamide (HC) led to a 70% increase in calcium-dependent histone phosphorylation in the buds. One specific 47 kDa protein exhibited strong Ca2+-dependent phosphorylation after HC treatment. These results indicate that CDPK-mediated phosphorylation regulation plays an important role in the mechanism of grape bud dormancy release[46]. The MKK3-MPK7 cascade phosphorylation of ERF4 has been shown to promote the breaking of seed dormancy in Arabidopsis[12]. The MKKK62-MKK3-MAPK7/14 module has been reported in rice to regulate seed dormancy through phosphorylation[47]. Furthermore, it has been reported that the MYB TF PpMYB52 negatively regulates peach bud break through the gibberellin pathway and its interaction with PpMIL1[48]. Numerous studies have indicated that zinc finger protein TFs are involved in the dormancy process; however, their role in regulating dormancy through phosphorylation remains to be further investigated[49,50]. In this study, phosphogenomics analysis of litchi terminal buds at different developmental stages revealed that the abundance of various phosphoprotein kinases and related TFs significantly increased when the litchi buds transitioned from dormancy to the growth stage. Notably, many proteins involved in this process were phosphorylated, including protein kinases such as CDPK, MAPK, MYB, and zinc finger proteins. These findings indicate that protein phosphorylation plays a critical role in plant dormancy. Protein kinases, such as MAPK and CDPK, not only regulate the developmental processes of annual plants through phosphorylation modifications but also may have a regulatory role in the dormancy of buds in perennial trees.
A total of 2,795 phosphorylated proteins from various developmental stages of litchi terminal buds were obtained in this study, and further analyzed using biological process (BP), molecular function (MF), and cellular component (CC) classifications. The BP analysis revealed that most of these proteins possessed phosphorylation functions, while the CC analysis indicated that the majority were localized to the cell membrane. Notably, kinases were predominantly found on the plant cell membrane, consistent with a number of previous reports[44,45]. Additionally, the CC analysis revealed that many proteins were also localized in the nucleus, suggesting that some of these proteins may function as TFs. Previous studies have indicated that many proteins within TF families can participate in the phosphorylation regulatory processes in plants, such as zinc finger proteins[51], and MYB TFs[52]. Therefore, it can be inferred that certain TFs involved in regulating the dormancy of litchi terminal buds may also be modulated by phosphorylation. Based on the abundance of protein expression observed during various developmental stages of litchi buds, all the DRPs were categorized into six distinct groups (Cluster 1 to Cluster 6). Notably, Cluster 3 contains DRPs that were highly expressed during the S2 stage of litchi buds. GO analysis revealed that this class of proteins primarily participated in carbohydrate synthesis within biological processes. Upon entering the bud break stage, litchi buds exhibit heightened activity in substance transport and other related processes. The cell tissues of the apical buds must rapidly synthesize compounds to facilitate branch elongation; consequently, proteins associated with carbohydrate synthesis comprise the majority in this stage. Additionally, several members of the aquaporin family have also been identified among these proteins. It is important to highlight that this study conducted Venn intersection analysis on the differentially expressed kinase proteins (proteins with kinase domains and kinase activity), membrane proteins, transmembrane transport, and transporter active proteins at various developmental stages of litchi terminal buds. We identified only one protein (LITCHI022010.m1), annotated as Potassium Transporter 3 in the litchi genome database. Notably, this protein is homologous to the Arabidopsis CDPK6 gene, which encodes Calcium-Dependent Protein Kinase 6. According to previous studies, the Arabidopsis CDPK6 protein plays a significant role in various plant signal transduction pathways and is a crucial kinase involved in the regulation of phosphorylation modifications of proteins[53,54]. However, further research is necessary to elucidate the function of this protein in litchi.
In this study, we further analyzed the phosphorylation modification levels of several important DRPs potentially involved in the phosphorylation process, including MAPKs, CDPKs, MYB, and zinc finger TFs. Our findings revealed that the phosphorylation levels of most proteins during the growth stage of litchi buds were significantly higher than those observed during the dormant stage. The results of qRT-PCR assays indicate that the expression levels of certain protein-coding genes during the growth stage were significantly higher than those observed during dormancy. These results suggest that the genes encoding kinases or related TFs may positively influence the breaking of litchi bud dormancy, and the proteins they encode may also play a crucial role in PTMs regulation inheritance following transcription. Additionally, in our previous studies, we demonstrated that the dormancy of litchi terminal buds is regulated by TFs LcSVP2 and LcSMOS1, as well as endogenous hormones like abscisic acid and ethylene[8]. In this study, we also focused on several dormancy-related DRPs, including proteins such as DAM and ERF, which belong to the same family as LcSVP2 and LcSMOS1. However, we did not detect the presence of LcSVP2 and LcSMOS1. Nevertheless, it remains unclear whether these TFs can be further regulated by PTMs, and further studies are needed.
Taken together, this study performed phosphoproteomics analysis across various development stages of litchi terminal bud development, identifying DRPs, including kinases such as CDPK and MAPK, which are involved in biological pathways such as energy metabolism and possess multiple phosphorylation sites. Further analysis revealed that the expression levels of these proteins were positively correlated with the degree of phosphorylation modification. Notably, the abundance of these proteins in litchi buds during the growth period was significantly higher than that during the dormancy period. These findings suggest that the transition of litchi bud from dormancy to growth may involve PTM regulation through the phosphorylation modification of various proteins. This study offers new insights into the terminal bud dormancy of tropical fruit trees concerning PTM regulation.
This study was supported by the China Litchi and Longan Industry Technology Research System (Project no. CARS-32), the 2023 Special Project for Key Areas of Research and Development of Guangzhou Municipality (2023B01J2002), and the Guangzhou Basic and Applied Basic Research Foundation (No. 2024A04J4919).
-
The authors confirm contribution to the paper as follows: study and experiments design: Zeng RF, Huang XM; analysis and interpretation of results: Tian X, Ma MM, Wang HC, Shen JY; critical feedback and revisions: Zeng RF. All authors reviewed the results and approved the final version of the manuscript.
-
The corresponding author can provide the data that underlie the findings of this study upon reasonable request.
-
The authors declare that they have no conflict of interest.
-
accompanies this paper at (https://www.maxapress.com/article/doi/10.48130/tp-0025-0018)
-
Received 13 January 2025; Accepted 21 May 2025; Published online 4 July 2025
-
A total of 6,785 phosphorylation modification sites were identified across 2,795 phosphoproteins at various developmental stages of litchi terminal buds, including 492 DRPs identified in the comparison between the bud break stage and the dormancy stage.
KEGG pathway analysis revealed that DRPs were predominantly enriched in metabolism and genetic information processing pathways.
An intersection analysis of proteins associated with different functional pathways further highlighted the significant regulatory role of protein kinases in the bud break of litchi.
CDPK, MAPK, MYB, and zinc proteins showed significantly higher modification levels and expression abundances during the growth period of litchi buds compared to the dormancy period.
Among the DRPs, certain coding genes also displayed differential expression at the transcriptional level during the terminal bud development.
- Supplementary Table S1 The DRPs between S2 vs. S1, S3 vs. S1, S2 vs. S4, S3 vs. S4, S3 vs. S2, and S4 vs. S1 comparison. Red and blue dots represent up- and downregulated proteins, respectively, according to the significance threshold of p < 0.05 and Log2 |FC|, FC ≥ 1.5.
- Supplementary Table S2 The DRPs of different cluster.
- Supplementary Table S3 The primers used in this study.
- Supplementary Fig. S1 Experimental workflow for the proteome and phosphoproteome analyses of litchi terminal buds at different developmental stages.
- Supplementary Fig. S2 Distribution of conserved motifs at phosphorylation sites.
- Supplementary Fig. S3 Heatmap depicting the abundance of DRPs potentially associated with dormancy.
- Supplementary Fig. S4 The KEGG analysis and the enrichment of GO categories for DRPs in Clusters 3 (a−b), Clusters 4 (c−d), Clusters 5 (e−f) and Clusters 6 (g−h).
- Supplementary Fig. S5 Venn diagram of phosphoprotein identified in the proteins of membrane, integral component of membrane, transmembrane transport, and transporter activity. Red and green dots represent up- and downregulated proteins according to the significance threshold of p < 0.05 and Log2 |FC|, FC ≥ 1.5.
- Copyright: © 2025 by the author(s). Published by Maximum Academic Press on behalf of Hainan University. This article is an open access article distributed under Creative Commons Attribution License (CC BY 4.0), visit https://creativecommons.org/licenses/by/4.0/.
-
About this article
Cite this article
Tian X, Ma MM, Wang HC, Shen JY, Zeng RF, et al. 2025. Comparative phosphoproteomics analysis of terminal buds at different development stages suggests a pivotal role for protein phosphorylate modification in dormancy regulation of litchi. Tropical Plants 4: e025 doi: 10.48130/tp-0025-0018 

Comparative phosphoproteomics analysis of terminal buds at different development stages suggests a pivotal role for protein phosphorylate modification in dormancy regulation of litchi
- Received: 13 January 2025
- Revised: 12 May 2025
- Accepted: 21 May 2025
- Published online: 04 July 2025
Abstract: Protein phosphorylation plays a crucial role in regulating numerous vital cellular and physiological functions in plants. Nevertheless, the molecular mechanisms that control bud dormancy in evergreen fruit trees are not well understood, particularly concerning protein post-translational modifications. In this study, a thorough quantitative phosphoproteomic analysis was performed for litchi terminal buds at different stages to explore the protein phosphorylation dynamics throughout bud development. A total of 6,785 phosphorylation modification sites were identified spanning 2,795 phosphoproteins. Additionally, 492 differentially regulated phosphoproteins (DRPs) (253 upregulated and 239 downregulated) were found in the comparison of bud break stage (S2) vs dormancy stage (S1). Two-hundred and eighty four DRPs (147 upregulated and 137 downregulated) were found in the fast growth stage (S3) vs dormancy stage (S1). The comparison between the bud break stage (S2) and the growth cessation stage (S4) (S2 vs S4) revealed 374 DRPs (183 upregulated and 191 downregulated), while in S3 vs S4, 186 DRPs (87 upregulated and 99 downregulated) were identified. Gene ontology analysis indicated that most of the DRPs were involved in the protein phosphorylation process, while KEGG pathway analysis revealed that the DRPs were predominantly enriched in metabolism and genetic information processing pathways. Based on the expression patterns, the DRPs at various stages could be categorized into six clusters. An intersection analysis of proteins associated with different functional pathways further highlighted the significant regulatory role of protein kinases in the dormancy removal of litchi terminal buds. Further analysis indicated that the modification levels and expression abundances of DRPs, including CDPK, MAPK, MYB, and zinc proteins, were significantly higher during the growth periods (S2 and S3) compared to the bud growth cessation and dormancy periods (S1 and S4). qRT-PCR results demonstrated that the genes encoding the randomly selected DRPs exhibited notable differential expression patterns across different stages of litchi terminal buds, and some gene expression levels were consistent with the expression abundance levels of their encoded DRPs. This study provides a comprehensive characterization of bud dormancy regulation during the development of shoot terminals in litchi, laying a foundation for further investigation into the regulatory mechanisms of bud dormancy in tropical fruit trees.
-
Key words:
- Litchi /
- Terminal bud /
- Protein phosphorylation /
- Phosphoproteomic analysis /
- Protein kinase /
- Dormancy /
- Bud break /
- Evergreen trees