-
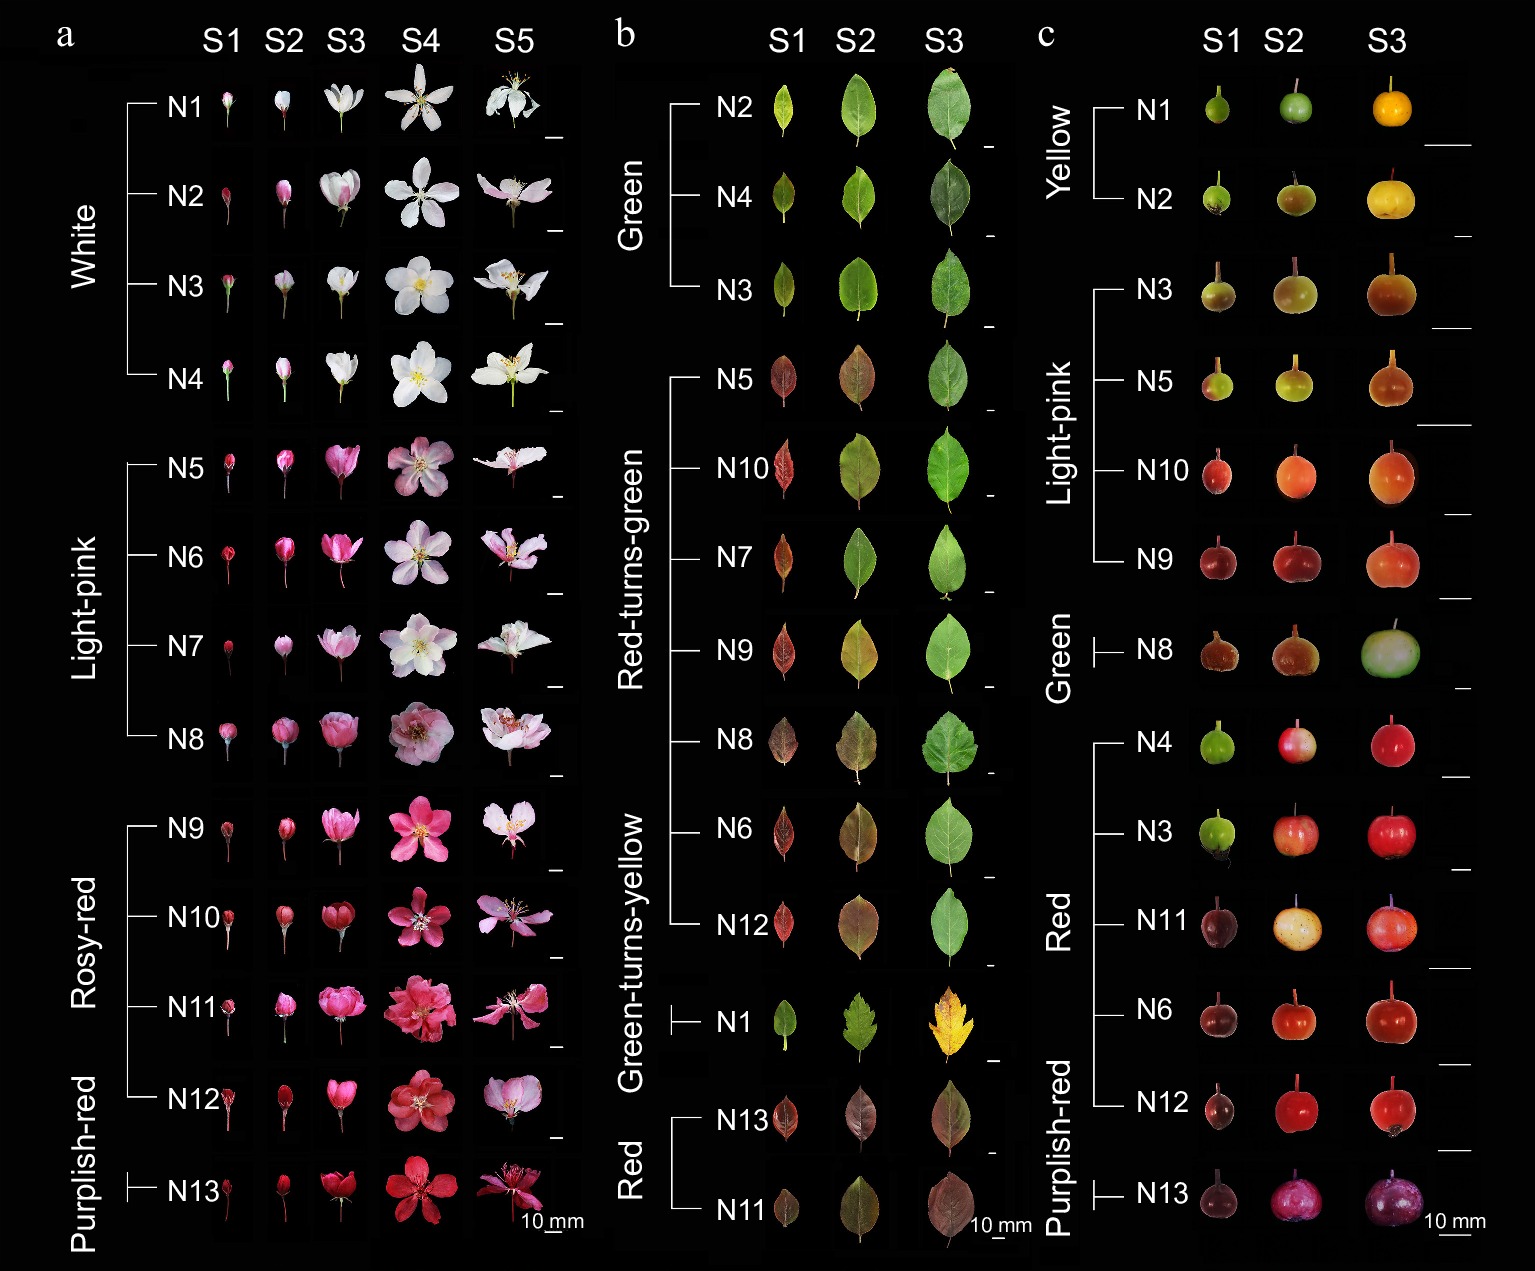
Figure 1.
Phenotypic changes of 13 crabapple cultivars during development. (a) S1−S5 petal color change process. (b) S1−S3 leaf color change process. (c) S1−S3 fruit color change process.
-
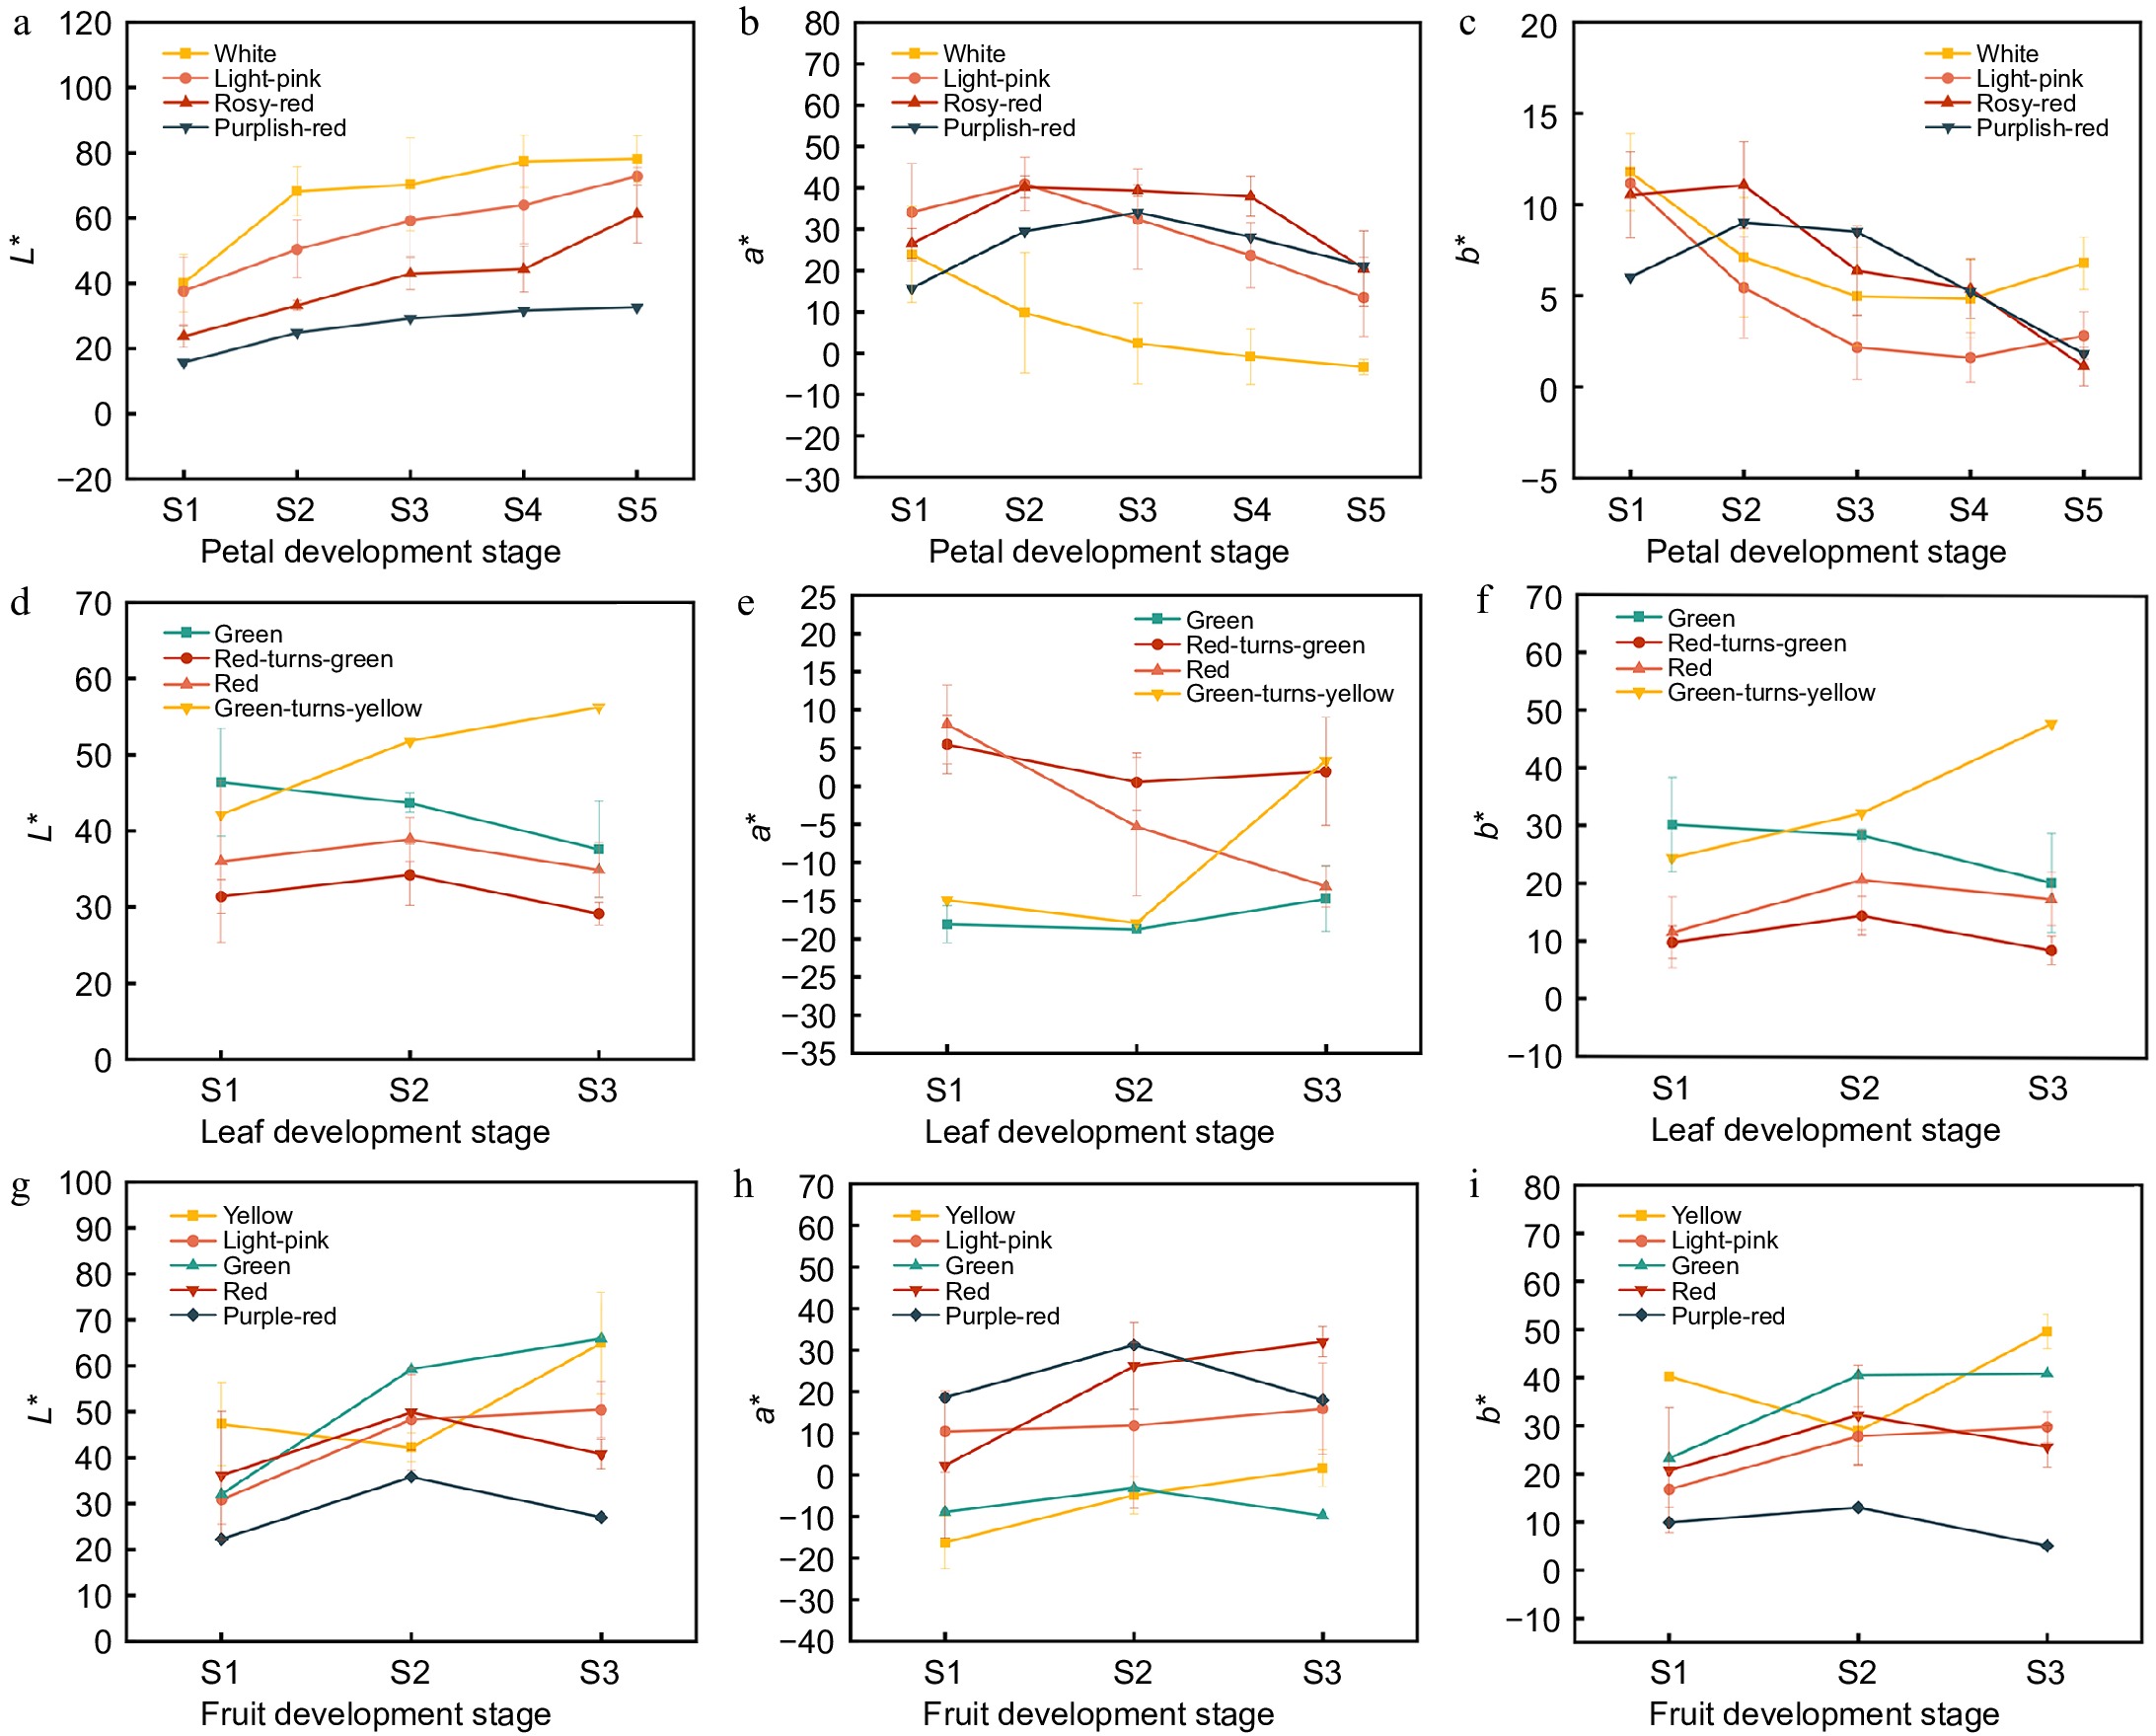
Figure 2.
Color indicator analysis of crabapple development stages. (a) L* values of petals, (b) a* values of petals, (c) b* values of petals, (d) L* values of leaves, (e) a* values of leaves, (f) b* values of leaves, (g) L* values of fruits, (h) a* values of fruits, (i) b* values of fruits.
-
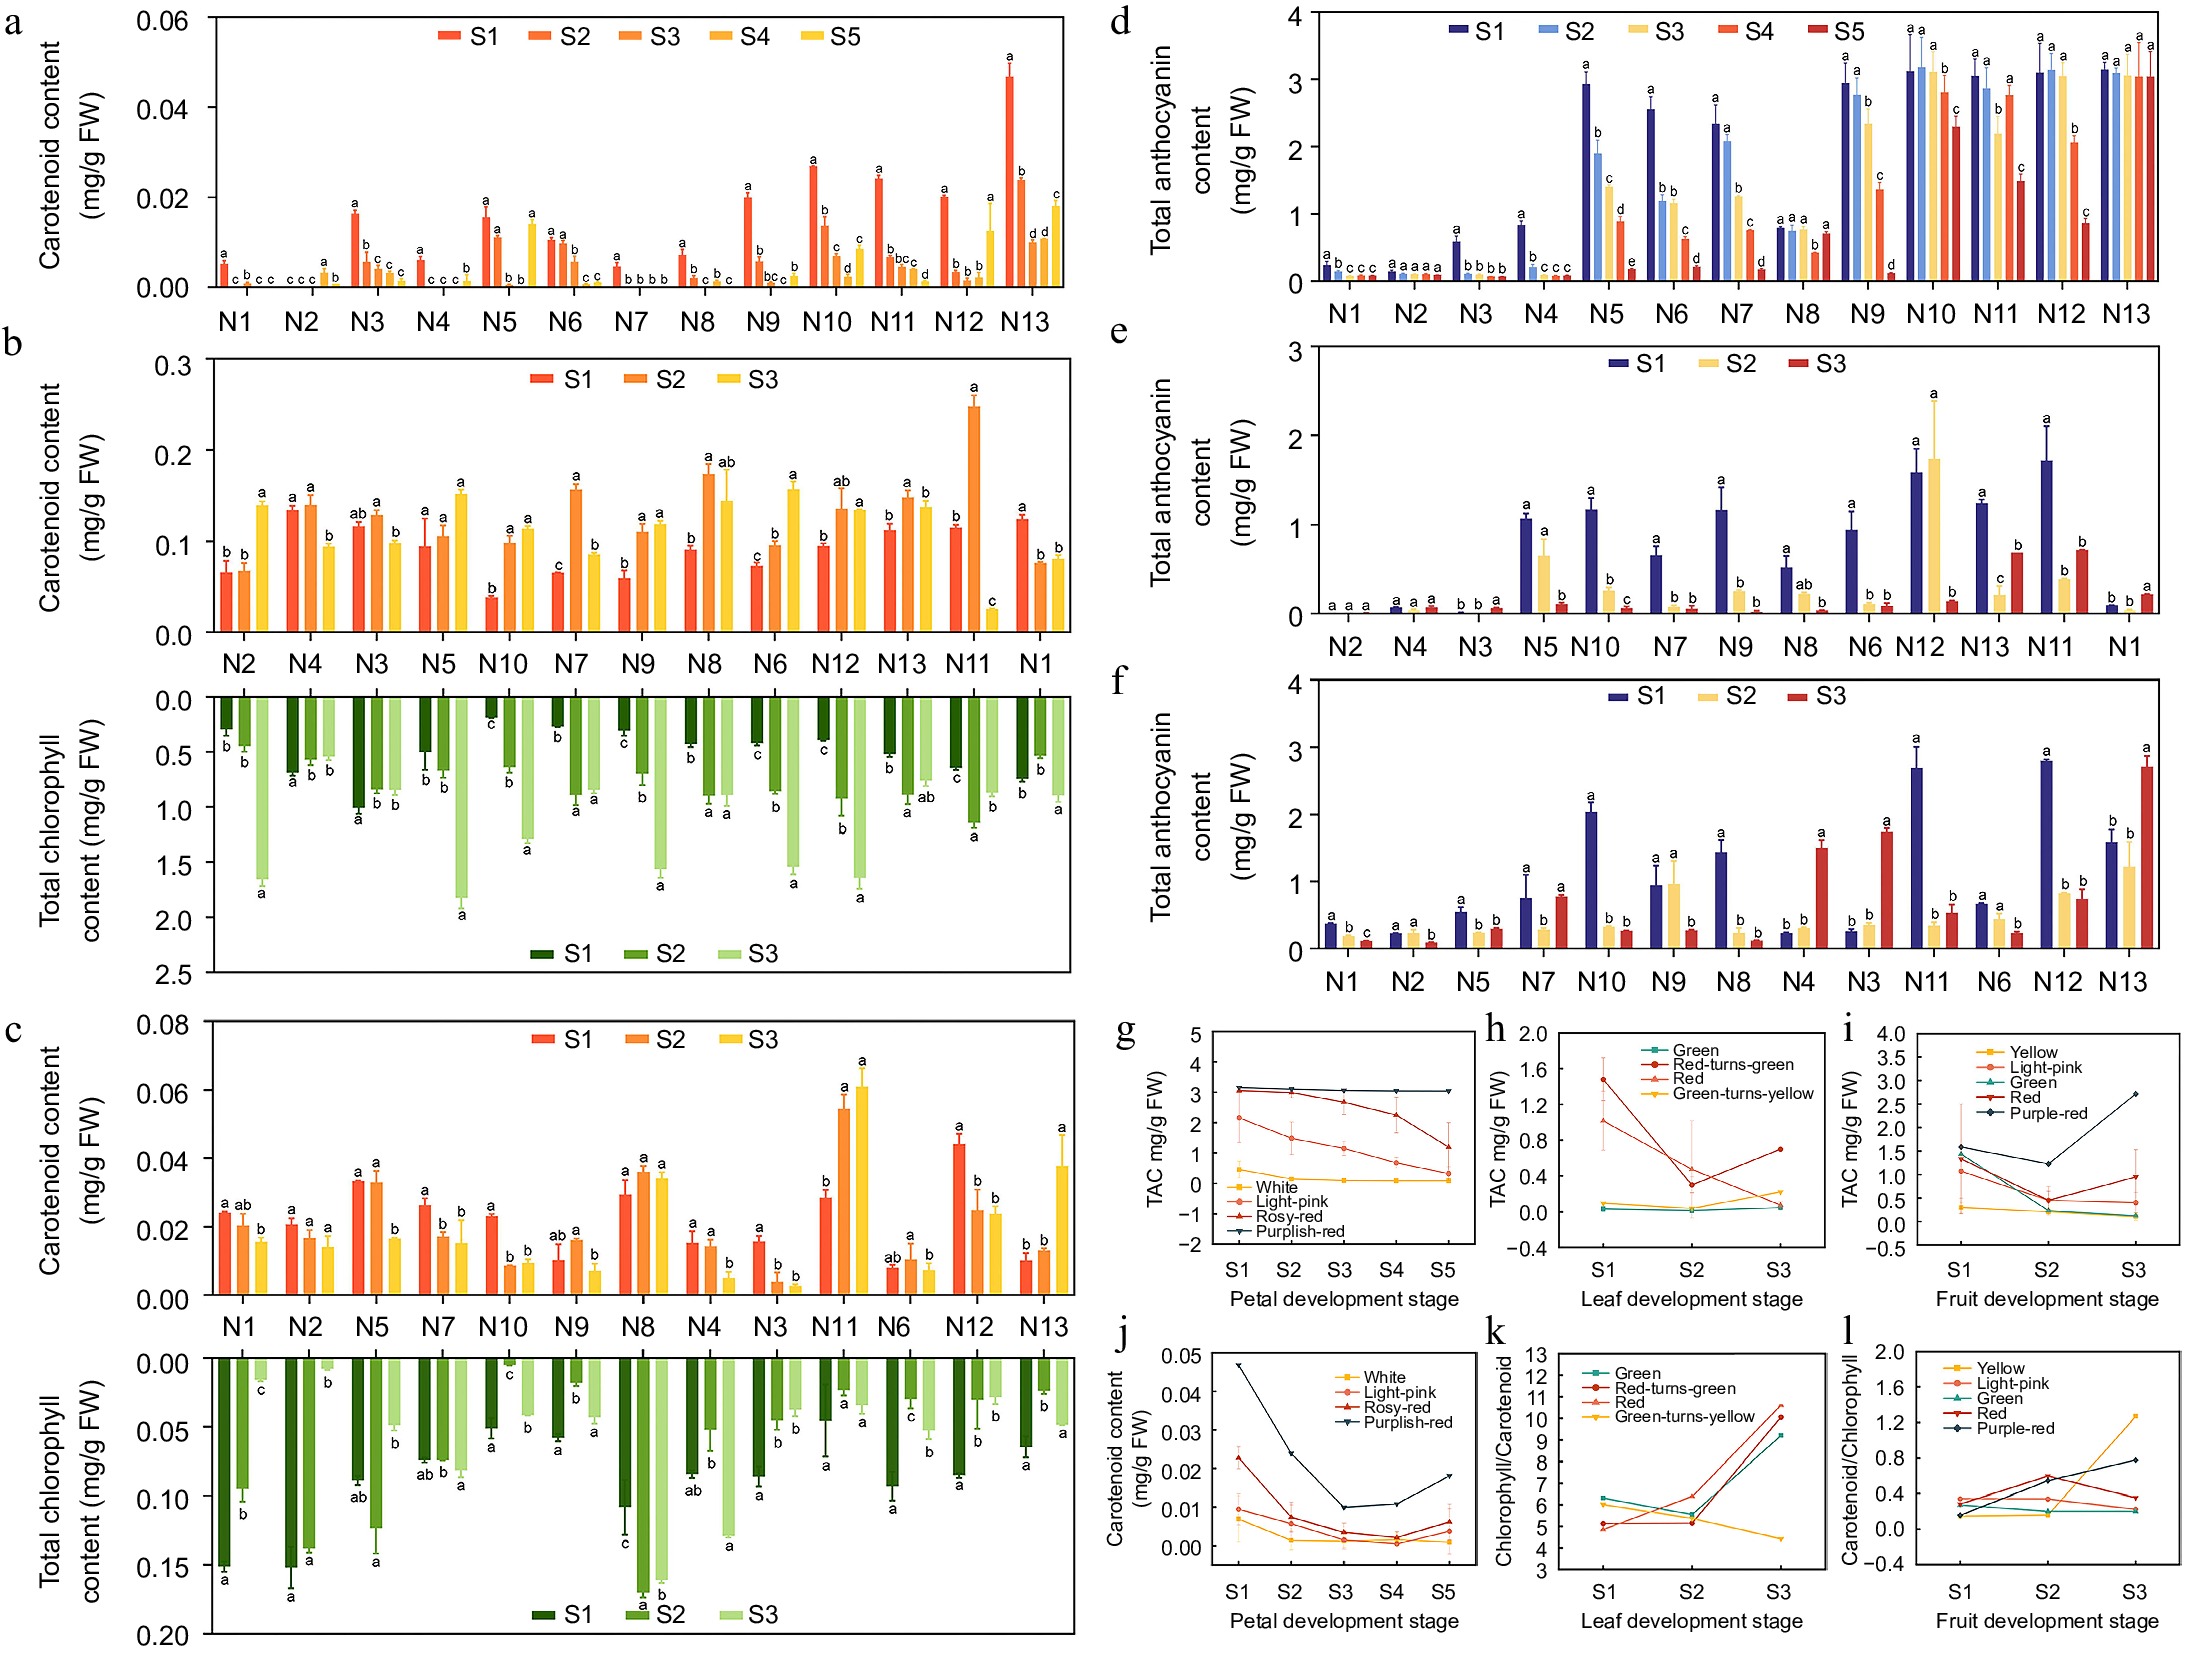
Figure 3.
Content of carotenoid, chlorophyll and anthocyanin in crabapple at different development stages. (a) Carotenoid content of petals. (b) Carotenoid and total chlorophyll of leaves. (c) Carotenoid and total chlorophyll of fruits. (d) Total Anthocyanin Content (TAC) of petals. (e) TAC of leaves. (f) TAC of fruits. (g) TAC trends of petals. (h) TAC trends of leaves. (i) TAC trends of fruits. (j) Carotenoid trends of petals. (k) Carotenoid trends of leaves. (l) Carotenoid trends of petals. Significance markers (a, b, c) in the figure represent the result of pairwise comparisons using the Least Significant Difference (LSD) test at a significance level of p = 0.05.
-
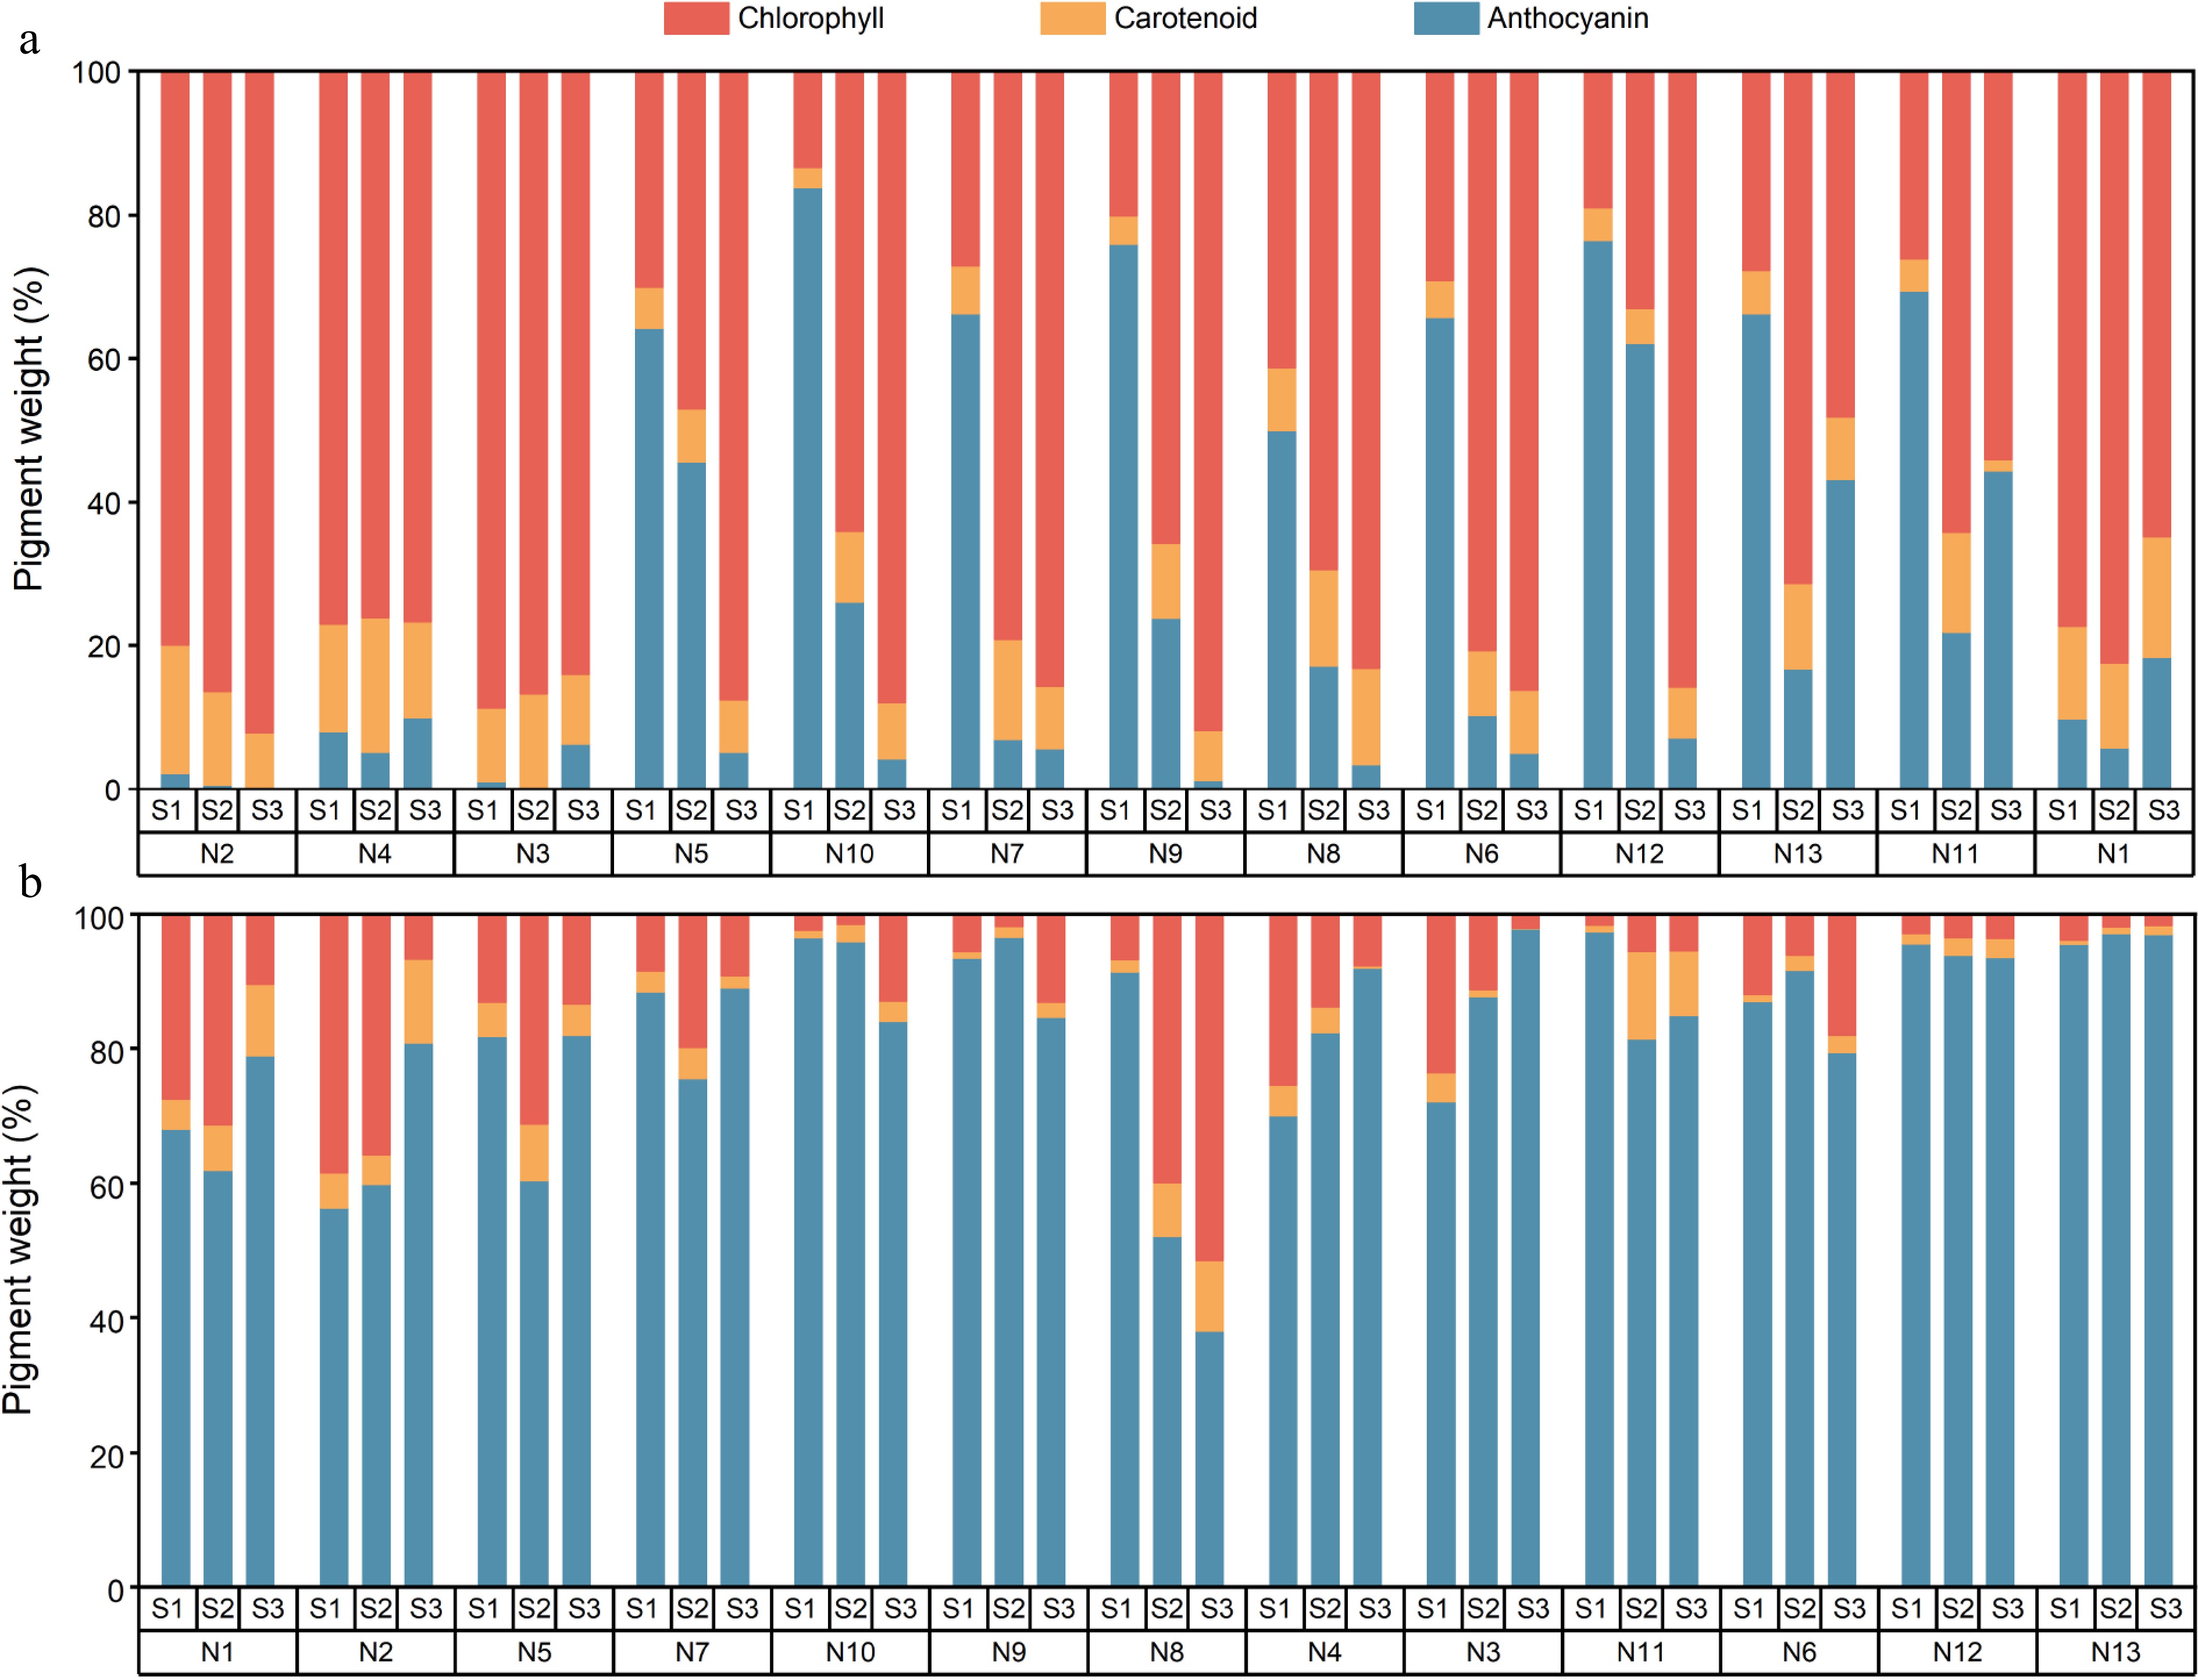
Figure 4.
Content ratio of anthocyanin, chlorophyll, and carotenoid in crabapple. (a) Leaf, (b) fruit.
-
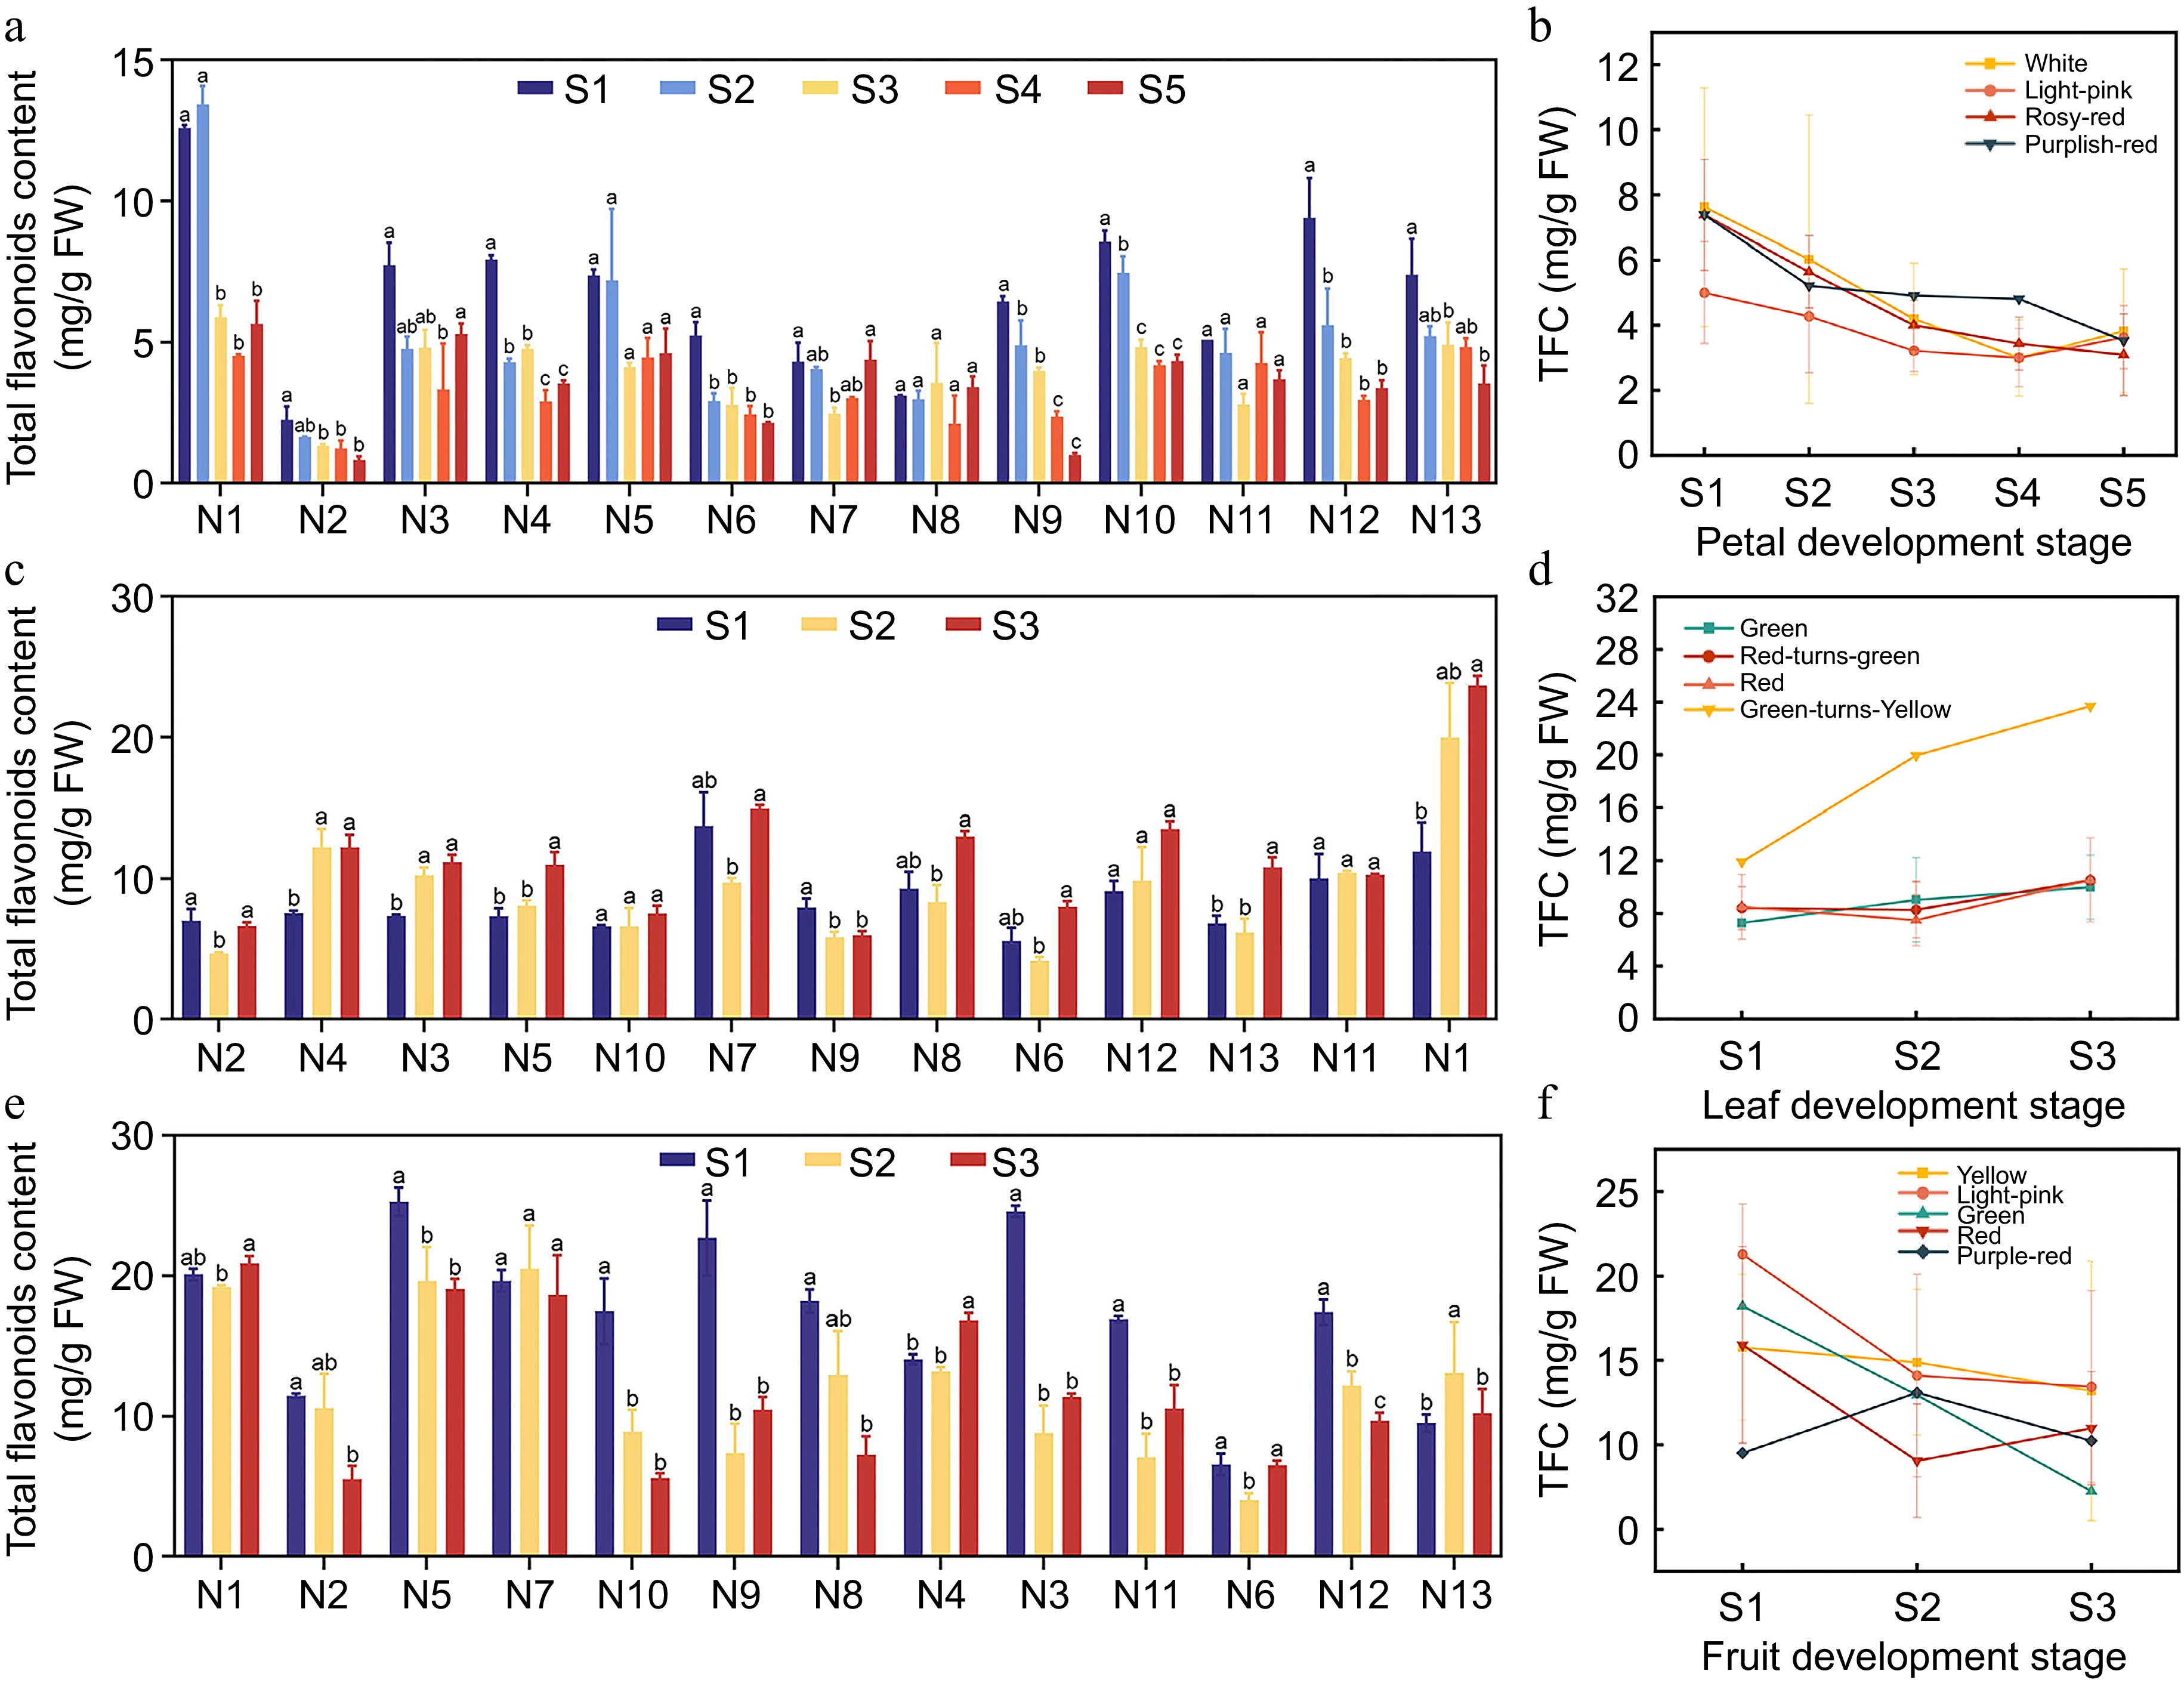
Figure 5.
Total Flavonoid Content (TFC) in different crabapple germplasm. (a) TFC in various petal development stages. (b) Trends of TFC in petal development. (c) TFC in different leaf development stages. (d) Trends of TFC in leaf development. (e) TFC in various fruit development stages. (f) Trends of TFC in fruit development. Significance markers (a, b, c) in the figure represent the result of pairwise comparisons using the Least Significant Difference (LSD) test at a significance level of p = 0.05.
-
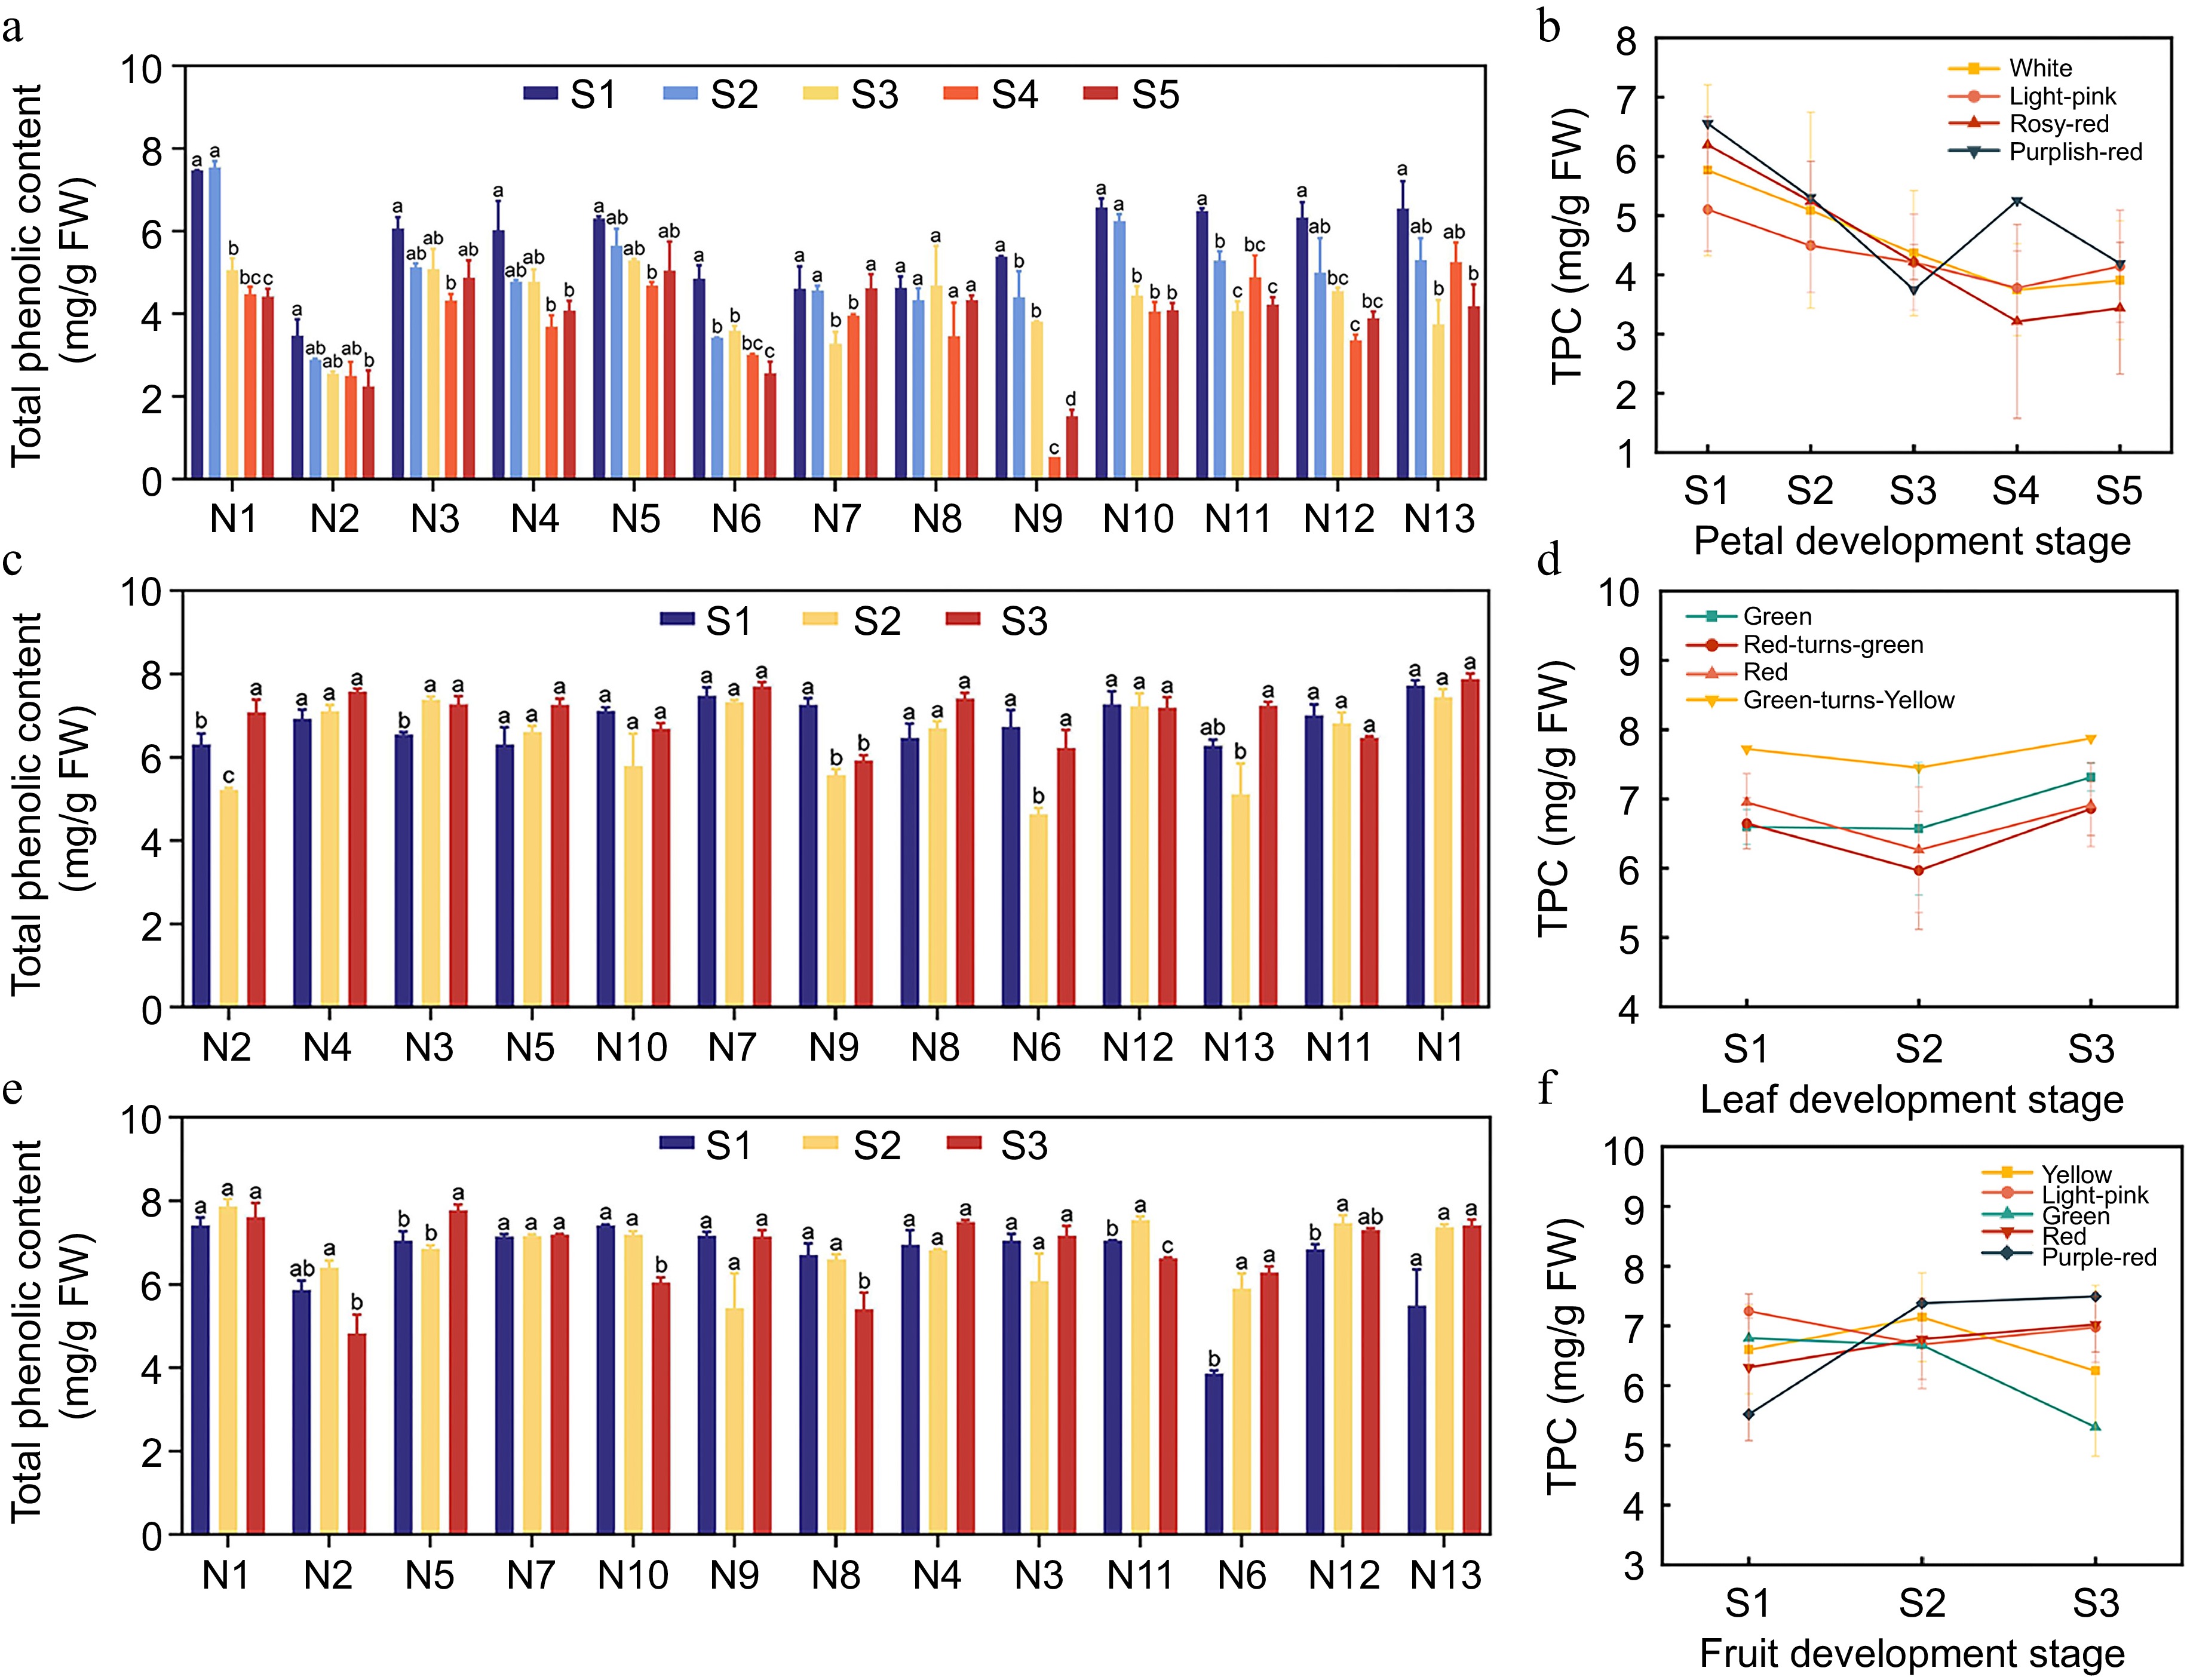
Figure 6.
Total Poiyphenol Content (TPC) in different crabapple germplasm. (a) TPC in various petal development stages. (b) Trends of TPC in petal development. (c) TPC in different leaf development stages. (d) Trends of TPC in leaf development. (e) TPC in various fruit development stages. (f) Trends of TPC in fruit development. Significance markers (a, b, c) in the figure represent the result of pairwise comparisons using the Least Significant Difference (LSD) test at a significance level of p = 0.05.
-
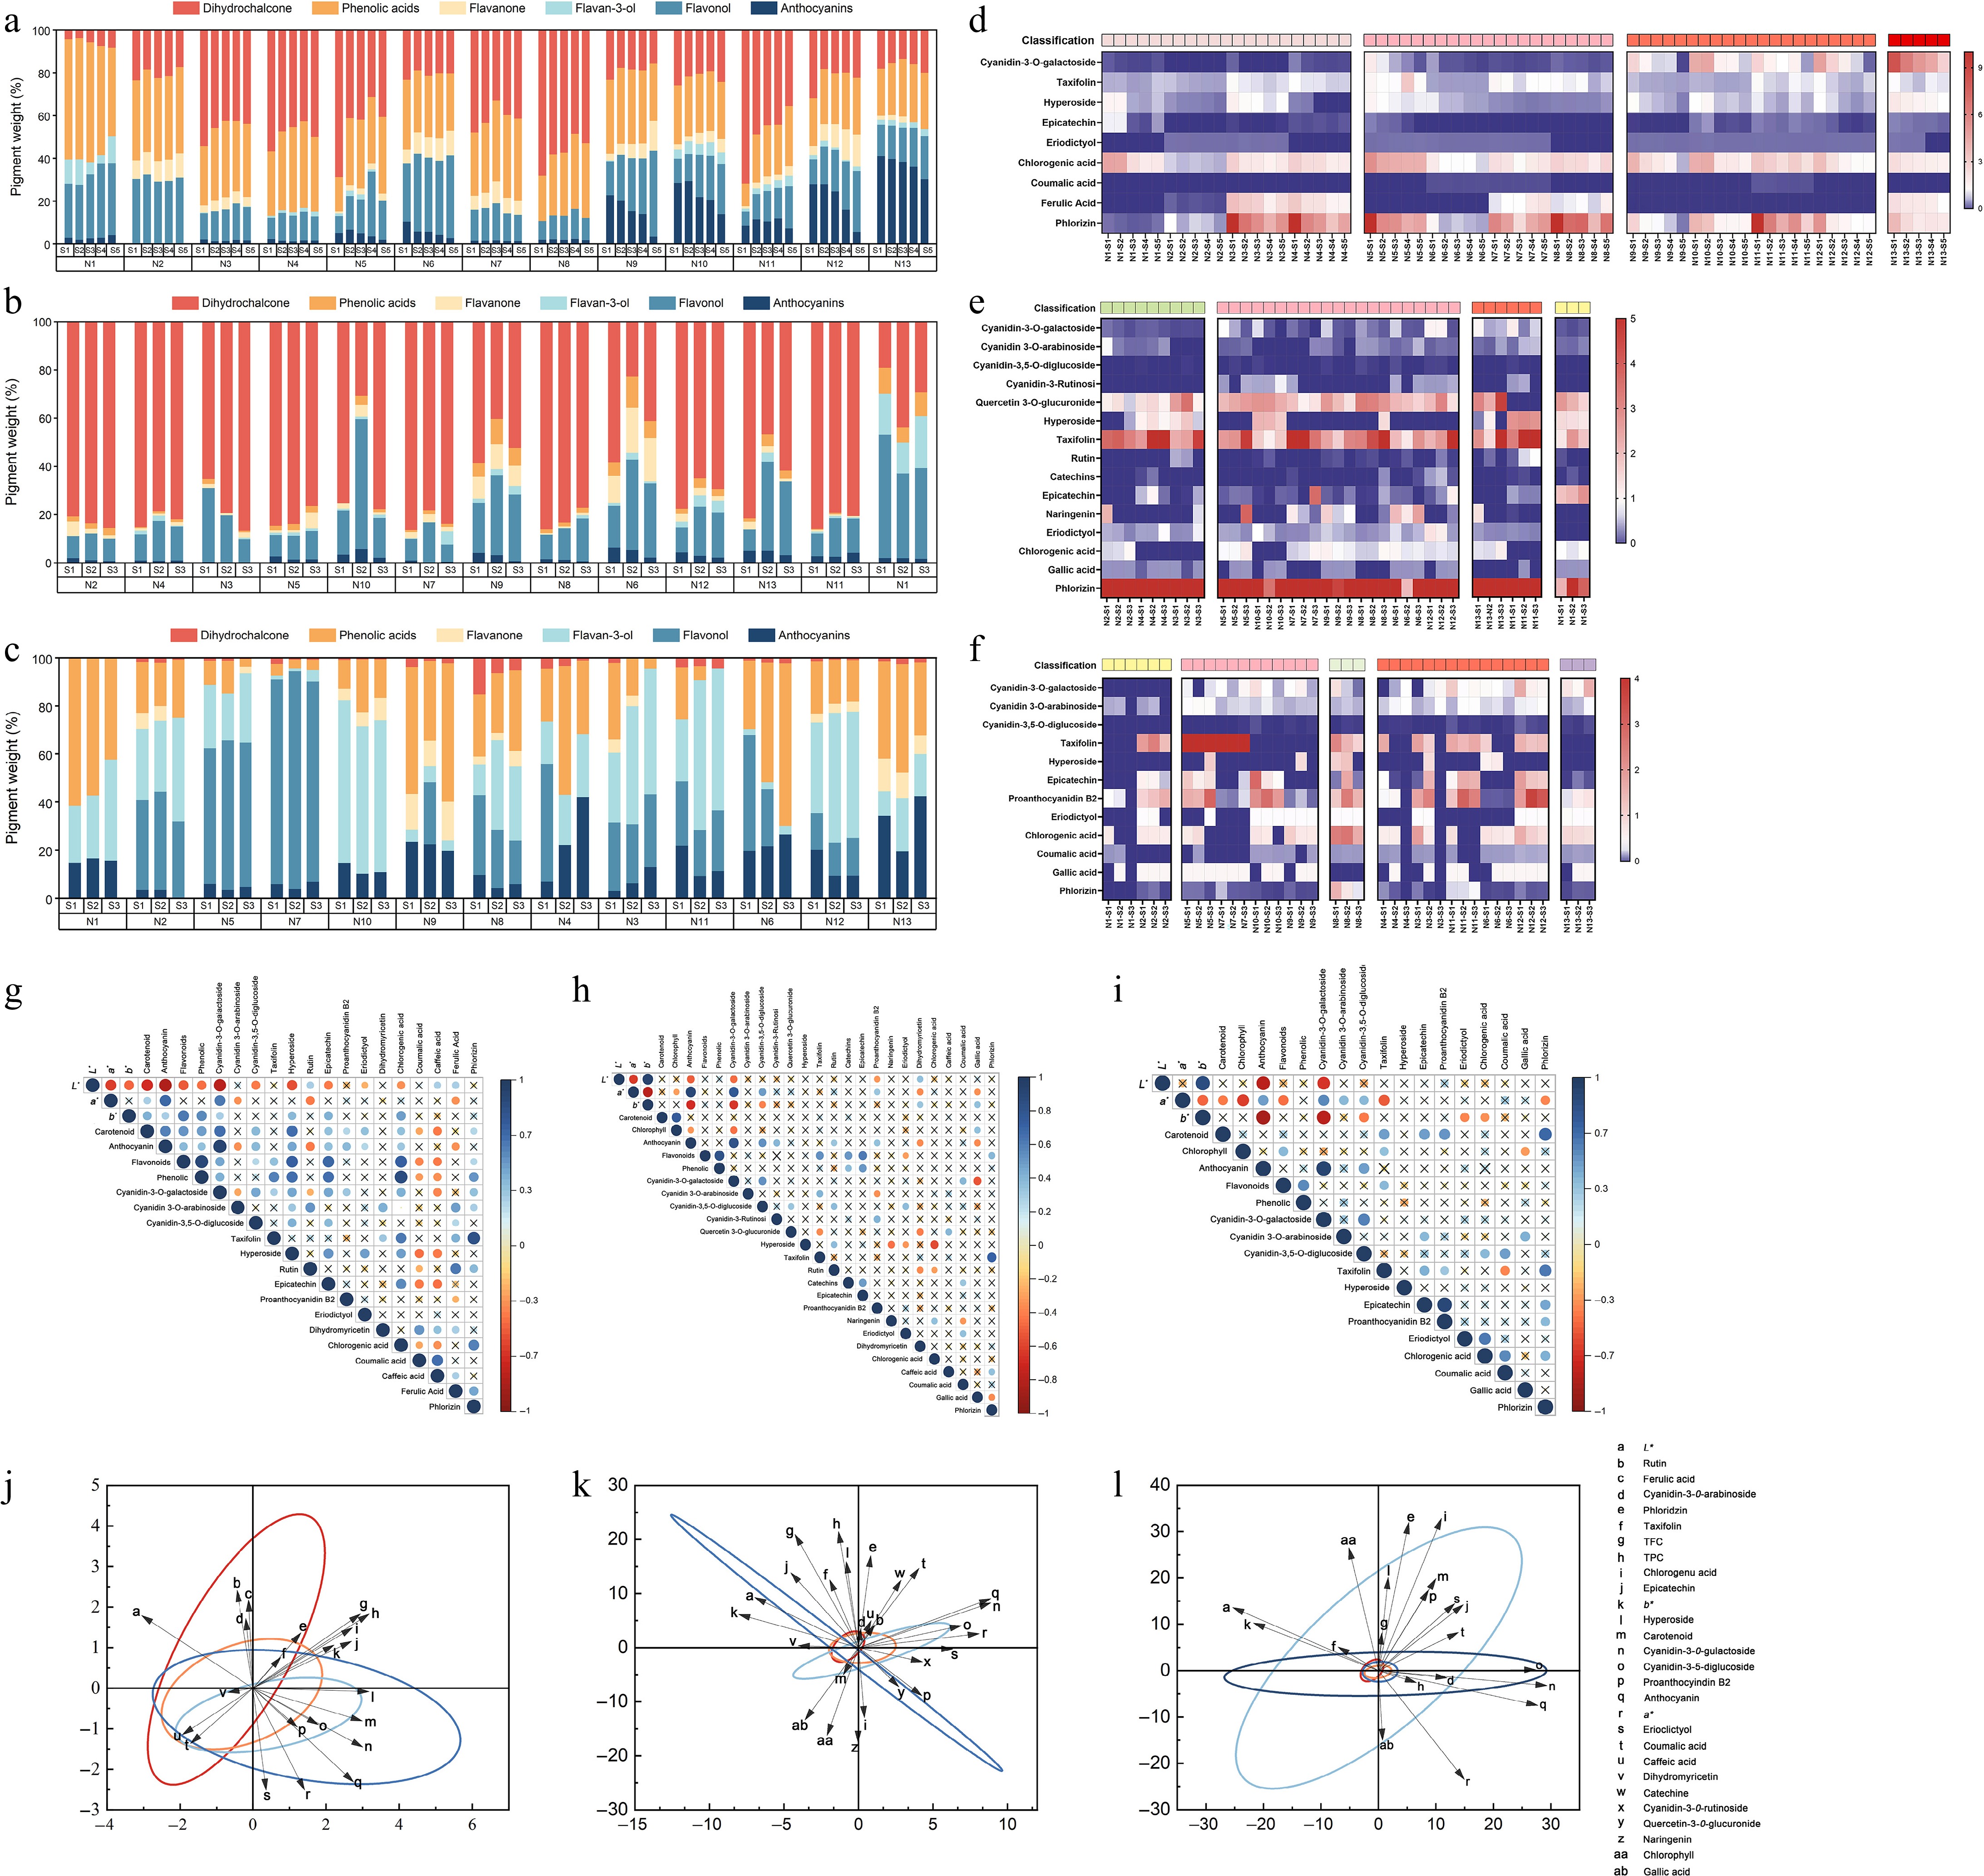
Figure 7.
Correlation analysis of phenol content and pigment content in crabapple. (a) Proportion of phenolic substances in petal. (b) Proportion of phenolic substances in leaf. (c) Proportion of phenolic substances in fruit. (d) Phenolic substances in petal development. (e) Phenolic substances in leaf development. (f) Phenolic substances in fruit development. (g) Petals correlation analysis. (h) Leaves correlation analysis. (i) Fruits correlation analysis. (j) Petals PCA. (k) Leaves PCA. (l) Fruits PCA.
-
Code Scientific name N1 M. 'Huangzhenzhu' N2 M. micromalus N3 M. 'Guifeihong' N4 M. 'Shengdanguo' N5 M. 'Strawberry Parfait' N6 M. 'Profusion' N7 M. halliana N8 M. 'Brandywine' N9 M. 'Red Splender' N10 M. 'Radiant' N11 M. 'Shotizam' N12 M. 'Sparkler' N13 M. 'Royalty' Table 1.
Germplasm information of tested crabapple.
Figures
(7)
Tables
(1)