-
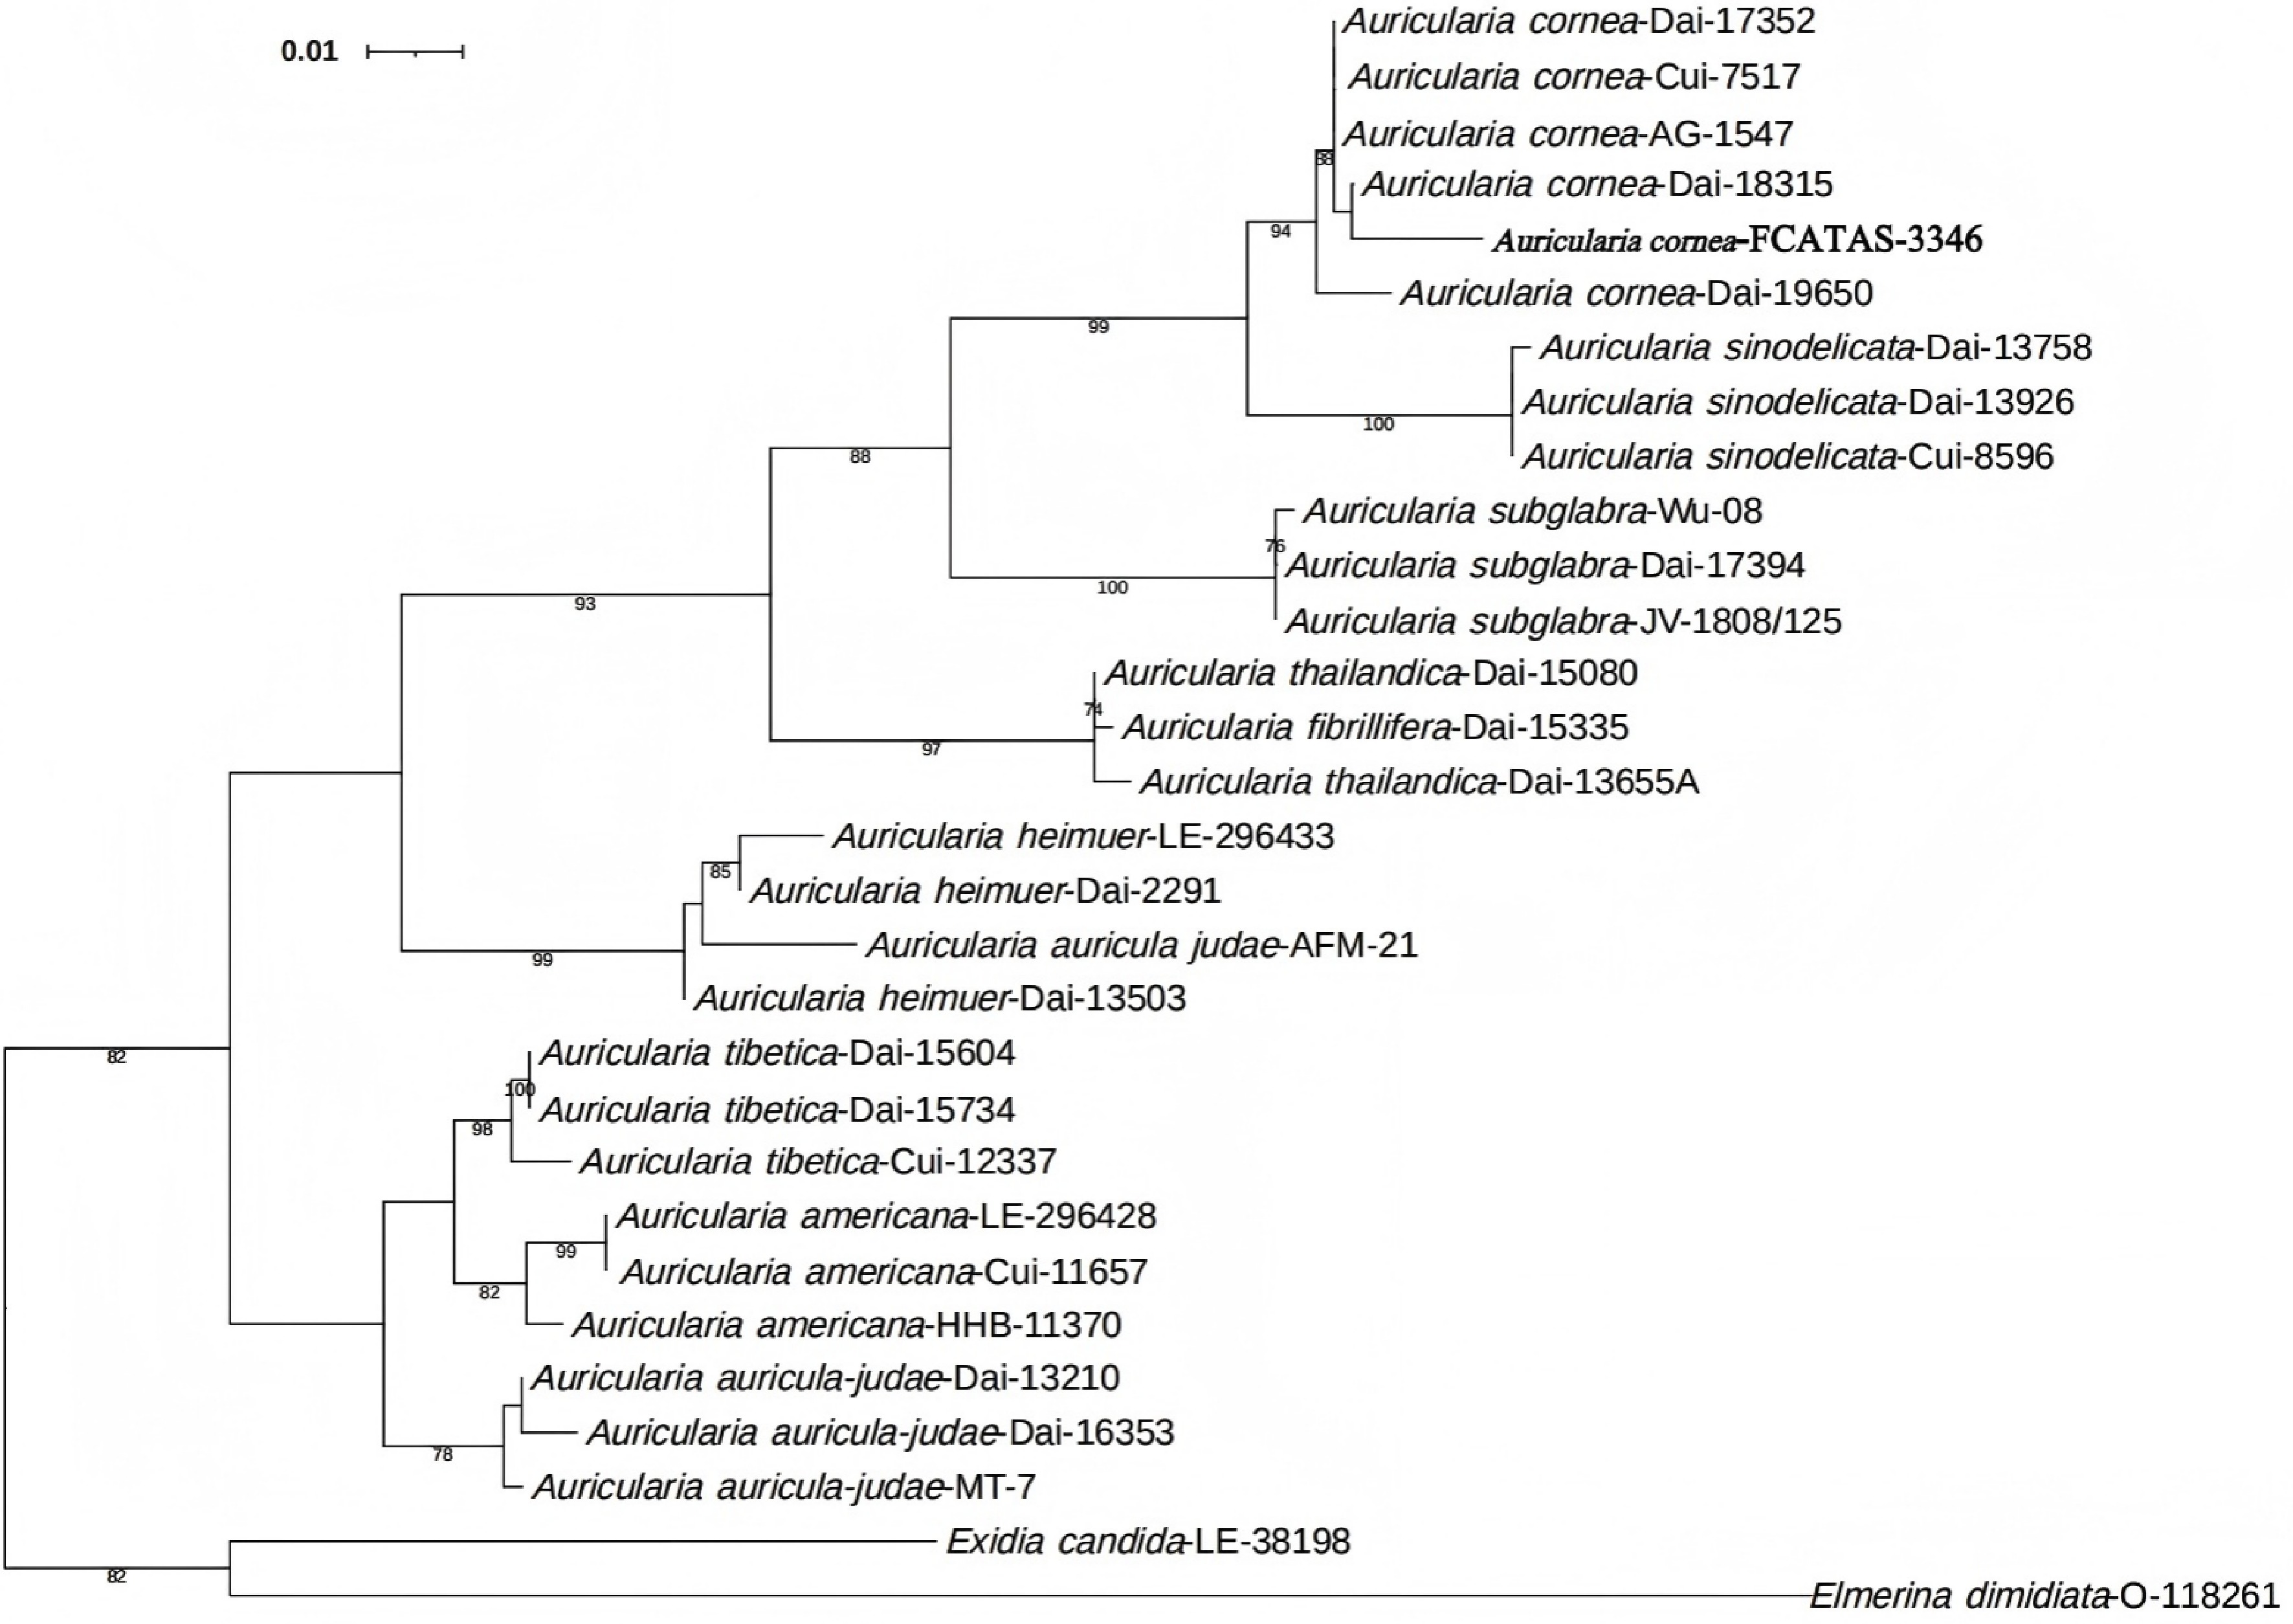
Figure 1.
Phylogenetic tree constructed based on the ITS sequence.
-
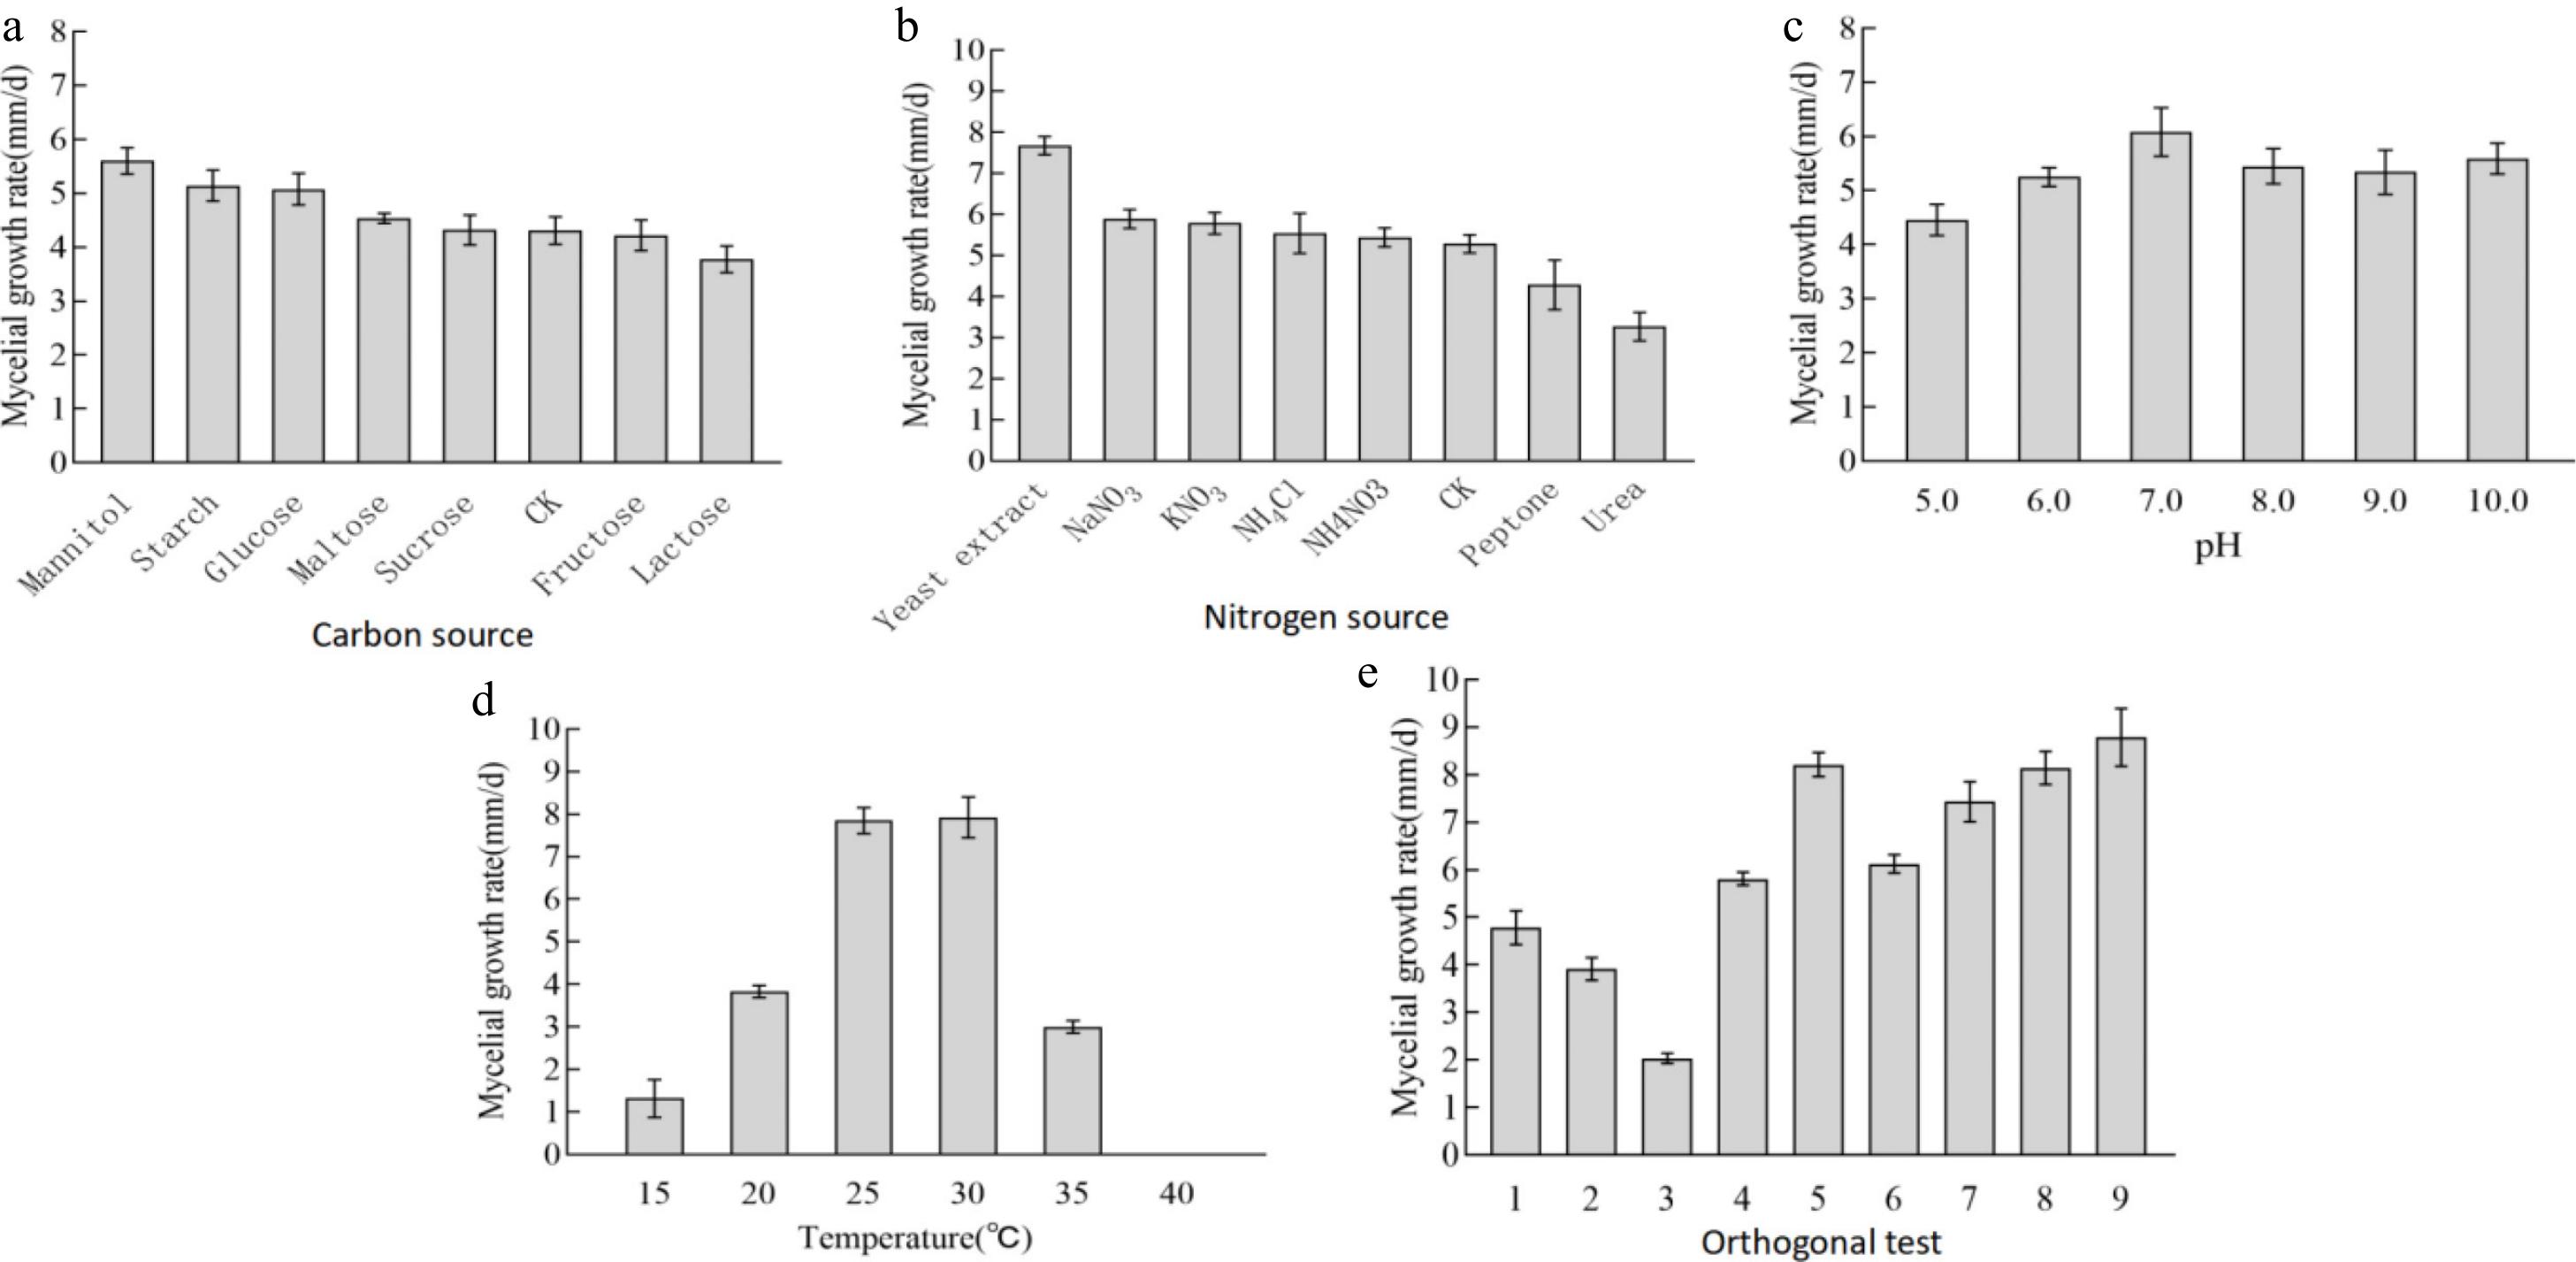
Figure 2.
Mycelial growth rate under single factor and orthogonal conditions. (a) Carbon source; (b) nitrogen source; (c) pH; (d) temperature; (e) orthogonal test.
-
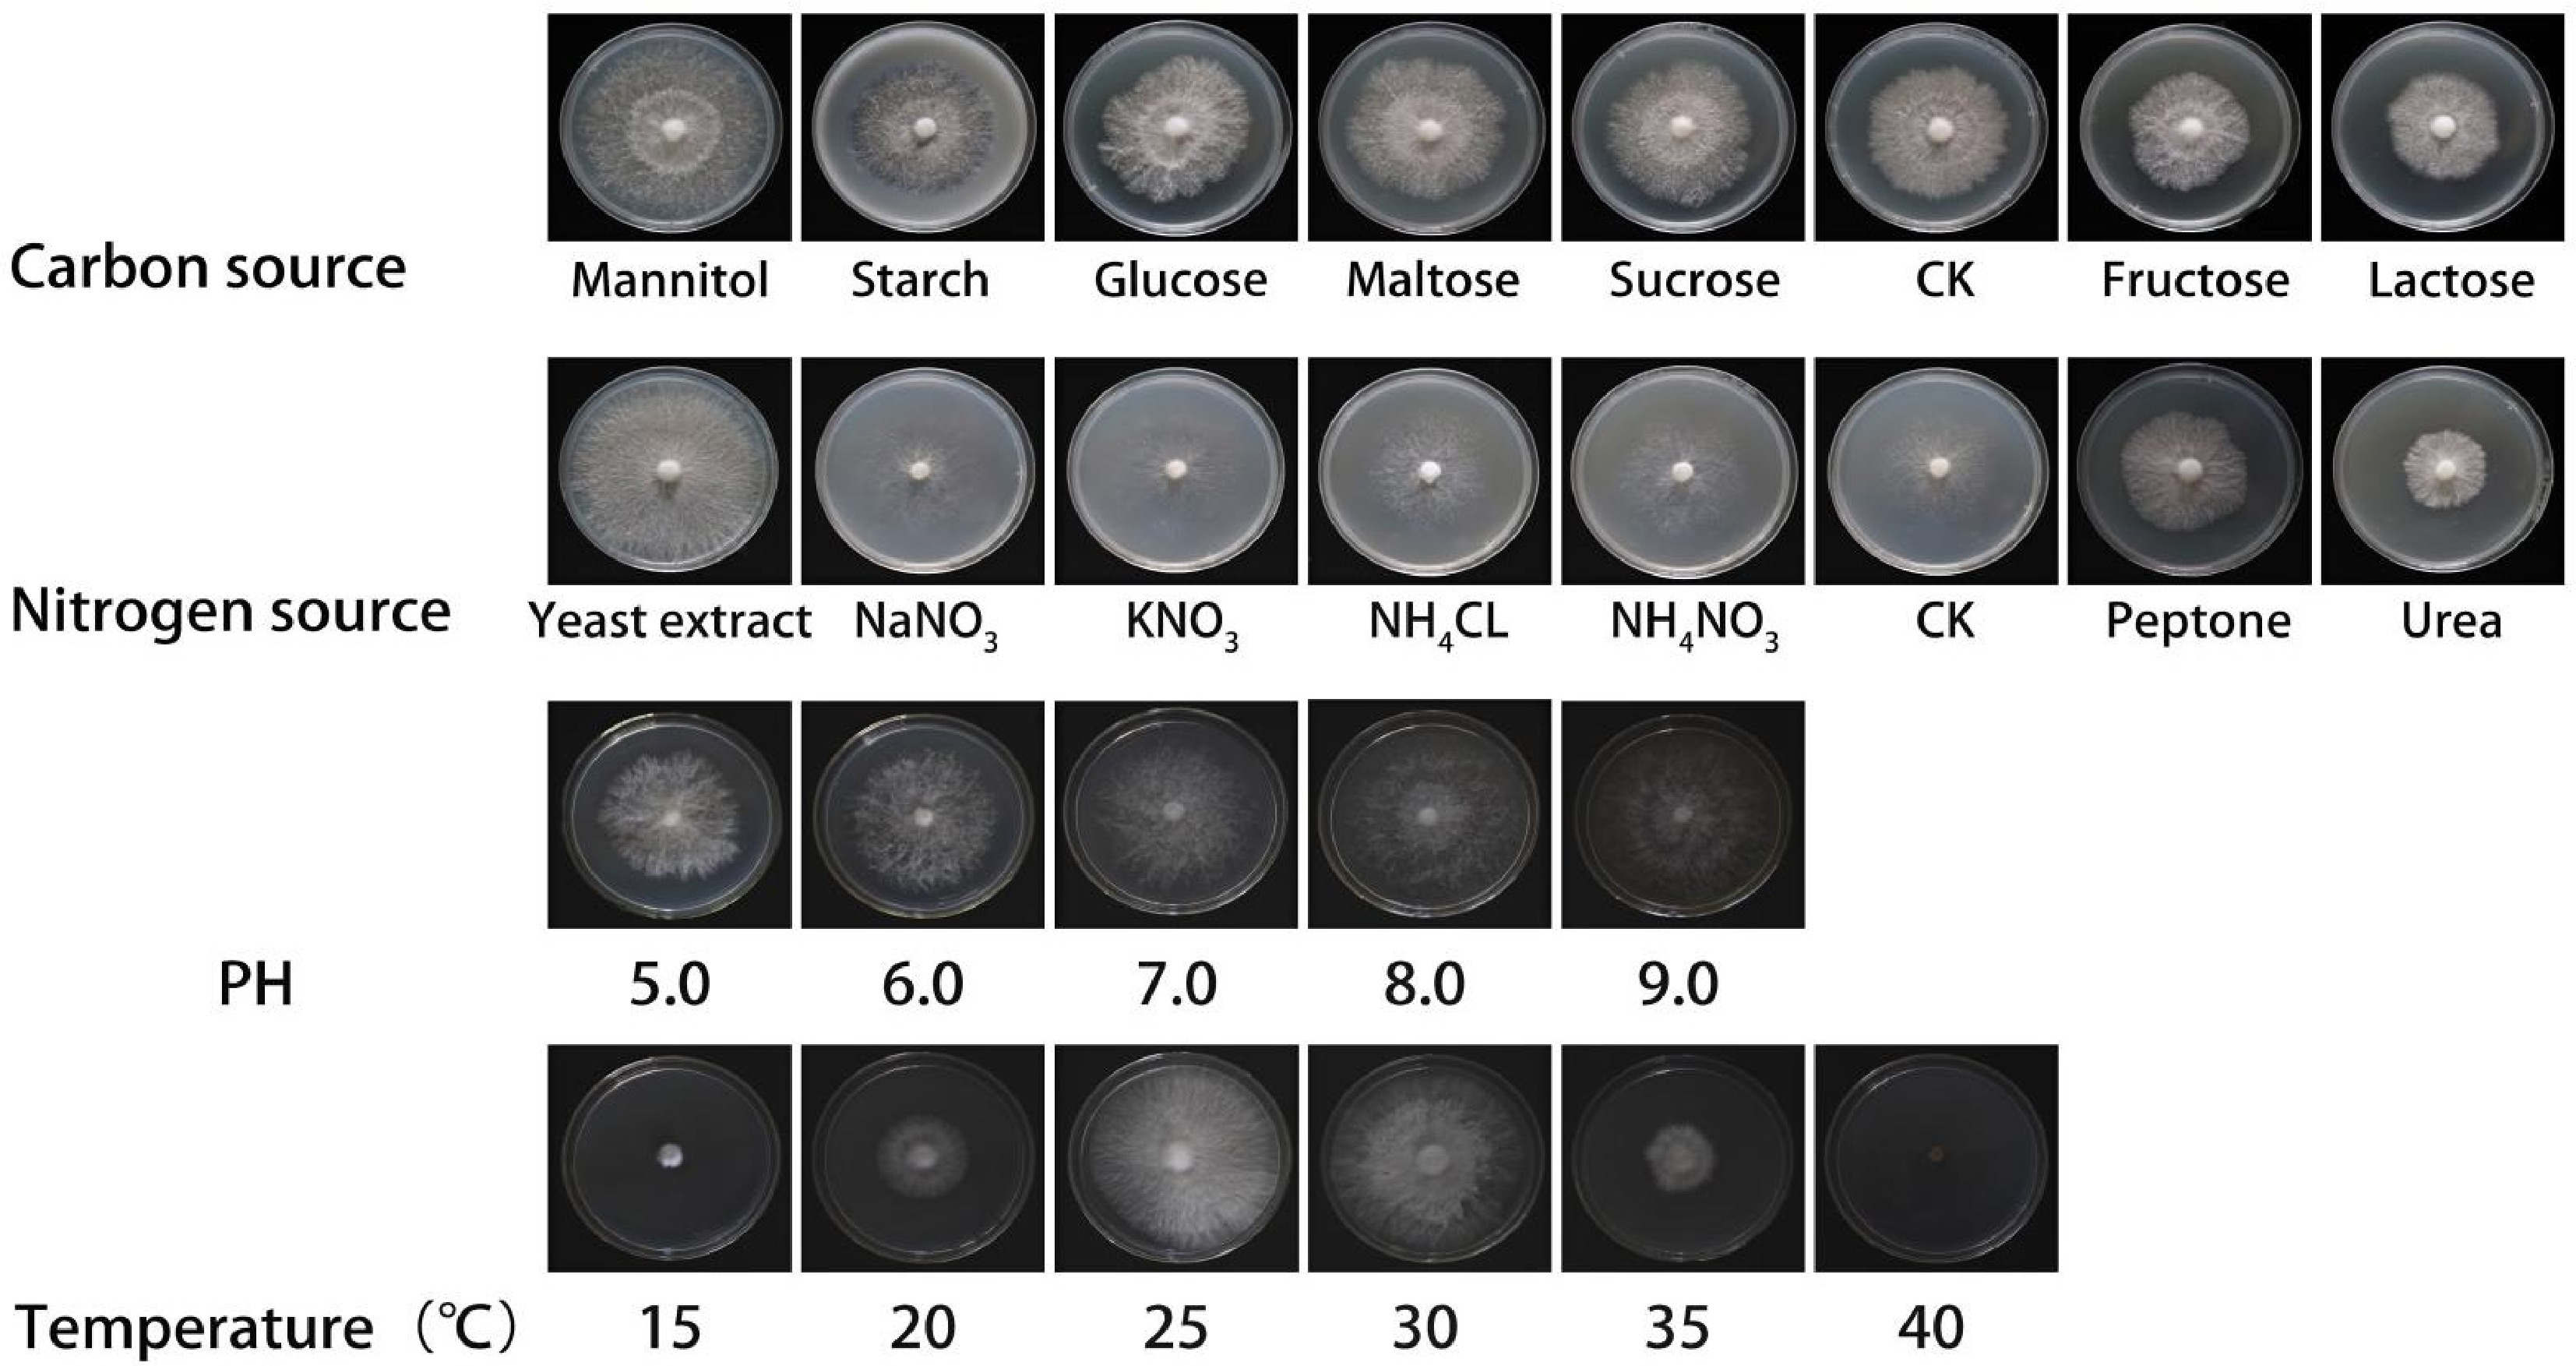
Figure 3.
Effects of different single factor conditions on mycelial growth of A. cornea.
-
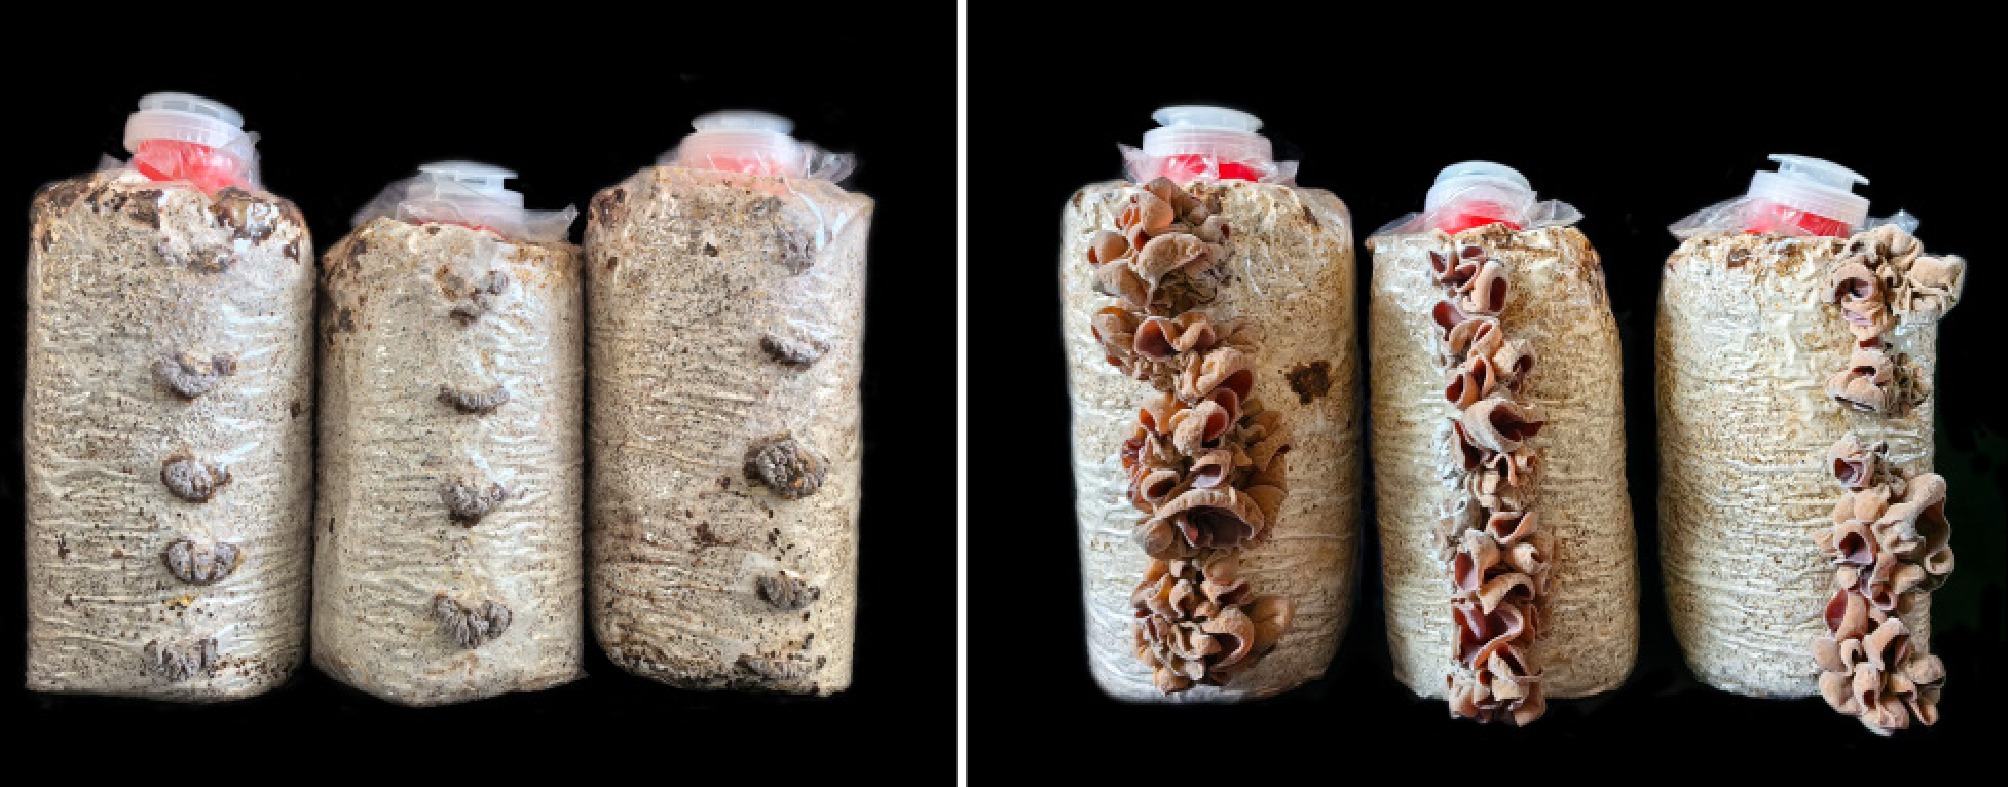
Figure 4.
Primordium and fruiting body of A. cornea.
-
Condition Factor Mycelial growth
rate (mm/d)Mycelial
growth vigorCarbon source Mannitol 5.60 ± 0.10 a ++++ Starch 5.14 ± 0.12 b +++ Glucose 5.08 ± 0.12 b +++ Maltose 4.54 ± 0.04 c +++ Sucrose 4.32 ± 0.11 c +++ CK 4.31 ± 0.10 c +++ Nitrogen source Fructose 4.22 ± 0.16 c +++ Lactose 3.78 ± 0.10 d ++ Yeast extract powder 7.68 ± 0.09 a ++++ NaNO3 5.89 ± 0.09 b +++ KNO3 5.78 ± 0.11 bc +++ NH4Cl 5.54 ± 0.20 bcd +++ NH4NO3 5.44 ± 0.09 cd +++ CK 5.28 ± 0.09 d +++ Peptone 4.28 ± 0.25 e +++ Urea 3.27 ± 0.14 f ++ pH 5.0 4.46 ± 0.12 c +++ 6.0 5.25 ± 0.07 b +++ 7.0 6.08 ± 0.18 a ++++ 8.0 5.45 ± 0.13 b +++ 9.0 5.34 ± 0.16 b +++ 10.0 5.59 ± 0.12 b +++ Temperature (°C) 15 1.32 ± 0.18 d + 20 3.83 ± 0.06 b ++ 25 7.85 ± 0.12 a +++ 30 7.93 ± 0.20 a ++++ 35 3.00 ± 0.06 c ++ 40 0 e − −, no growth; +, very weak growth; ++, weak growth; +++, vigorous growth; ++++, very vigorous growth. Different lowercase and uppercase letters in the same column represent significant differences (p < 0.05). The same below. Table 1.
Effects of different single factor conditions on mycelial growth.
-
Test no. Factor Mycelial growth rate (mm/d) Temperature
(°C)Mannitol
(g/L)Yeast extract
(g/L)pH 1 20 1.0 0.1 7.0 4.79 ± 0.14 e 2 20 3.0 0.3 8.0 3.91 ± 0.10 f 3 20 2.0 0.5 9.0 2.04 ± 0.05 g 4 25 3.0 0.1 9.0 5.81 ± 0.06 d 5 25 2.0 0.3 7.0 8.21 ± 0.10 b 6 25 1.0 0.5 8.0 6.13 ± 0.08 d 7 30 2.0 0.1 8.0 7.43 ± 0.17 c 8 30 1.0 0.3 9.0 8.14 ± 0.14 b 9 30 3.0 0.5 7.0 8.79 ± 0.25 a S1 10.74 19.06 18.03 22.79 S2 20.15 17.68 20.26 17.47 S3 24.36 18.51 16.96 15.99 K1 3.580 6.353 6.010 7.597 K2 6.717 5.893 6.753 5.823 K3 8.120 6.170 5.653 5.330 R 4.540 0.460 1.100 2.267 S: standard deviation; K: kurtosis; R: range. Different lowercase and uppercase letters in the same column represent significant differences (p < 0.05). Table 2.
Orthogonal test results of A. cornea.
-
Source Type III sum
of squaresdf Mean square F value Significance Model 244.368 8 30.546 279.369 0 Intercept 2036.406 1 2036.406 18624.653 0 Temperature 194.793 2 97.396 890.773 0 Carbon source 11.496 2 5.748 52.57 0 Nitrogen source 1.931 2 0.965 8.83 0.001 pH 36.148 2 18.074 165.303 0 Error 4.92 45 0.109 Total 2285.694 54 Corrected total 249.288 53 Model coefficient of determination R2 = 0.980, adjusted coefficient of determination R2 = 0.977. Table 3.
Variance analysis of orthogonal tests.
-
Ingredient FS3346 Ingredient FS3346 Phe 0.17 Ser 0.17 Met 0.03 Asp 0.46 Lys 0.12 His 0.08 Leu 0.32 EAA 1.34 Thr 0.23 NEAA 2.35 Val 0.29 TAA 3.7 Ile 0.18 MAA 1.56 Cys 0.02 UAA 1.63 Ala 0.42 SAA 1.35 Pro 0.36 BAA 1.36 Gly 0.05 Crude fat 2.3 Glu 0.41 Crude fiber 15.5 Arg 0.29 Ash 2.8 Tyr 0.09 Crude polysaccharides 2.93 EAA: essential amino acids; NEAA: non essential amino acids; TAA: total amino acids; MAA: medicinal amino acids; UAA: Umami amino acids; SAA: Sweet amino acids; BAA: Bitter amino acids. Table 4.
Nutritional composition of A. cornea (%).
-
Amino acid FAO/WHO
pattern spectrumWhole egg white
pattern spectrumAAS CS ILe 4% 6.6% 4.5% 2.72% Leu 7% 8.8% 4.57% 3.64% Lys 5.5% 6.4% 2.18% 1.87% Met + Cys 3.5% 5.5% 1.42% 0.91% Phe + Tyr 6% 10% 4.33% 2.60% Thr 4% 5.1% 5.75% 4.51% Val 5% 7.3% 5.8% 3.97% AAS: chemical score; CS: chemical score. Table 5.
Comparison of amino acid scores of proteins and chemical scores of proteins in A. cornea.
Figures
(4)
Tables
(5)