-
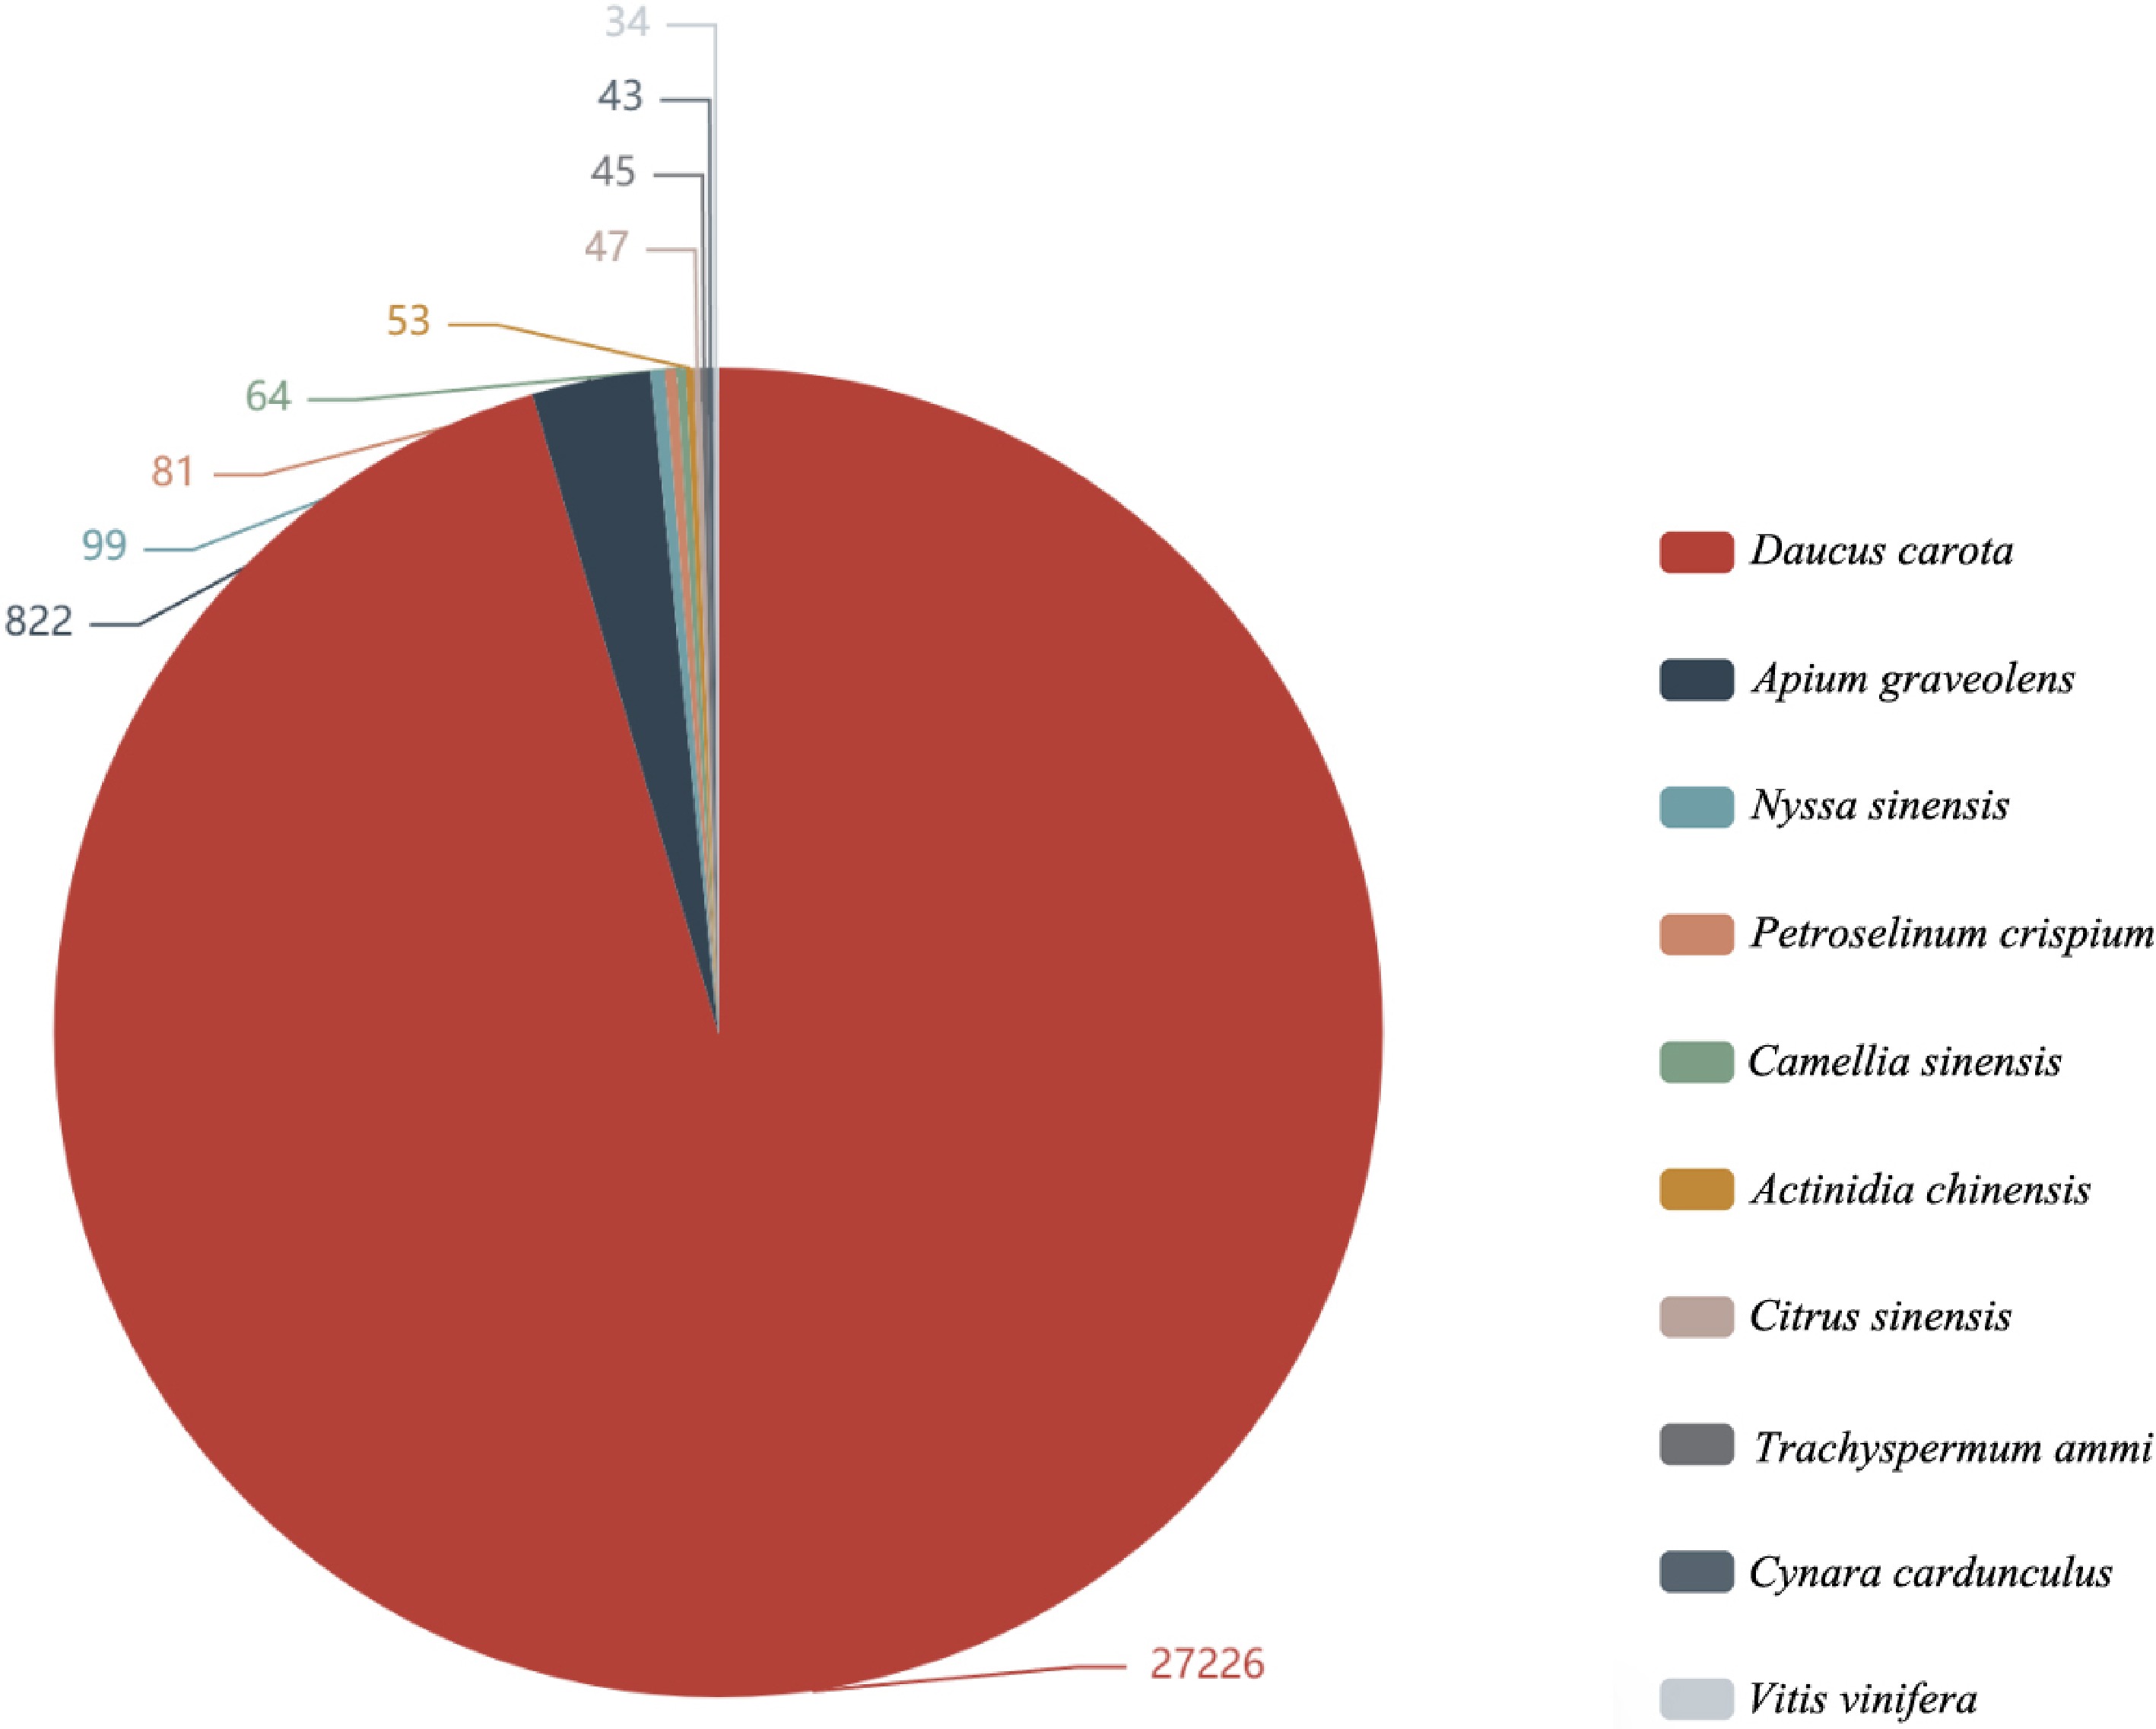
Figure 1.
Nr annotated species distribution map of Apium graveolens. The top 10 species with the most comparison was counted, different colors represent different species. The number represents the number of different species in the Nr database, and species distribution of BLAST hits for each unigenes with a cut-off of 1E−5.
-
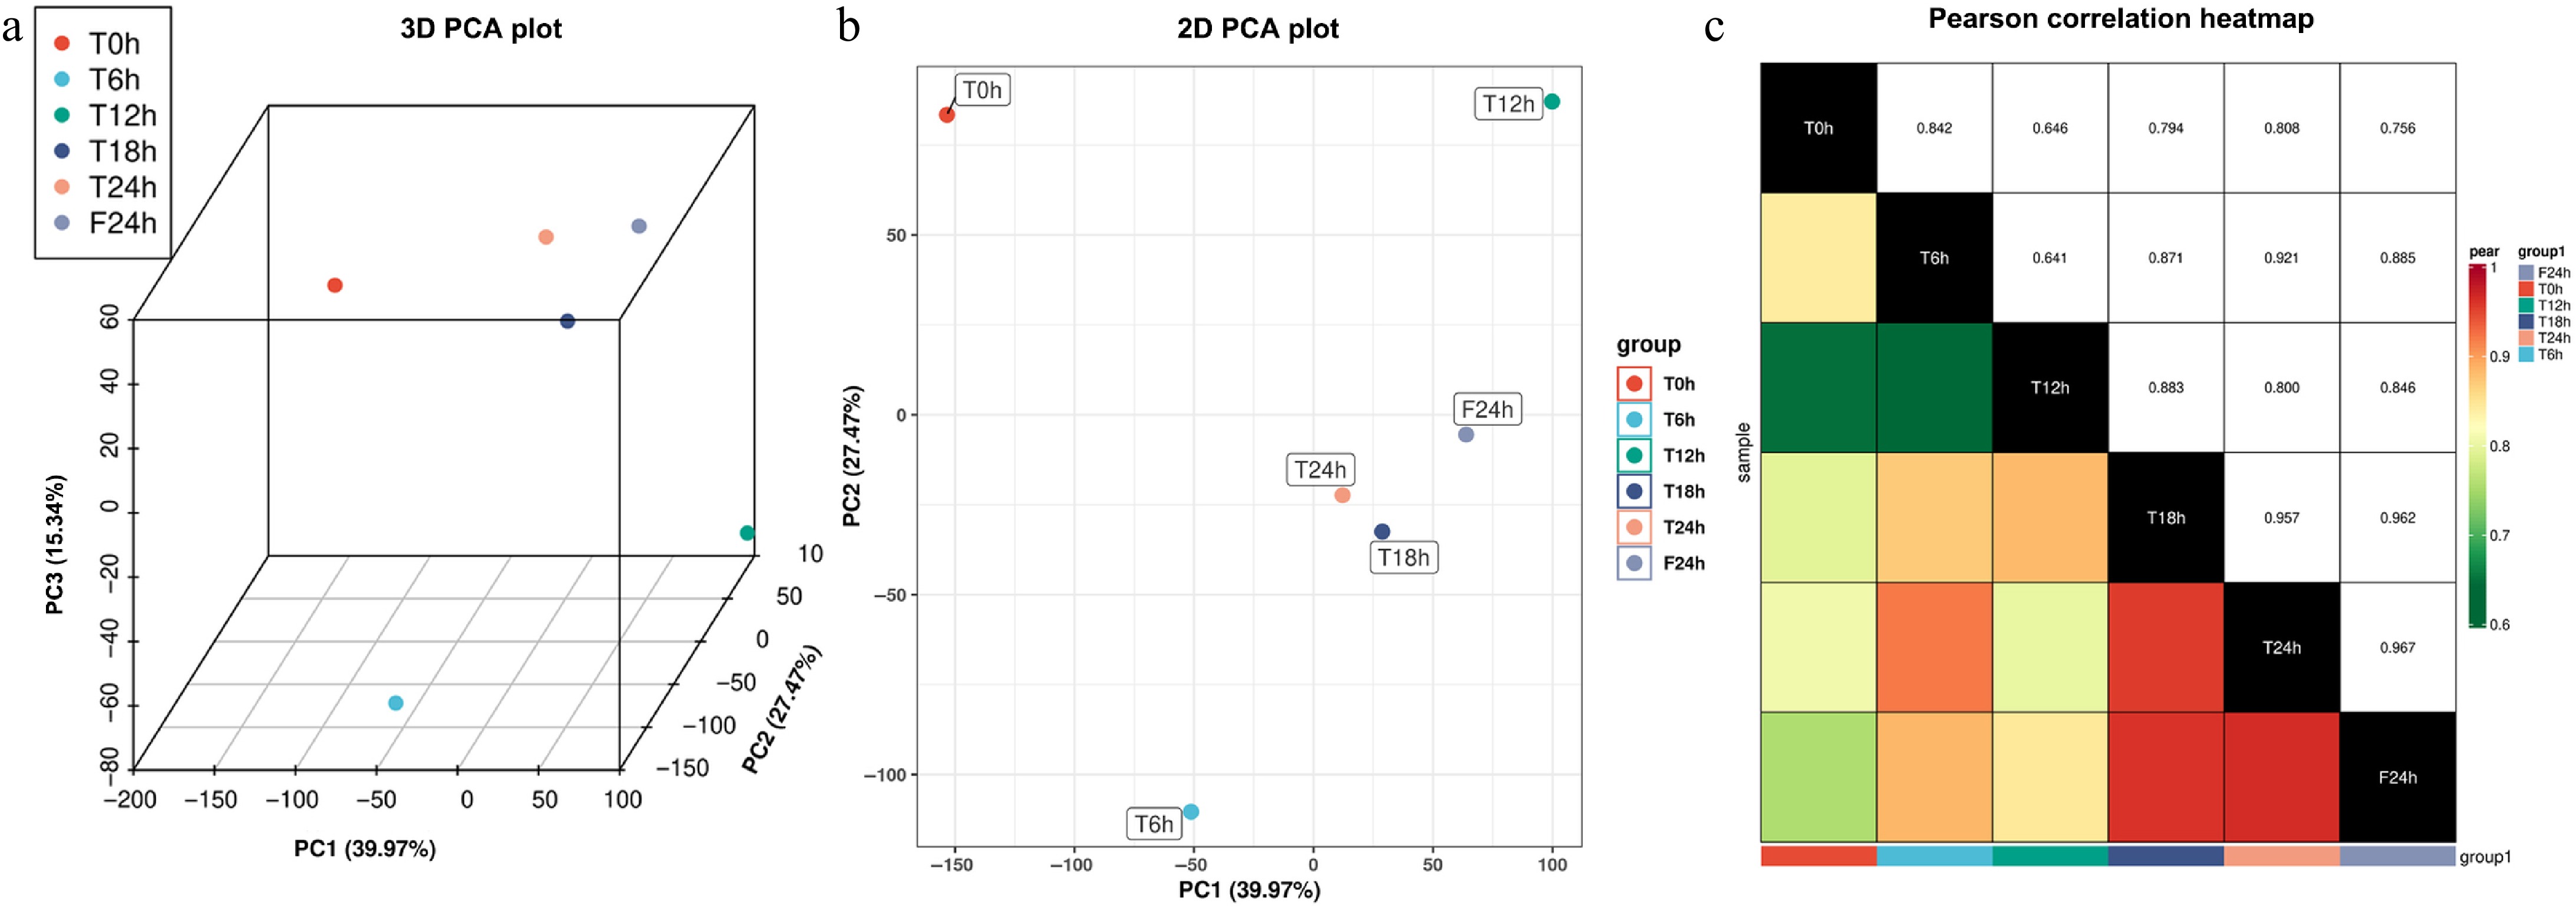
Figure 2.
Pearson correlation analysis of celery transcriptome responses of different photoperiodic treatments and sampling time points. (a) 3D PCA plot. (b) 2D PCA plot. (c) Pearson correlation heatmap.
-
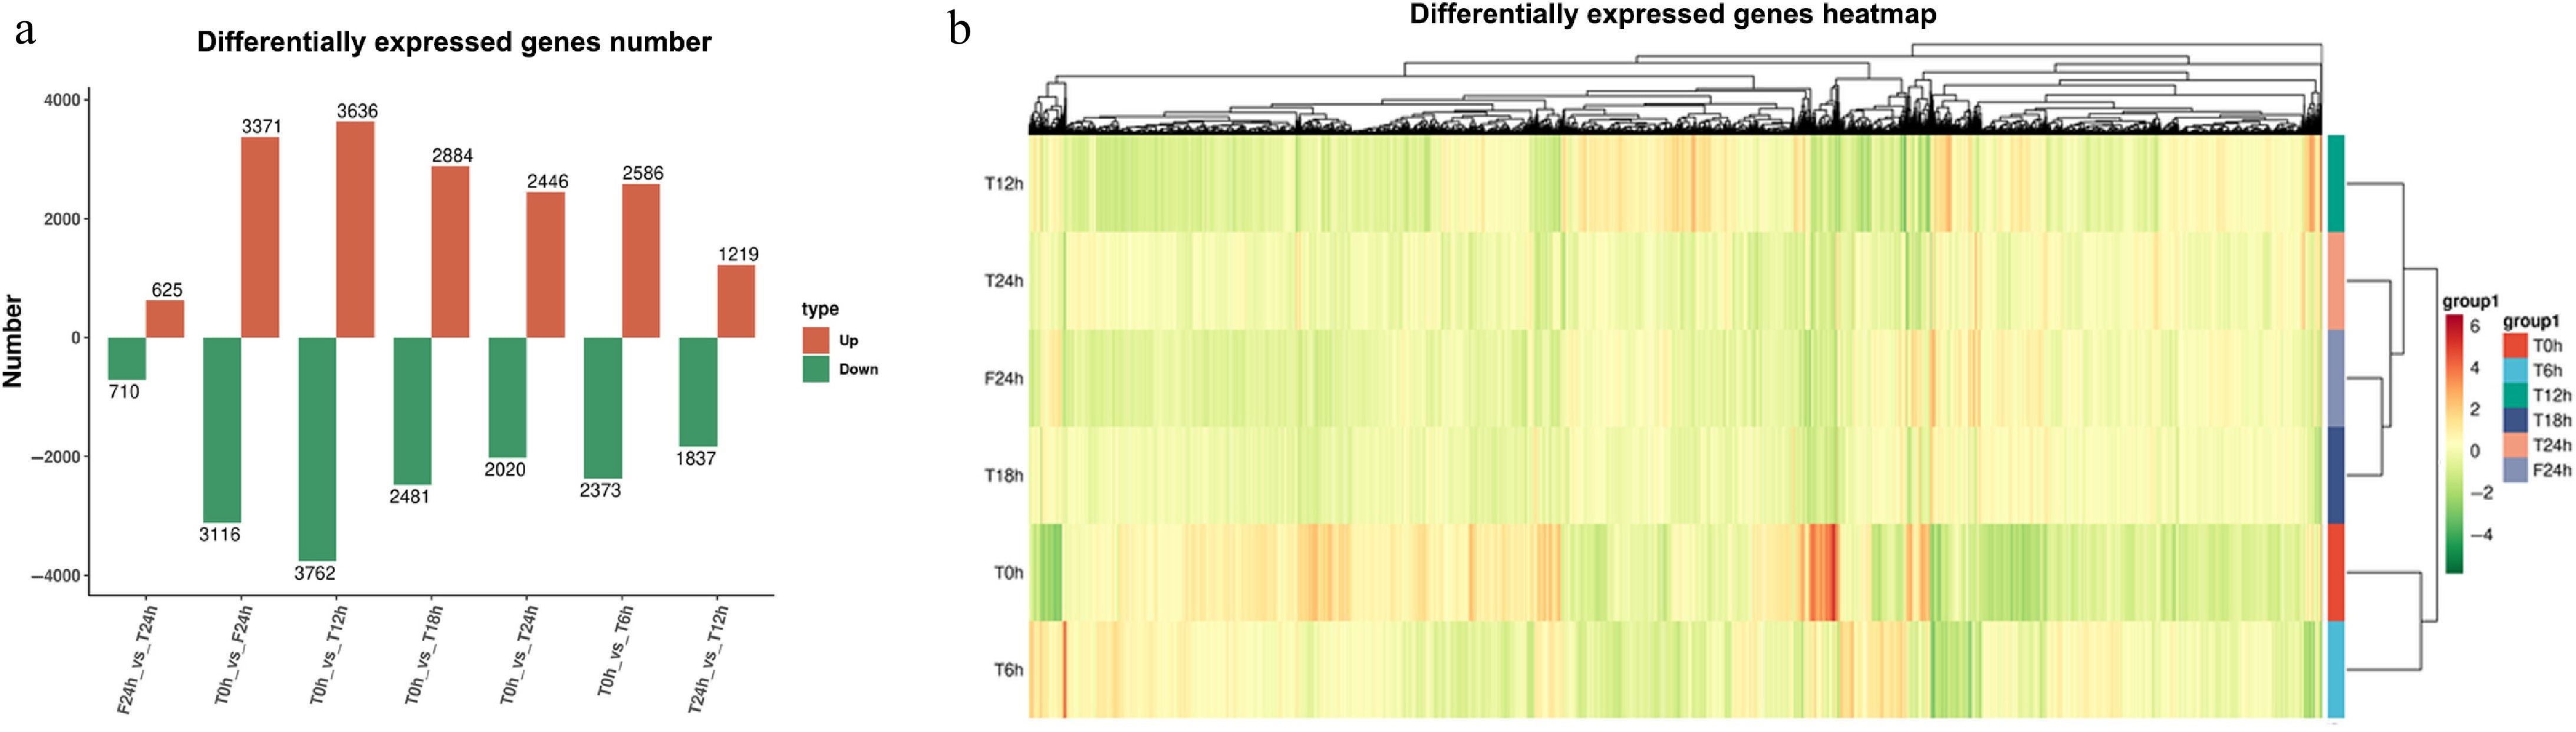
Figure 3.
Statistical analysis of celery transcriptome responses of different photoperiodic treatments and sampling time points. (a) Differentially expressed gene number. (b) Differentially expressed gene heatmap.
-
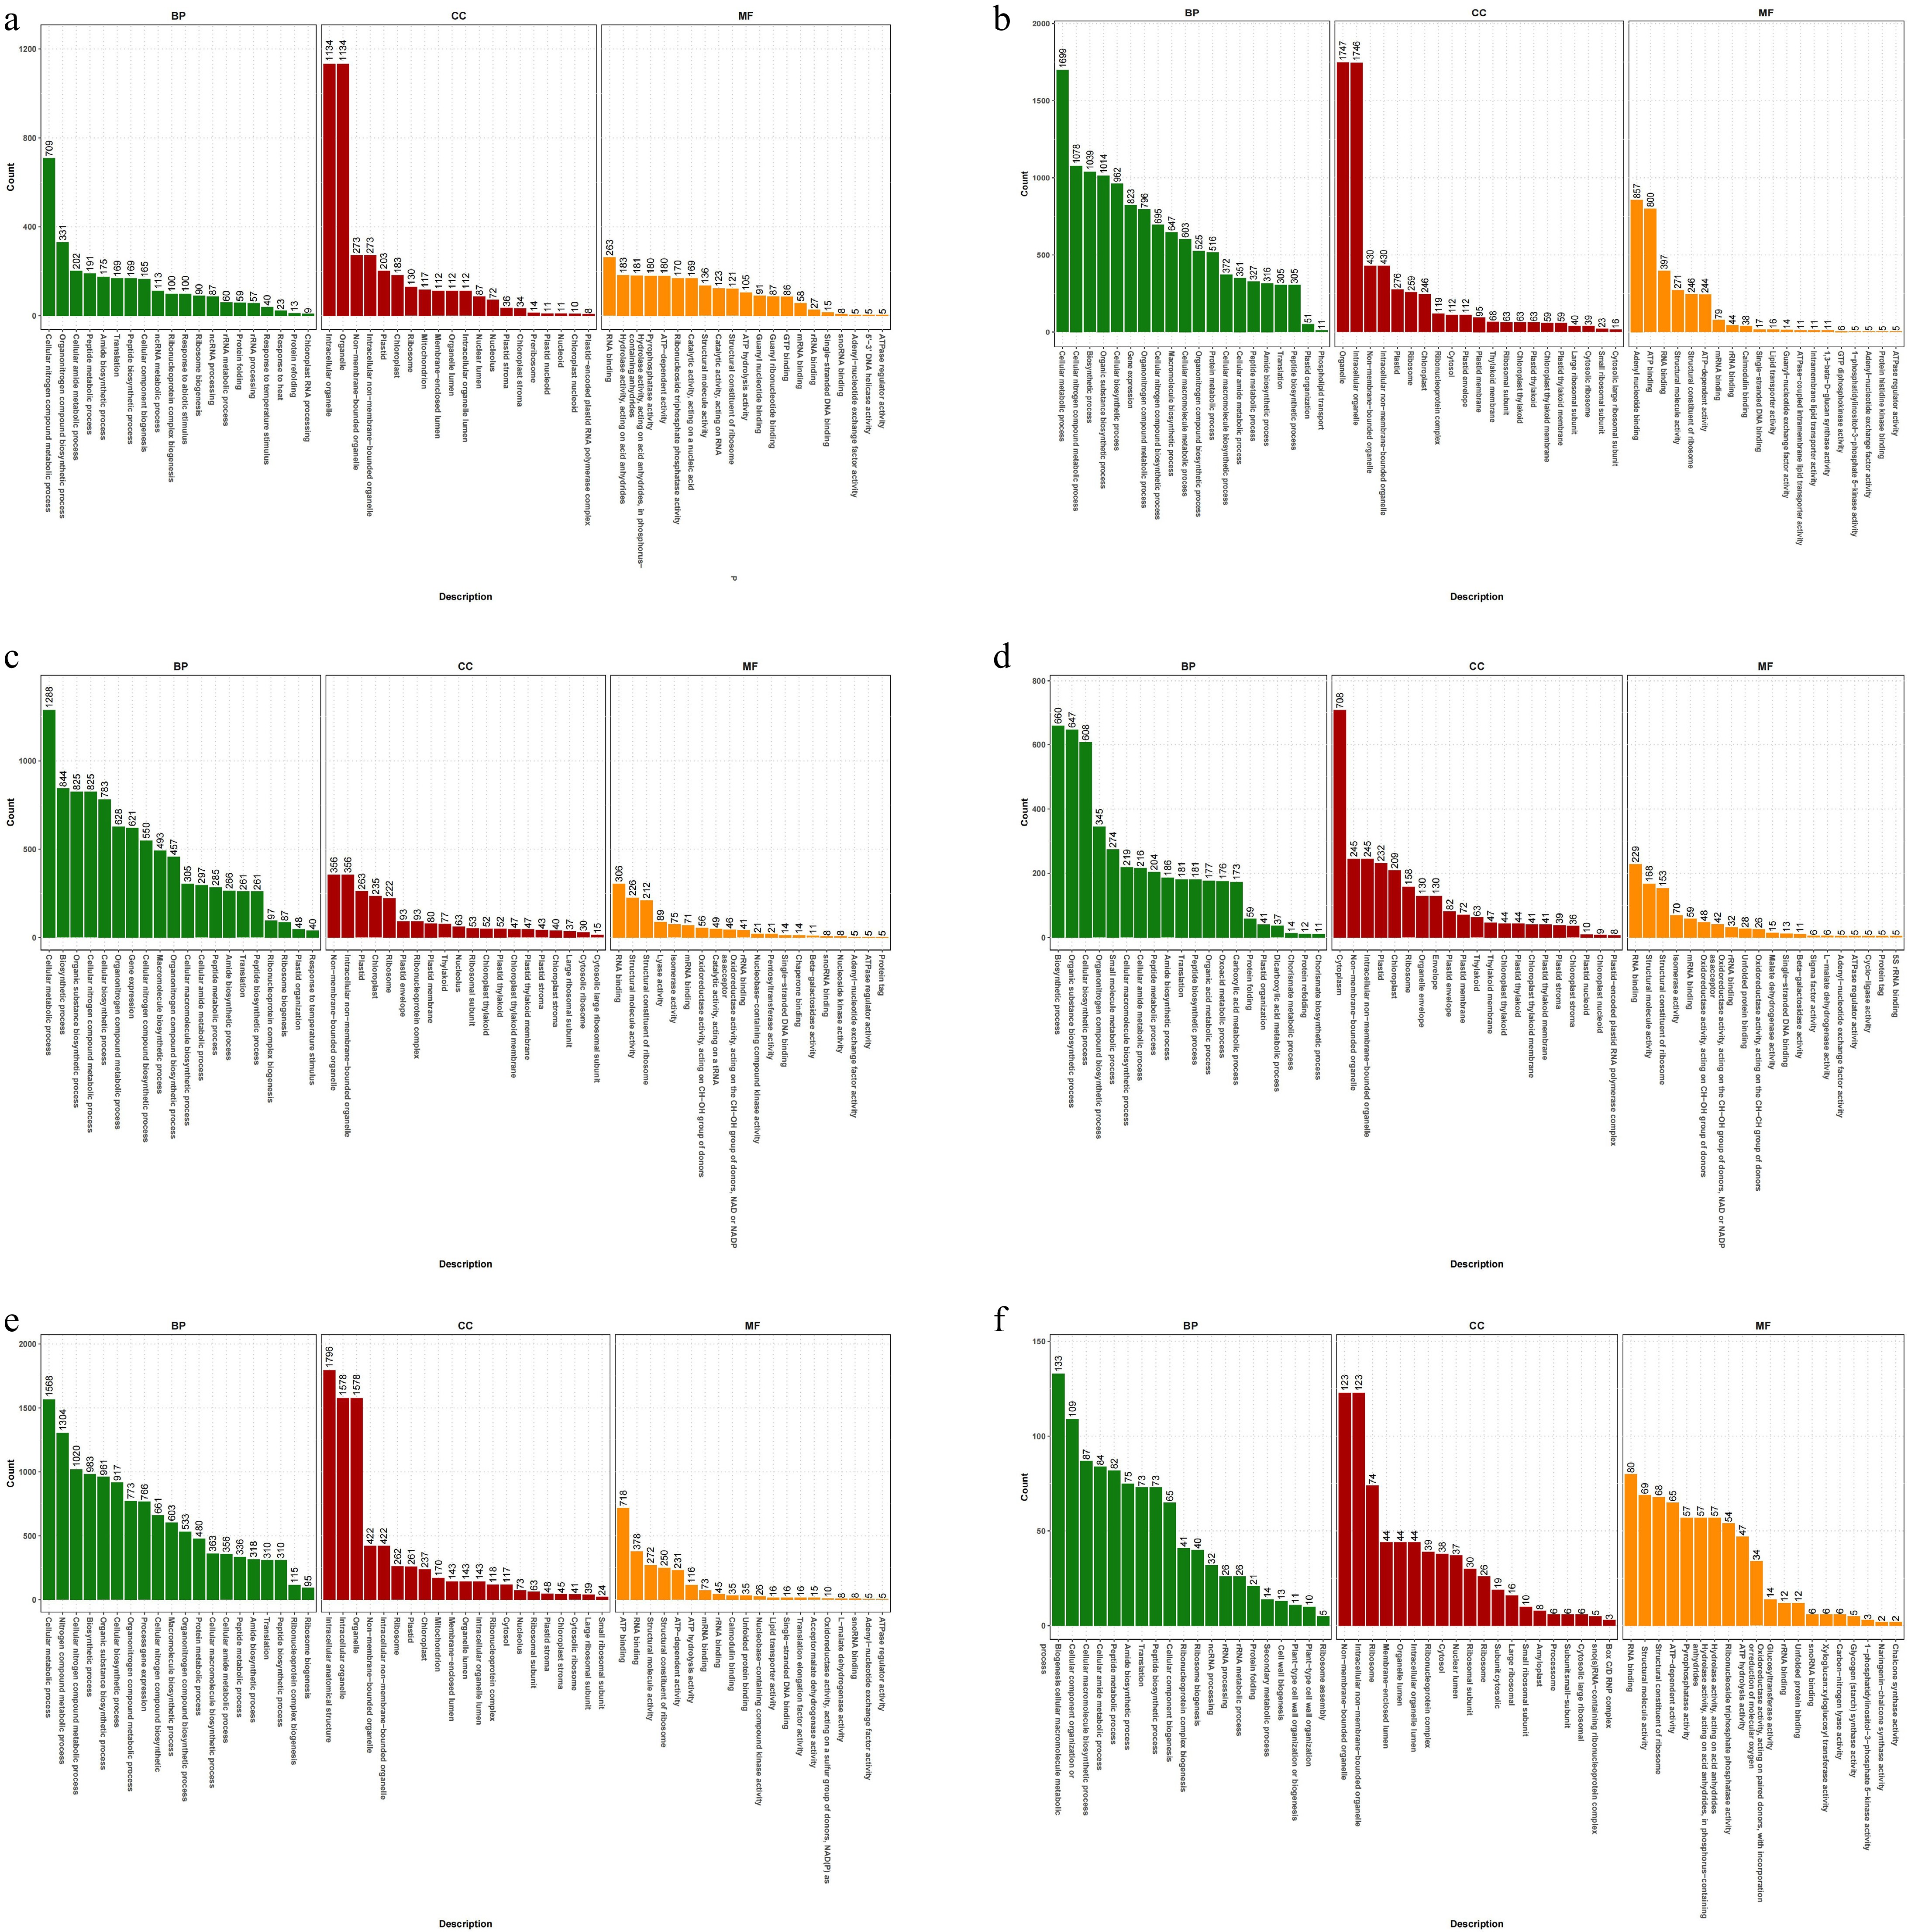
Figure 4.
GO annotation of celery DEGs of different photoperiodic treatments and sampling time points. (a) T0h vs T6h. (b) T0h vs T12h. (c) T0h vs T18h. (d) T0h vs T24h. (e) T0h vs F24h. (f) T24h vs F24h.
-
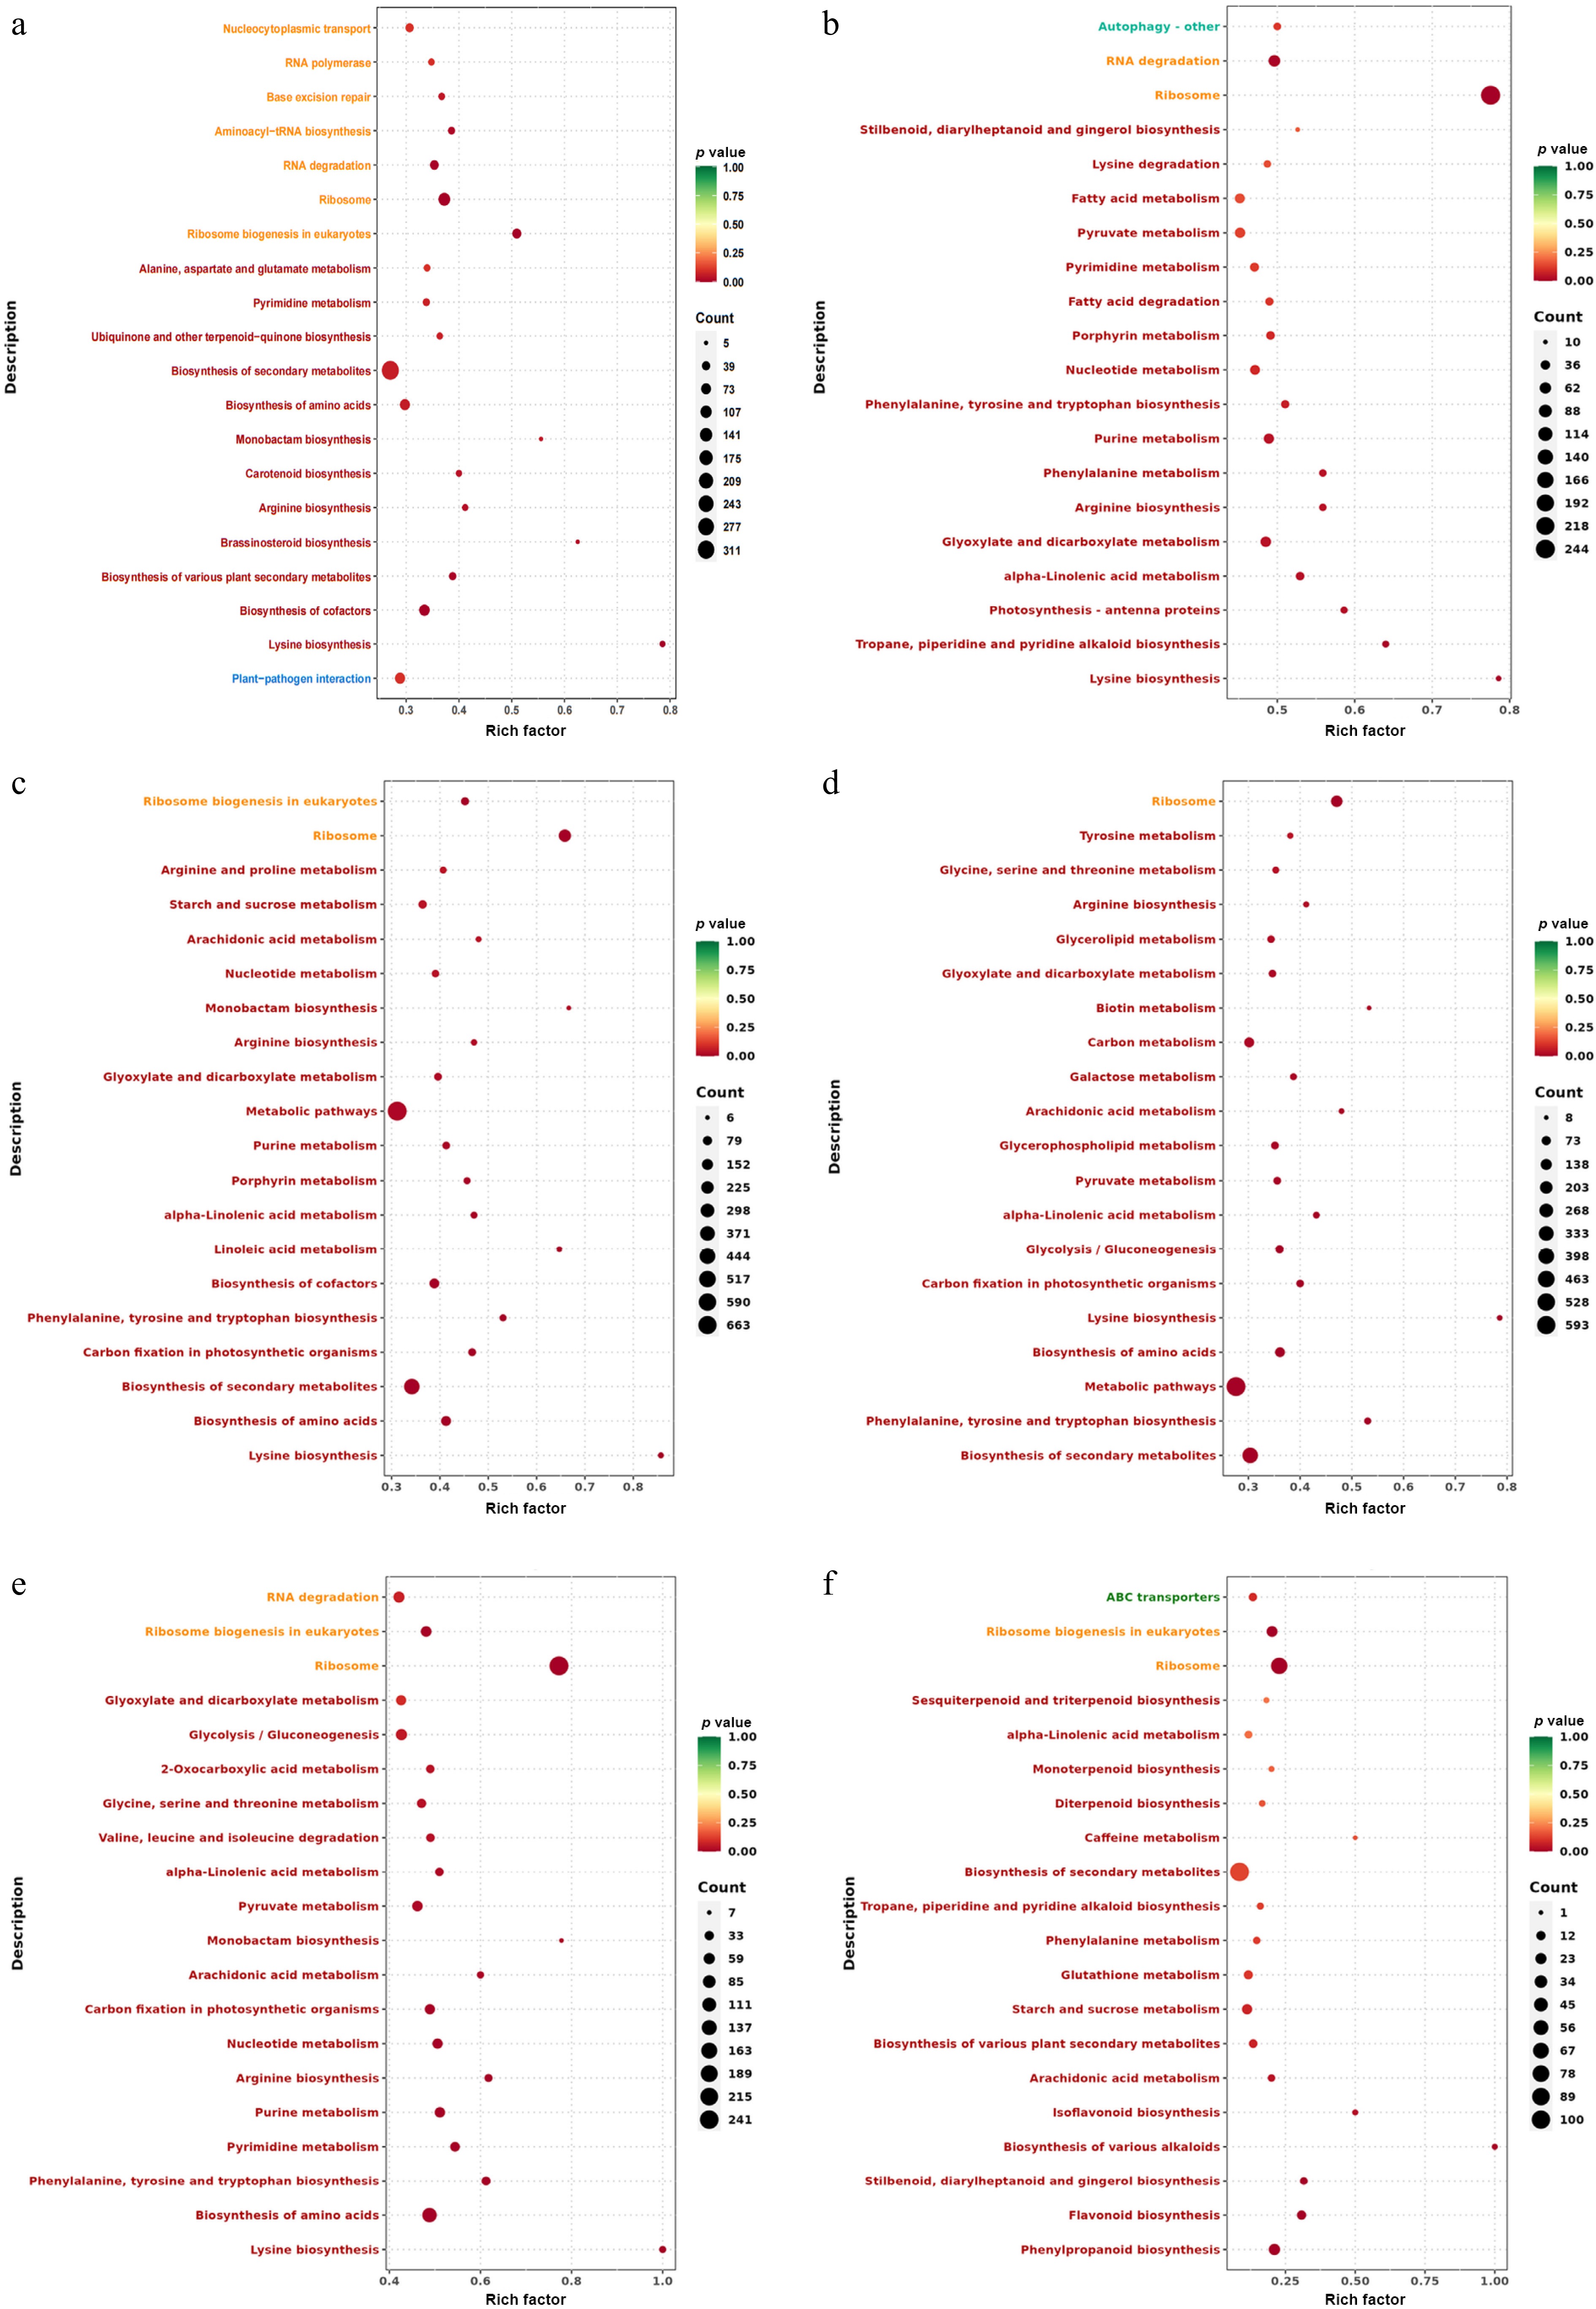
Figure 5.
KEGG enrichment analysis of celery DEGs of different photoperiodic treatments and sampling time points. (a) T0h vs T6h. (b) T0h vs T12h. (c) T0h vs T18h. (d) T0h vs T24h. (e) T0h vs F24h. (f) T24h vs F24h.
-
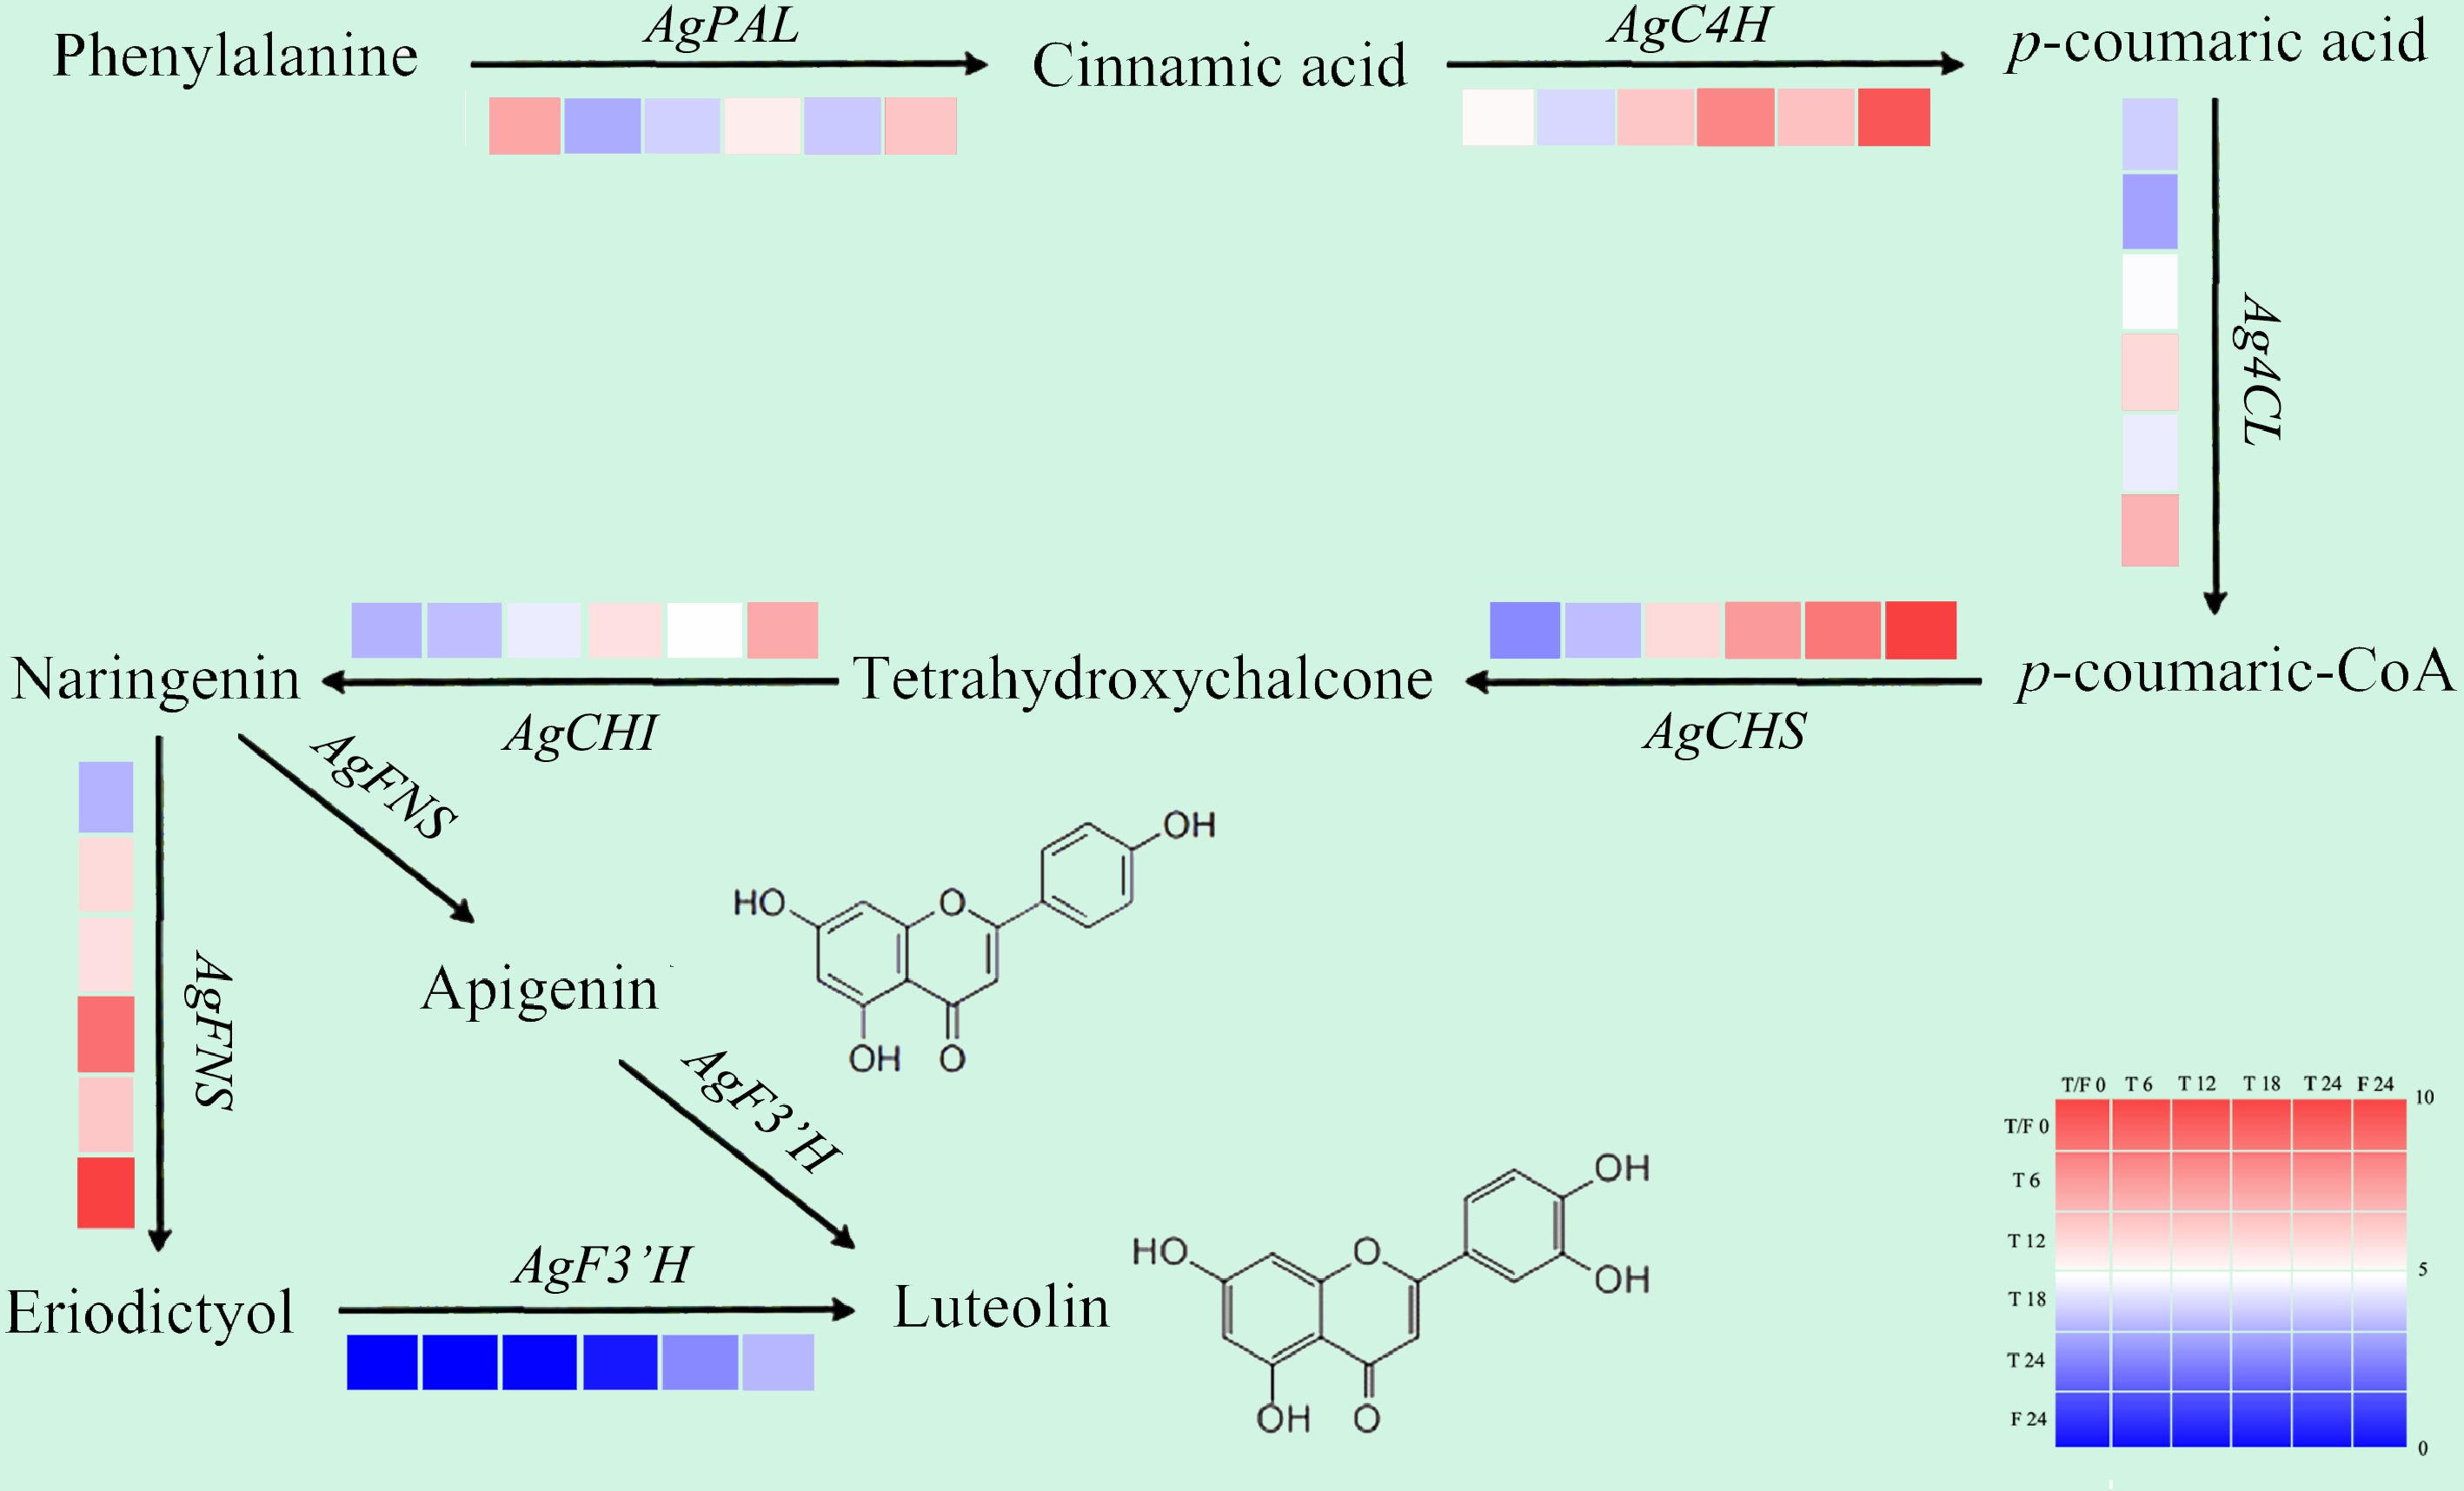
Figure 6.
Gene expression patterns related to flavonoid biosynthesis in celery of different photoperiodic treatments and sampling time points.
-
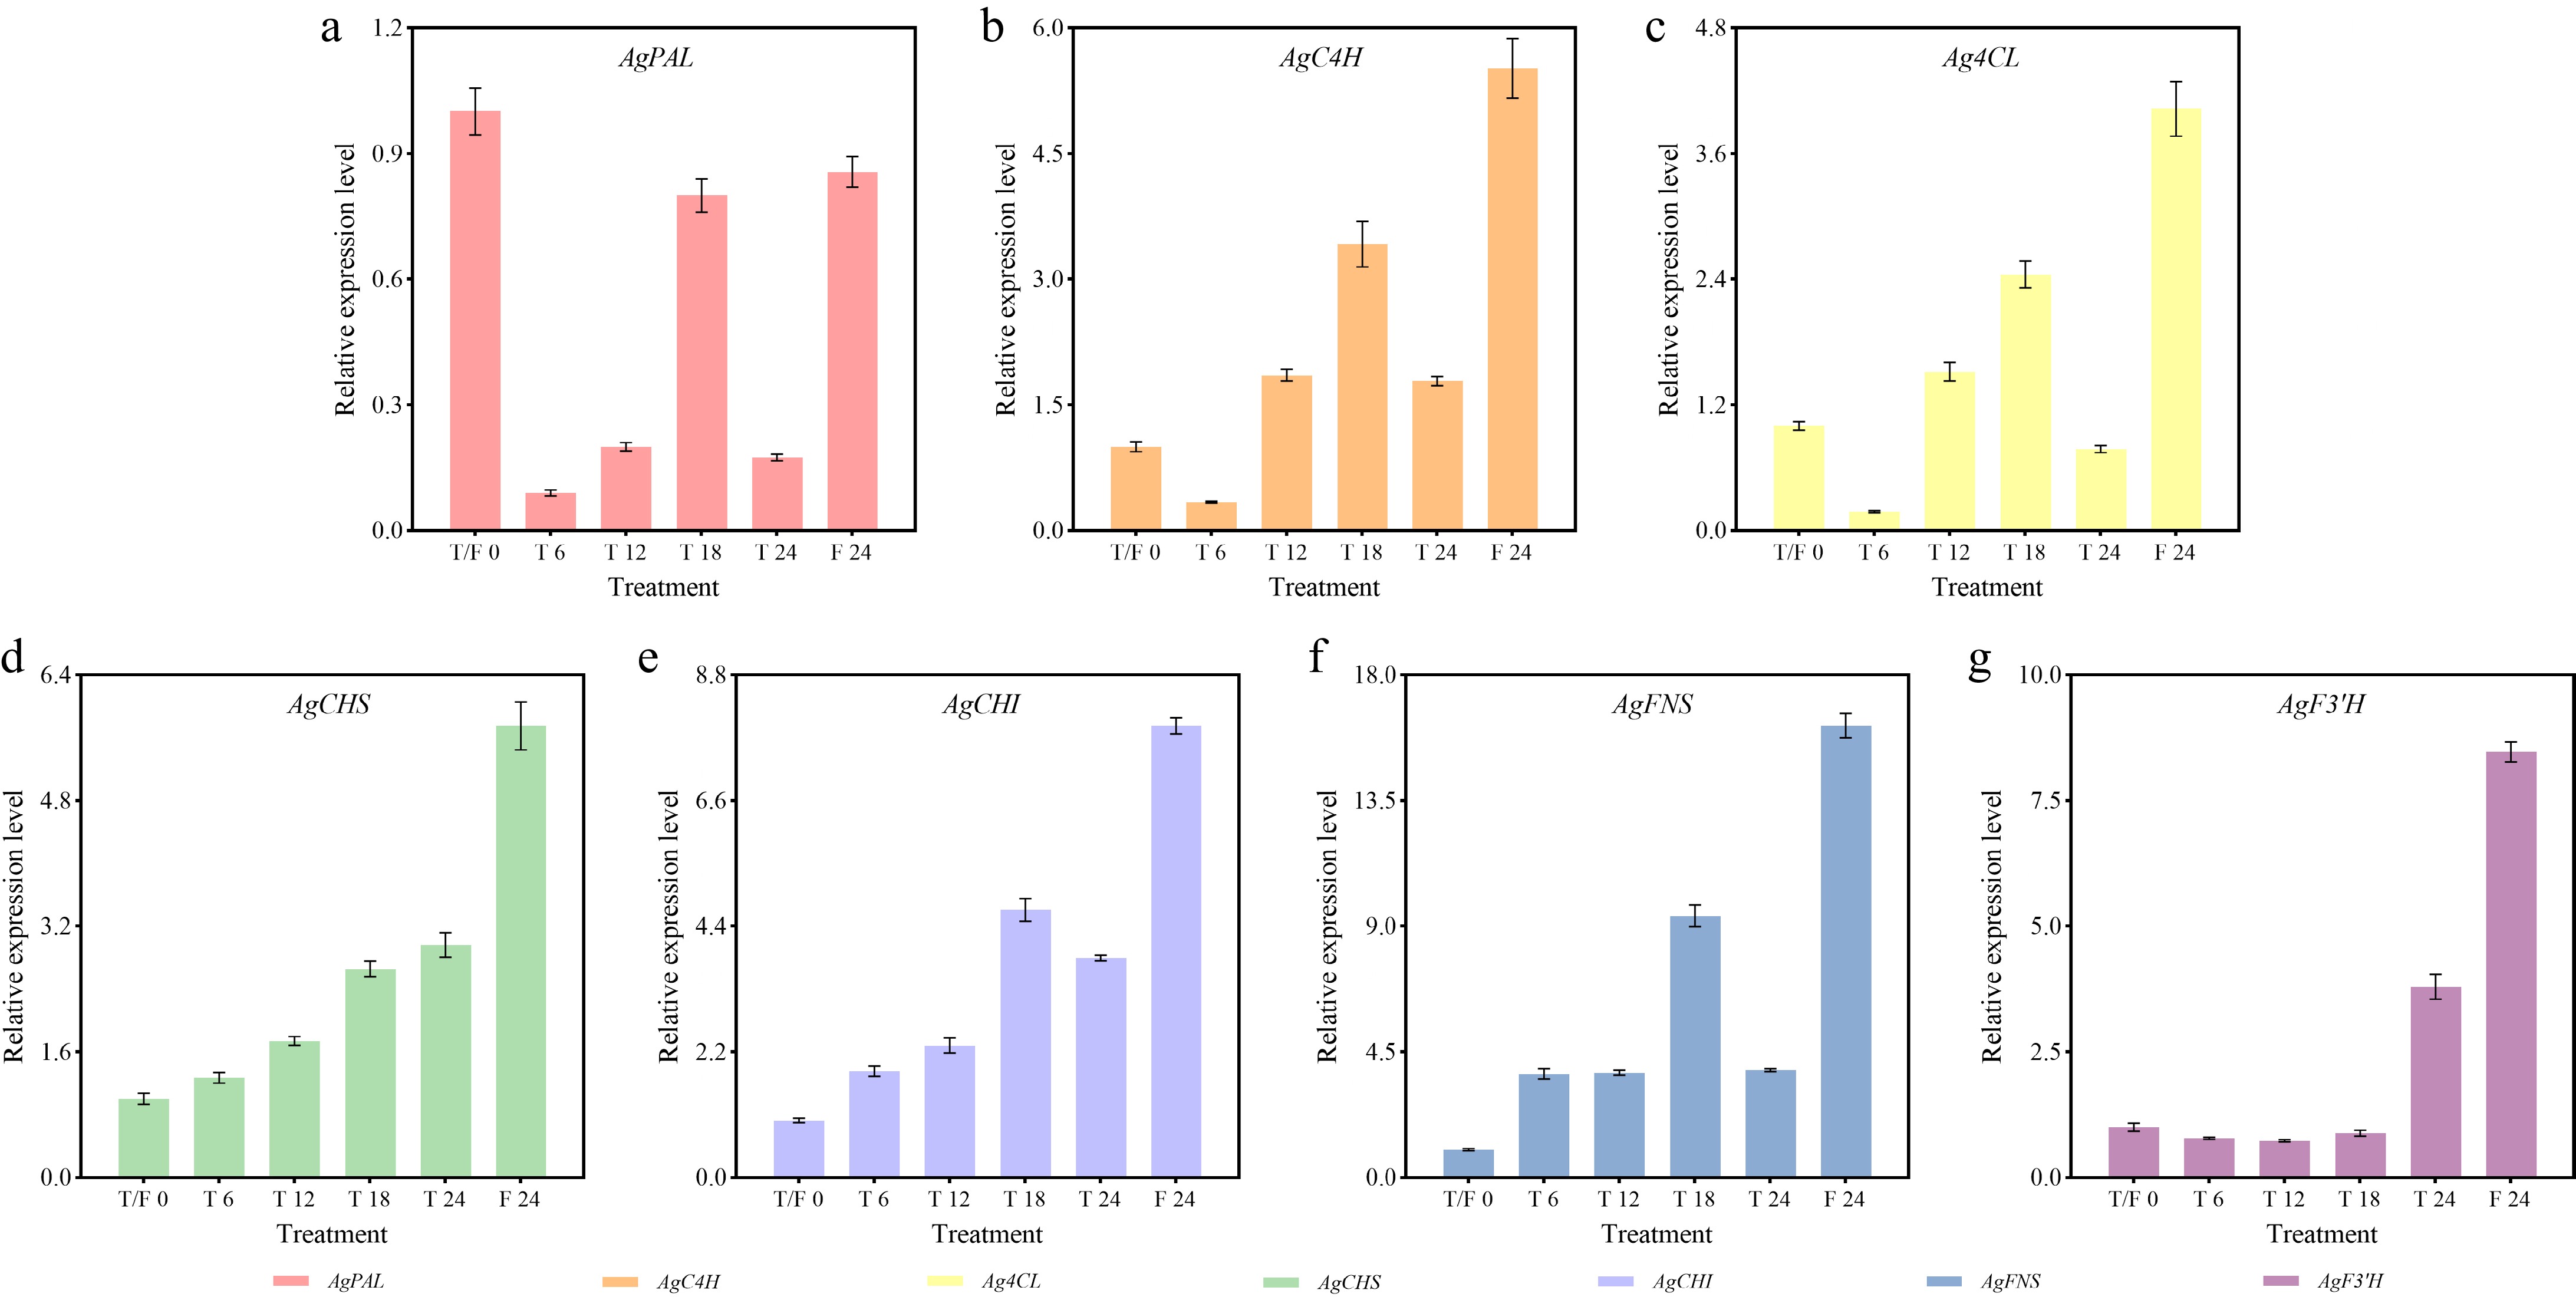
Figure 7.
Expression profiles of flavonoid biosynthesis-related genes in celery under different photoperiod treatments at various time points. (a) AgPAL. (b) AgC4H. (c) Ag4CL. (d) AgCHS. (e) AgCHI. (f) AgFNS. (g) AgF3'H.
-
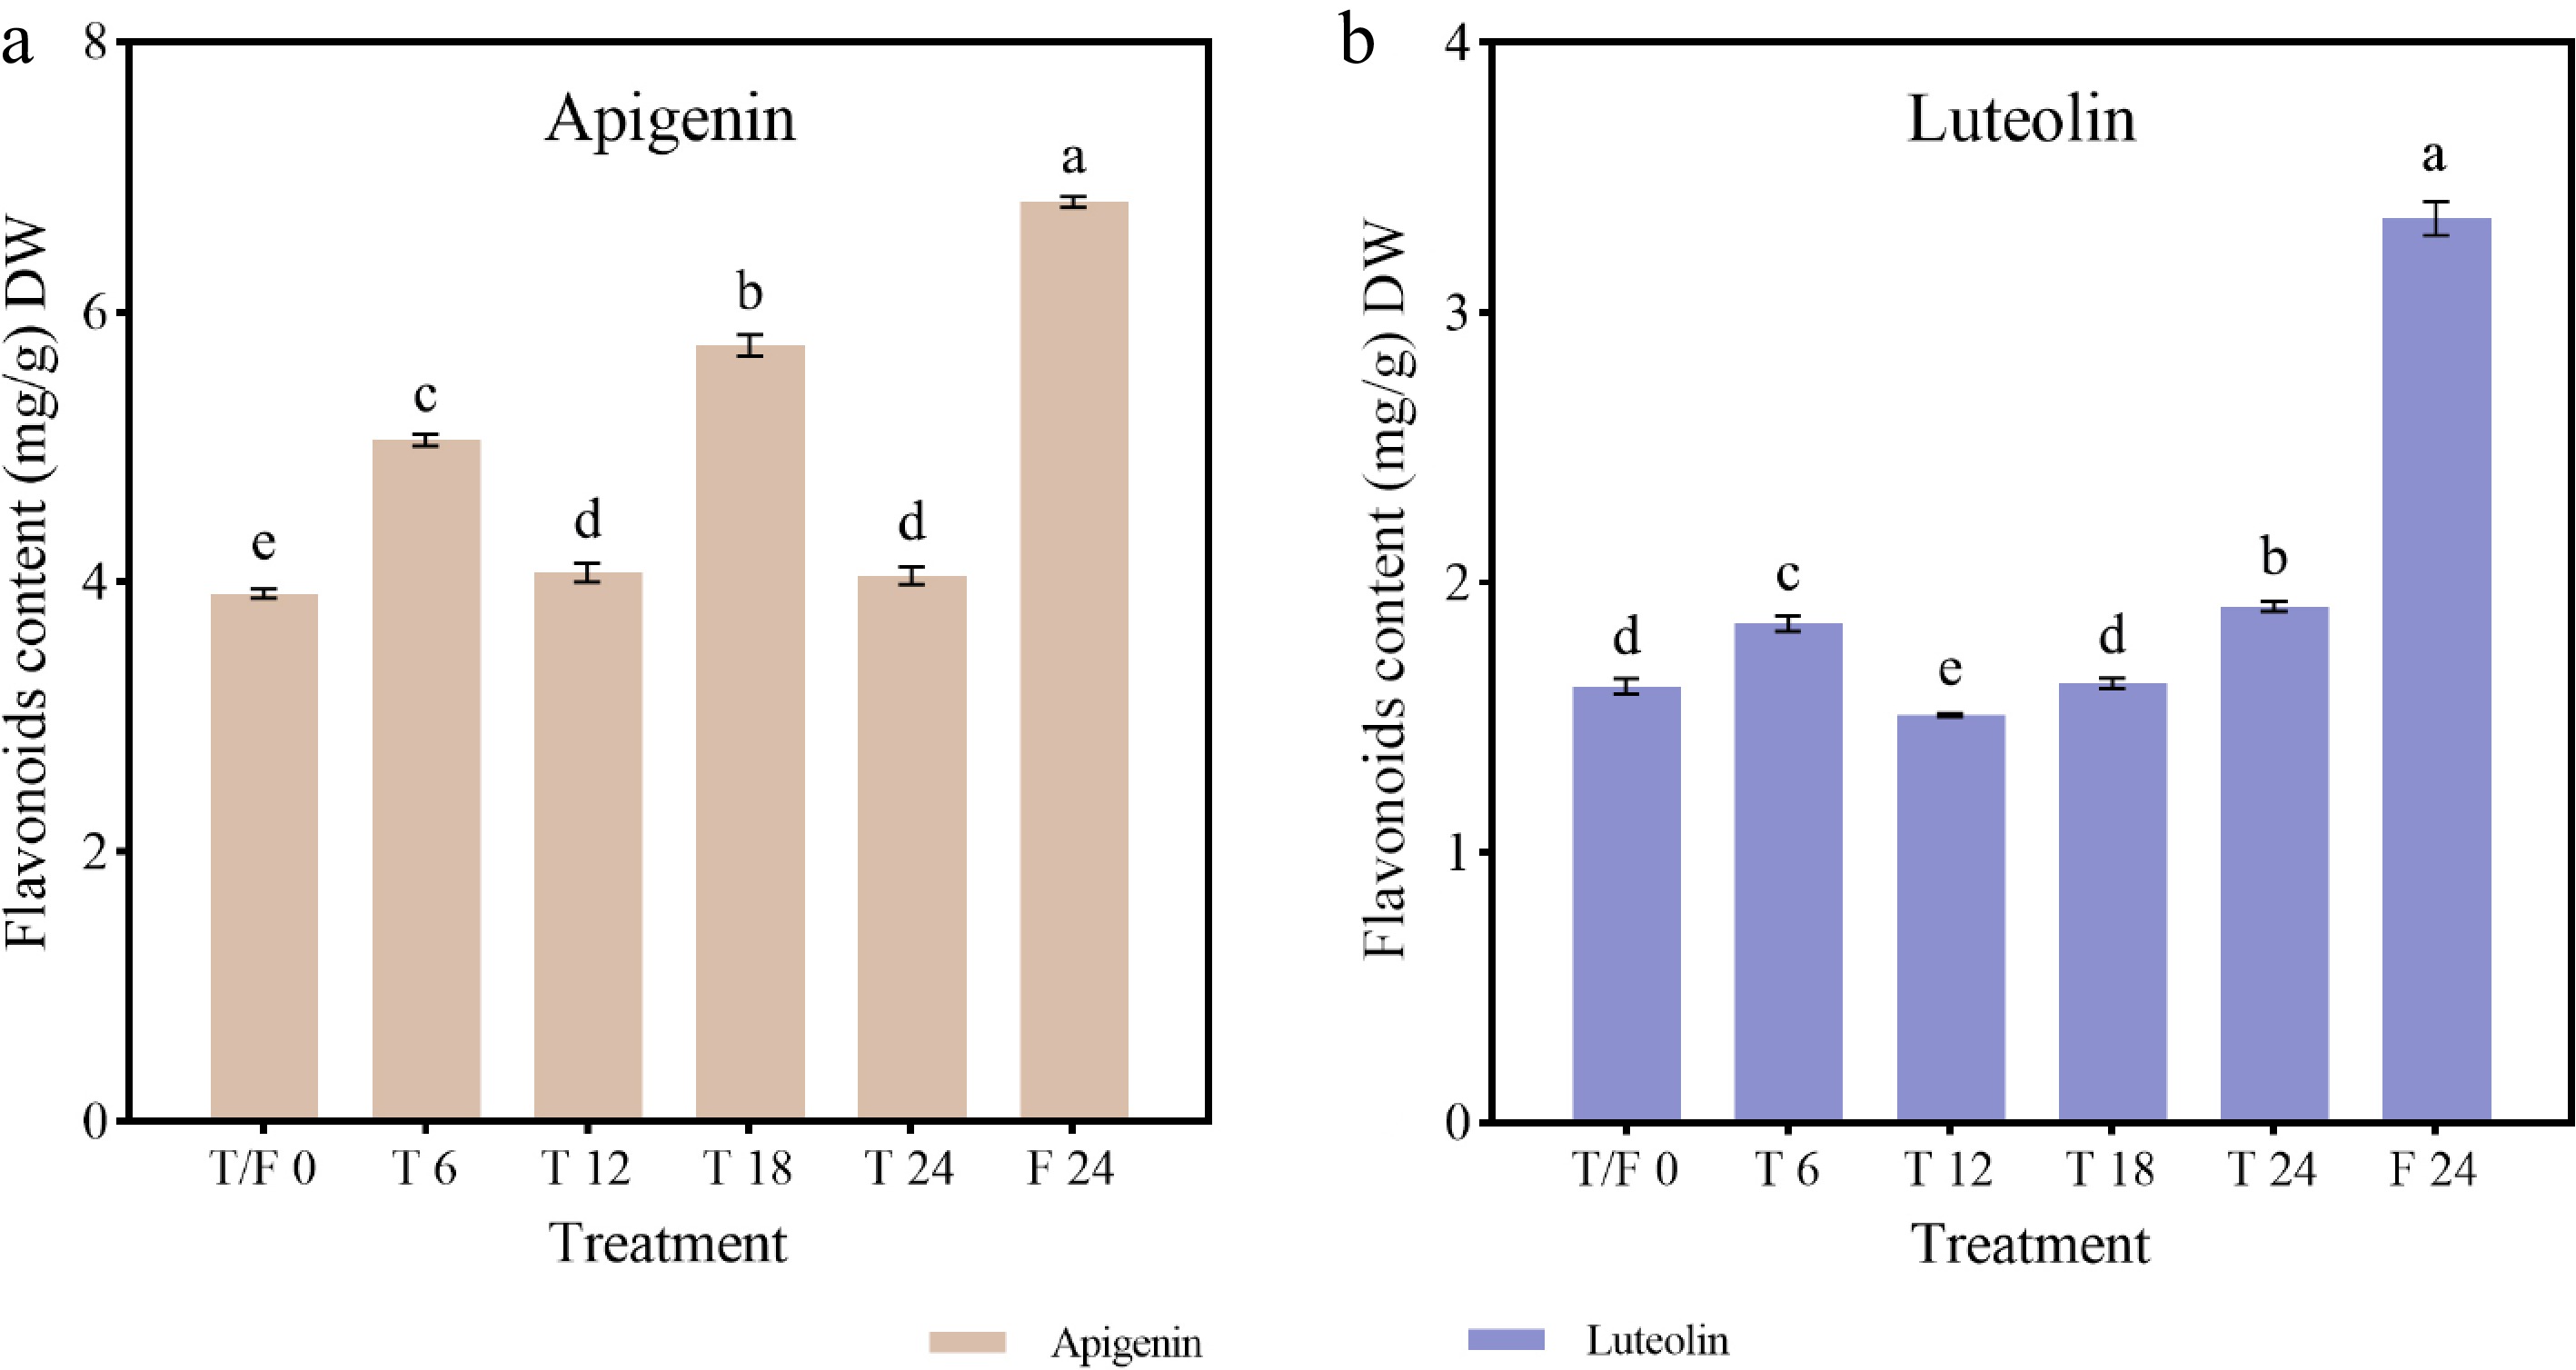
Figure 8.
Flavonoid content in celery under different photoperiod treatments and at various sampling time points. (a) Apigenin. (b) Luteolin.
-
Treatment Light and dark processing cycle and corresponding period AT 0 h ~6 h AT 6 h~12 h AT 12 h~18 h AT 18 h~24 h T 6L6D 08:00~14:00 14:00~20:00 20:00~+102:00 +102:00~+108:00 F 24L 08:00~+108:00 The orange shadow in the table area was light processing, and the blue shadow was dark processing. 'T' indicates truncated photoperiod; 'F' indicates full periodic illumination. 'AT xx h' indicates the point of time after treatment xx h, for example, 'AT 0 h' and 'AT 24 h' indicates the beginning and end times of photoperiodic treatment respectively. 'xx:xx~xx:xx' is the time corresponding to the light (dark) processing period, and the superscript '+1' indicates the time of the next day. Table 1.
Photoperiodic treatment test scheme.
-
Gene name Sequences of forward primers Sequences of reverse primers AgActin AGAAGTCCTGTTCCAGCCGTCTT CGAACCACCACTGAGCACTATGTT AgPAL TCGGCAACAAGAGCAGCAATG ACCAGTGAGAAGTCCAGCAATGTA AgC4H TGGTTGTTGTGTCCTCTCCTGAT GATTCTCCTCATCTTCCTCCAATGC Ag4CL AGCACCTTCCGTTACATACTTACTG GAGCAGGAGCATGATGGTATCG AgCHS GGGCCTTACCTTCCATCTTCTTAA GGTCGCTCGCATTTTTTCTTCCTT AgCHI CGCAGGTGTAAGAGGCATGGAA CCTTGGAGAAGCCGATGGTCAA AgFNS AAGGCGGCTTTACTATCTCCACTC CACCTAGCACCATTAACTTCTCAC AgF3'H AGGCGTGTGTGGACATGGATCAGA CCTCCACAGGCTGAACAGTGATCCA Table 2.
Quantitative primer sequences of flavonoid metabolism related genes in celery.
-
Sample Clean reads Clean bases Q20 rate Q30 rate GC content T0h 43,341,374 6,178,052,669 98.350% 95.719% 43.216% T6h 43,323,048 6,084,030,448 98.440% 95.962% 43.556% T12h 43,329,290 6,175,803,758 98.415% 95.908% 43.652% T18h 43,323,048 6,084,030,448 98.440% 95.962% 43.556% T24h 43,313,510 6,041,548,418 98.394% 95.851% 43.414% F24h 43,340,254 6,015,454,383 98.741% 96.683% 43.721% Table 3.
Quality analysis statistics of celery transcriptome.
-
Item Count Percentage All 34,924 100.00% Annotation 30,050 86.04% Nr 30,001 85.90% Pfam 22,307 63.87% Uniprot 29,856 85.49% KEGG 12,856 36.81% GO 23,210 66.46% KOG 295 0.84% Table 4.
Functional annotation and classification of celery transcriptome sequencing.
Figures
(8)
Tables
(4)