


-
Celery (Apium graveolens L.) is an important leaf vegetable belonging to Apium in Apiaceae; the petioles and leaf blades are the main product organs[1]. As medicine and food cognate ingredients, celery is rich in photosynthetic pigments (chlorophyll, carotenoid), and flavonoids (apigenin, luteolin), etc[2]. 5-amino-ketovaleric acid is a precursor of chlorophyll biosynthesis, which is regulated by a series of genes to synthesize chlorophyll a and chlorophyll b[3]. Appropriate chlorophyll content and ratio are the basis for vegetable crops to capture and transform light energy, forming good agronomic and nutritional qualities[4]. Flavonoids are a kind of by-product accumulated during the secondary metabolism of plants. Containing two phenolic hydroxy-benzene rings connected by central three-carbon atoms[5]. Phenylalanine is the biosynthetic precursor substance of flavonoids. For different species of plants, the form and proportion of flavonoid accumulation were different among[6].
Light conditions (including photoperiod, light quality, and light intensity) are key factors influencing biological processes and cell composition[7]. The biosynthesis and metabolism of photosynthetic pigments are significantly affected by light conditions. A 30-d dark treatment caused Ananas comosus to bleach by inhibiting the expression of 7-hydroxymethyl chlorophyll a reductase (HCAR)[8]. In Arabidopsis thaliana, protochlorophyll oxidoreductase a regulates chlorophyll biosynthesis in a light-dependent manner. Long-term dark treatment may lead to dysregulation of chlorophyll metabolism[9]. Flavonoids, as a common antioxidant substance in plants, have their content affected by light conditions[10]. In peanut (Arachis hypogaea) cotyledons, the transcriptional profiles of flavonoid biosynthesis structure genes show daily time-dependent responses[11]. In artichoke (Cynara cardunculus) inflorescences, daily sunshine exceeding 15 h inhibited the accumulation of flavonoids but increased the content of lignin and phenol[12].
The circadian clock is an endogenous rhythmical oscillator, involved in the regulation of various physiological processes (photosynthesis, hormones, and secondary metabolism, etc.) throughout the day[13]. Photoperiod is the intuitive manifestation of diurnal rhythms, associated with important physiological processes such as stress resistance and physiological cycles[14,15]. Japanese beech (Fagus crenata) adjusts the germination of buds by sensing photoperiod changes. Long night conditions or interrupted light delays the germination date of spring buds[16]. For celery, under natural conditions, the continuous extension of the photoperiod from winter to spring is the necessary environmental signal for its flowering[17]. At present, photoperiodic regulation as an efficient tool is gradually being used in the production of modern horticultural crop facilities[18]. With the development of high-throughput sequencing technology, transcriptomes including carrot (Daucus carota), parsley (Petroselinum crispum), and parsnip (Saposhnikovia divaricata) have been published. Those results provided new insights and reference to the research on the metabolic regulation mechanism of Apiaceae[19].
In this study, 'Ningqin 1' celery plants 60 d after sowing were used as the material, two different photoperiod treatment tests were conducted, including two cycles of the truncated photoperiod (light/dark: 6 h/6 h, recorded as 6L6D), and full periodic illumination (light/dark: 24 h/0 h, recorded as 24L). Transcriptome sequencing was performed following sampling at the end of the light/dark treatments in each experimental condition. Quality assessment and annotation classification of sequencing data were completed. Subsequently, differential expression transcription gene screening, functional annotation classification, and metabolic pathway analysis were performed on transcriptome data. This study investigated the response of the celery transcriptome to various photoperiod treatments, as well as the changes in the circadian expression patterns of genes involved in the flavonoid biosynthesis pathway.
-
Celery plants at 60 d post-sowing, displaying 4−5 developed leaf blades (Supplementary Fig. S1), were selected for experiments due to their heightened photoperiod sensitivity at this development stage. Plant materials were planted in the artificial climate growing room of the Apiaceae Vegetable Crop Laboratory, State Key Laboratory of Crop Genetics and Germplasm Enhancement and Utilization, Nanjing Agricultural University (Nanjing, China). Organic substrate, a mixture of vermiculite, and perlite with a volume ratio of 2:2:1, was put into 18 cm × 16 cm × 16 cm seedling pots. During the planting period, the photoperiod of the growth chamber was maintained at light/dark: 12 h/12 h. Daytime light intensity was 240 μmol/m2/s, the temperature was 25 °C (daytime), and 18 °C (night time), and the relative humidity was kept at 70% (with a margin of error of 10%).
Photoperiodic treatment and sample collection
-
Light incubators were set according to the photoperiod treatment plan outlined in Table 1, and celery plants were grouped, and treatment began at 8:00 am. Treatments T and F both used a 24-h cycle (based on a 12 h light/12 h dark cycle) as the treatment duration. Treatment T (6L6D) simulated a truncated equinoctial photoperiod with 6 h light/6 h dark cycles, while treatment F (24L) simulated continuous illumination for 24 h. At the beginning of the treatment, the first sample was taken and recorded as T0h. Group 6L6D was sampled every 6 h, and the obtained samples were recorded as T6h, T12h, T18h, and T24h, respectively. Group 24L was sampled at the end of treatment, and the obtained sample was recorded as F24h. All the samples were collected from the top leaf blades of celery and frozen in the ultra-low temperature refrigerator frozen at −80 °C (Thermo Company, Waltham, MA, USA).
Table 1. Photoperiodic treatment test scheme.
Treatment Light and dark processing cycle and corresponding period AT 0 h ~6 h AT 6 h~12 h AT 12 h~18 h AT 18 h~24 h T 6L6D 08:00~14:00 14:00~20:00 20:00~+102:00 +102:00~+108:00 F 24L 08:00~+108:00 The orange shadow in the table area was light processing, and the blue shadow was dark processing. 'T' indicates truncated photoperiod; 'F' indicates full periodic illumination. 'AT xx h' indicates the point of time after treatment xx h, for example, 'AT 0 h' and 'AT 24 h' indicates the beginning and end times of photoperiodic treatment respectively. 'xx:xx~xx:xx' is the time corresponding to the light (dark) processing period, and the superscript '+1' indicates the time of the next day. RNA extraction, transcriptome sequencing, and quality control
-
Extraction of total RNA from celery leaf blades referenced the RNA extraction Kit (RNA simple total RNA Kit, Tiangen Company, Beijing, China). Based on the transcriptome database of our previous research[17], the transcriptome cDNA library was constructed using double-ended sequencing technology. Bena Technology Co., Ltd. (Wuhan, China) was commissioned for cDNA library construction and sequencing. Filtering out low-quality readings by software Fastp (version: 0.21.0)[20], and FastQC software (version: 0.11.9)[21], quality control was performed on raw reads. STAR (v2.7.9a)[22] was used to filter and statistically analyze the transcriptome sequences and the reference genome of celery.
Functional annotation analysis
-
The relative expression levels of genes were expressed by FPKM values using RSEM software[23,24]. The genes with FDR < 0.05 (false discovery rate) and |log2FC| > 1 (logarithm multiple change) were screened as significantly different genes (DEGs). Compared with multiple public databases, the gene functions of celery was annotated. In NCBI, Swiss-Prot, and KOG databases, the comparison tool BLAST was used for matching results, e value less than e−5 was screened.
Sample correlation and principal component analysis (PCA)
-
To understand the correlation degree of response patterns of different sample points, correlation and PCA were performed. In transcriptome studies, the correlation between samples was determined by several variables (the amount of expression of each gene). The relationship between gene expression and samples was studied by randomly rearranging many relevant gene expression indicators. Each point in the figure represents a sample, and the farther the distance between the two samples, the greater the difference in gene expression patterns between the two samples. On the contrary, the expression pattern was more similar. A Pearson correlation coefficient of at least 0.9 was required.
GO annotation and KEGG enrichment analysis of DEGs
-
clusterProfiler (v3.14.3) was used for differential expression gene enrichment analysis, to simplify the annotation information of GO (Gene Ontology)[25,26]. GO annotation analysis was performed with p value ≤ 0.05 as the standard, and the value range of qvalue was [0,1]. The functions of transcripts from biological processes (BP), cell components (CC), and molecular functions (MF) were analyzed, and the top 20 enriched secondary classifications were selected for plotting.
To study the function and enrichment pathway of DEGs, the KEGG Orthologs (KOs) database was searched for homology using kofam_scan software (v1.3.0)[27]. KOs were assigned to the protein sequence, KEGG pathway enrichment analysis was performed for DEGs with a corrected p value ≤ 0.05.
Analysis of highly enriched differential pathways
-
For the enriched differential pathways (flavonoid synthesis pathways in this study), the chronological expression profiles of related genes were analyzed separately. The GraphPad Prism 9.4 (San Diego Corporation, San Diego, CA, USA) software was used for heatmap mapping.
Total RNA extraction and cDNA preparation
-
Total RNA from celery was extracted using the Simple Total RNA Extract Kit (Tiangen, Beijing, China) following the manufacturer's protocol. The concentration and quality of the RNA were assessed using a NanoDrop 2000 trace ultraviolet spectrophotometer (Molecular Devices, Santa Clara, CA, USA). Subsequently, reverse transcription of the total RNA into cDNA was performed using the PrimeScript RT reagent kit (TaKaRa, Dalian, China).
Real-time quantitative polymerase chain reaction (RT-qPCR) analysis
-
The expression levels of genes related to the flavonoid pathway (AgPAL, AgC4H, Ag4CL, AgCHS, AgCHI, AgFNS, and AgF3'H) were determined by RT-qPCR (Table 2). Primer design and the RT-qPCR system were based on previous studies, and the AgActin gene was used as the internal reference gene[28]. Relative gene expression levels were calculated using the 2−ΔΔCᴛ method[29]. Three independent biological replicates were analyzed for each sample.
Table 2. Quantitative primer sequences of flavonoid metabolism related genes in celery.
Gene name Sequences of forward primers Sequences of reverse primers AgActin AGAAGTCCTGTTCCAGCCGTCTT CGAACCACCACTGAGCACTATGTT AgPAL TCGGCAACAAGAGCAGCAATG ACCAGTGAGAAGTCCAGCAATGTA AgC4H TGGTTGTTGTGTCCTCTCCTGAT GATTCTCCTCATCTTCCTCCAATGC Ag4CL AGCACCTTCCGTTACATACTTACTG GAGCAGGAGCATGATGGTATCG AgCHS GGGCCTTACCTTCCATCTTCTTAA GGTCGCTCGCATTTTTTCTTCCTT AgCHI CGCAGGTGTAAGAGGCATGGAA CCTTGGAGAAGCCGATGGTCAA AgFNS AAGGCGGCTTTACTATCTCCACTC CACCTAGCACCATTAACTTCTCAC AgF3'H AGGCGTGTGTGGACATGGATCAGA CCTCCACAGGCTGAACAGTGATCCA Extraction and determination of flavonoids
-
Fresh celery leaves from each experimental group were collected, oven-dried at 40 °C for 48 h until completely dry, and then homogenized to a fine powder. Aliquots of the powdered samples were transferred to 10-mL centrifuge tubes, and 5 mL of extraction solvent (50% methanol solution containing 2 mol/L hydrochloric acid and 2 g/L butylated hydroxytoluene) were added to each tube. The mixtures were incubated in a 90 °C water bath for 4 h. After cooling to room temperature, the samples were centrifuged, and the supernatants were filtered through organic filters and transferred into brown vials for testing. As previously described[28], a UPLC Hedera ODS-2 C18 analytical column (250 mm × 4.6 mm i.d., 5 µm nominal particle size) was used for the determination. Each sample included three biological replicates, and the test results were calculated and expressed as dry weight (recorded as DW).
Data analysis of RT-qPCR and flavonoid content
-
The mean values and variances of RT-qPCR data and flavonoid content were calculated using SPSS 25.0 software (IBM Crop., Armonk, NY, USA). Graphical representations of the results were generated using GraphPad Prism 9.4 software (GraphPad Software, San Diego, CA, USA).
-
Transcriptome sequencing was performed on celery leaf RNA at different time points (T0h, T6h, T12h, T18h, T24h, and F24h). The effective data obtained for each group were 6.02~6.18 Gb. The value of Q20 (error rate less than 1%) was above 98.35%, and the value of Q30 (error rate less than 1%) was above 95.71%. Those values were positively correlated with the sequencing quality. The percentages of GC content were 43.216%, 43.556%, 43.652%, 43.556%, 43.414%, and 43.721%, respectively (Table 3).
Table 3. Quality analysis statistics of celery transcriptome.
Sample Clean reads Clean bases Q20 rate Q30 rate GC content T0h 43,341,374 6,178,052,669 98.350% 95.719% 43.216% T6h 43,323,048 6,084,030,448 98.440% 95.962% 43.556% T12h 43,329,290 6,175,803,758 98.415% 95.908% 43.652% T18h 43,323,048 6,084,030,448 98.440% 95.962% 43.556% T24h 43,313,510 6,041,548,418 98.394% 95.851% 43.414% F24h 43,340,254 6,015,454,383 98.741% 96.683% 43.721% Functional annotation and classification of celery transcriptome sequencing
-
To reveal the biological function of the new unigenes, we performed an in-depth functional annotation analysis of 34,924 unigene sequences. To better understand the functional information related to the biological roles of transcripts, we conducted an extensive comparison using the following seven databases. A total of 30,050 transcripts (accounting for 86.04%) have been annotated. In Nr (NCBI non-redundant)[30], 30,001 transcripts were annotated, accounting for 85.90%; In Pfam[31], a total of 22,307 transcripts were matched, accounting for 63.87%; In Uniprot[32], a total of 29,856 transcripts were matched, accounting for 85.49%; In KEGG (Kyoto Encyclopedia of Genes and Genomes)[27], 12,856 transcripts were annotated, accounting for 36.81%; In GO (Gene Ontology)[25], 23,210 transcripts were annotated, accounting for 66.46%. A total of 295 transcripts were matched in KOG[33] (Clusters of Orthologous Groups), accounting for 0.84% (Table 4).
Table 4. Functional annotation and classification of celery transcriptome sequencing.
Item Count Percentage All 34,924 100.00% Annotation 30,050 86.04% Nr 30,001 85.90% Pfam 22,307 63.87% Uniprot 29,856 85.49% KEGG 12,856 36.81% GO 23,210 66.46% KOG 295 0.84% By comparing the annotation and plotting of the results in the Nr database[28], the top 10 species with the most annotations were obtained, and the rest were divided into other species. The species with the most comparison was as follows: Daucus carota (27,226), Apium graveolens (822), Nyssa sinensis (99), Petroselinum crispium (81), Camellia sinensis (64), Actinidia chinensis (53), Citrus sinensis (47), Trachyspermum ammi (45), and Cynara cardunculus (43) (Fig. 1).
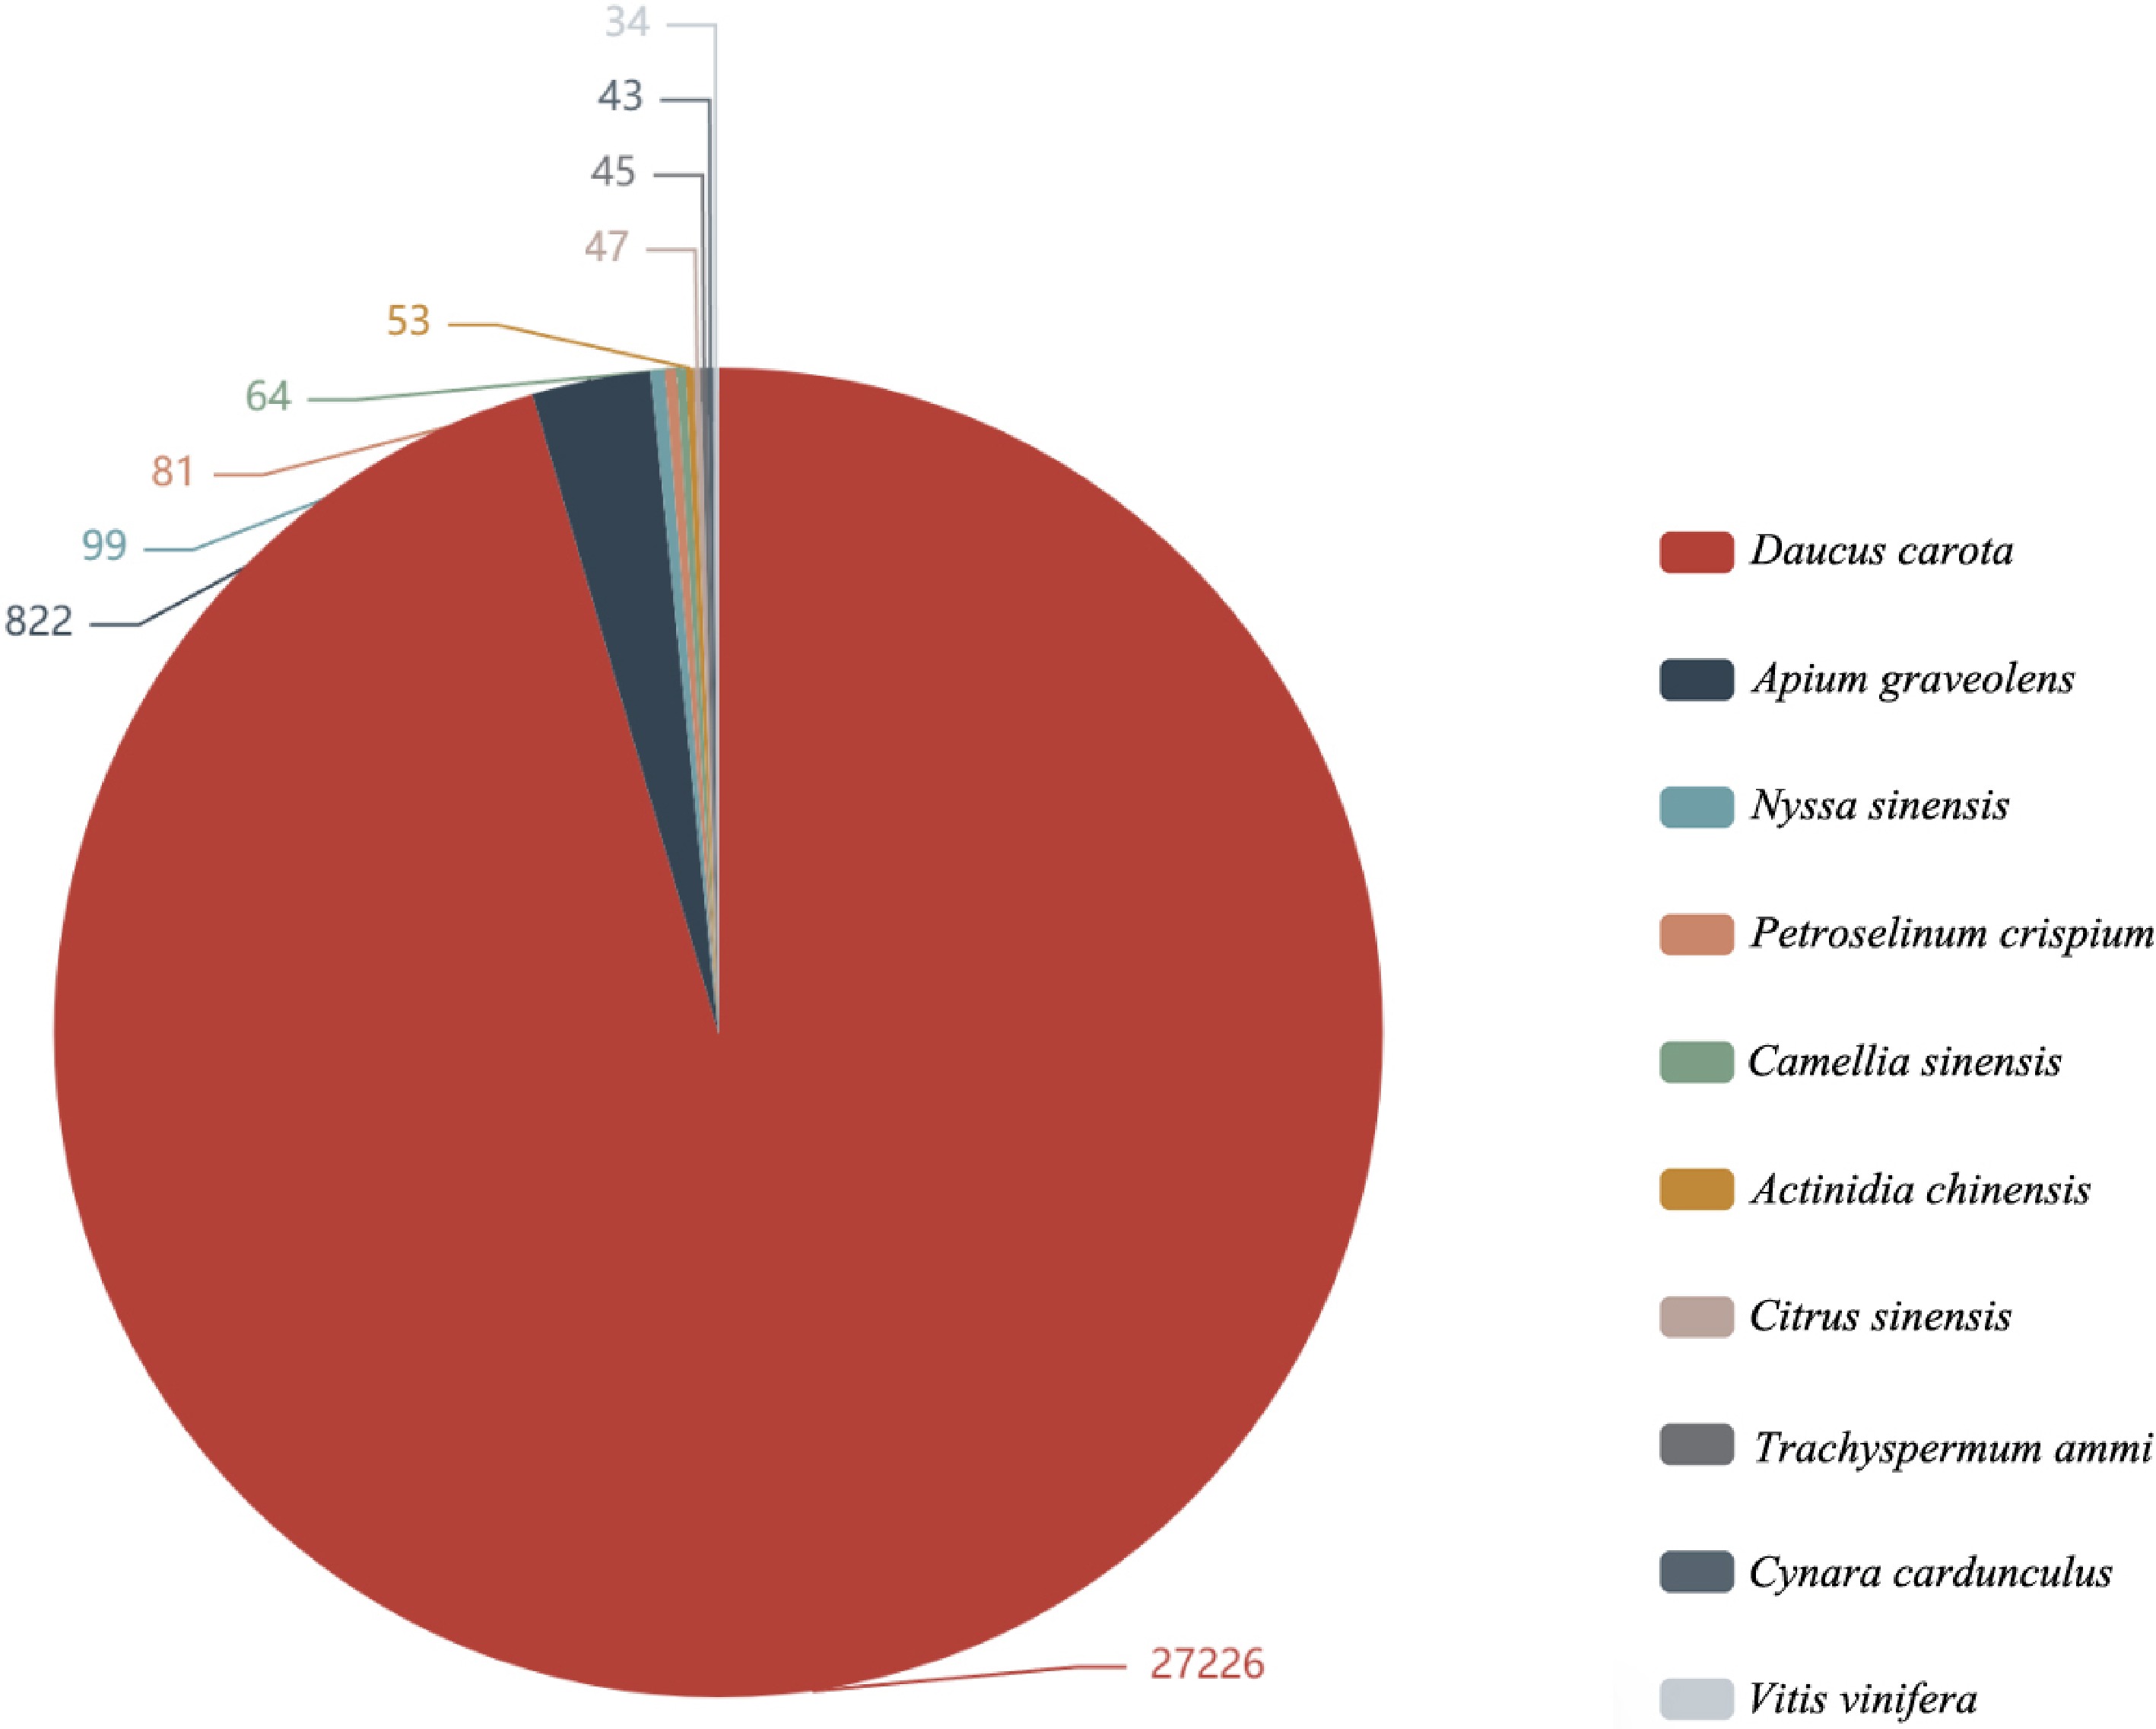
Figure 1.
Nr annotated species distribution map of Apium graveolens. The top 10 species with the most comparison was counted, different colors represent different species. The number represents the number of different species in the Nr database, and species distribution of BLAST hits for each unigenes with a cut-off of 1E−5.
Statistical analysis of celery transcriptome responses of different photoperiodic treatments and sampling time points
-
In the principal component analysis of the transcriptome data from six samples, the cumulative contribution rate of the first three eigenvalues reached 82.78%. The contribution rate of the first principal component was 39.97%, the second principal component was 27.47%, and the third principal component was 15.34% (Fig. 2a). As the 2D PCA plot (only the first and second principal components were retained) showed: the T0h, T6h, and T12h data points were scattered in different quadrants, and the T18h, T24h, and F24h data points are clustered in the same quadrant. The T6h and T12h data points were distributed in the diagonal quadrant for the highest dispersion, and the correlation coefficients were the smallest (r = 0.641). The distance between the T24h and F24h data points was the shortest, and the correlation coefficient was the largest (r = 0.967) (Fig. 2b & c).
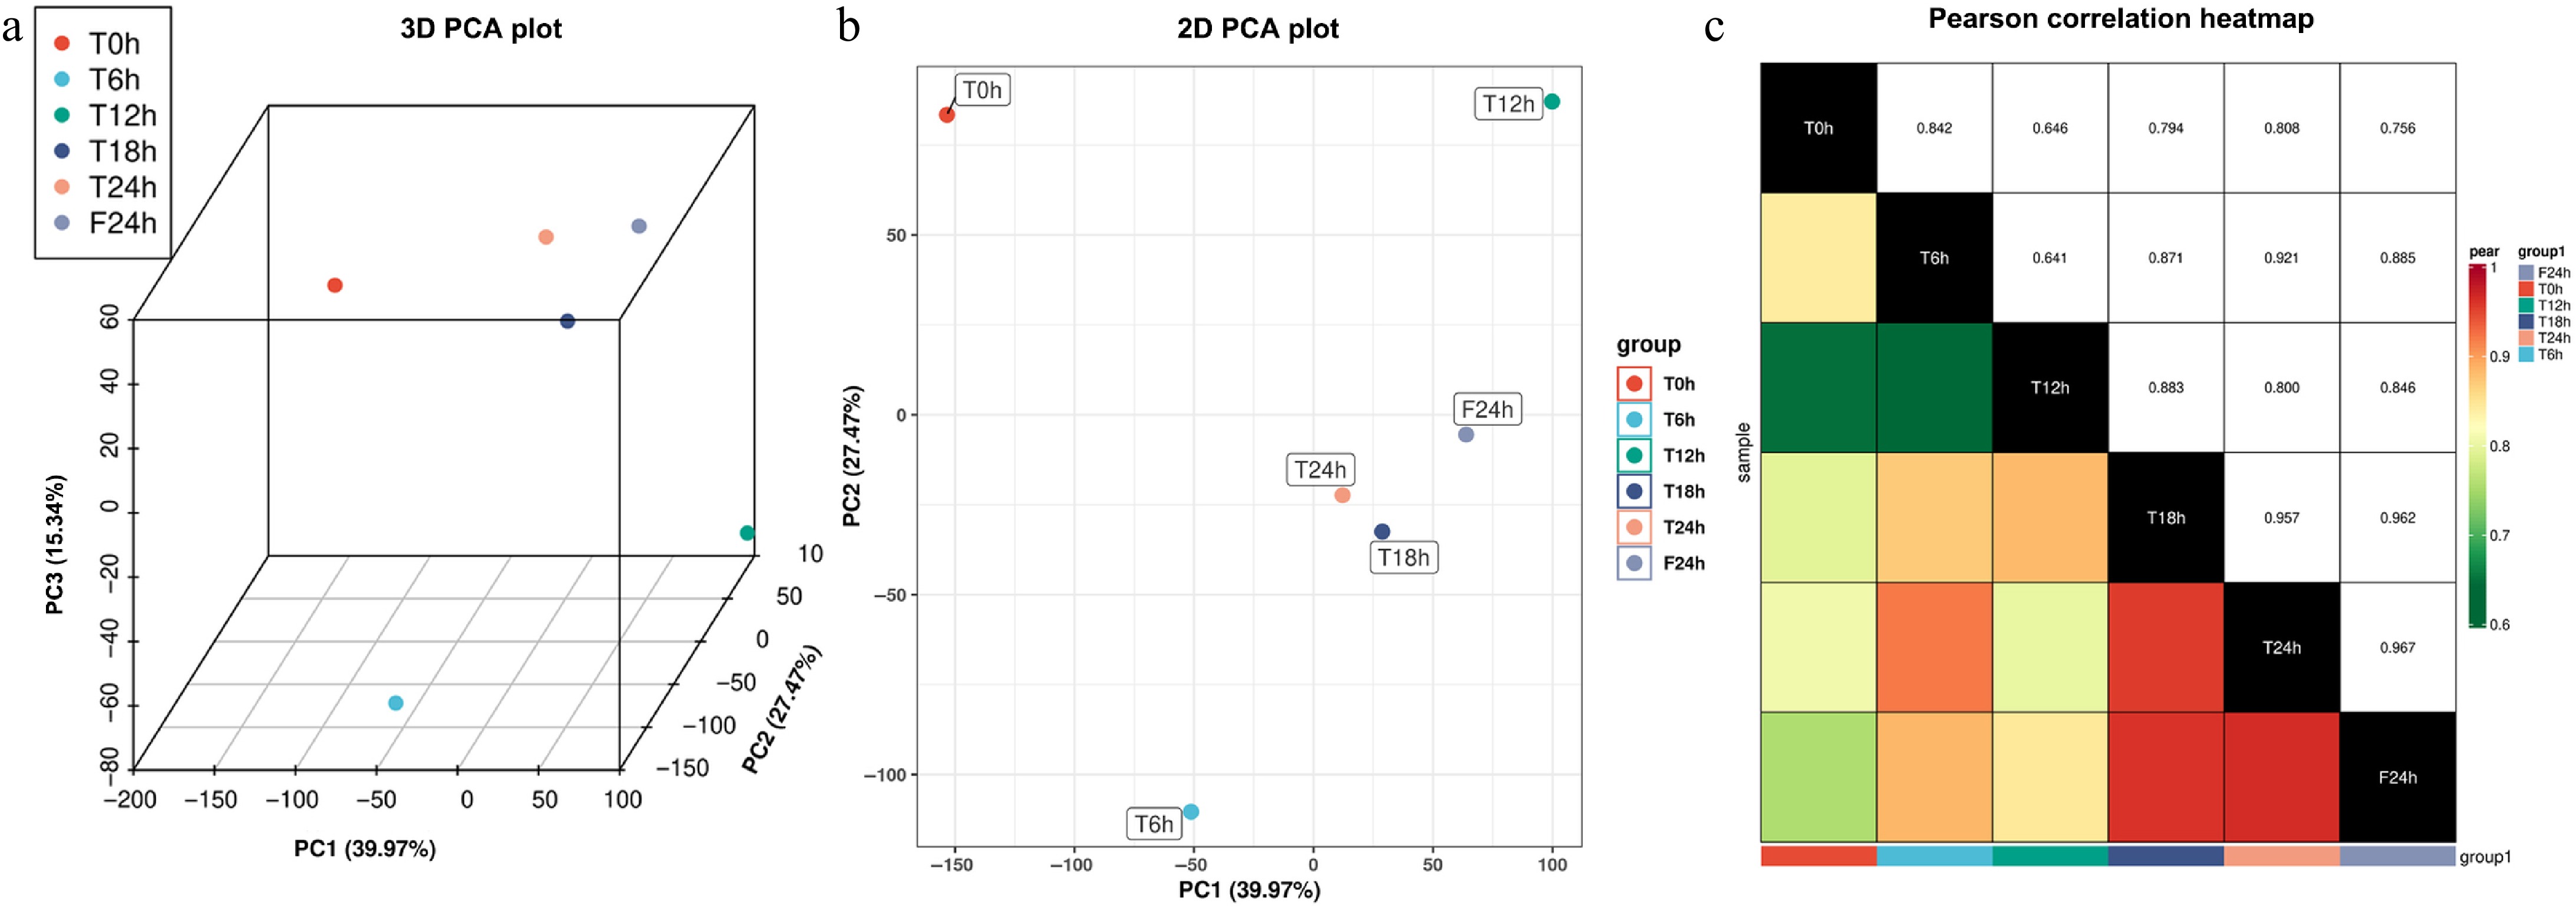
Figure 2.
Pearson correlation analysis of celery transcriptome responses of different photoperiodic treatments and sampling time points. (a) 3D PCA plot. (b) 2D PCA plot. (c) Pearson correlation heatmap.
After different photoperiod treatments, the genes in each group were differentially expressed to some extent. Compared with T0h, T12h had the highest number of DEGs (7,398 in total), including 3,636 up-regulated DEGs (49.15%) and 3,762 down-regulated DEGs (50.85%). Followed by F24h (a total of 6,487), there were 3,371 up-regulated DEGs (51.97%) and 3,116 down-regulated DEGs (48.03%). In each compared group, T24h and F24h had the least number of DEGs, including 625 up-regulated DEGs (46.82%) and 710 down-regulated DEGs (53.18%) (Fig. 3a & b). Even though the photoperiod treatment modes were different in T and F, they still showed the most similar gene expression patterns at the 24th hour. Indicates compared with the effect of different photoperiod treatment, daily time (the original adaptive rhythm of plant circadian clock) was still an important factor affecting the expression rhythm of genes.
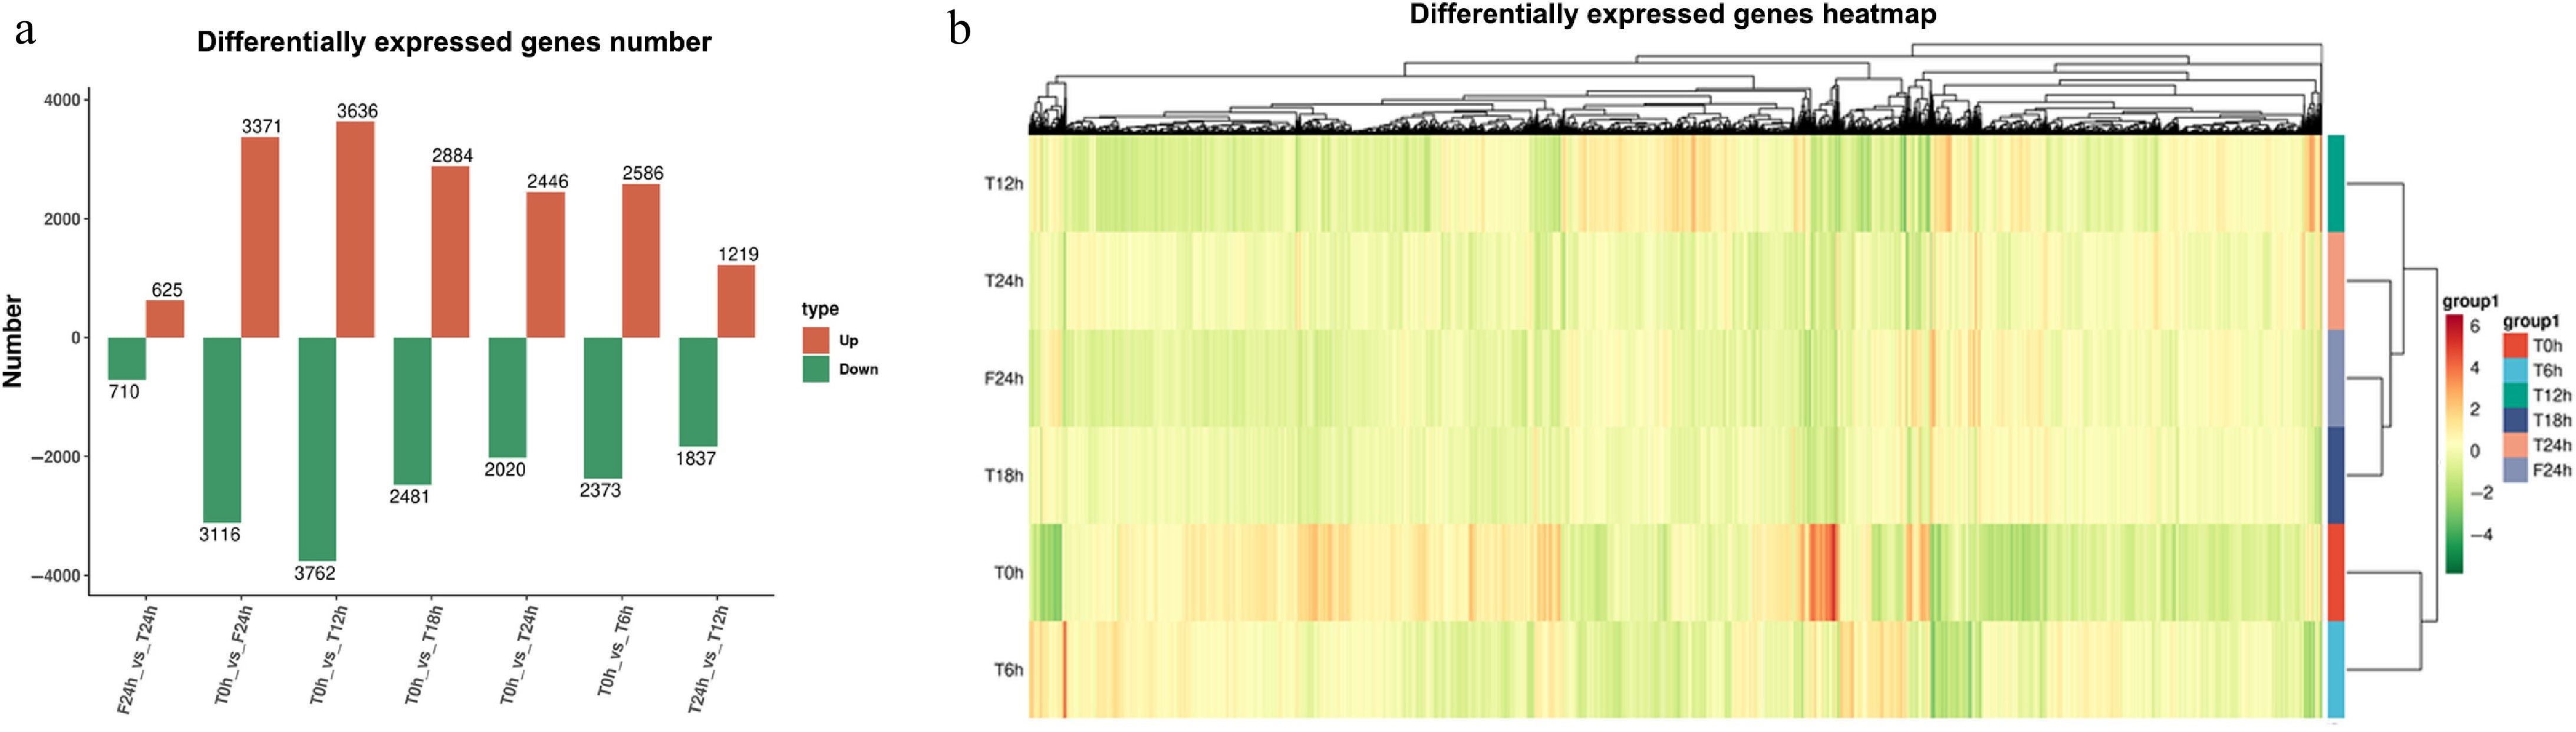
Figure 3.
Statistical analysis of celery transcriptome responses of different photoperiodic treatments and sampling time points. (a) Differentially expressed gene number. (b) Differentially expressed gene heatmap.
GO annotation of celery DEGs of different photoperiod treatments and sampling time points
-
GO (Gene Ontology) is a comprehensive gene function description database, which categorizes each group of DEGs into three functional categories: biological processes (BP), cellular components (CC), and molecular functions (MF). In the comparison of each group, the DEGs were mainly enriched in the BP and CC.
In the top 10 DEGs of T0h vs T6h, the annotations involved four BP-related secondary terms, five CC-related secondary terms, and one MF-related secondary term. Mainly related to intracellular organelle (CC), organelle (CC), and cellular nitrogen compound metabolic process (BP) (Fig. 4a). Among the top 10 DEGs of T0h vs T12h, the annotations involved six BP-related secondary terms, two CC-related secondary terms, and two MF-related secondary terms, including organelle (CC), intracellular organelle (CC), and cellular metabolic process (BP) (Fig. 4b).
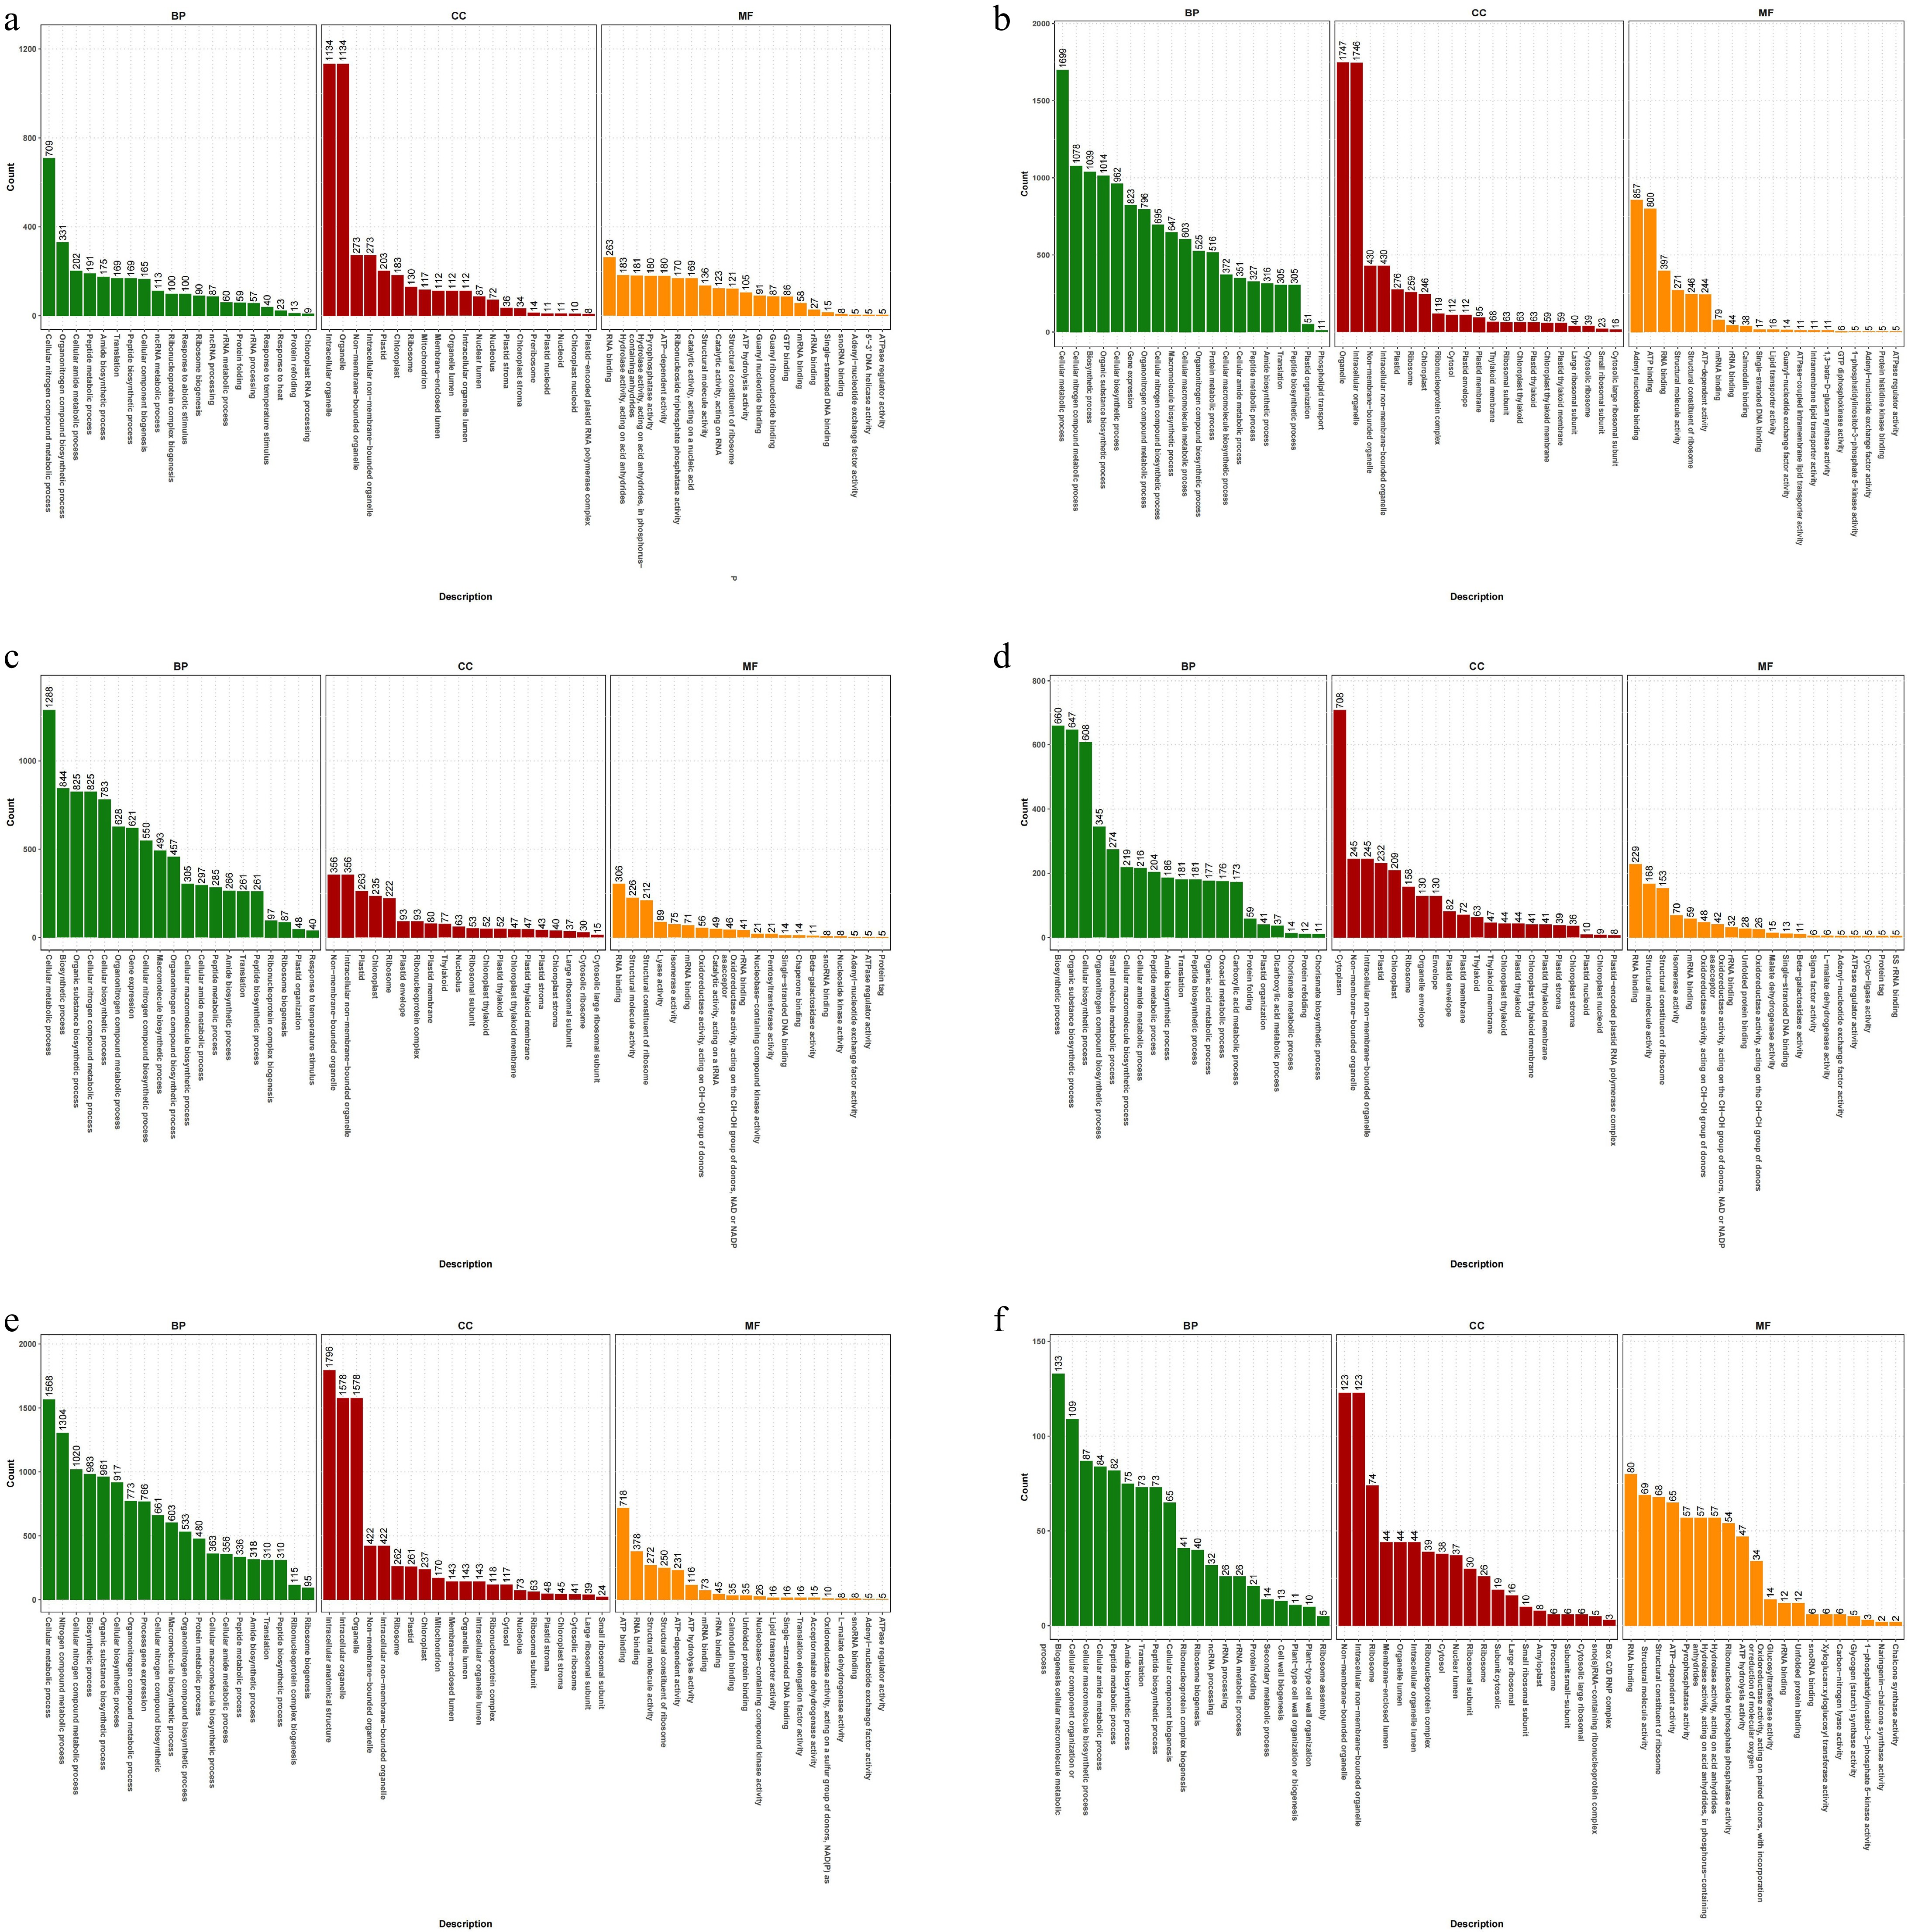
Figure 4.
GO annotation of celery DEGs of different photoperiodic treatments and sampling time points. (a) T0h vs T6h. (b) T0h vs T12h. (c) T0h vs T18h. (d) T0h vs T24h. (e) T0h vs F24h. (f) T24h vs F24h.
For T0h vs T18h, all of the top 10 DEGs secondary terms belong to BP, mainly related to cellular metabolic process, biosynthetic process, and organic substance biosynthetic process (BP) (Fig. 4c). In the top 10 DEGs of T0h vs T24h, the annotations involved five BP-related secondary terms, four CC-related secondary terms, and one MF-related secondary terms, including cytoplasm (CC), biosynthietic process (BP), and organic substance biosynthetic process (BP) (Fig. 4d).
In the top 10 DEGs of T0h vs F24h, the annotations involved seven BP-related secondary terms and three CC-related secondary terms. Mainly related to intracellular anatomical structure (CC), intracellular organelle (CC), and organelle (CC) (Fig. 4e). Among the top 10 DEGs of T24h vs F24h, the annotations involved six BP-related secondary terms, three CC-related secondary terms, and one MF-related secondary terms, including cellular macromolecule metabolic process (BP), non-membrane-bounded organelle (CC), and intracellular non-membrane-bounded organelle (CC) related pathways (Fig. 4f).
KEGG enrichment analysis of celery DEGs of different photoperiodic treatments, and sampling time points
-
KEGG (Kyoto Encyclopedia of Genes and Genomes) is an integration of genome, chemical, and comprehensive information database system functions. By KEGG enrichment analysis of DEGs, the first 20 pathways with the smallest p-value were selected for scatter plot analysis. The smaller the p-value, the more enriched the DEGs. In the comparison of all groups, DEGs mainly enriched in lysine, phenylalanine, and flavonoid pathways, the largest number of DEGs were found in the biosynthesis of secondary metabolites and metabolic pathways.
For the T0h vs T6h, the most enriched DEGs include lysine biosynthesis, aminoacyl-tRNA biosynthesis, arginine biosynthesis, monobactam biosynthesis, ubiquinone, and other terpenoid-quinone biosynthesis. The largest number of DEGs was biosynthesis of secondary metabolites (Fig. 5a). In the T0h vs T12h, DEGs mainly enriched in lysine biosynthesis, tropane, piperidine, and pyridine alkaloid biosynthesis, glyoxylate, and dicarboxylate metabolism, arginine biosynthesis, and phenylalanine metabolism. The largest number of DEGs was ribosome (Fig. 5b).
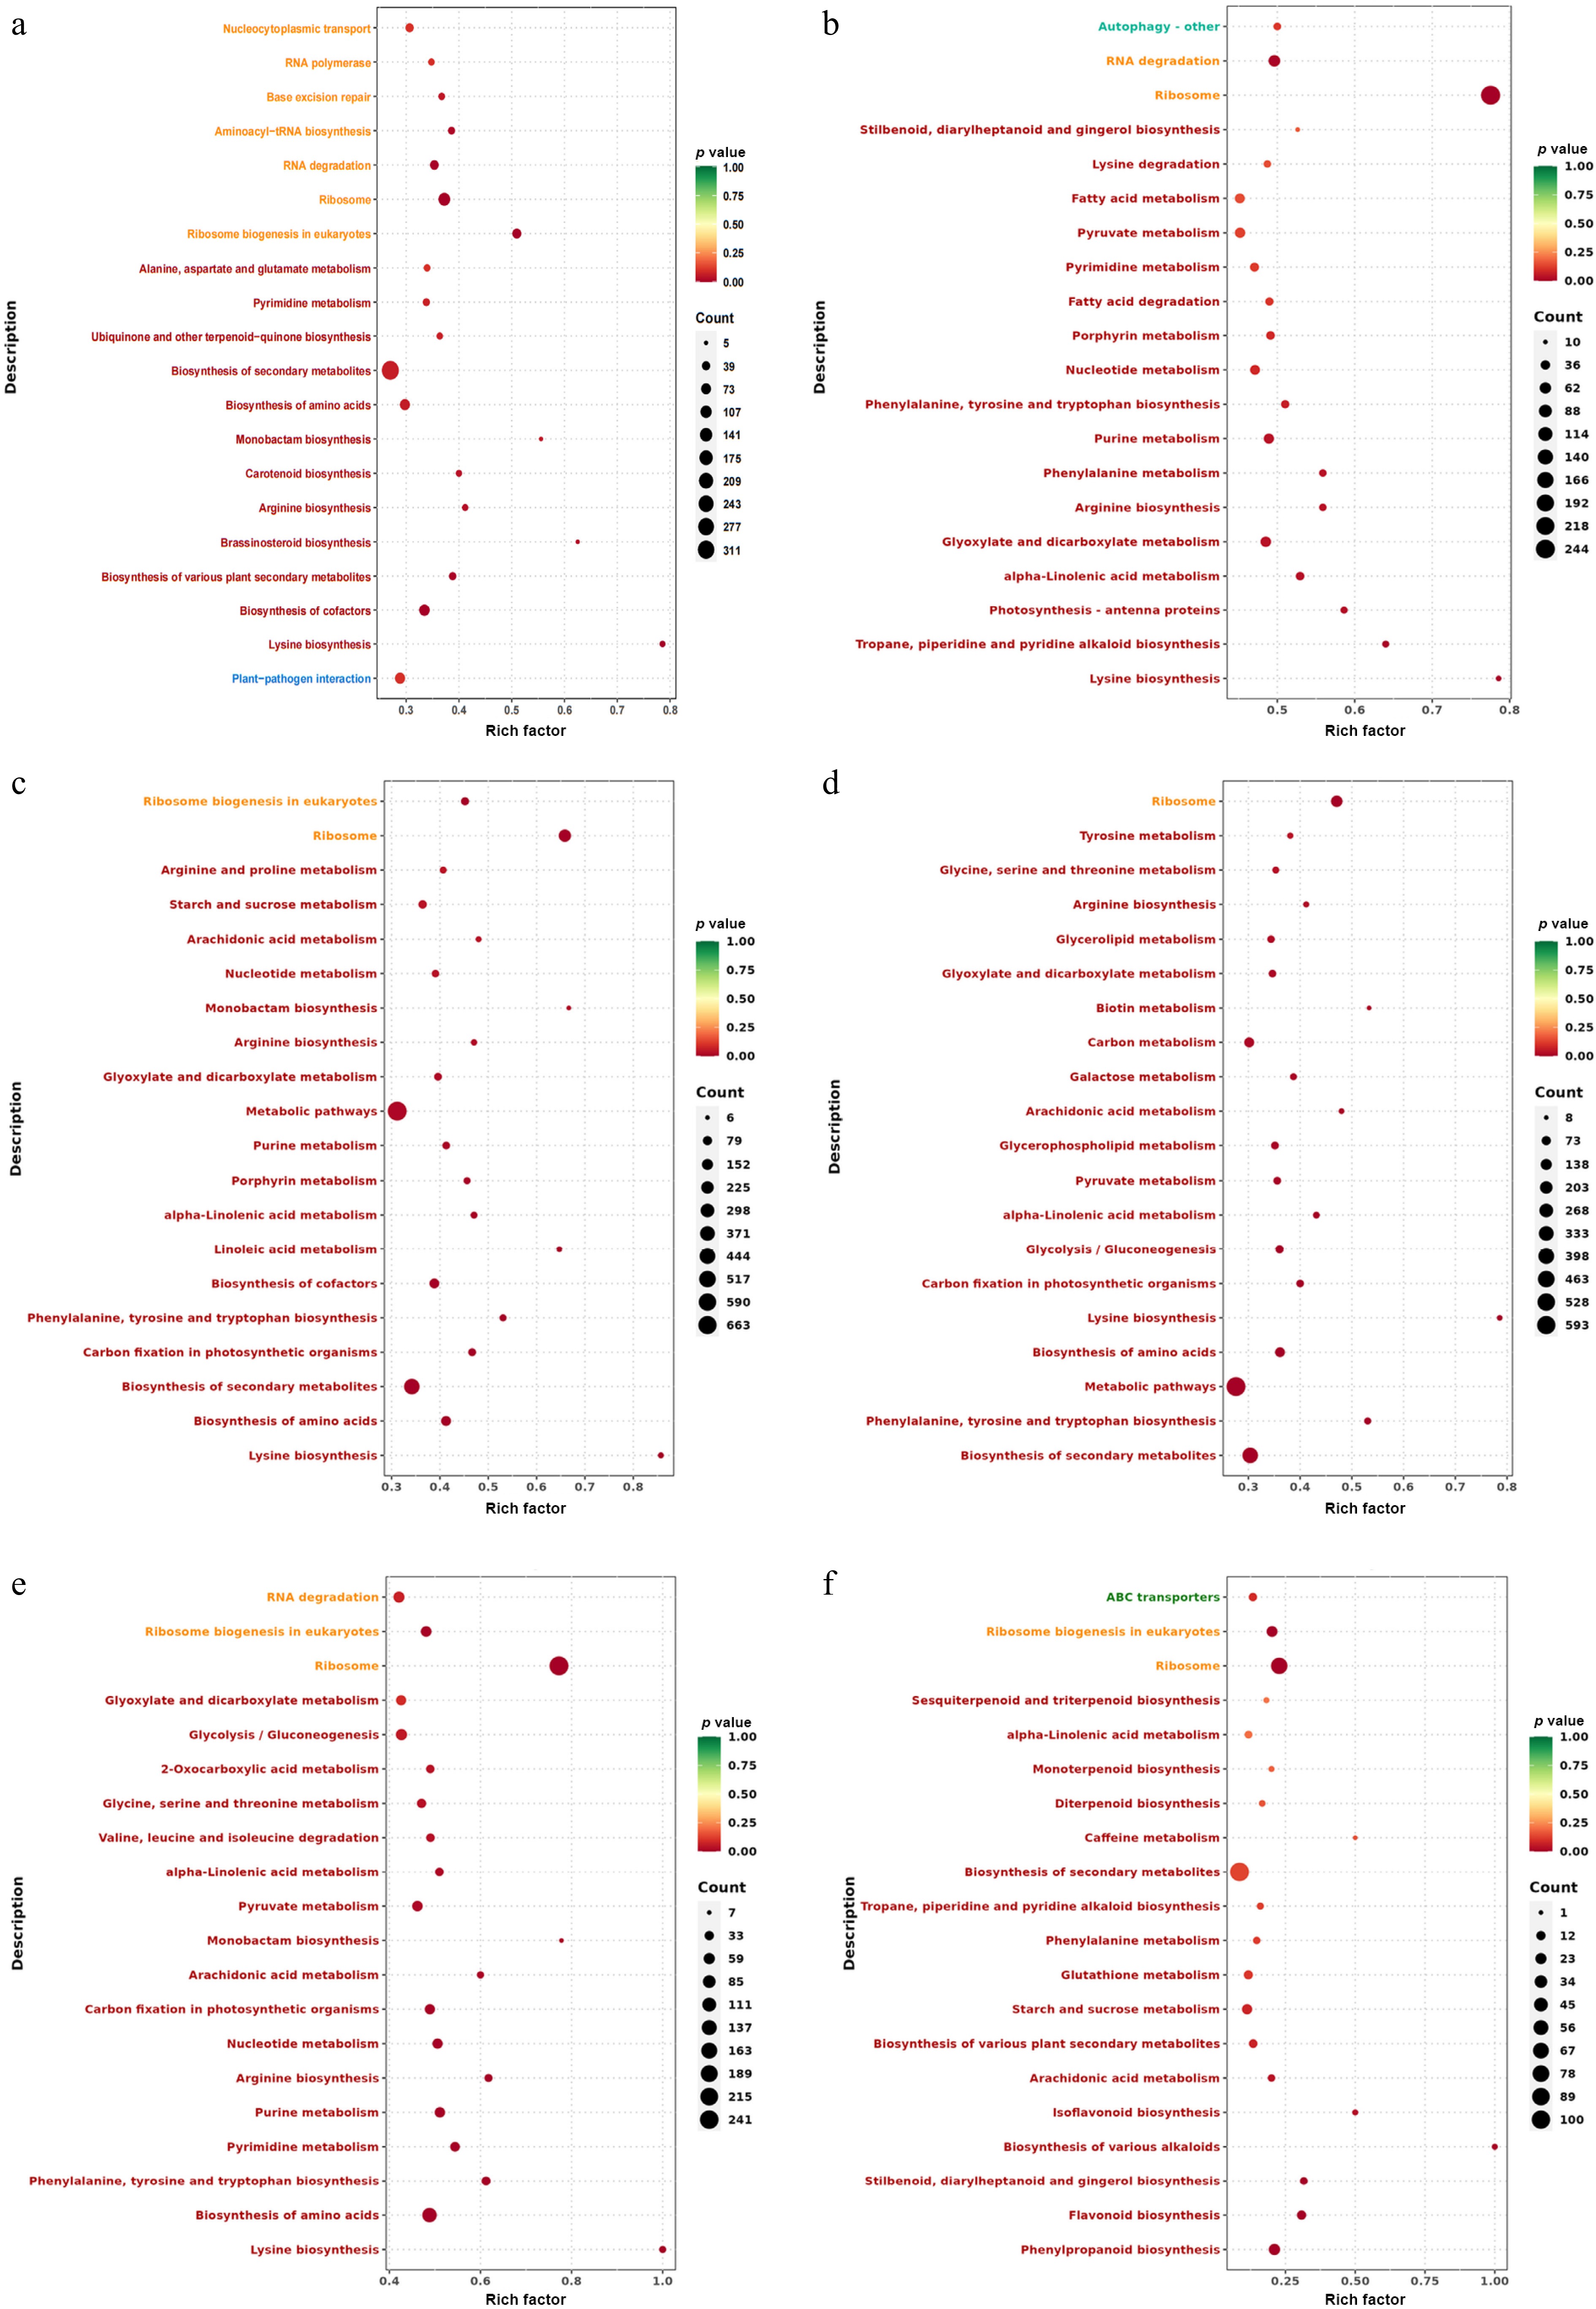
Figure 5.
KEGG enrichment analysis of celery DEGs of different photoperiodic treatments and sampling time points. (a) T0h vs T6h. (b) T0h vs T12h. (c) T0h vs T18h. (d) T0h vs T24h. (e) T0h vs F24h. (f) T24h vs F24h.
In T0h vs T18h, DEGs were mainly enriched in lysine biosynthesis, carbon fixation in photosynthetic organisms, phenylalanine, tyrosine, and tryptophan biosynthesis, porphyrin metabolism, and purine metabolism. The largest number of DEGs was associated with metabolic pathways (Fig. 5c). For T0h vs T24h, the most enriched DEGs including phenylalanine, tyrosine, and tryptophan biosynthesis, lysine biosynthesis, carbon fixation in photosynthetic organisms, glycolysis/gluconeogenesis, and pyruvate metabolism. The largest number of DEGs was metabolic pathways (Fig. 5d).
For T0h vs F24h, the most enriched DEGs include lysine biosynthesis, phenylalanine, tyrosine, and tryptophan biosynthesis, pyrimidine metabolism, purine metabolism, and arginine biosynthesis. The largest number of DEGs was ribosome (Fig. 5e). In T24h vs F24h, DEGs were mainly enriched in phenylpropanoid biosynthesis, flavonoid biosynthesis, starch and sucrose metabolism, glutathione metabolism, and phenylalanine metabolism. The largest number of DEGs was the biosynthesis of secondary metabolites (Fig. 5f).
Gene expression patterns related to flavonoid biosynthesis in celery of different photoperiodic treatments and sampling time points
-
In the GO annotation and KEGG enrichment analysis of celery DEGs under different photoperiodic treatments, the secondary metabolic process (the biosynthesis and metabolism of flavonoid and its precursor phenylalanine) was mainly involved. To understand the effects of different photoperiod treatments on the flavonoid pathways, we analyzed the expression rhythms of genes related to flavonoid metabolism in celery[28].
Compared with T0h, at each sampling period of 6L6D treatment, the expression of AgCHS, AgCHI, and AgFNS genes were promoted; the expression of the AgF3'H gene was promoted only at 24 h, while AgC4H and Ag4CL was promoted at 12, 18, and 24 h. In T0h vs F24h, all genes related to flavonoid synthesis were induced except AgPAL, and the expression level was higher than that of T24h (Fig. 6).
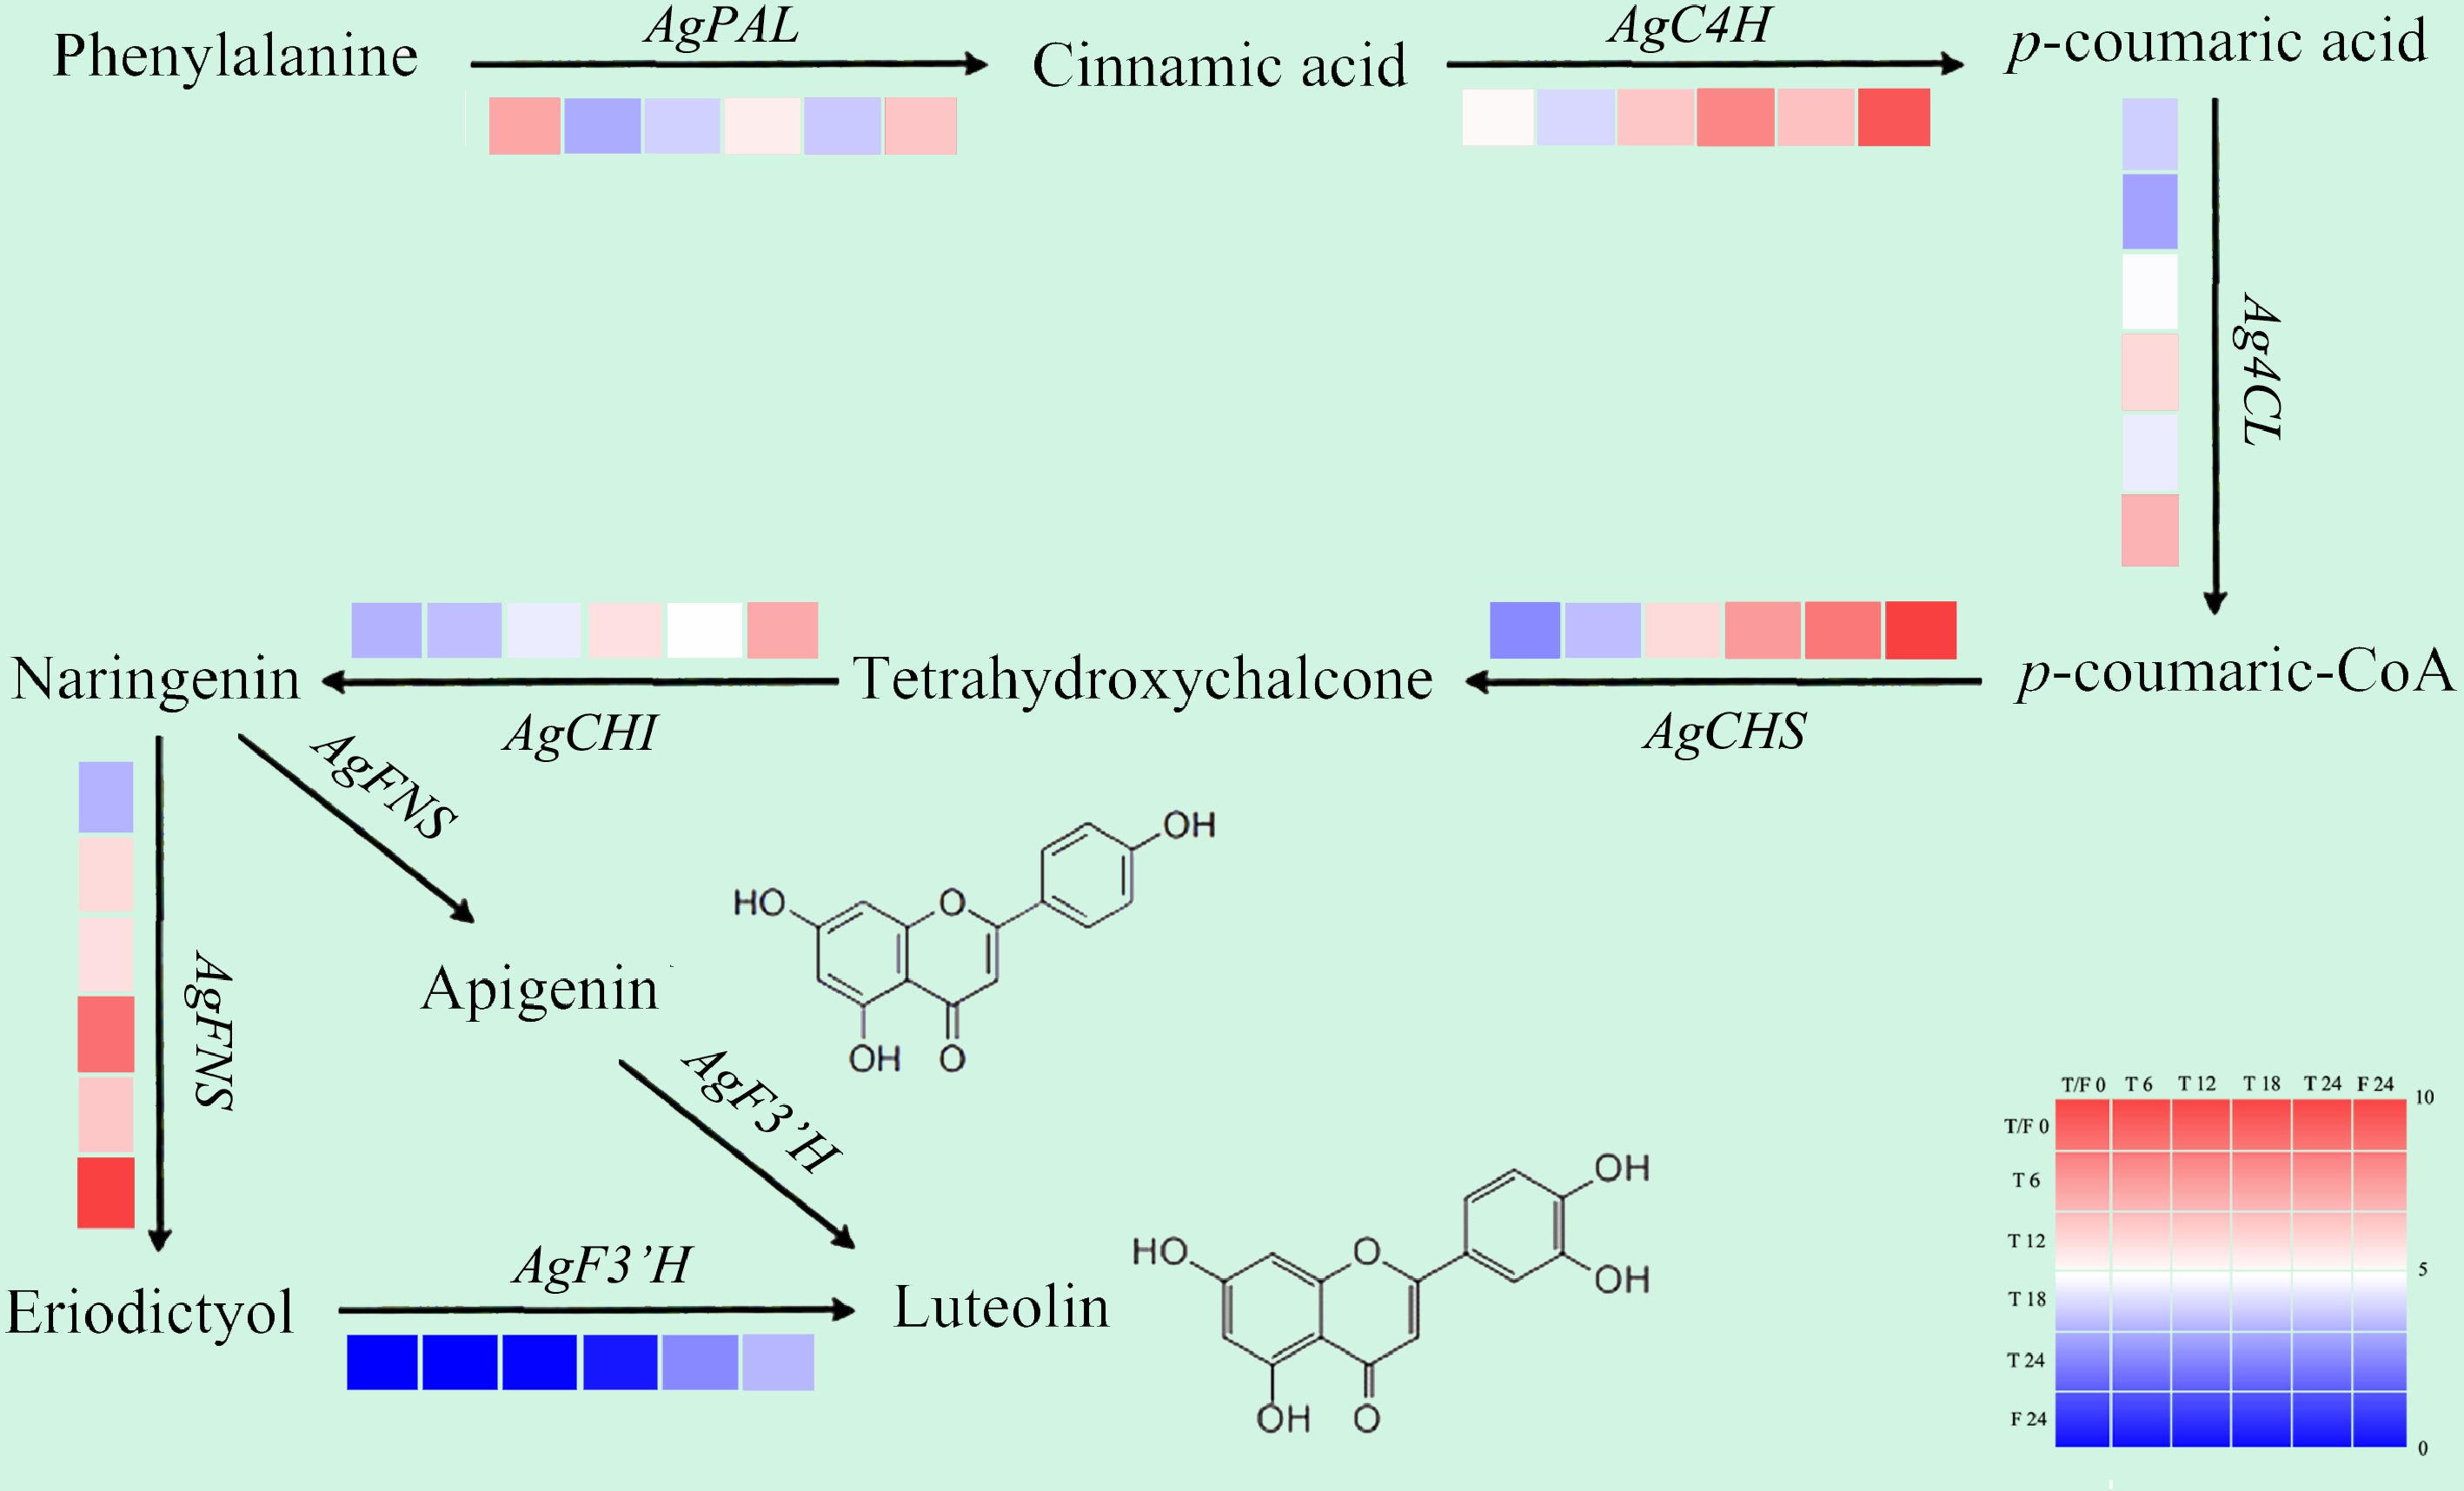
Figure 6.
Gene expression patterns related to flavonoid biosynthesis in celery of different photoperiodic treatments and sampling time points.
After different photoperiod treatments, the expression of genes related to the flavonoid metabolism pathway was mainly up-regulated at each sampling point (except AgPAL). The expression of the genes AgCHS and AgFNS, were induced at each test point with higher levels than that at T0 point throughout. For the measure points after 24 h of treatment, compared with T24, a majority of genes related to flavonoid metabolism showed higher expression levels in F24h (except AgPAL). The whole day illumination treatment was beneficial to the expression of flavonoid pathway genes in celery.
Expression profiles of flavonoid biosynthesis-related genes in celery under different photoperiod treatments and at various sampling time points
-
After different photoperiod treatments, most flavonoid biosynthesis-related genes exhibited peak expression at 24 h under the F treatment, except for AgPAL (Fig. 7). For AgFNS and AgF3'H, the relative expression levels were 16.18 and 8.47-fold higher than that at the beginning of treatment, respectively. Under the T treatment, maximal induction of these genes mainly occurred at 18 h. The relative expression levels of the AgCHS, AgCHI, and AgFNS genes were all elevated at each sampling point in both the T and F treatments (Fig. 7d, f & g).
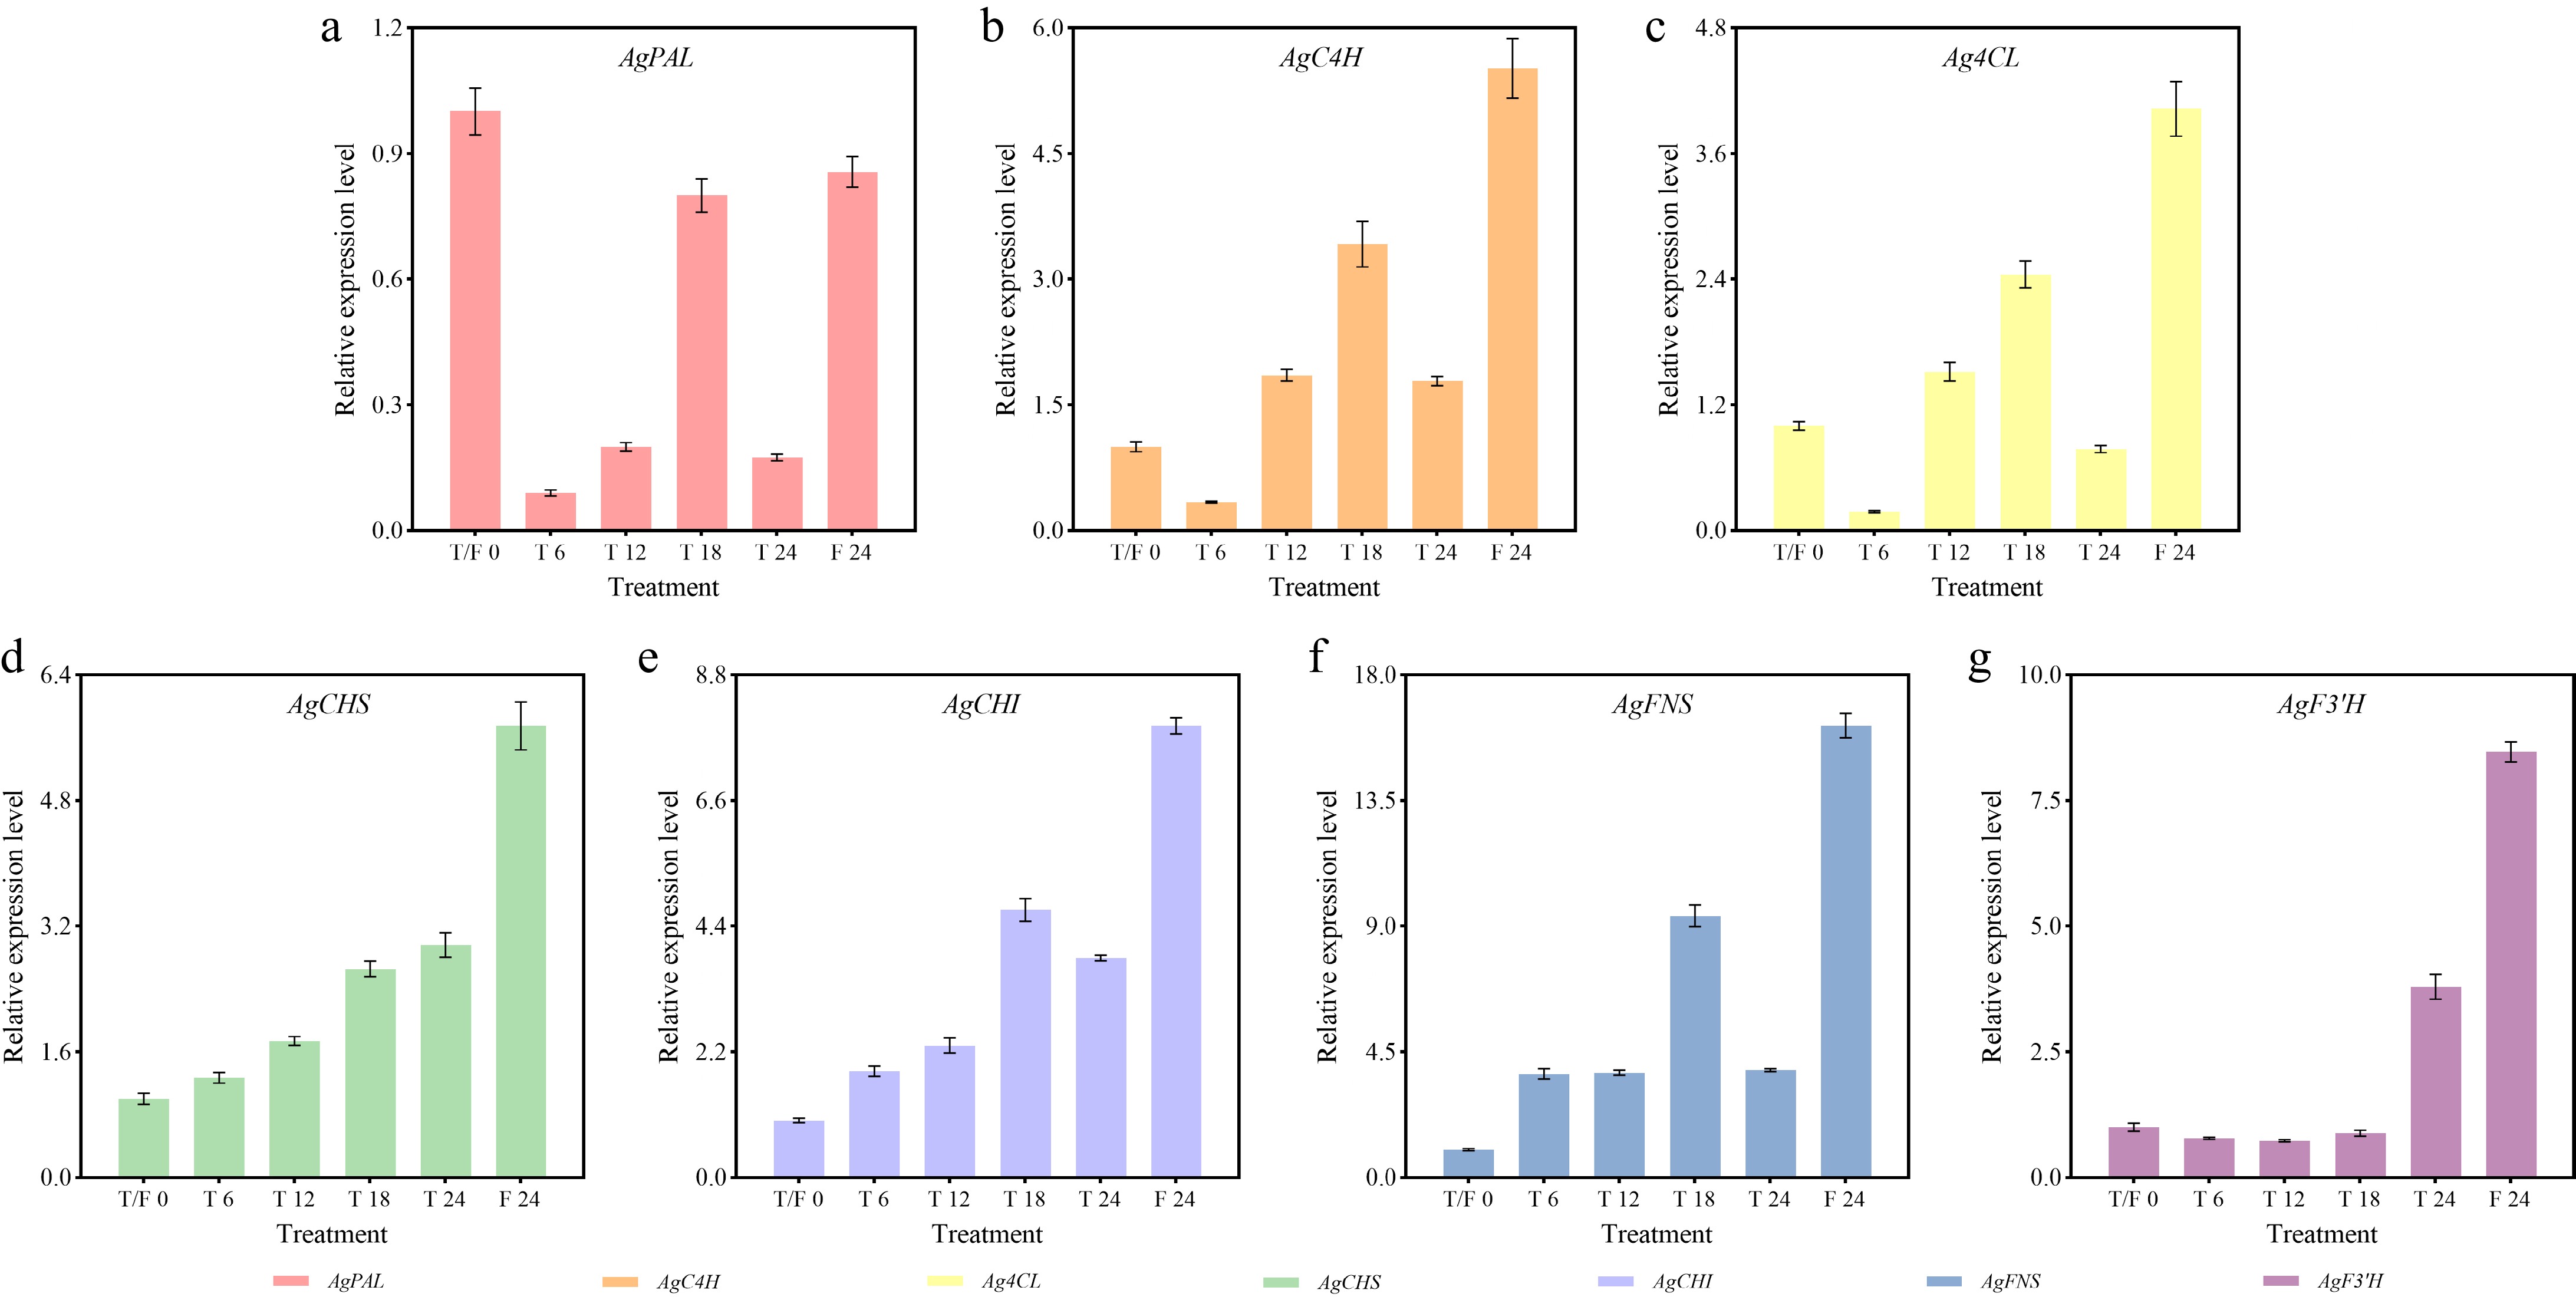
Figure 7.
Expression profiles of flavonoid biosynthesis-related genes in celery under different photoperiod treatments at various time points. (a) AgPAL. (b) AgC4H. (c) Ag4CL. (d) AgCHS. (e) AgCHI. (f) AgFNS. (g) AgF3'H.
Compared to the beginning of the treatments, the expression of AgPAL was downregulated at all time points in the T and F treatments, reaching the lowest point at the 6-h time point in the T treatment (Fig. 7a). AgC4H and Ag4CL showed similar expression patterns, with the highest levels observed at 24 h in the F treatment, followed by 18 h in the T treatment, and the lowest at 6 h in the T treatment (Fig. 7b & c). AgCHS expression increased gradually during the T treatment. It peaked at 24 h under the F treatment (Fig. 7d). AgCHI and AgFNS exhibited minimal expression at the beginning of the treatments, reaching maximum levels at 24 h in the F treatment and secondary peaks at 18 h in the T treatment (Fig. 7e & f). AgF3'H showed low expression at 6, 12, and 18 h, followed by an increase at the 24 h under the T treatment, and reached the maximal level at the 24 h in the F treatment (Fig. 7g).
Flavonoid content under different photoperiod treatments and sampling time points in celery
-
Compared to the beginning of the treatments, the content of apigenin and luteolin increased at each sampling point in all treatments, except at 12 h in the T treatment. Continuous light treatment was more conducive to flavonoid biosynthesis, whereas intermittent light photoperiods disrupted the continuous accumulation of flavonoids. The highest levels of apigenin (6.82 mg/g), and luteolin (3.35 mg/g) were observed at 24 h under the F treatment, representing 1.74- and 2.07-fold increase, respectively, compared to initial levels (Fig. 8). Under the T treatment, apigenin content increased significantly during light treatment but decreased during dark treatment, peaking at 18 h (5.76 mg/g) (Fig. 8a). Luteolin content increased sharply at 6 h, declined at 12 h, and then gradually increased, reaching its highest level (1.91 mg/g) at 24 h (Fig. 8b).
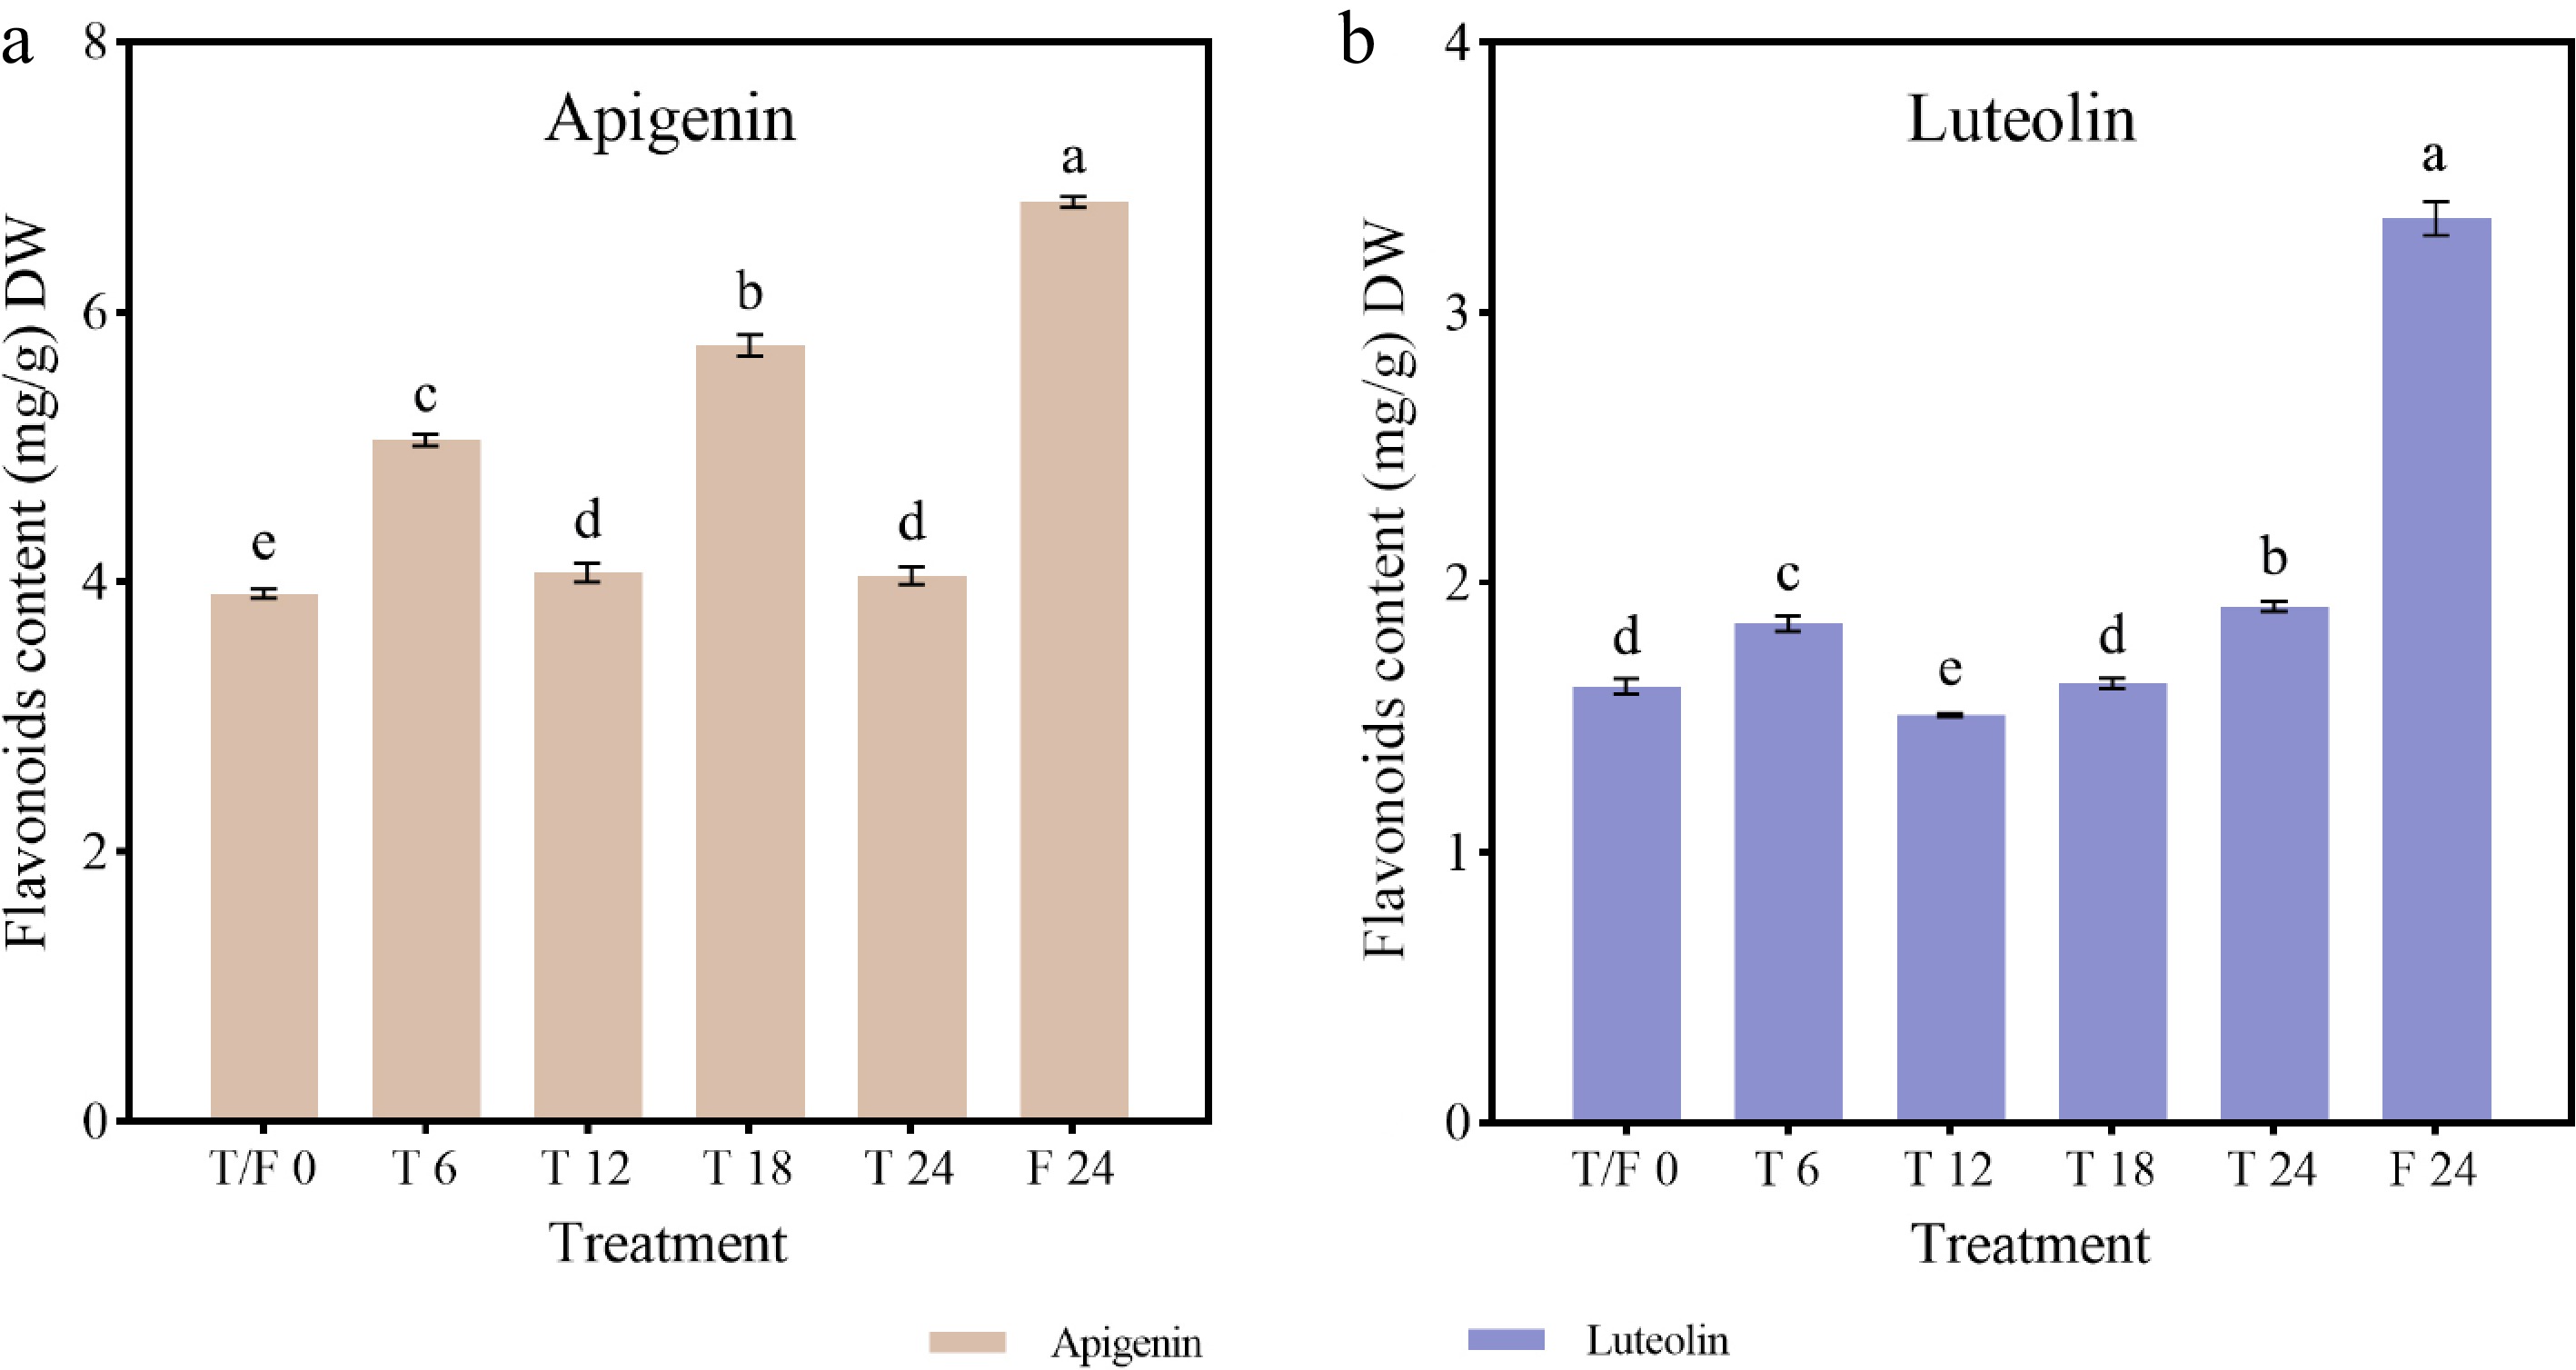
Figure 8.
Flavonoid content in celery under different photoperiod treatments and at various sampling time points. (a) Apigenin. (b) Luteolin.
-
In temperate regions, the Earth's rotation affects the variable photoperiod and the seasonal phenological changes[34]. The regularly changing photoperiod was an important signal for plants to predict changes in the natural environment and adjust their life cycle accordingly[35]. With different photoperiod requirements of flourescence response, plants could be divided into three categories: short-day plants (SDPs), long-day plants (LDPs), and diurnal neutral plants (DNPs)[36]. In addition, the response of plants to photoperiod was also related to the length of light and dark periods and the number of cycles. For celery and many deciduous trees, the extended sunshine in spring was the necessary factor for the germination of the flowers or leaves buds[17,37]. Under low temperatures and short-day conditions (light/dark = 10 h/14 h), a 10-week treatment can induce the semi-dormancy state in strawberries (Fragaria × ananassa Duch.), and this state can be broken by long-day treatment (light/dark = 14 h/10 h)[38]. Metabolomics results showed with the extension of light treatment, the metabolic derivative contents of carbohydrates and flavonoids in bean sprouts were up-regulated[39]. In our study, the photoperiodic pattern and the length of treatment time together affected the pathways and expression rhythms of DEGs. The periodic cycle of light and dark drove the rhythmic alternations of organelle biosynthesis and metabolic reactions.
As the limiting factor of photosynthesis, light factors (strength, quality, and photoperiod) affect the biomass accumulation and physiological cycle (florescence regulation, dormancy) of plants[40]. The popularization and application of artificial light sources in facility agriculture production are helpful in improving the comprehensive quality of crops and shortening the cultivation cycle of crops[41,42]. Short-day treatment (light/dark = 8 h/16 h) was disadvantageous to chlorophyll and biomass accumulation in lettuce (Lactuca sativa); however, dry weight was promoted with all-day sunshine treatment[35]. In rocket (Eruca sativa), photoperiod treatment shorter than 14 h/10 h (light/dark) improved the growth and photosynthetic pigment content significantly[43]. Photoperiodic regulatory network of Oryza sativa showed that rhythonomic differentially expressed genes (RDGs) were the core components of circadian control. Photosynthesis, starch synthesis, and hormone signal transduction were regulated by influencing the downstream gene expression rhythm of rice. RDGs between day and night were mainly concentrated in photosynthesis and stress response[44]. As we expected, DEGs were enriched in metabolic pathways but not in circadian rhythm, indicating that the abrupt change in photoperiod disturbed the circadian clock of celery. With the increase of light-dark alternating cycles, the rhythmic regression of DEGs may have been related to the establishment of new transcriptional rhythms.
The circadian clock is an important internal regulator of life rhythm, as a hub for biological responses to changes in natural conditions (light, temperature, humidity, etc.)[45]. Photoperiod change, as an input signal perceived by the core oscillator of the circadian clock, and causes changes in the expression pattern of circadian clock genes and related physiological processes[46]. Signals can be transmitted by semi-autonomous organelles in the form of retrograde signals, or through carriers such as differential splice variants and certain signal molecules (hormones, secondary metabolic substances, etc.)[47]. In barley (Hordeum vulgare) mutants of ELF3 or LUX1, the circadian oscillation rhythm of plant transcriptomes disappeared under constant light conditions but was restored under regular day-night alternations[48]. With different photoperiods treatments, the DEGs of Liriodendron chinensis buds were enriched in flavonoid biosynthesis, phenylpropanoid biosynthesis, and hormone pathways[49]. In the CHS deletion mutant of Arabidopsis thaliana, the chlorophyll cycle was cancelled, and the transcriptional rhythm of circadian genes (CCA1 and TOC1) was changed. The transcriptional rhythm of CCA1 could be partially restored with the exogenous quercetin (a type of flavonoid) treatment[50]. The response pathway of celery to different photoperiodic treatments was mainly a secondary metabolic pathway. DEGs related to the flavonoid pathway were enriched in the majority of combinations, and the expression of most genes related to flavonoid synthesis were promoted and showed interdiurnal fluctuation. This suggests that flavonoid metabolism is an important output pathway for the circadian clock in response to photoperiodic changes of celery.
Celery is rich in flavonoids (mainly apigenin and luteolin), which give celery medicinal activity and are an important part of the antioxidant defense system under excessive light stress[2]. CHS (chalcone synthase), FNS (flavone synthase), and F3'H (flavonoid 3'-hydroxylase) are the key genes for the synthesis of plant flavonoids that can respond to changes in light conditions[51]. In tea (Camellia sinensis), CHS genes respond to light stress by regulating the synthesis of flavonoids, and UV-B exposure may be a key driver behind the gene duplication events in CsCHS[52]. Wheat (Triticum aestivum) transcriptome data showed, under long-term UV-B irradiation, that the flavonoid-pathway-related genes F3H exhibited higher expression levels and significantly increased flavonoid content[53]. For celery, long-term UV-B radiation induced the FNS enzymes involved in the synthesis of apigenin, and the apigenin produced could protect plants from radiation damage[10,54]. Compared with the photoperiod of equinoctial day and night, continuous illumination for 24 h significantly increased the apigenin and luteolin content in celery. AgCHS, AgFNS, and AgF3'H, which serve as key genes in the flavonoid synthesis pathway, showed a sensitive response to photoperiods and should be the focus of future studies.
Recent studies have shown that circadian clocks are also important in plant stress resistance and range expansion. For adaptation to the regular diurnal changes of natural conditions, plants need to adjust their diurnal metabolic rhythms[55]. The immune time is usually during the day to deal with more changeable environmental conditions (such as light stress). The growth period is arranged at night when environmental conditions are more stable[56]. As a secondary metabolite with antioxidant properties, flavonoids are widely found in plants and participate in plant immune physiological regulation[57]. Mutations in genes related to the flavonoid pathway affect the rhythmic expression of the circadian clock[50]. For adaptation to challenging living conditions, the wild original varieties often have higher flavonoid content and antioxidant activity than artificially domesticated varieties[58]. Combined with the present experiment, the regulation of flavonoid metabolism rhythm may also be an important output of the circadian clock in response to changes in light conditions. However, under circadian clock regulation, the rhythmic-regulated genes and models regarding the photoperiod response of the flavonoid pathway still need to be explored.
-
The transcriptome response patterns of celery were significantly changed under different photoperiodic treatments, regulated by light-dark cycle, treatment duration, and circadian clock robustness. During the 24 h of light treatment, the original biosynthesis and metabolic rhythms were destroyed by truncated photoperiod or full periodic illumination. From 0 to 24 h, the rhythmical regression of transcriptome gene expression patterns in truncated photoperiod, related to the gradual establishment of new circadian homeostasis. Secondary metabolic the pathways of lysine, phenylalanine, and flavonoids frequently respond to photoperiodic rhythm changes. Most genes in the flavonoid biosynthesis pathway (especially AgCHS, AgFNS, and AgF3'H) were upregulated at multiple time points. Under continuous light conditions, both apigenin and luteolin accumulation and the expression flavonoid-related biosynthetic genes were strongly promoted compared to truncated photoperiod treatment. These findings demonstrate the regulatory influence of photoperiod on transcriptional rhythms and the responsiveness of related metabolic pathways in celery. This study provides a foundation for further research on key pathways in plant photoperiodic responses and circadian clock outputs.
The research was supported by the Key Research and Development Program of Suqian (L202308), Key Research and Development Program of Jiangsu (BE2022386), Jiangsu Seed Industry Revitalization Project (JBGS [2021]068), Coordinated Extension of Major Agricultural Technologies Program of Jiangsu (2022-ZYXT-01-3), Priority Academic Program Development of Jiangsu Higher Education Institutions Project (PAPD), and the high-performance computing platform of Bioinformatics Center of Nanjing Agricultural University.
-
The authors confirm contributions to the paper as follows: conceptualization: Chen C, Xiong JS, You X, Xiong AS; data curation: Chen C, Huang T, Wang LX, Li MY, Tan GF, Li YP; investigation: Chen C, Huang T, Wang LX, Li MY, Tan GF, Li YP, Hu ZH; methodology: Chen C, Wang LX, Li MY, Tan GF, Li YP, Hu ZH; visualization: Chen C, Huang T, Liu PZ, Hu ZH, Liu H, Lv HM; writing—original draft preparation: Chen C, Hu ZH, Tao JP; formal analysis: Huang T, Liu PZ, Hu ZH, Liu H, Lv HM; software: Huang T, Liu PZ, Liu H, Lv HM; supervision: Wang LX, Xiong JS, You X, Tao JP, Xiong AS; resources: Xiong JS, You X, Xiong AS; writing – review & editing: Xiong JS, You X, Xiong AS; project administration: Tao JP, Xiong AS; funding acquisition: Xiong AS. All authors reviewed the results and approved the final version of the manuscript.
-
All data generated or analyzed during this study are included in this published article.
-
The authors declare that they have no conflict of interest.
- Supplementary Fig. S1 Celery plants 60 days after sowing.
- Copyright: © 2025 by the author(s). Published by Maximum Academic Press, Fayetteville, GA. This article is an open access article distributed under Creative Commons Attribution License (CC BY 4.0), visit https://creativecommons.org/licenses/by/4.0/.
-
About this article
Cite this article
Chen C, Huang T, Wang LX, Xiong JS, Li MY, et al. 2025. High-throughput transcriptomic analysis of circadian rhythm of flavonoid metabolism under different photoperiods in celery. Vegetable Research 5: e028 doi: 10.48130/vegres-0025-0021 

High-throughput transcriptomic analysis of circadian rhythm of flavonoid metabolism under different photoperiods in celery
- Received: 27 February 2025
- Revised: 16 April 2025
- Accepted: 12 May 2025
- Published online: 06 August 2025
Abstract: Photoperiod is important for plants to predict the changing trend of the environment and adjust their physiological, metabolic rhythm. In this study, we investigated the transcriptional responses of celery (Apium graveolens L.), an important leaf vegetable whose physiological cycles were photoperiod-dependent, under two different light regimes for 24 h: truncated photoperiod (light/dark: 6 h/6 h, recorded as T) and full periodic illumination (light/dark: 24 h/0 h, recorded as F). Samples were collected continuously for high-throughput transcriptome sequencing and differentially expressed genes (DEGs) were annotated and analyzed. Compared with the treatment beginning, 4,466~7,398 DEGs were identified in each sample, with the largest number between T0h vs T12h. For comparison between T24h and F24h, the number of DEGs was the lowest (3,056). GO annotation showed that DEGs were mainly enriched in biological processes and cell composition. KEGG enrichment pathway analysis showed that the DEGs were mainly concentrated in the secondary metabolism-related pathways (lysine, phenylalanine, and flavonoids). Compared to truncated photoperiod, full periodic illumination for 24 h enhanced the expression of flavonoid biosynthetic genes (particularly AgCHS, AgFNS, and AgF3'H) and increased flavonoid accumulation. Our results demonstrated that the transcriptional rhythms of celery were dynamically regulated by both light-dark cycles and circadian clock mechanisms, with flavonoid pathway genes exhibiting particular sensitivity to photoperiodic changes. These findings provide important insights into the molecular mechanisms underlying plant photoperiod responses and may serve as a valuable foundation for future research on the circadian regulation of plant metabolism and development.
-
Key words:
- Celery /
- Photoperiodic response /
- Transcriptomics rhythm /
- Flavonoid pathway /
- Circadian clock