


-
Cucumber (Cucumis sativus L.) is a commonly grown vegetable, usually picked while still unripe and eaten as a juicy, fleshy fruit[1]. Astringency, a key factor affecting cucumber palatability, is a tactile sensation rather than a primary taste, characterized by dryness, roughness, and a tightening effect in the mouth[2]. It results from the formation of insoluble precipitates due to interactions between polyphenols and salivary proteins, which increase oral friction[3]. This property can substantially affect consumer preferences and acceptance. Thus, understanding and managing astringency in cucumber fruits is essential for maintaining and enhancing their marketability and consumer satisfaction.
Currently, the identified astringent compounds include polyphenols, organic acids, inorganic acids, metal ionic salts, and dehydrating agents[4]. The astringency of most horticultural fruits is primarily attributed to polyphenols[5], which are widely distributed secondary metabolites in plants, predominantly as flavonoids and phenolic acids[6]. Flavonoids, an extensive group of polyphenolic metabolites, encompass six major subclasses defined by their distinct molecular architectures: chalcones, flavanediols, flavones, anthocyanidins, flavonols, and proanthocyanidins[7]. The precursor of flavonoids is phenylalanine, which undergoes sequential catalysis by phenylalanine ammonia-lyase (PAL), cinnamic acid 4-hydroxylase (C4H), and 4-coumaroyl CoA ligase (4CL), producing cinnamic acid, coumaric acid, and 4-coumaroyl CoA in the phenylpropanoid metabolic pathway[8,9]. PAL functions as the key regulatory enzyme in this process[10]. Chalcone synthase (CHS) catalyzes the condensation of 4-coumaroyl-CoA and malonyl-CoA to form chalcone, which is then converted into dihydroflavonols through enzymatic actions of chalcone isomerase (CHI) and flavanone 3-hydroxylase (F3H). Dihydroflavonols, precursors for anthocyanins, tannins, and other flavonoid compounds, are enzymatically reduced to leucocyanidin by dihydroflavonol 4-reductase (DFR). In plants, leucocyanidin is converted to proanthocyanidins through two pathways. One pathway involves its conversion into cyanidin by anthocyanin synthase, followed by the catalysis mediated by anthocyanidin reductase (ANR) to form epicatechin. Cyanidin also contributes to proanthocyanidin formation through UDP-flavonoid 3-O-glucosyltransferase (UFGT). The second pathway entails the direct transformation of leucocyanidin into catechin, catalyzed by leucoanthocyanidin reductase (LAR). Finally, epicatechin and catechin from the two pathways polymerize to form proanthocyanidins[11−13].
Transcriptional regulation by transcription factors (TFs) is a key determinant of flavonoid biosynthesis. MYB12, an R2R3-MYB TF in Arabidopsis, serves as a specific activator for flavonol biosynthesis[14]. In Arabidopsis, the TFs MYB11, MYB12, and MYB111 regulate the expression of key genes in the flavonoid biosynthetic pathway, such as CHS, CHI, F3H, and FLS1, during seedling development. Specifically, AtMYB12 controls flavonoid production in the roots, while AtMYB111 regulates it in the cotyledons[15]. Another R3-MYB TF MYBL2 in Arabidopsis has been implicated in controlling the production of flavonoids. Deficiency in MYBL2 activity significantly increases anthocyanin accumulation, whereas its overexpression in seeds inhibits the biosynthesis of proanthocyanidins[16,17]. In grapes, VvMYBPA1 upregulates the expression of LAR and ANR, facilitating proanthocyanidin accumulation[18]. Moreover, Arabidopsis TRANSPARENT TESTA8 (AtTT8), which encodes a bHLH-type TF, cooperatively regulates the expression level of the flavonoid biosynthesis genes DFR and BANYULS (BAN) alongside TRANSPARENT TESTA GLABRA1 (TTG1) and TT2[19].
Combined multi-omics approaches are increasingly employed for genome-wide investigations[20,21]. However, the application of multi-omics technologies for the analysis of cucumber astringency has not been reported yet. In this study, RNA-seq and Metabolome-seq were utilized to analyze the differentially expressed genes (DEGs) and differentially accumulated metabolites (DAMs) in two cucumber inbred lines varying greatly in their astringency levels. Through a comprehensive analysis encompassing DEG analysis and combined transcriptome and metabolome sequencing, this study identified the key regulatory factors and functional genes associated with cucumber astringency. The findings serve as a reference and offer valuable insights for identifying genes linked to cucumber astringency.
-
Cucumber plants utilized in this research were cultivated in the greenhouse of the Hebei Normal University of Science and Technology. Two cucumber inbred lines, namely slightly astringent FC (P1) and the strongly astringent HC (P2), served as the experimental materials. FC fruits at 9 dpp (P1-9d) and HC fruits at 3 dpp (P2-3d) with slight astringency, as well as HC fruits at 9 dpp (P2-9d) with strong astringency, were promptly frozen in liquid nitrogen and kept at −80 °C for later transcriptomic and metabolomic analyses.
Astringency level evaluation
-
The cucumbers were cut into fan-shaped strips and left to stand for 1 min. Ten evaluators tasted the area near the peel on the cross-section and the juice overflowing from the pulp through the tip of their tongues, providing a score and calculating the astringency index (AI). AI was calculated using the following formula:
AI =
$\rm \dfrac{{\text ∑}(si \times ni)}{6N} $ To ensure accuracy, the evaluators rinsed their mouths with soda water after each evaluation and took a 5-min break before assessing the next sample[22]. The grading criteria for the cucumber astringency index (AI) are defined as follows: AI = 0 represents no astringency, AI < 40 represents slight astringency, 40 ≤ AI < 70 represents moderate astringency, and AI ≥ 70 represents strong astringency.
RNA isolation, library construction and sequencing
-
Total RNA was isolated from cucumber fruits using the RNAprep Pure Plant Kit (Tiangen, China). A NanoDrop ND2000 spectrophotometer was used to determine the purity of RNA samples. The RNA was sent to Oebiotech (Shanghai, China) for Illumina NovaSeq 6000-based paired-end sequencing. Sequencing data were generated through the platform. To minimize the data error rates, raw data were preprocessed using fastp software (v0.20.1, parameter: --length_required 50) to remove low-quality reads, which yielded clean reads for subsequent statistical analyses[23]. The clean reads were aligned to the cucumber V3 reference genome by using hisat2 software (v2.1.0, parameter: --rna-strandness rf --fr) to obtain information on the positional and sequence characteristics unique to the samples[24]. For gene expression quantification, HTseq-count software (v0.11.2, parameter: -s reverse) was applied to determine read alignments to protein-coding genes in all samples[25].
Transcriptomics data analysis and plotting
-
Principal component analysis (PCA) with R (v3.2.0) was applied to evaluate the similarity of biological replicates and sample groups based on gene counts. DEGs were identified using the DESeq2 package[26], applying thresholds of q < 0.05 and |log2(fold change)| > 1. Genes meeting these criteria were classified as DEGs. Hypergeometric distribution-based enrichment analysis was performed on DEGs to identify significantly enriched Gene Ontology (GO) terms and KEGG pathways. Visualization of the enriched terms was performed via R (v3.2.0). Heatmaps, bubble charts, Venn diagrams, and bar charts for this analysis were generated using the ggplot2, pheatmap, and readxl packages in R.
Metabolite isolation and liquid chromatography–tandem mass spectrometry
-
Metabolite extraction was performed on cucumber fruits, with six biological replicates per sample type processed simultaneously. Metabolite extraction and determination were performed as described by Wu et al.[27].
Metabolomics data analysis and plotting
-
Unsupervised PCA was applied to evaluate the global distribution of samples and assess analytical stability. To ensure accurate differentiation between material groups, orthogonal partial least squares-discriminant analysis (OPLS-DA) was applied, and variable importance in projection (VIP) values was generated for each metabolite. Differential metabolites were identified by analyzing the metabolite data matrix, with the following parameters for each comparison group: p value < 0.05 and VIP > 1. Heatmaps, volcano plots, and bar charts of differential metabolites were created using the ggplot2 (3.5.1), pheatmap (1.0.12), and readxl (1.4.3) packages in R, respectively. KEGG pathway enrichment analysis was conducted using the KEGG IDs of differential metabolites to identify significantly enriched metabolic pathways in each group.
Quantitative real-time PCR
-
The inbred lines FC, LNTZT, 17S-50, 17S-33, and 17S-23 exhibit less astringency, while HC, 21A127, 21A114, 17S-135, and 17S-139 show higher astringency. Total RNA was isolated from fruits of the ten inbred lines using the aforementioned method, followed by reverse transcription with the FastQuant RT reagent kit (Tiangen, China). Three biological replicates were performed for each sample. qRT-PCR analysis was performed according to the protocol described by Zhang et al.[28]. Primer sequences are provided in Supplementary Table S1.
Statistical analysis
-
Data were analyzed using one-way ANOVA with Tukey's multiple comparisons test (GraphPad Prism 10.2.2), with statistical significance set at p ≤ 0.05.
-
In a previous report, the astringency levels of fruits (9 dpp) were examined from 228 cucumber germplasm resources[22]. Five genetic materials each were selected from those with low astringency and high astringency for subsequent experiments (Supplementary Table S2; Fig. 1a). The cucumber variety with the highest astringency taste out of all the cucumbers was HC, FC with the lowest astringency. The AIs for (FC) P1 fruits at 9 dpp (P1-9d) and (HC) P2 fruits at 3 dpp (P2-3d) were less than 40 and exhibited slight astringency. Meanwhile, the AI for P2 fruits at 9 dpp (P2-9d) exceeded 70 and had strong astringency (Fig. 1b; Supplementary Table S3). Based on these findings, fruits of P2-3d, P1-9d, and P2-9d were selected for subsequent untargeted metabolomics and transcriptomics analyses.
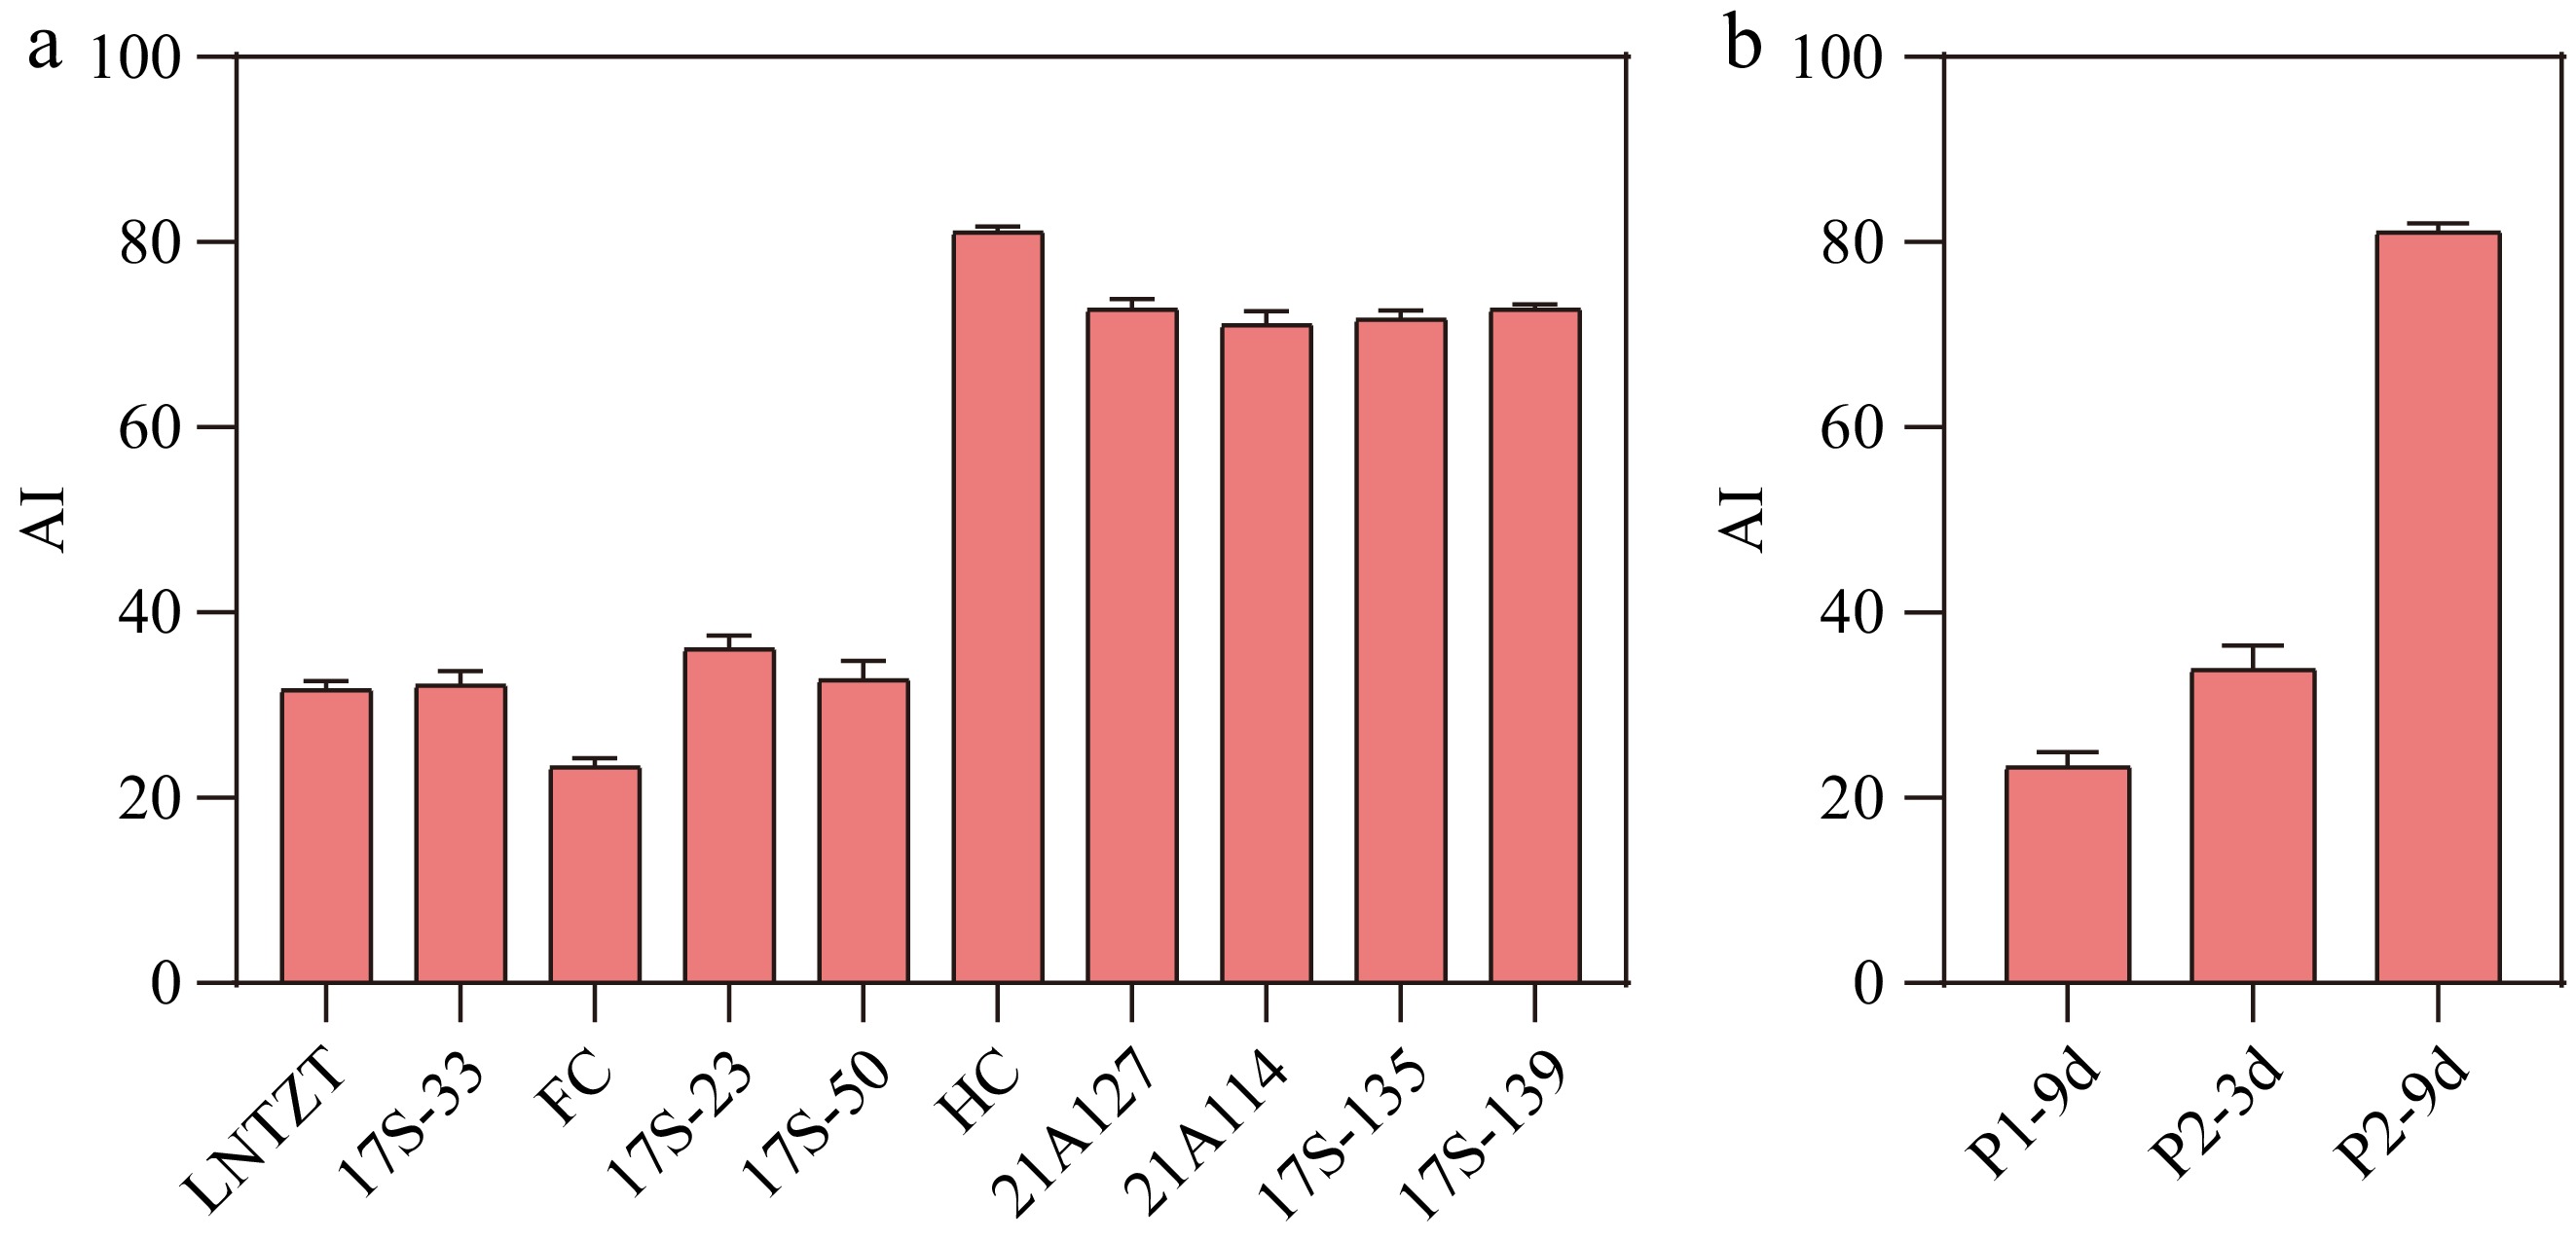
Figure 1.
(a) Evaluation of astringency levels for different cucumber fruits. (b) Evaluation of astringency levels for P1-9d, P2-3d, and P2-9d. AI: Astringency Index. Data are presented as the mean ± SD of three biological replicates.
Transcriptomic profiling during changes in astringency
-
To investigate the molecular basis of cucumber astringency, RNA-seq-based transcriptome profiling was performed on P1-9d, P2-3d, and P2-9d. Following quality control filtering, high-quality reads were generated, with lengths ranging from 46,315,150 to 47,285,688 bp across the nine libraries. The percentage of Q30 bases exceeded 95%, and the GC was greater than 44%. Of these reads, 98.27%–98.83% were successfully aligned to the cucumber reference genome (Supplementary Table S4). PCA demonstrated high repeatability and stability across the sample groups (Supplementary Fig. S1). Based on the clustered heatmap, the DEGs were grouped into two clusters, indicating distinct gene expression profiles between fruits with different astringency levels (Fig. 2a, b). In the P2-9d vs P2-3d comparison, a total of 5,327 DEGs (2,612 upregulated, 2,715 downregulated) were identified, whereas the P2-9d vs P1-9d comparison revealed 1,113 DEGs (634 upregulated, 479 downregulated) (Fig. 2c). Volcano plots for each comparison group are presented in Supplementary Fig. S2. Furthermore, 740 DEGs were common to both comparisons (Fig. 2d), effectively excluding DEGs associated with different genotypes and developmental stages.
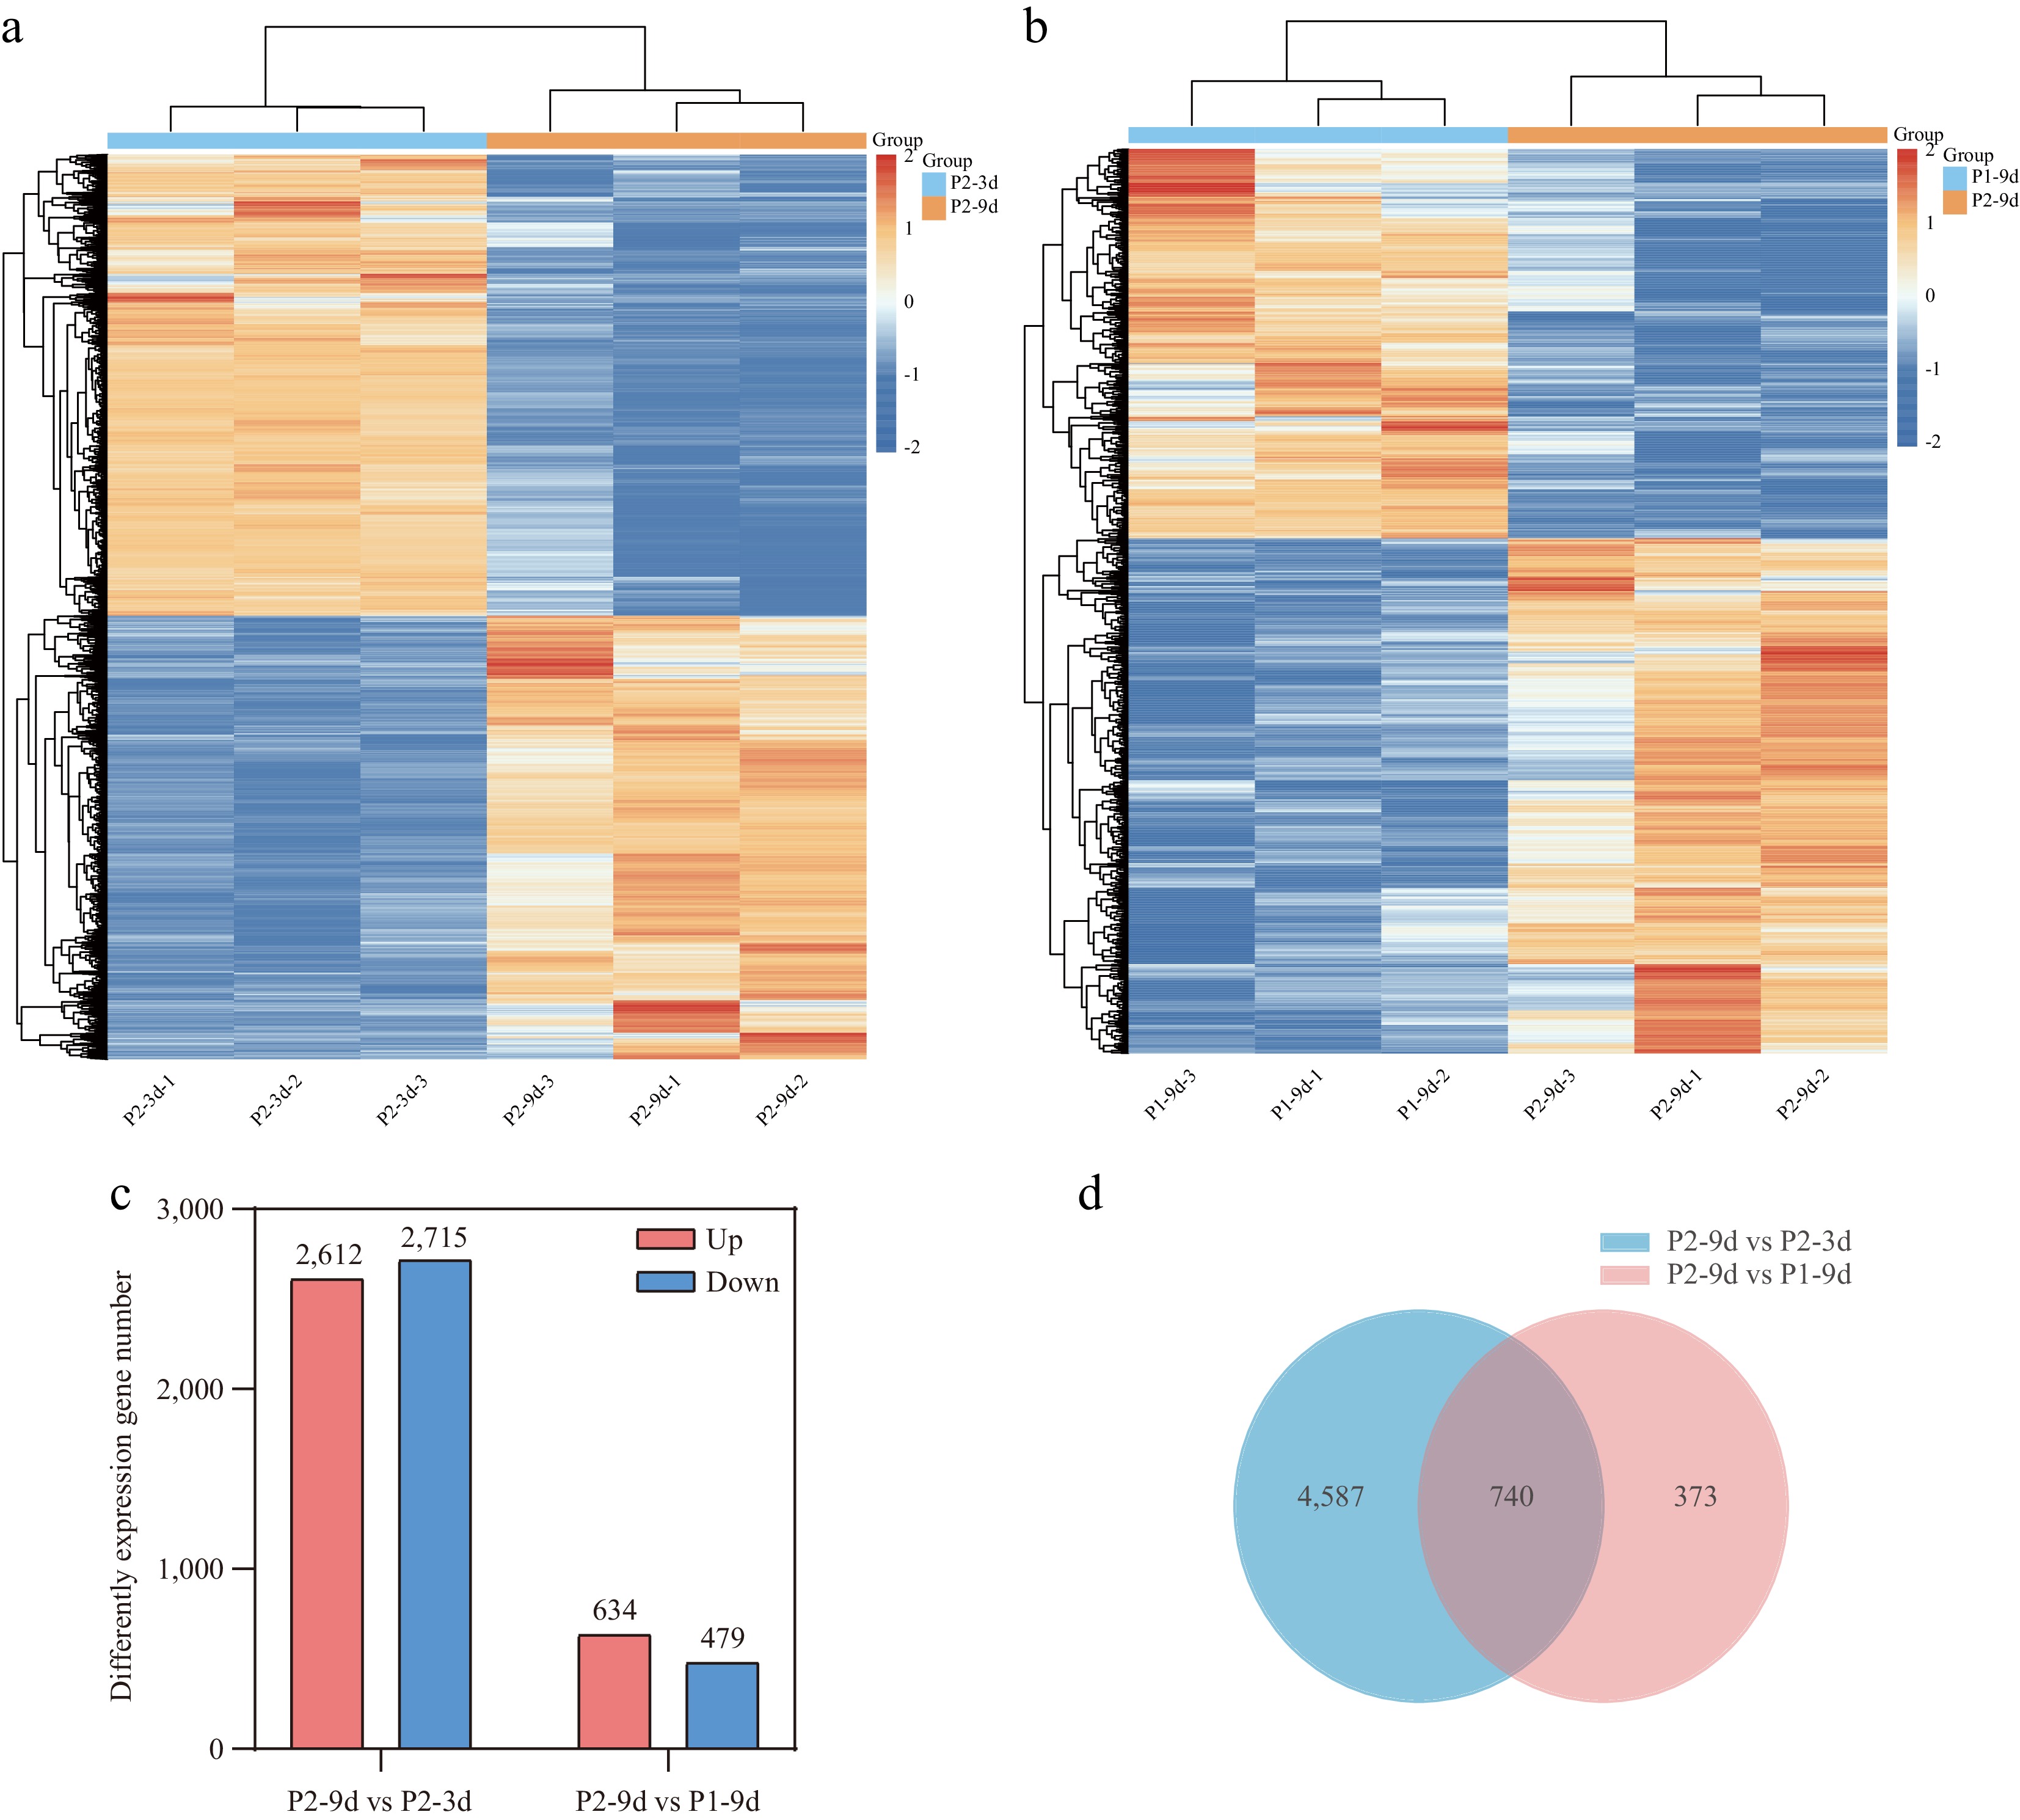
Figure 2.
Transcriptome analysis of cucumber fruits with different astringency levels. (a), (b) Clustered map of DEGs. (c) The number of upregulated and downregulated DEGs in P2-9d vs P2-3d, and P2-9d vs P1-9d comparisons. (d) Venn diagram showing common DEGs in P2-9d vs P2-3d, and P2-9d vs P1-9d comparisons.
GO and KEGG enrichment analyses of DEGs
-
To investigate the biological significance of DEGs, GO enrichment analysis was implemented, which indicated the enrichment of DEGs in both comparisons primarily in molecular functions such as 'sequence-specific DNA binding' and 'DNA-binding TF activity' (Fig. 3a). These results indicate that TFs are critical regulators of cucumber astringency.
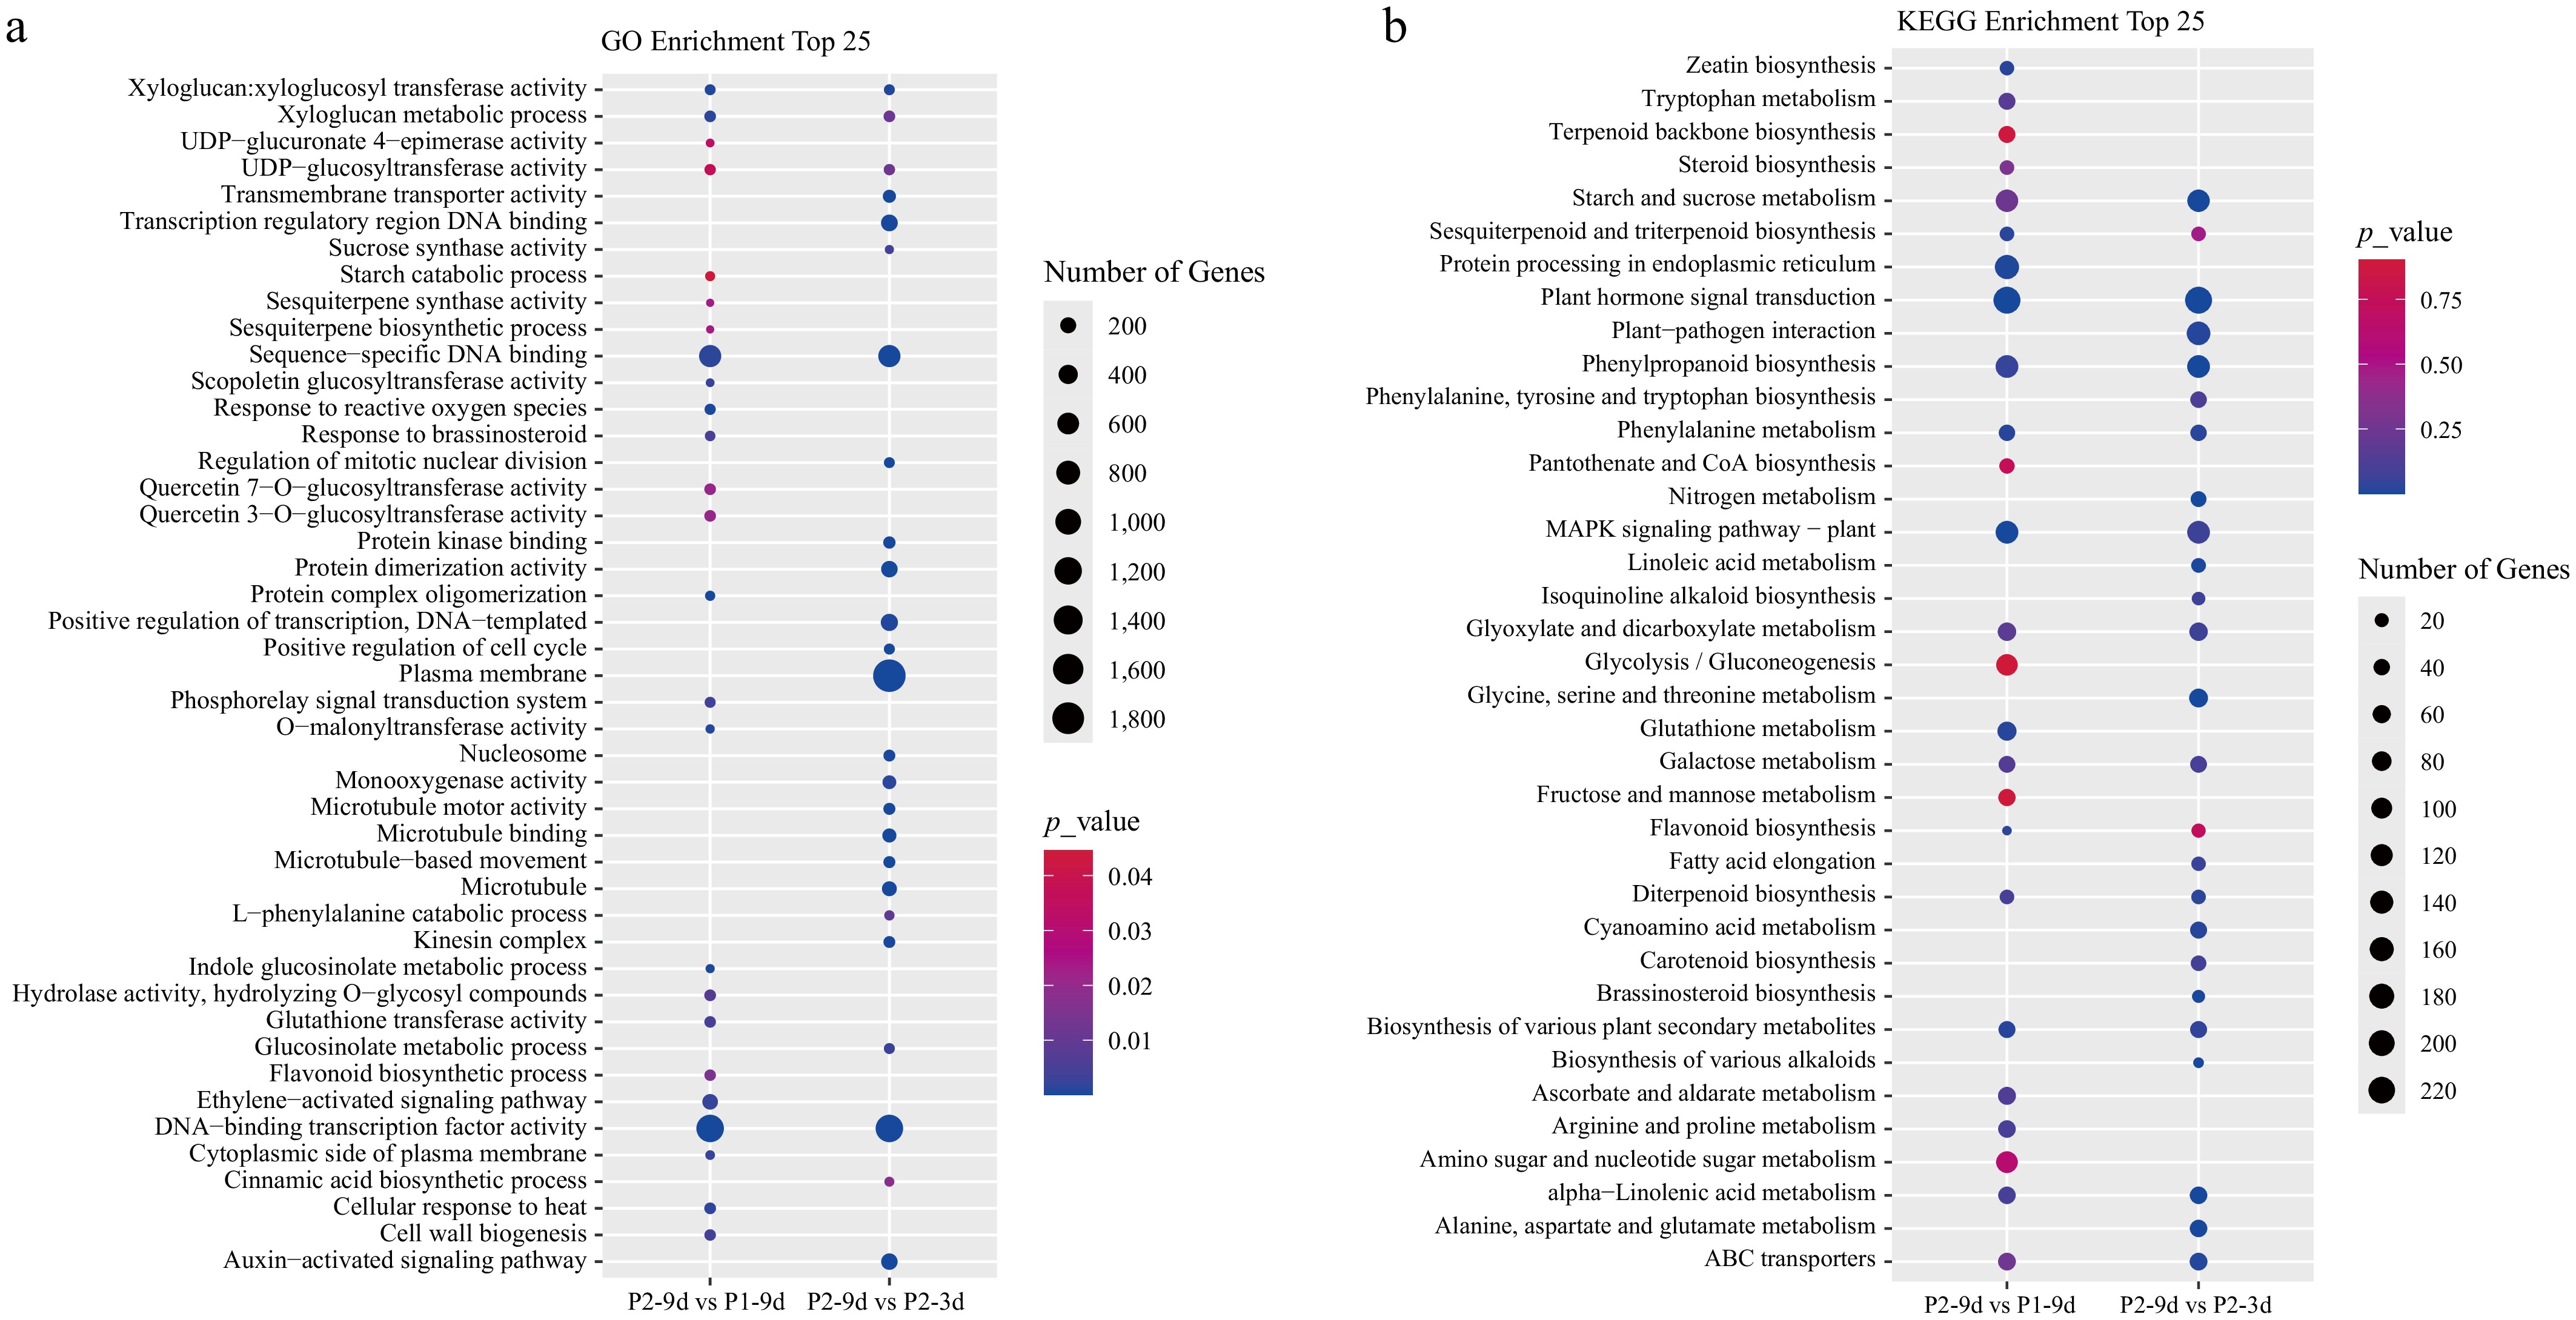
Figure 3.
(a) GO, and (b) KEGG enrichment analyses of DEGs in P2-9d vs P1-9d, and P2-9d vs P2-3d comparisons.
To further investigate the functions of DEGs, KEGG pathway enrichment analysis was conducted. DEGs of the two comparisons exhibited marked enrichment in key pathways such as starch and sucrose metabolism (csv00500), plant hormone signal transduction (csv04075), phenylpropanoid biosynthesis (csv00940), phenylalanine metabolism (csv00360), MAPK signaling pathway-plant (csv04016), glyoxylate and dicarboxylate metabolism (csv00630), galactose metabolism (csv00052), flavonoid biosynthesis (csv00941), diterpenoid biosynthesis (csv00904), and alpha-linolenic acid metabolism (csv00592) (Fig. 3b).
Expression of TF genes
-
TFs, including those of the bHLH and MYB families, are key regulators of astringent substance formation in plants. In this study, 48 TF genes were identified, spanning 24 families (Fig. 4a). Among these, seven and nine TFs belonged to the bHLH and MYB families, respectively. Thirteen TF genes displayed elevated expression levels in P2-9d compared to P2-3d and P1-9d, indicating that they may be positively correlated with astringency. By contrast, two TF genes exhibited lower expression in the P2-9d samples than in the P1-9d and P2-3d samples, suggesting their potential negative regulatory role in astringency (Fig. 4b, c). These expression trends imply that these genes are likely critical regulators of astringent compound biosynthesis in cucumbers.
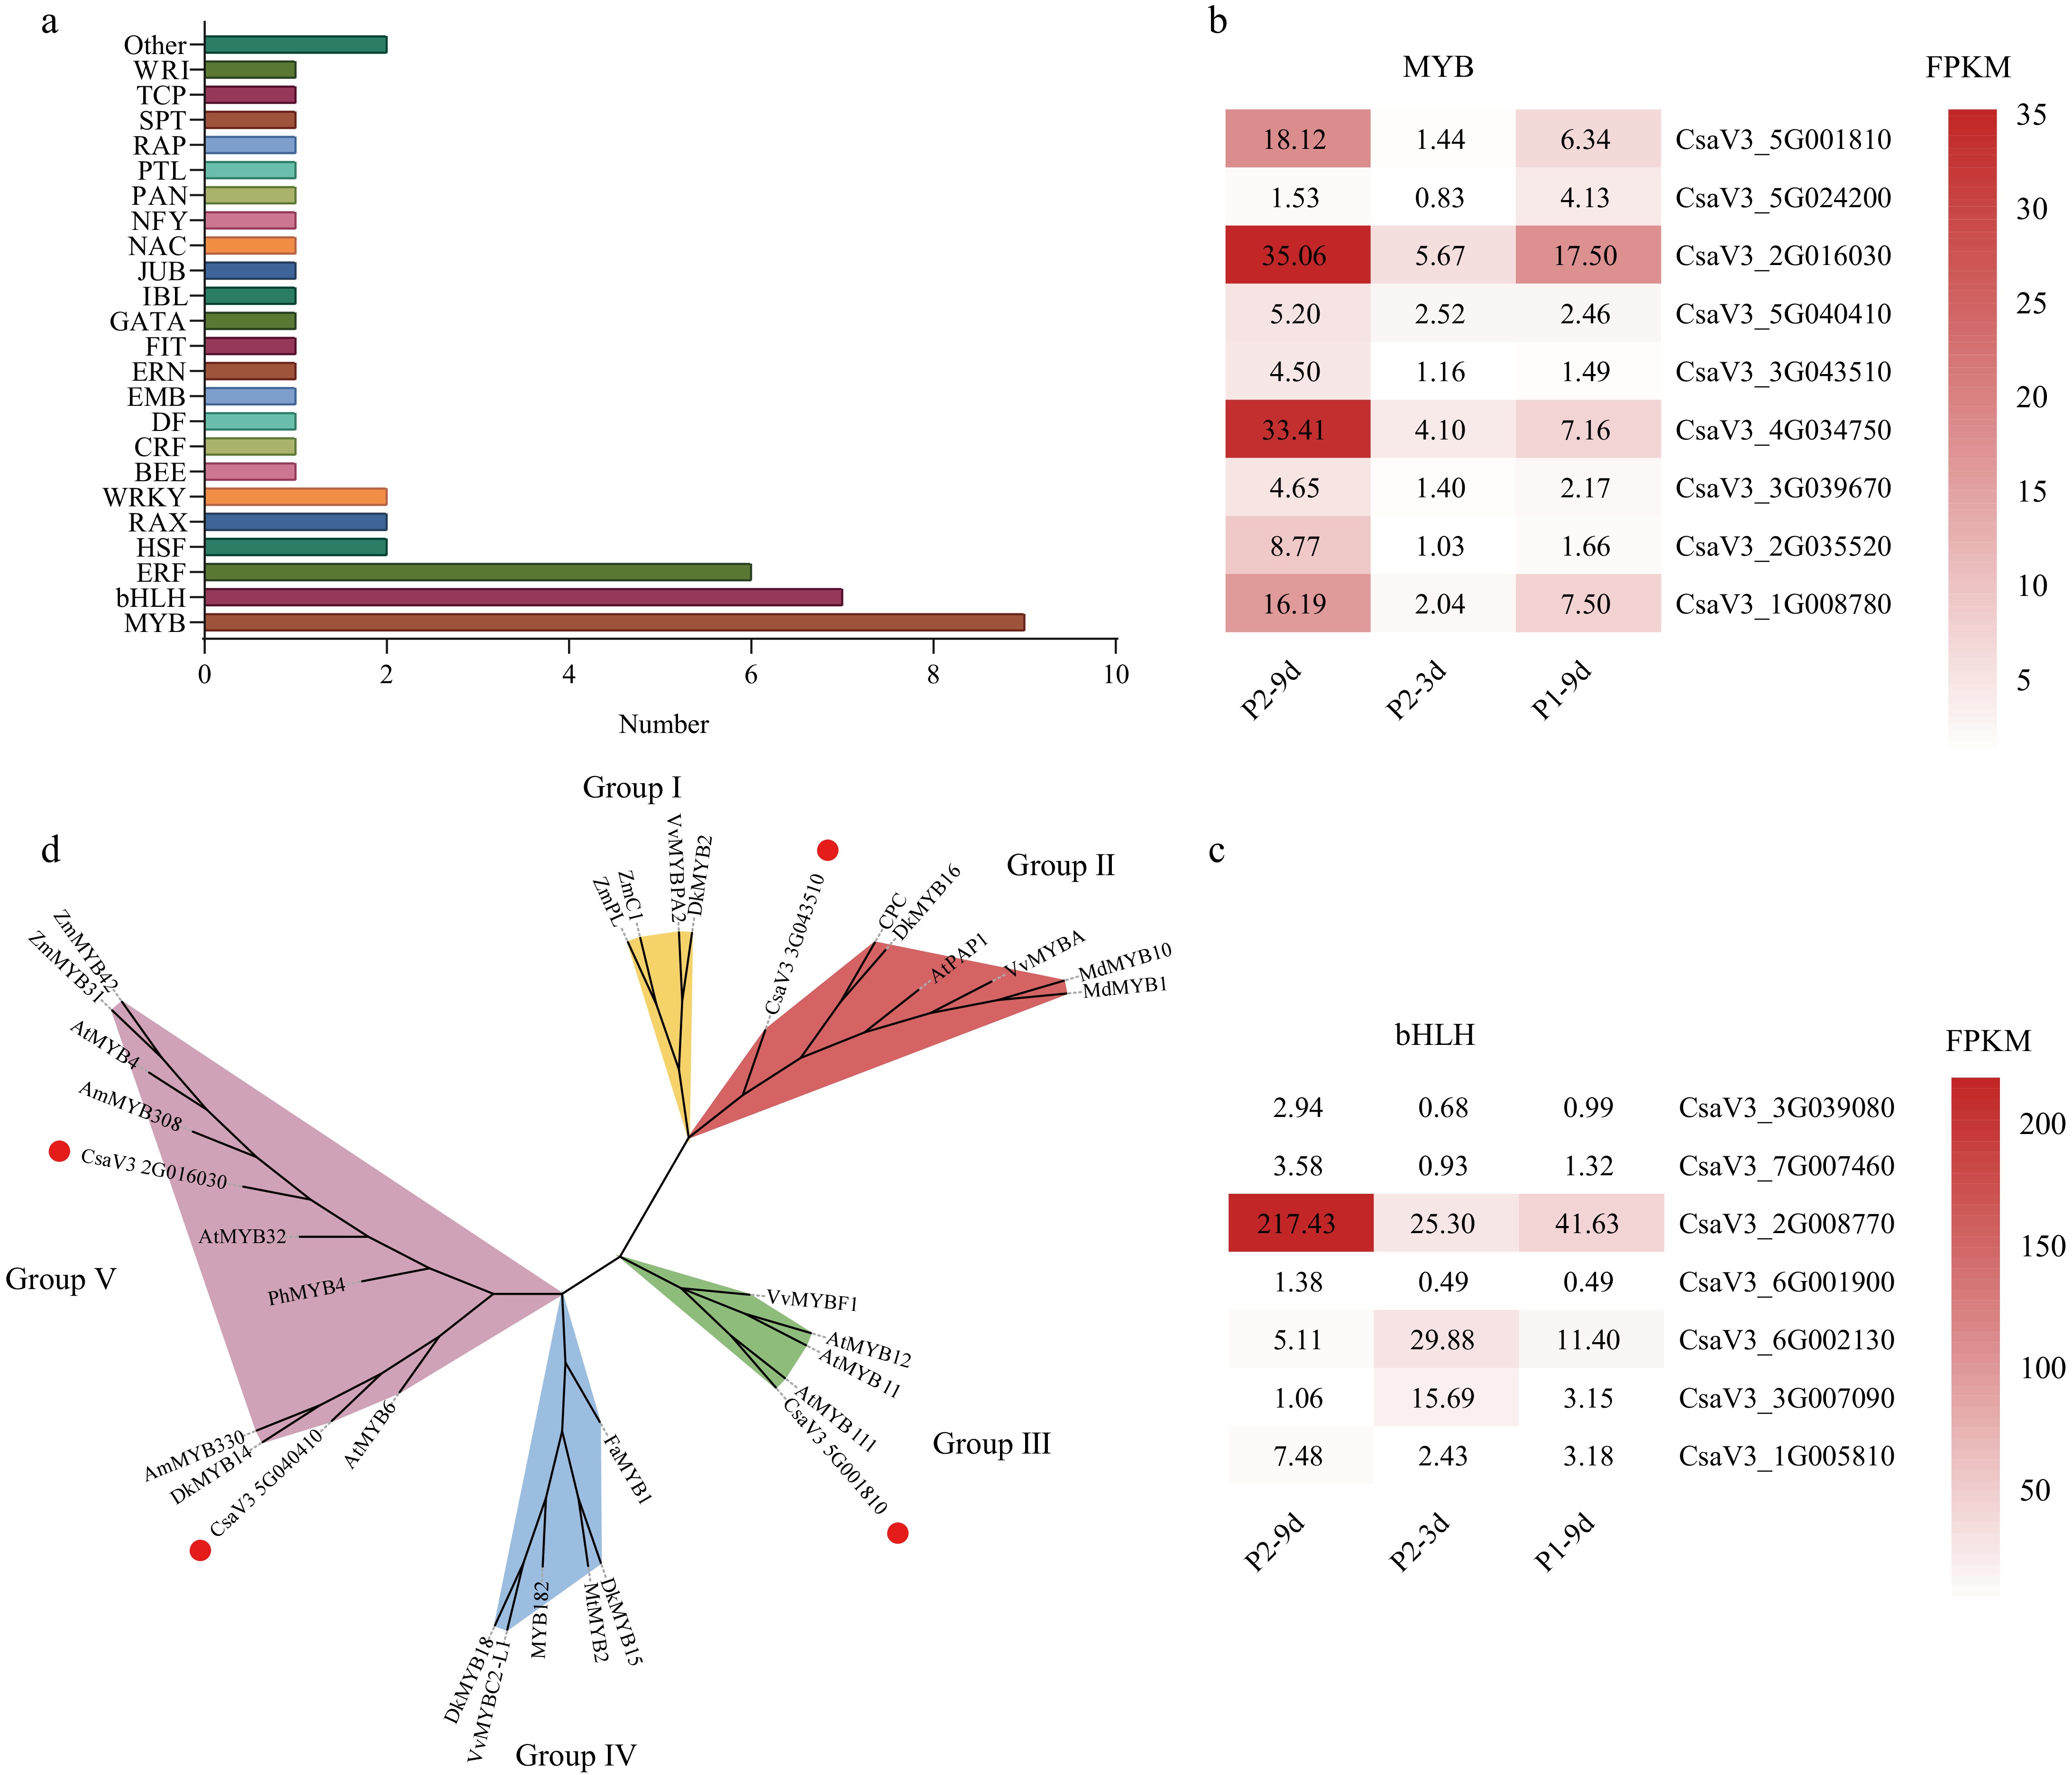
Figure 4.
Differentially expressed transcription factors (TFs) common to both comparisons. (a) Distribution of TF families. Gene expression levels indicated by color bars, showing expression trends of (b) MYB family TFs, and (c) bHLH family TFs. (d) A maximum likelihood phylogenetic tree was inferred for cucumber CsMYBs and orthologous flavonoid biosynthesis regulators from other plant species, incorporating 1,000 bootstrap replicates. Solid red dots represent MYBs isolated in our study; Groups I, II, III, IV, and V indicate proanthocyanidin activators, anthocyanidin, flavonol activators, flavonoid repressors, and phenylpropanoid repressors, respectively. All protein sequence accession numbers from GenBank are tabulated in Supplementary Table S5.
To better understand the functions of MYB TFs, a phylogenetic analysis of CsMYBs was conducted in comparison to the known anthocyanidin, phenylpropanoid repressor, flavonoid repressor/activator, and proanthocyanidin regulator genes[24]. The results revealed that CsMYB32 (CsaV3_2G016030) and CsMYB6 (CsaV3_5G040410) clustered with the phenylpropanoid biosynthesis repressors AtMYB4 and DkMYB14[29,30]. In addition, CsMYB111 (CsaV3_5G001810) grouped with flavonol regulators, whereas CsMYB4 (CsaV3_3G043510) clustered with proanthocyanidin activators (Fig. 4d). CsMYB4 displayed homology to CsMYB1, which has been linked to tea astringency through its regulation of catechin biosynthesis. This phylogenetic analysis offers valuable insights into the putative functions of these MYB factors in polyphenol biosynthesis[31].
Metabolomics analysis
-
To further elucidate molecular mechanisms underlying cucumber astringency, untargeted metabolomics analysis was performed on six replicates each of P1-9d, P2-9d, and P2-3d, totaling 18 samples. PCA revealed distinct metabolite profiles among the sample groups, whereas the diversity within each group was relatively low (Fig. 5a). OPLS-DA confirmed the high reproducibility of the results, allowing for a more detailed analysis of DAMs (Supplementary Fig. S3).
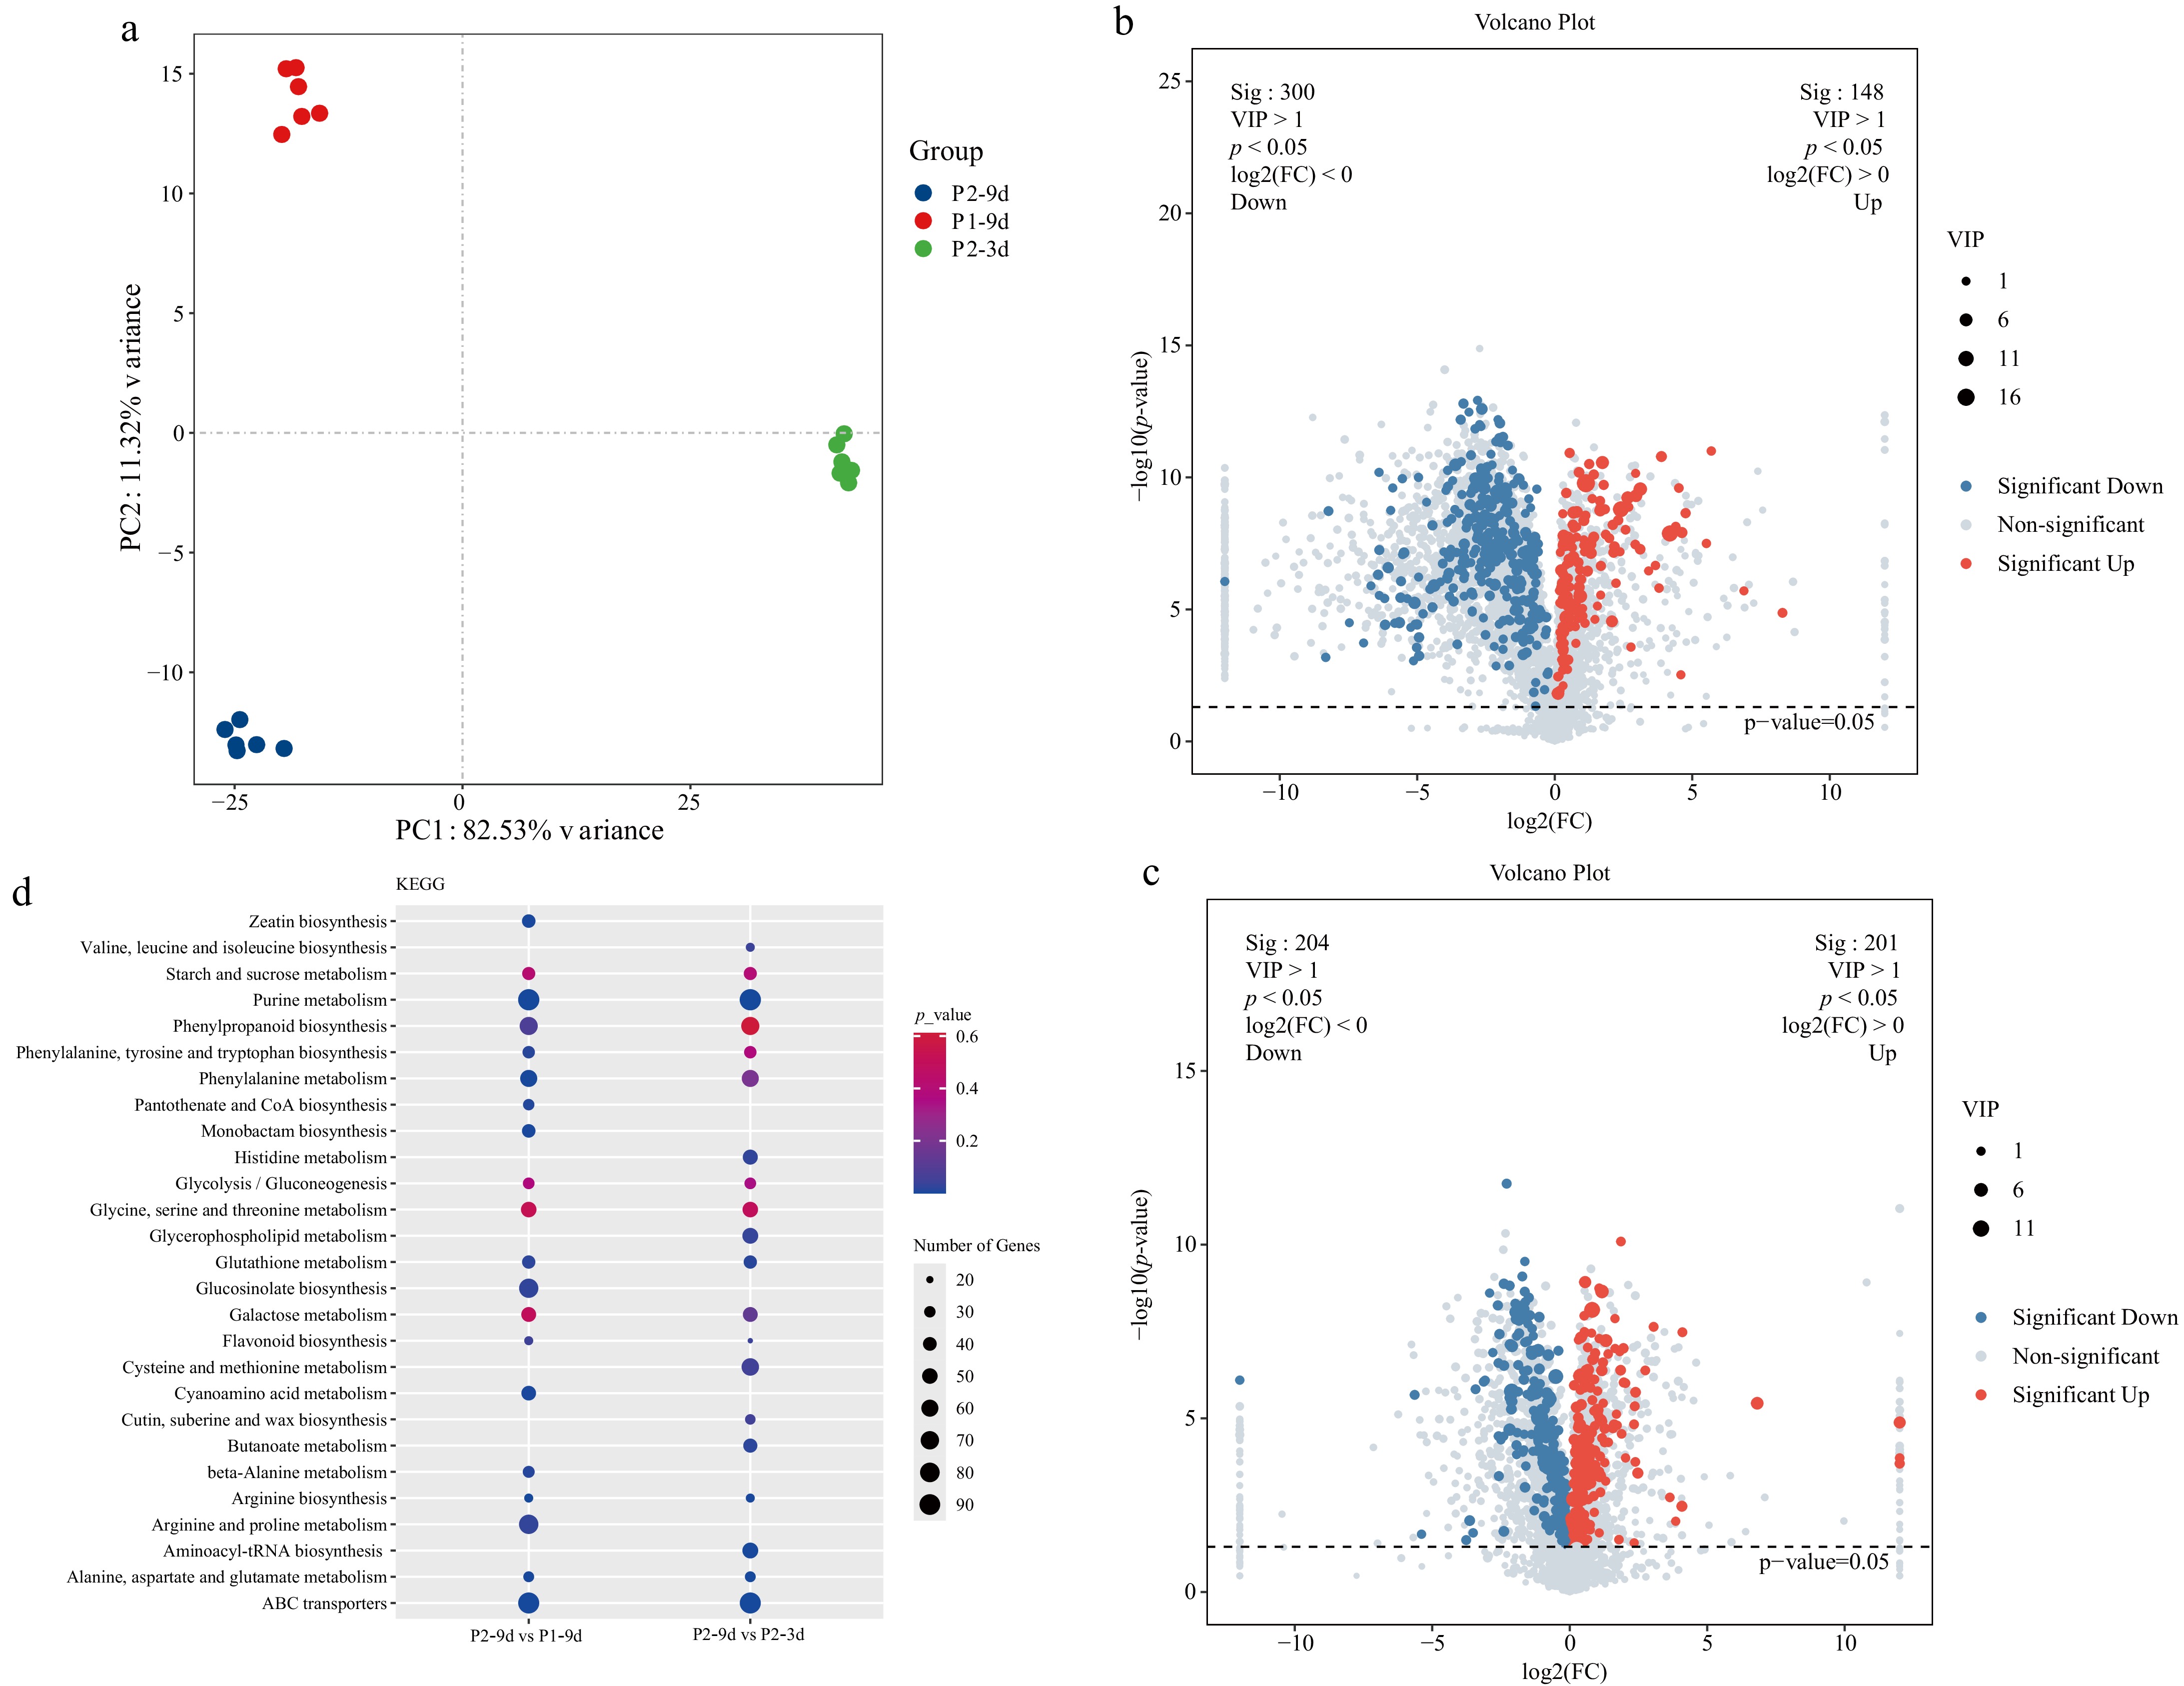
Figure 5.
Metabolomics analysis of different astringency cucumber. (a) PCA score scatter plots of metabolites, with different colors representing different sample groups. (b) Volcano plots of the DAMs for P2-9d vs P1-9d. (c) Volcano plots of the DAMs for P2-9d vs P2-3d. (d) Top 20 KEGG enrichment terms for P2-9d vs P1-9d, and P2-9d vs P2-3d comparisons; dot size in the plot indicates the number of DEGs.
A total of 448 DAMs (148 upregulated, 300 downregulated) were detected in the P2-9d vs P1-9d comparison, and 405 DAMs (201 upregulated, 204 downregulated) were obtained in the P2-9d vs P2-3d comparison (Fig. 5b, c). DAMs common to both comparisons included epicatechin 3-glucoside, 2-hydroxycinnamic acid, M-coumaric acid, L-phenylalanine, and vitexin 6-O-glucoside, all of which are closely associated with flavonoid biosynthesis. In addition, metabolites linked to sugar metabolism, such as trehalulose, inulobiose, glucose-6-glutamate, D-glucose, and 6-O-α-D-glucopyranosyl, were detected.
KEGG pathway enrichment analysis of the DAMs highlighted several significant pathways, including purine metabolism (csv00230), phenylalanine metabolism (csv00360), phenylalanine, tyrosine, and tryptophan biosynthesis (csv00400), phenylpropanoid biosynthesis (csv00940), glycolysis/gluconeogenesis (csv00010), flavonoid biosynthesis (csv00941), starch and sucrose metabolism (csv00500), and glycine, serine, and threonine metabolism (csv00260) (Fig. 5d).
Combined transcriptomic and metabolomic analysis
-
To elucidate the regulatory network underlying cucumber astringency, an integrated transcriptomic and metabolomic analysis was conducted. KEGG analysis for P2-9d vs P1-9d, and P2-9d vs P2-3d comparisons revealed that DEGs and DAMs showed enrichment in 39 and 55 pathways, respectively (Fig. 6a, b). A total of 24 pathways were common to the two comparisons, including starch and sucrose metabolism, phenylalanine metabolism, flavonoid biosynthesis, ABC transporters, tryptophan metabolism, zeatin biosynthesis, glutathione metabolism, and arginine biosynthesis (Fig. 6c, d).
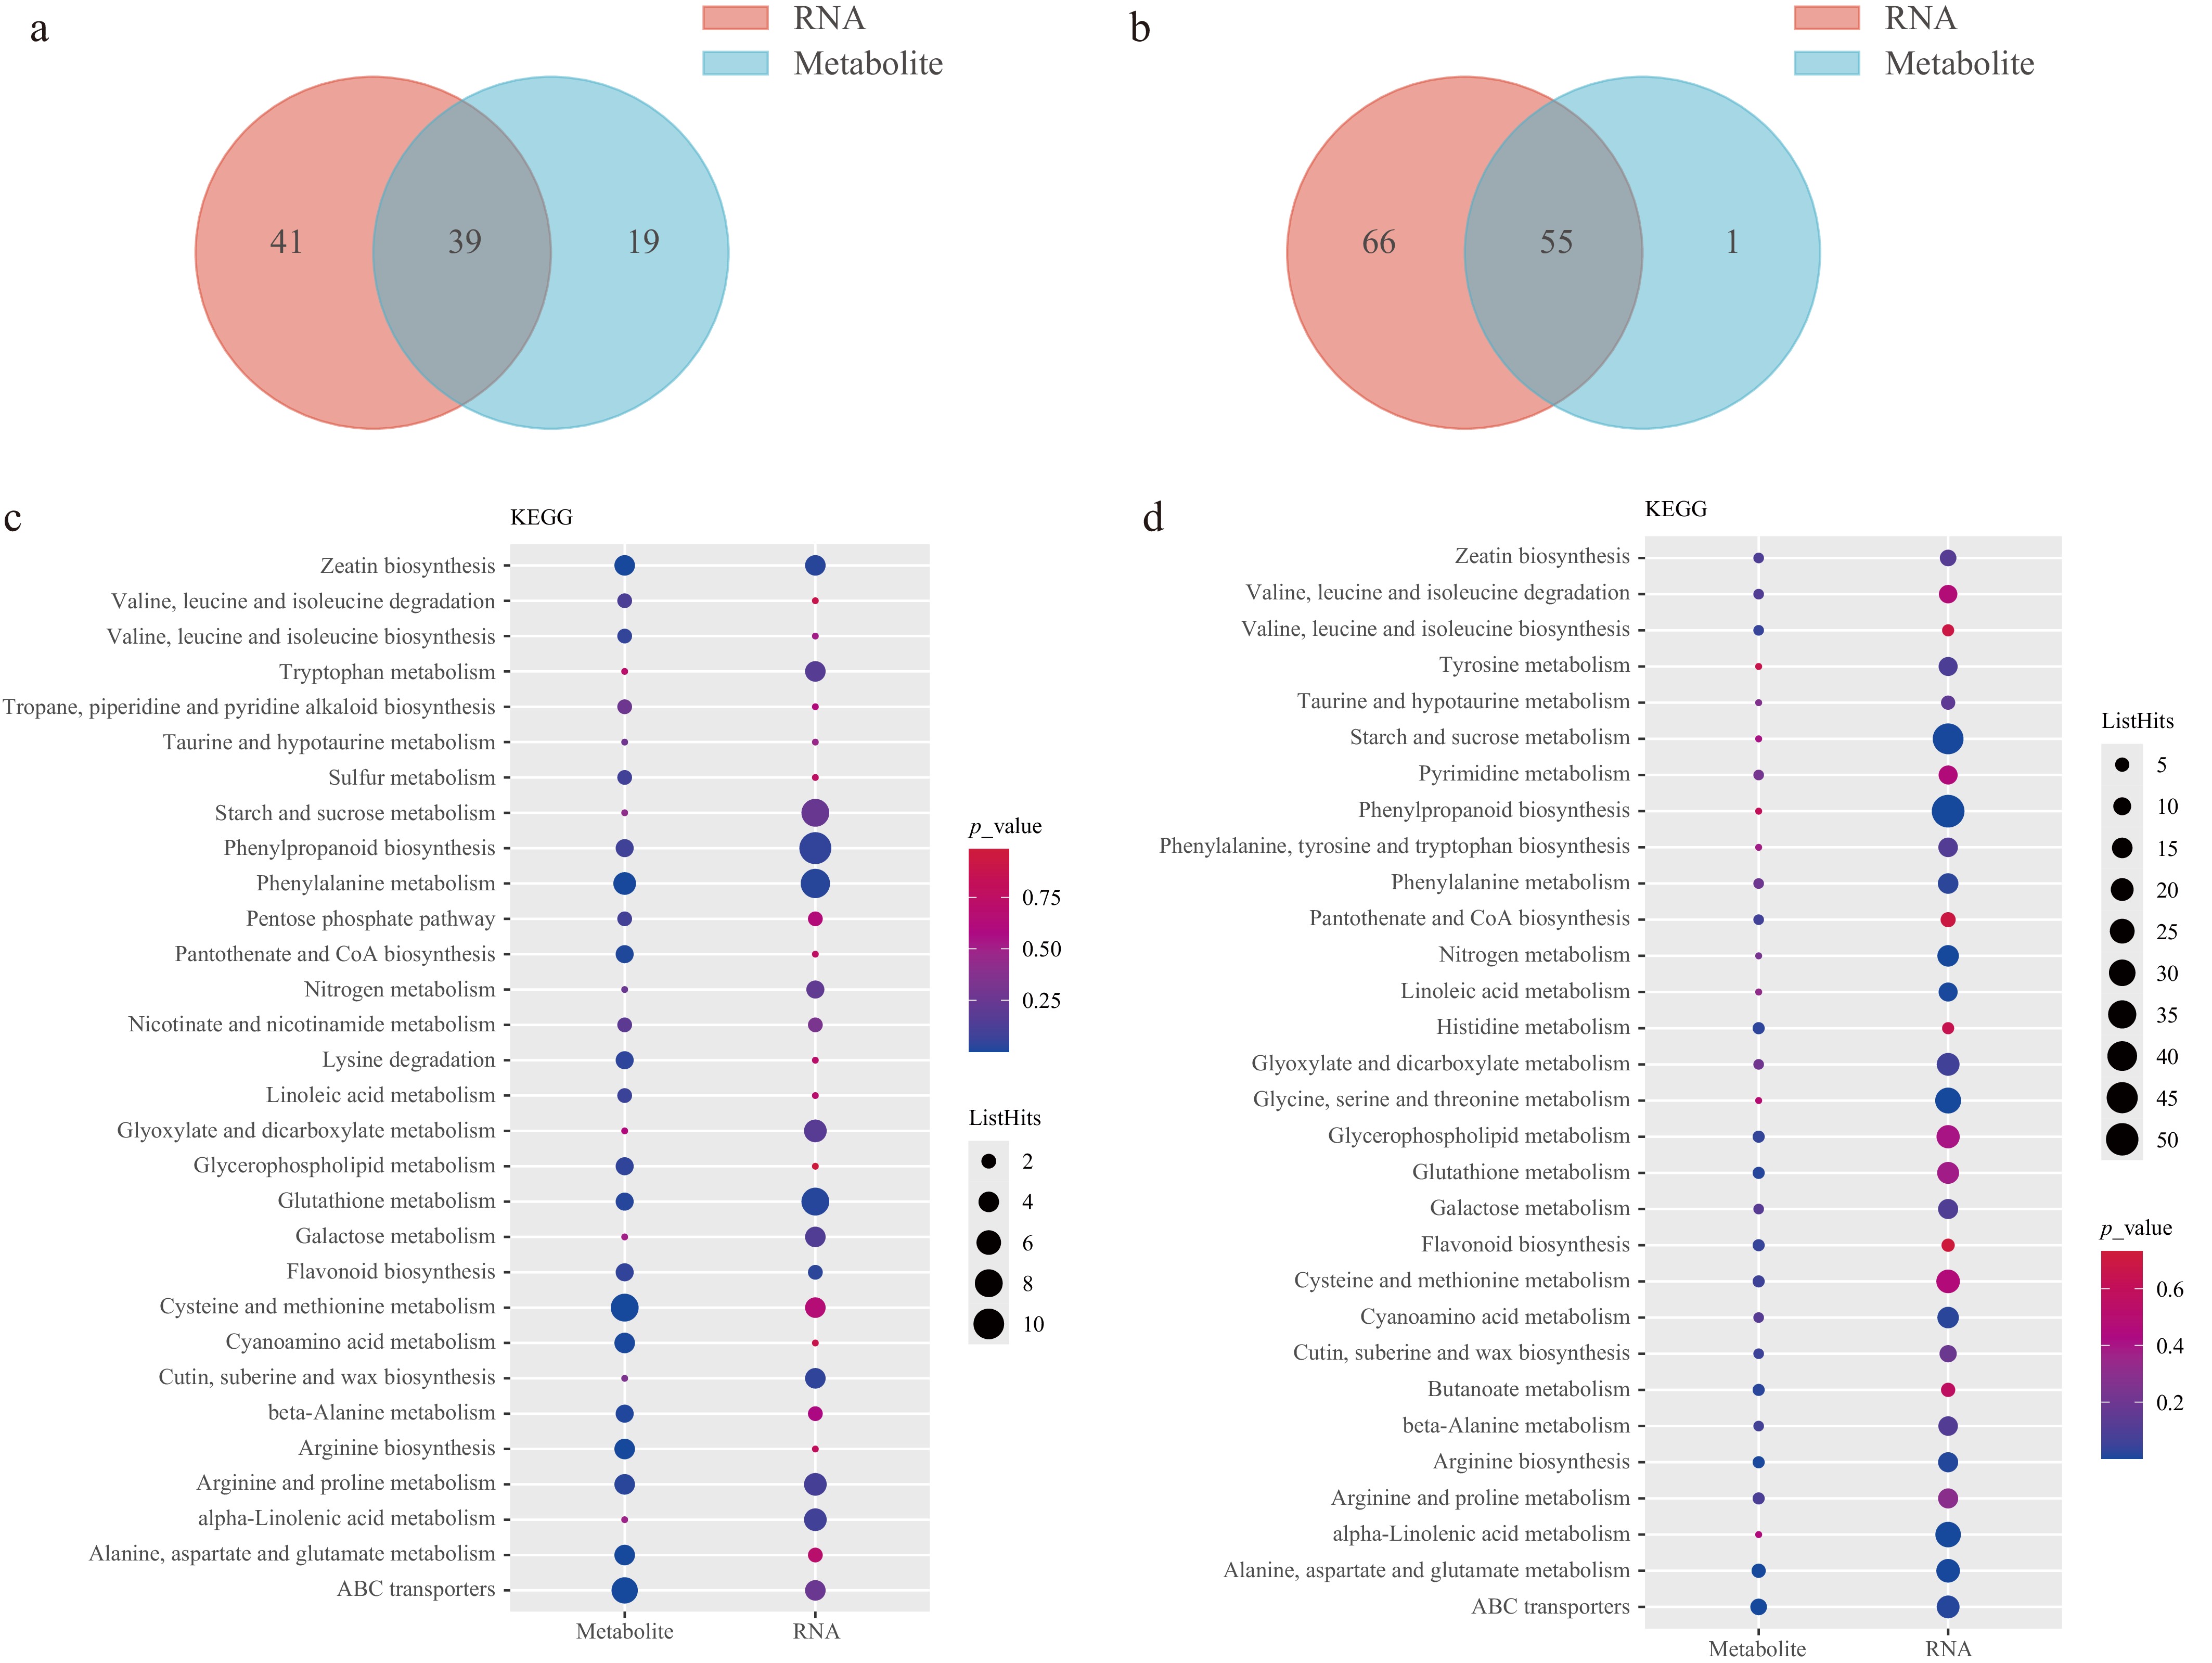
Figure 6.
Integrated analysis of transcriptome and metabolome data. (a), (b) Venn diagram of the mapping pathways of genes and metabolites for P2-9d vs P1-9d, and P2-9d vs P2-3d, respectively. (c), (d) Top 30 KEGG enrichment terms of DEGs and DAMs for P2-9d vs P1-9d, and P2-9d vs P2-3d comparisons, respectively.
Joint transcriptome and metabolome profiling of the flavonoid biosynthesis pathway
-
The transcriptomic and metabolomic analysis suggested that flavonoids are closely associated with cucumber astringency. Functional annotation revealed DEGs and DAMs enriched in flavonoid and phenylpropanoid biosynthesis pathways. Specifically, 21 DEGs, including six PAL, four 4CL, one CHS, one flavonol synthase (FLS), one F3H, one DFR, three malonyl-CoA, one ANR, and three UFGT genes, were enriched in the two pathways.
A comparative analysis demonstrated that most PAL genes exhibited reduced expression in P2-9d compared with both P2-3d and P1-9d. Among the four 4CL genes, two were downregulated, and two were upregulated. Similarly, one FLS gene was downregulated. By contrast, two malonyl-CoA genes were upregulated. Among UFGT genes, two showed upregulated expression, while one demonstrated downregulation (Fig. 7). The dynamic change of genes within the flavonoid biosynthesis pathway suggests their potential positive or negative correlation with cucumber astringency.
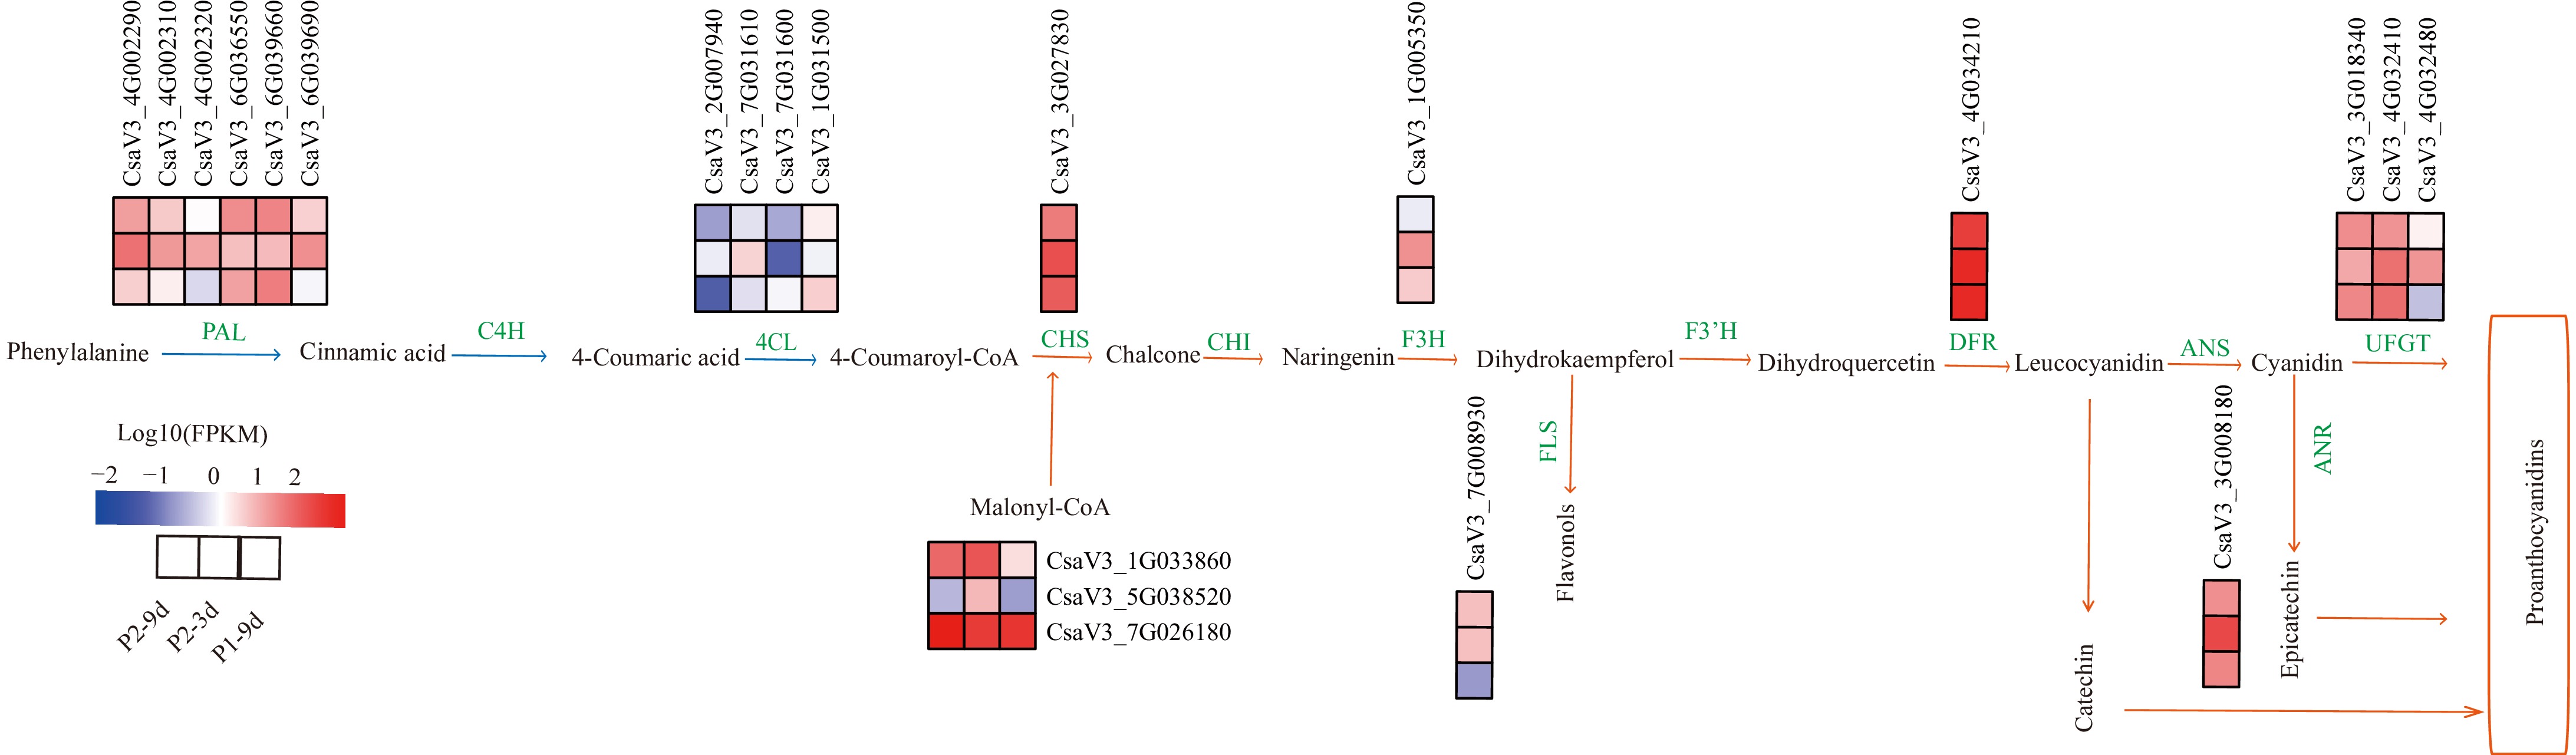
Figure 7.
DEGs involved in flavonoid biosynthetic pathways. The phenylpropanoid metabolic pathway is indicated by blue arrows, the flavonoid metabolic pathway by orange arrows, and green words indicate enzymes in the metabolic process. The red block represents upregulation, and the blue represents downregulation of gene expression. Enzyme annotation: PAL (Phenylalanine ammonia-lyase), C4H (Cinnamate4-hydroxylase), 4CL (4-coumarate CoA ligase), CHS (Chalcone synthase), CHI (Chalcone isomerase), F3H (Flavonoid 3-hydroxylase), FLS (Flavonol synthase), F3'H (Flavonoid 3'-hydroxylase), DFR (Dihydroflavonol 4- reductase), LAR (Leucocyanidin reductase), ANR (Anthocyanidin reductase), ANS (Anthocyanidin synthase), UFGT (UDP-flavonoid 3-O-glucosyltransferase).
Identification of candidate genes
-
Verifying whether the 21 candidate genes and TFs participated in the formation of astringent substances in cucumbers, their expression levels were quantified across different astringency resources (Fig. 1a). Notably, CsPAL (CsaV3_4G002290, CsaV3_4G002320) and Cs4CL (CsaV3_2G007940, CsaV3_1G031500) exhibited higher expression in fruits with slight astringency than in those with strong astringency, indicating their potential negative regulatory role in cucumber fruit astringency. Conversely, CsUFGT (CsaV3_3G018340, CsaV3_4G032410), CsMYB6 (CsaV3_5G040410), CsMYB111 (CsaV3_5G001810), CsbHLH35 (CsaV3_2G008770), and CsbHLH51 (CsaV3_6G001900) exhibited relatively high expressions in fruits with strong astringency, suggesting their positive regulatory role in cucumber fruit astringency (Fig. 8; Supplementary Fig. S4).
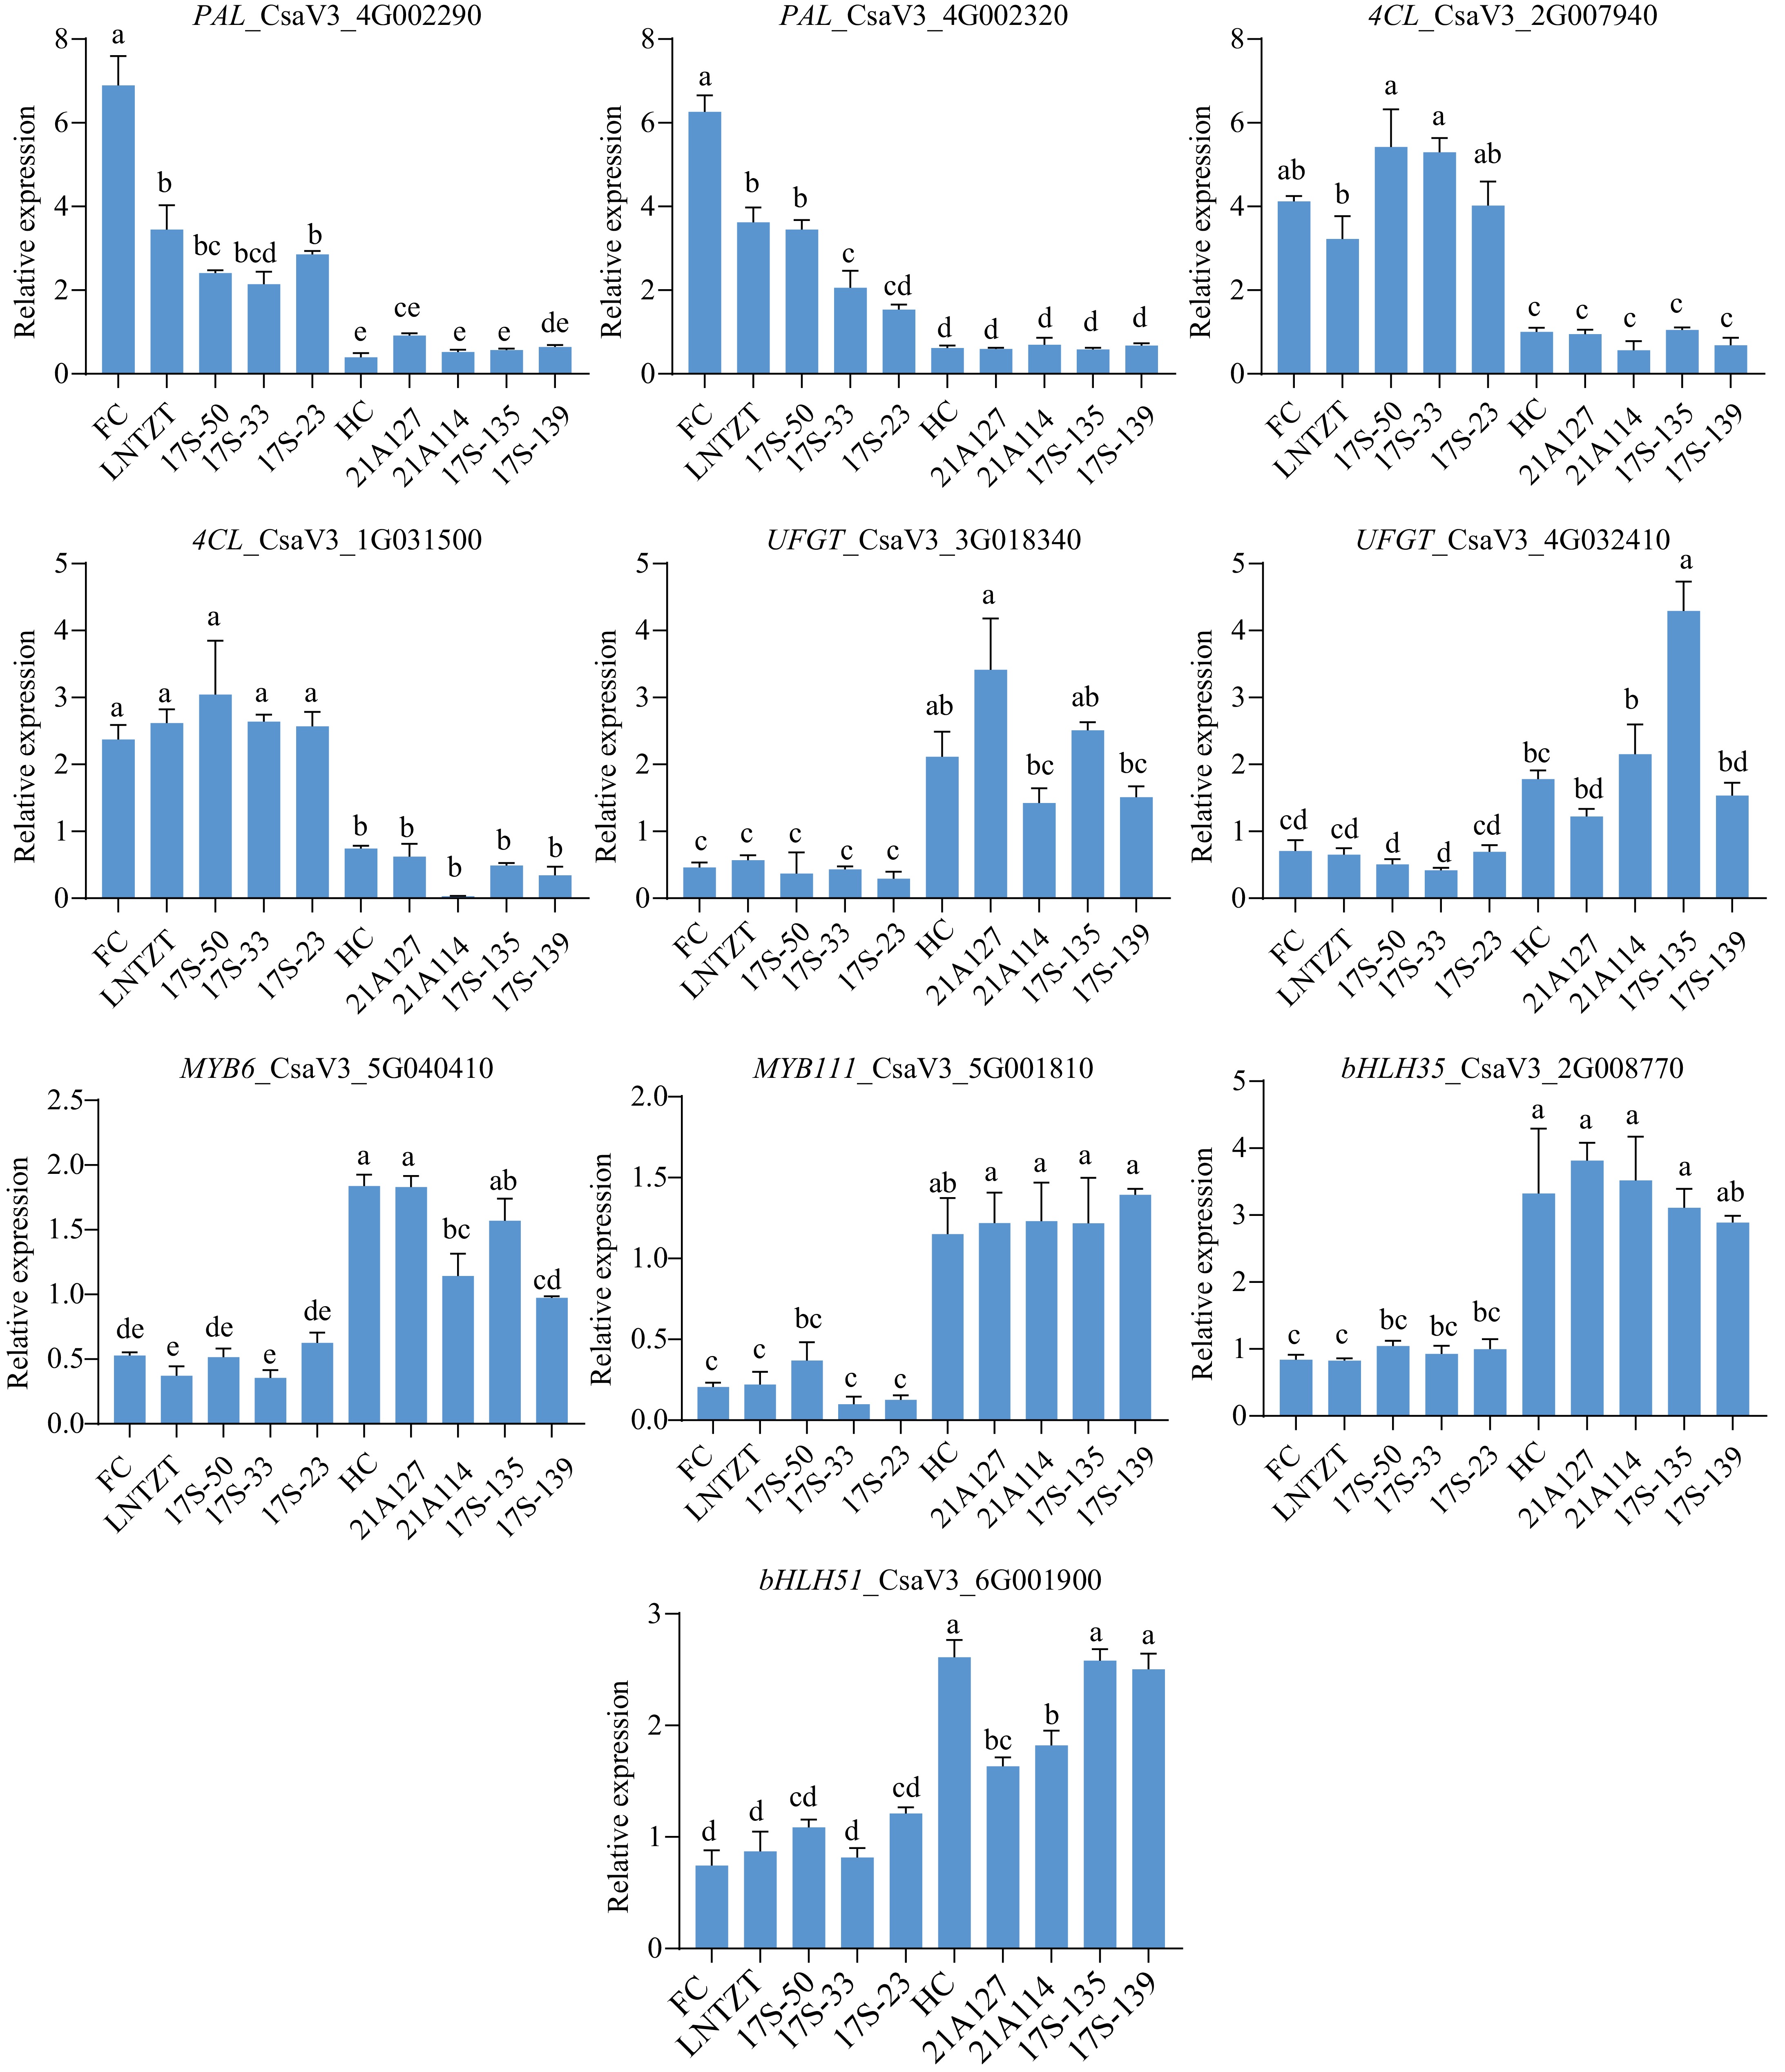
Figure 8.
qRT-PCR analysis of the ten candidate genes. Cucumber UBIQUITIN was selected as the housekeeping gene for expression normalization. Data are presented as the mean ± SD of three biological replicates, and statistical significance was calculated by one-way ANOVA followed by Tukey's test (p ≤ 0.05).
-
Astringency is a key sensory attribute of horticultural plants and a significant factor affecting the taste of vegetables and fruits. This study pioneers the elucidation of molecular mechanisms driving astringency formation in cucumber fruits through an integrated transcriptomic and metabolomic analysis. These findings highlight the critical role of polyphenols, especially flavonoids, in mediating cucumber astringency development.
The phenylpropanoid biosynthesis pathway is a critical route for polyphenol synthesis, involving key enzymes such as PAL, C4H, and 4CL. Among these, PAL and 4CL are considered pivotal in this pathway[32]. Scharbert et al. identified catechins and flavonoid glycosides as primary contributors to the astringency of black tea[33]. During the maturation process of tea leaves, the abundance of catechins exhibits a significant positive correlation with the expression of PAL[34]; however, a negative relationship has also been reported. For instance, PAL expression negatively correlates with catechin content in albino tea plants (AnJiBaiCha)[35]. Here, it was found that the CsPALs (CsaV3_4G002290, CsaV3_4G002320) exhibited higher expressions in slightly astringent cucumber fruit than in strongly astringent ones, mirroring findings in AnJiBaiCha (Fig. 8). In A. thaliana, four PAL members (AtPAL1-4) are encoded in the genome, with AtPAL1 and AtPAL2 involved in flavonoid synthesis and AtPAL3 and AtPAL4 in lignin synthesis[36,37]. Similarly, in this study, six CsPAL genes were identified, of which only two correlated with cucumber astringency, suggesting that the other four genes may function in lignin synthesis. Future research is necessary to elucidate the regulatory functions of PAL family genes in polyphenol biosynthesis pathways. 4CL enzymes are critical for synthesizing hydroxycinnamate-CoA thioesters, the direct precursors required for flavonoid biosynthesis. The cucumber genome contains six 4CL genes (Cs4CL1-6)[38]. Although the functions of 4CL was functionally validated in diverse plants, such as A. thaliana[39], rice[40], and liverwort[41], their roles in cucumber remain largely unexplored. The integrated transcriptomic and metabolomic analysis identified four 4CL genes, with CsaV3_2G007940 and CsaV3_1G031500 exhibiting a negative correlation with cucumber astringency.
The flavonoid biosynthesis pathway is a major route for polyphenol synthesis, culminating in the production of proanthocyanidins (condensed tannins). UFGT is pivotal in mediating flavonoid glycosylation to produce stable proanthocyanidins, which is the primary contributor to astringency in persimmons[13,30]. In this study, two UFGT (CsaV3_3G018340 and CsaV3_4G032410) were detected with upregulated expression in strongly astringent cucumber fruits. This suggests that the proanthocyanidin content is relatively high in these fruits, supporting the hypothesis that proanthocyanidins are key compounds responsible for cucumber astringency.
TFs are crucial for polyphenol synthesis. Specifically, flavonoid biosynthesis is regulated by the MYB-bHLH-WD40 transcription complex, a mechanism previously reported in A. thaliana[7], strawberries[42], and tea[31]. In this study, nine MYB and seven bHLH TFs were identified (Fig. 4). Further analysis revealed that two MYBs (CsaV3_5G040410 and CsaV3_5G001810) and two bHLHs (CsaV3_2G008770 and CsaV3_6G001900) exhibited higher expression levels in strongly astringent cucumber fruits, indicating their positive correlation with cucumber astringency (Fig. 8). These findings align with the role of CsMYB60 in promoting flavonoid biosynthesis[43].
KEGG analysis demonstrated that the DEGs and DAMs were functionally linked to the sugar metabolism pathway, implying its role in cucumber astringency. However, the relationship between sugar metabolism and astringency must be investigated in detail.
Xu et al. suggested that cucumber astringency is primarily attributed to catechin levels, which show a decreasing trend as fruit development progresses[38]. However, the present study challenges the findings of Xu et al., as HC fruits at 9 dpp exhibited higher astringency than those at 3 dpp. This discrepancy may be attributed to differences in cucumber ecotypes. Future studies on cucumber astringency may consider the ecotype of cucumber and additional sampling points to verify the findings of this study.
-
Here, the transcriptome and metabolome data of P1-9d, P2-3d, and P2-9d were analyzed. Combined transcriptomic and metabolomic analysis revealed the molecular mechanisms underlying cucumber fruit astringency as well as the candidate genes and metabolic pathways. CsPAL (CsaV3_4G002290, CsaV3_4G002320), Cs4CL (CsaV3_2G007940, CsaV3_1G031500), CsUFGT (CsaV3_3G018340, CsaV3_4G032410), CsMYB (CsaV3_5G040410, CsaV3_5G001810), and CsbHLH (CsaV3_2G008770, CsaV3_6G001900) were identified as the key genes related to astringency of cucumber fruits. These findings provide a theoretical foundation for improving cucumber astringency and serve as a reference for studying secondary metabolites in other plants. Future work could experimentally validate gene functions of the candidate genes, dissect regulatory pathways, and leverage multi-omics technologies to improve the understanding of plant secondary metabolites.
This work was supported by a grant from the Scientific Research Fund of Hebei Normal University of Science and Technology (Grant No. 2024YB008) the Key R&D Program of Hebei Province (Grant No. 21326309D).
-
The authors confirm their contributions as follows: study design and manuscript revision: Yan L, Zhang J; conducting experiment, data analysis, and manuscript preparation: Zhang J, Wang K; experiments supporting: Song X, Xie Y, Li X, Meng S, Hang Q, Jia J, Wang C. All authors reviewed the results and approved the final version of the manuscript.
-
All data generated or analyzed during this study are included in this published article and its supplementary information files.
-
The authors declare that they have no conflict of interest.
-
# Authors contributed equally: Jiaojiao Zhang, Kunyang Wang
- Supplementary Table S1 The primers used in qRT-PCR.
- Supplementary Table S2 Evaluation of astringency of cucumber inbred lines fruit.
- Supplementary Table S3 Evaluation of astringency of cucumber fruit of 'FC' and 'HC'.
- Supplementary Table S4 Throughput and quality of RNA-seq of samples.
- Supplementary Table S5 Amino acid sequence for evolutionary tree.
- Supplementary Fig. S1 (a) Each point in PCA score plot representing an independent biological replicate. (b) Heat map of cluster analysis of all samples.
- Supplementary Fig. S2 (a) Volcano plots of the DEGs for P2-9d versus P1-9d. (b) Volcano plots of the DEGs for P2-9d versus P2-3d.
- Supplementary Fig. S3 OPLS-DA scatter diagram for P2-9d versus P1-9d (a) and P2-9d versus P2-3d (b). R2X and R2Y represent the explanatory rate of the model to x and y matrices, respectively.
- Supplementary Fig. S4 The relative expression level in different ten astringency resources of 17 genes obtained by quantitative real-time PCR (qRT-PCR) analysis. The cucumber UBIQUITIN gene was used for the reference transcript. Error bars represent SE for three independent experiments and significant differences at p value ≤ 0.05 using one-way analysis of variance.
- Copyright: © 2025 by the author(s). Published by Maximum Academic Press, Fayetteville, GA. This article is an open access article distributed under Creative Commons Attribution License (CC BY 4.0), visit https://creativecommons.org/licenses/by/4.0/.
-
About this article
Cite this article
Zhang J, Wang K, Song X, Xie Y, Li X, et al. 2025. Integrated transcriptome and metabolome analysis revealed key genes related to astringency in cucumber fruits. Vegetable Research 5: e029 doi: 10.48130/vegres-0025-0022 

Integrated transcriptome and metabolome analysis revealed key genes related to astringency in cucumber fruits
- Received: 06 February 2025
- Revised: 25 March 2025
- Accepted: 09 April 2025
- Published online: 20 August 2025
Abstract: Cucumber taste profiles are significantly shaped by astringency, which manifests as a drying and rough sensation in the oral cavity. Nevertheless, the molecular mechanisms underlying cucumber astringency remain largely unexplored. The present study addresses this gap by using an integrated approach encompassing transcriptome and metabolome sequencing. FC (P1) and HC (P2) inbred lines of cucumber were used as experimental materials. P1 fruits at 9 d post-pollination (dpp; P1-9d) and P2 fruits at 3 dpp (P2-3d) exhibited slight astringency, whereas P2 fruits at 9 dpp (P2-9d) showed strong astringency. In the P2-9d vs P2-3d, and P2-9d vs P1-9d comparisons, 5,327 and 1,113 differentially expressed genes (DEGs) were detected, respectively. Among these, 48 differentially expressed transcription factors (TFs) were identified. Phylogenetic analysis, with a focus on the MYB family of TFs, highlighted four candidate TFs potentially involved in flavonoid biosynthesis. Kyoto Encyclopedia of Genes and Genomes (KEGG) analysis highlighted enrichment of phenylpropanoid biosynthesis, phenylalanine metabolism, and flavonoid biosynthesis. Integrated transcriptome and metabolome analysis identified 24 common pathways between P2-9d vs P2-3d, and P2-9d vs P1-9d comparisons, including three flavonoid-related pathways comprising 21 DEGs. Quantitative RT-PCR experiments validated ten candidate genes, shedding light on their putative functions in modulating cucumber astringency. This research advances the understanding of astringency development in cucumbers.
-
Key words:
- Cucumis sativus L. /
- Astringent /
- Transcriptome /
- Metabolome /
- Flavonoids