-
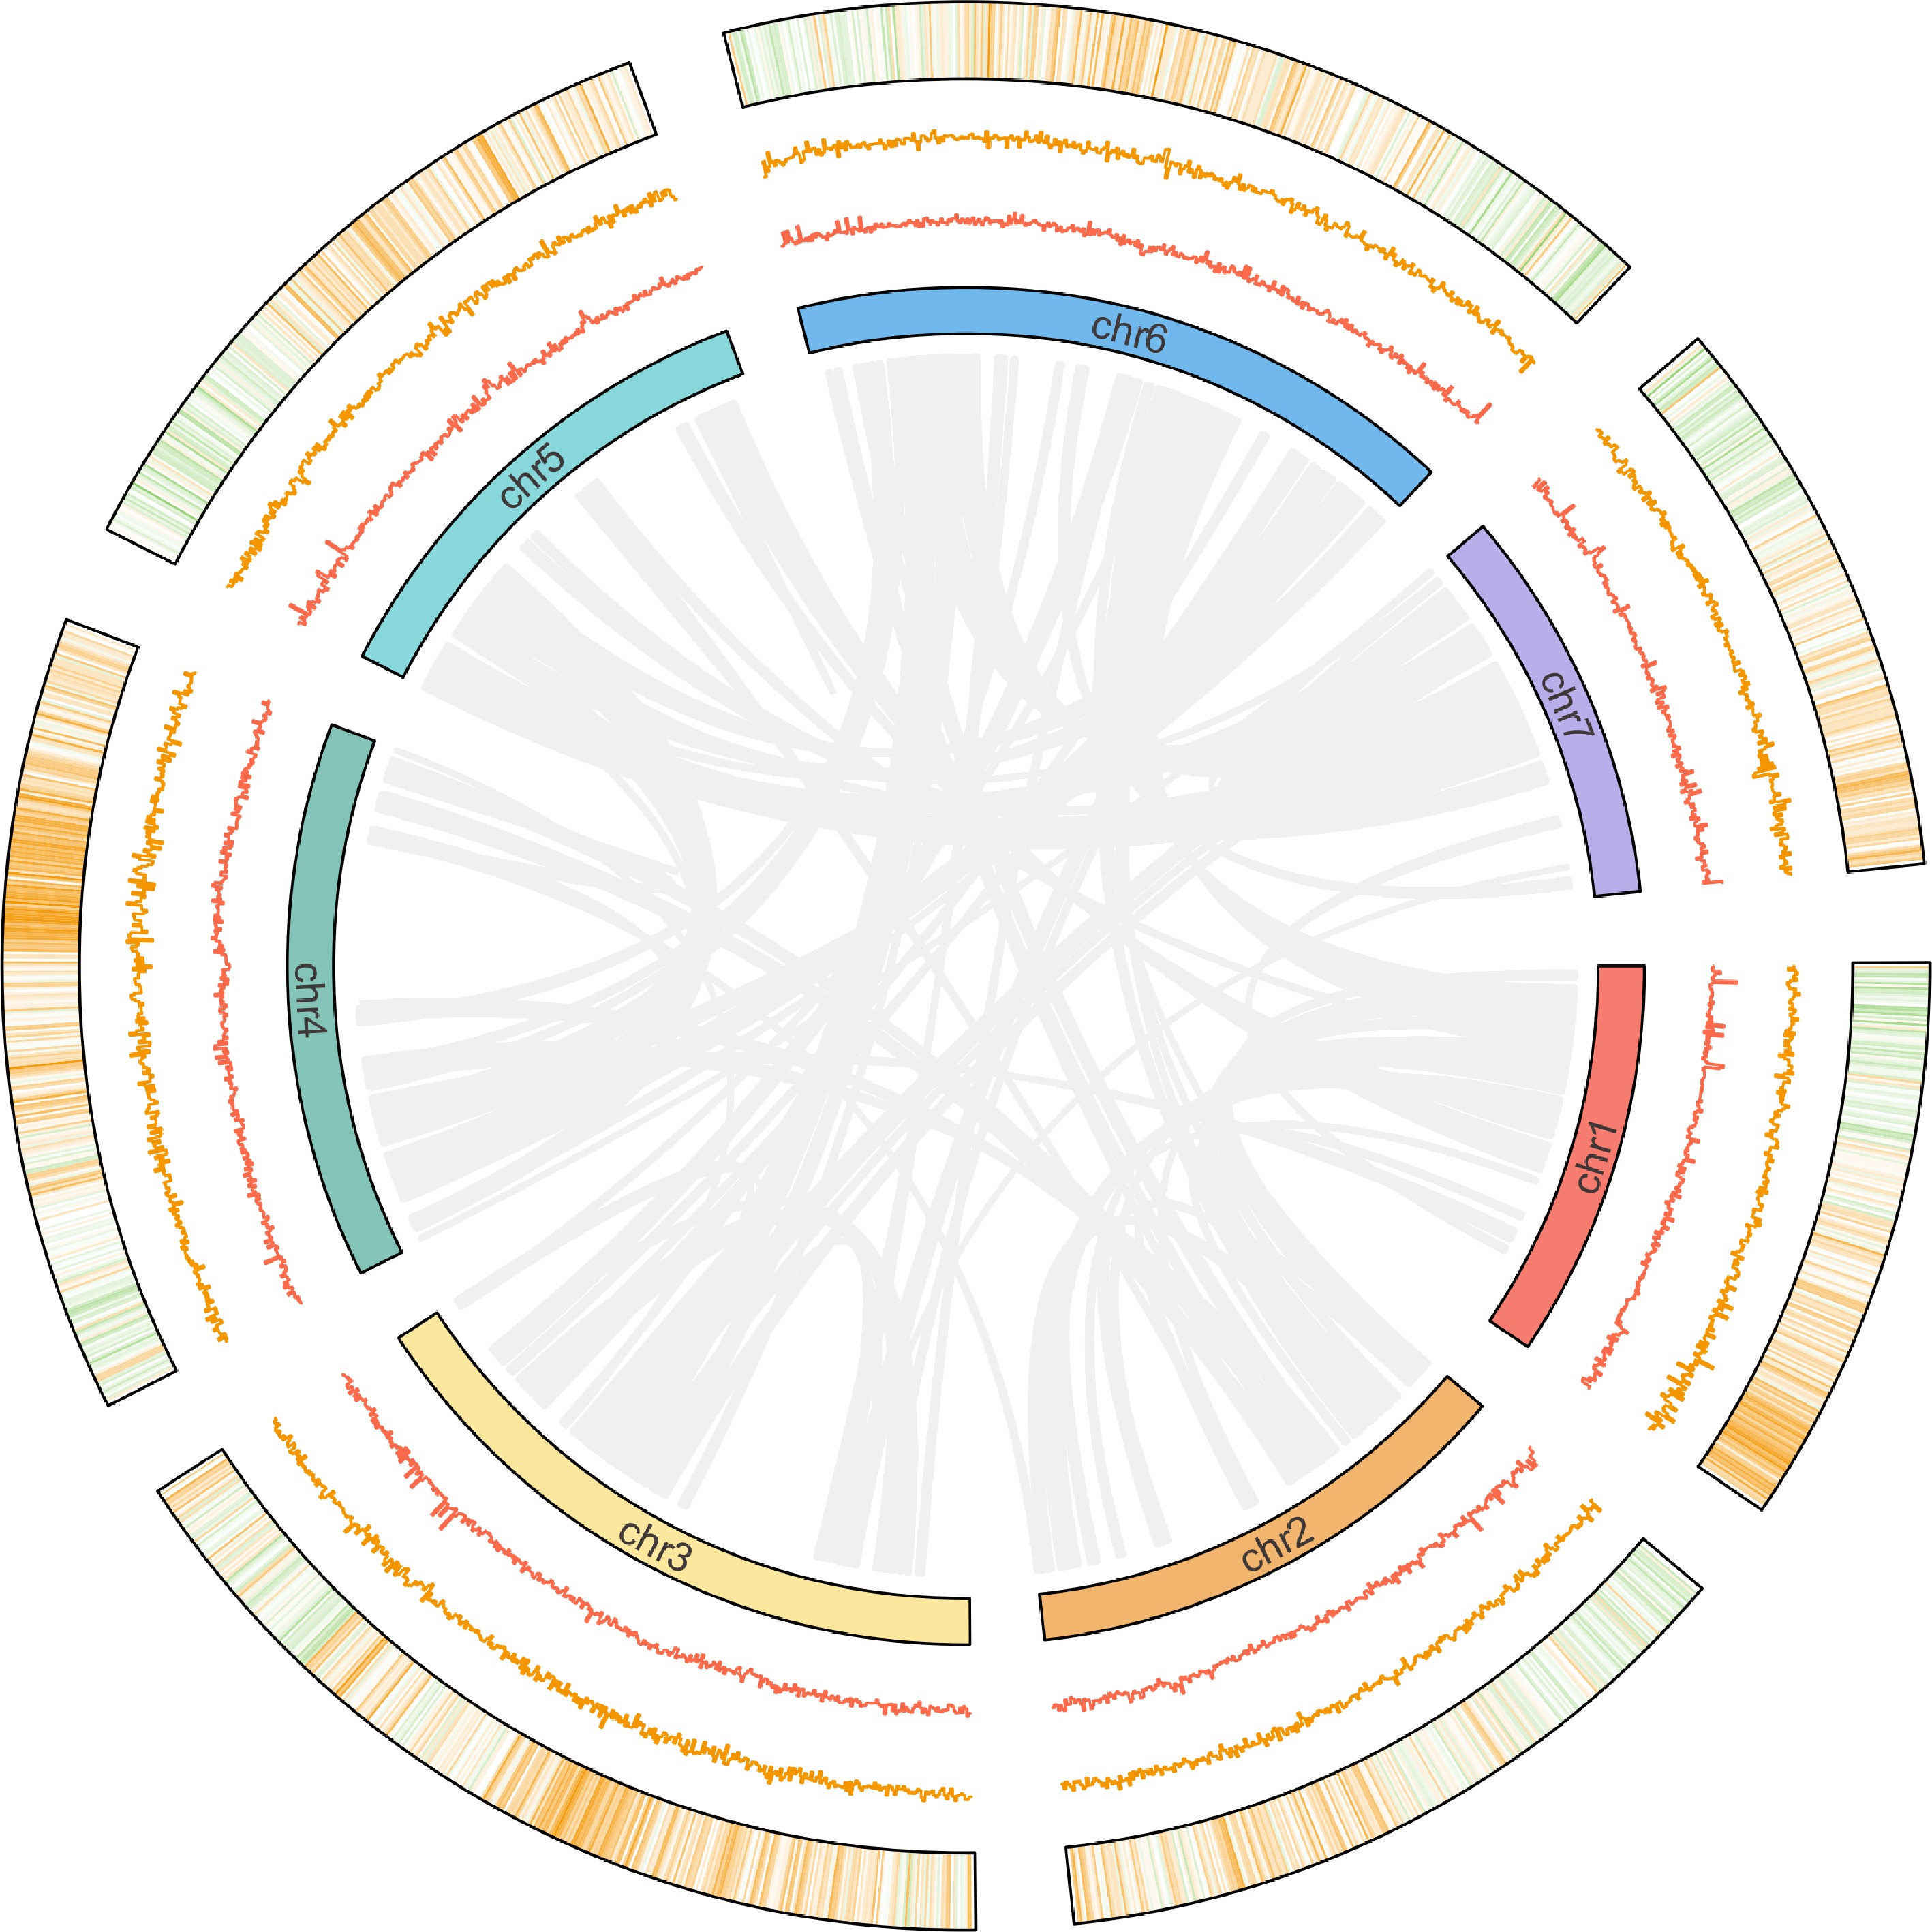
Figure 1.
Circular visualization of 'Ruegen' genome. The circular diagram displays (from inner to outer rings): (1) chromosomal homologous relationships; (2) GC content distribution (100-kb windows); (3) GC skew patterns (100-kb windows); (4) gene density (100-kb windows).
-
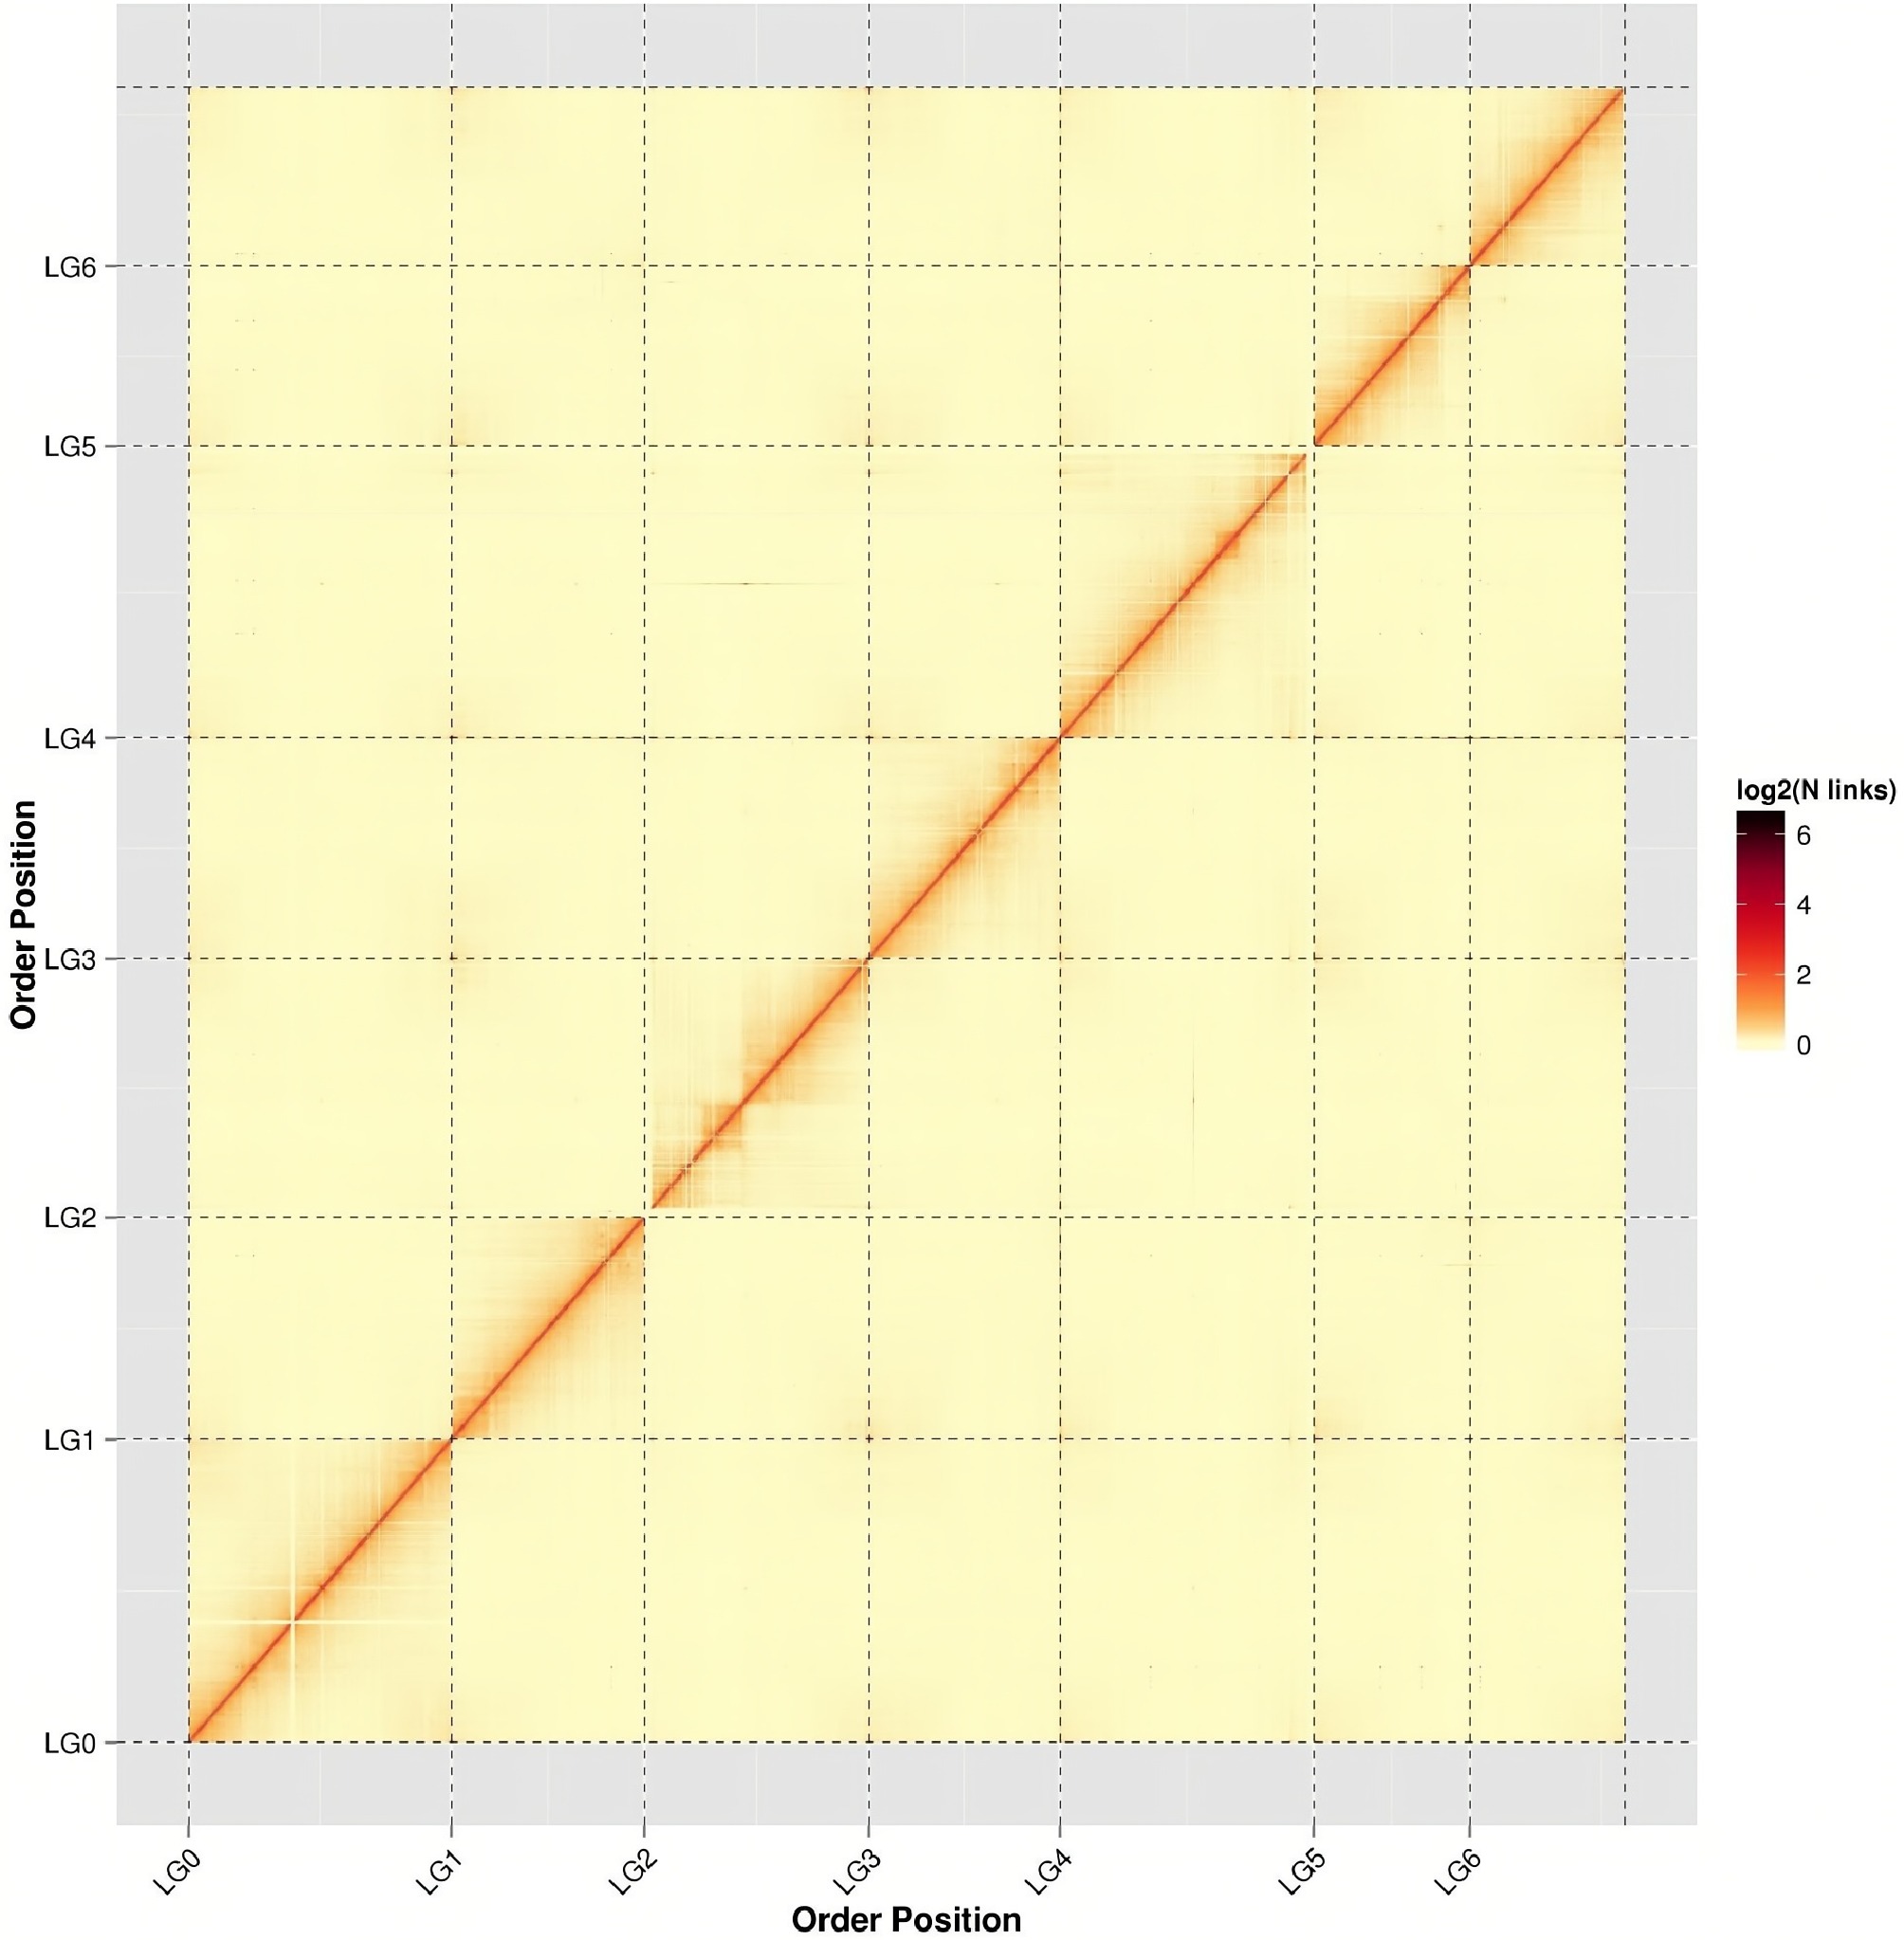
Figure 2.
Hi-C assembly chromosome interaction heatmap. chr1−chr7 represents chromosome groups 1−7. The horizontal and vertical axes represent the order of each bin on the corresponding chromosome group.
-
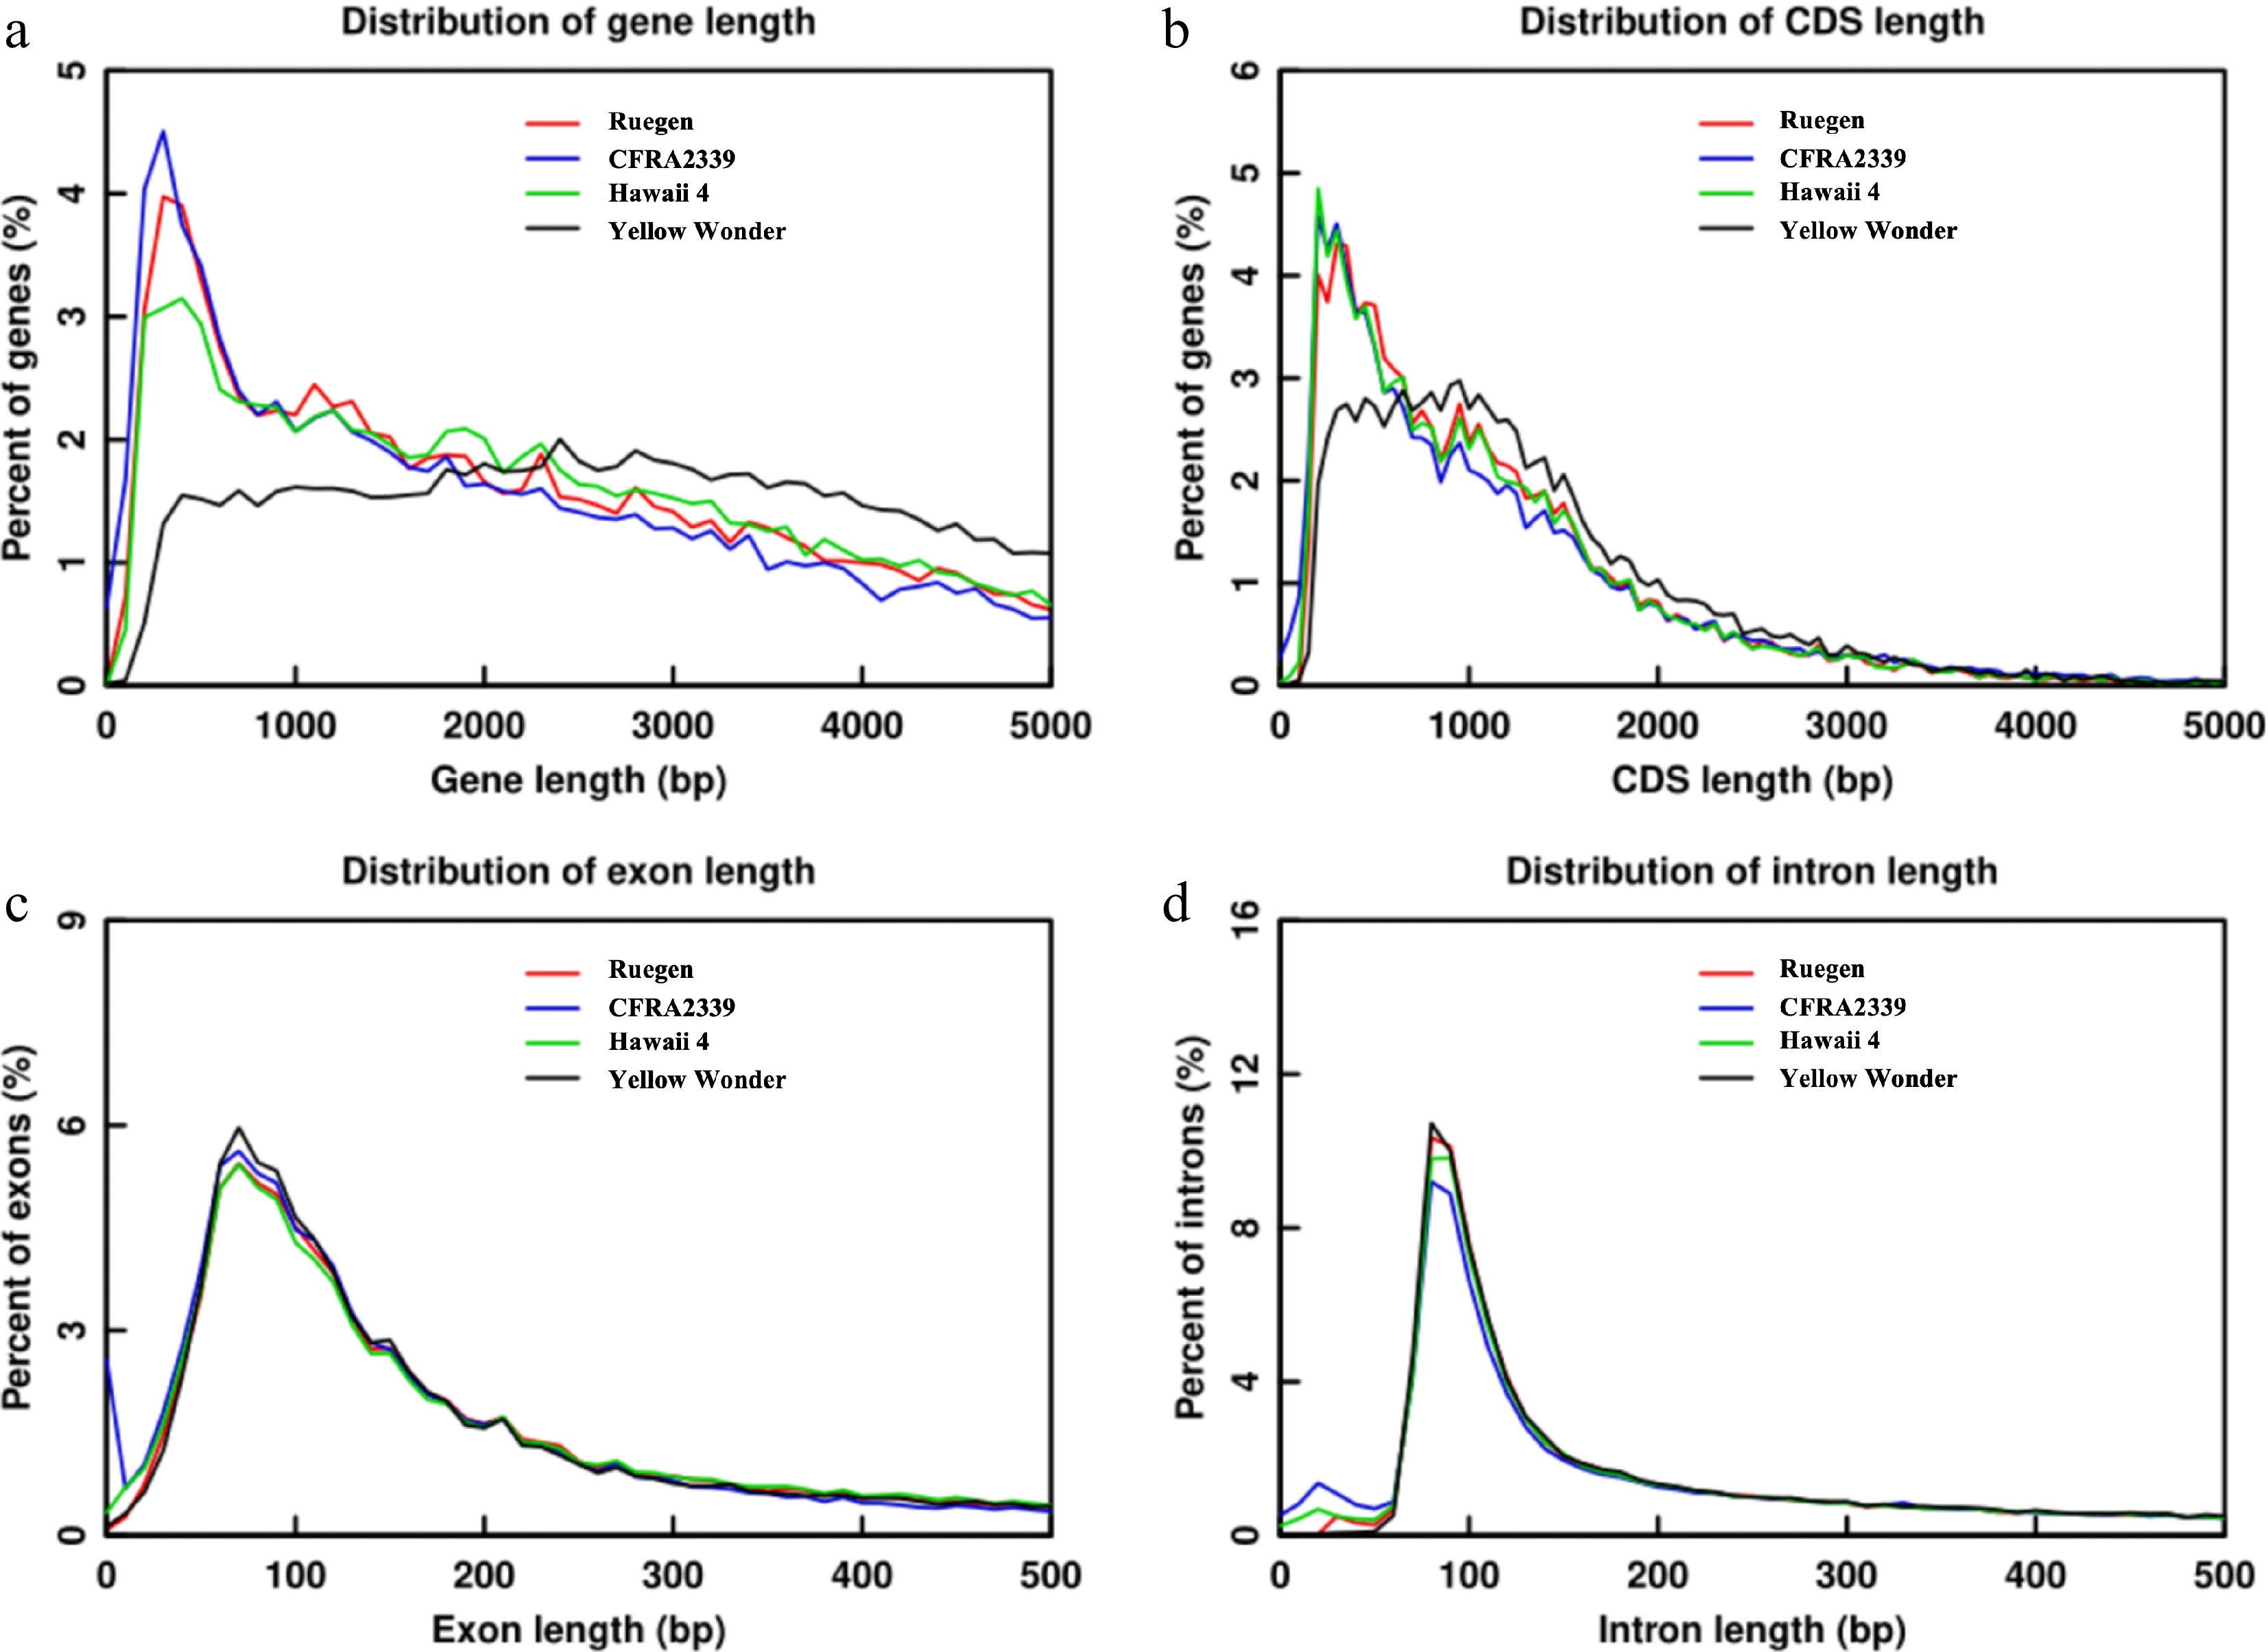
Figure 3.
Comparative distribution of gene structural elements in 'Ruegen', 'CFRA2339', 'Hawaii 4', and 'Yellow Wonder'. (a) Gene length distribution (bp), showing the percentage of genes in each size bin. (b) CDS length distribution (bp). (c) Exon length distribution (bp). (d) Intron length distribution (bp).
-
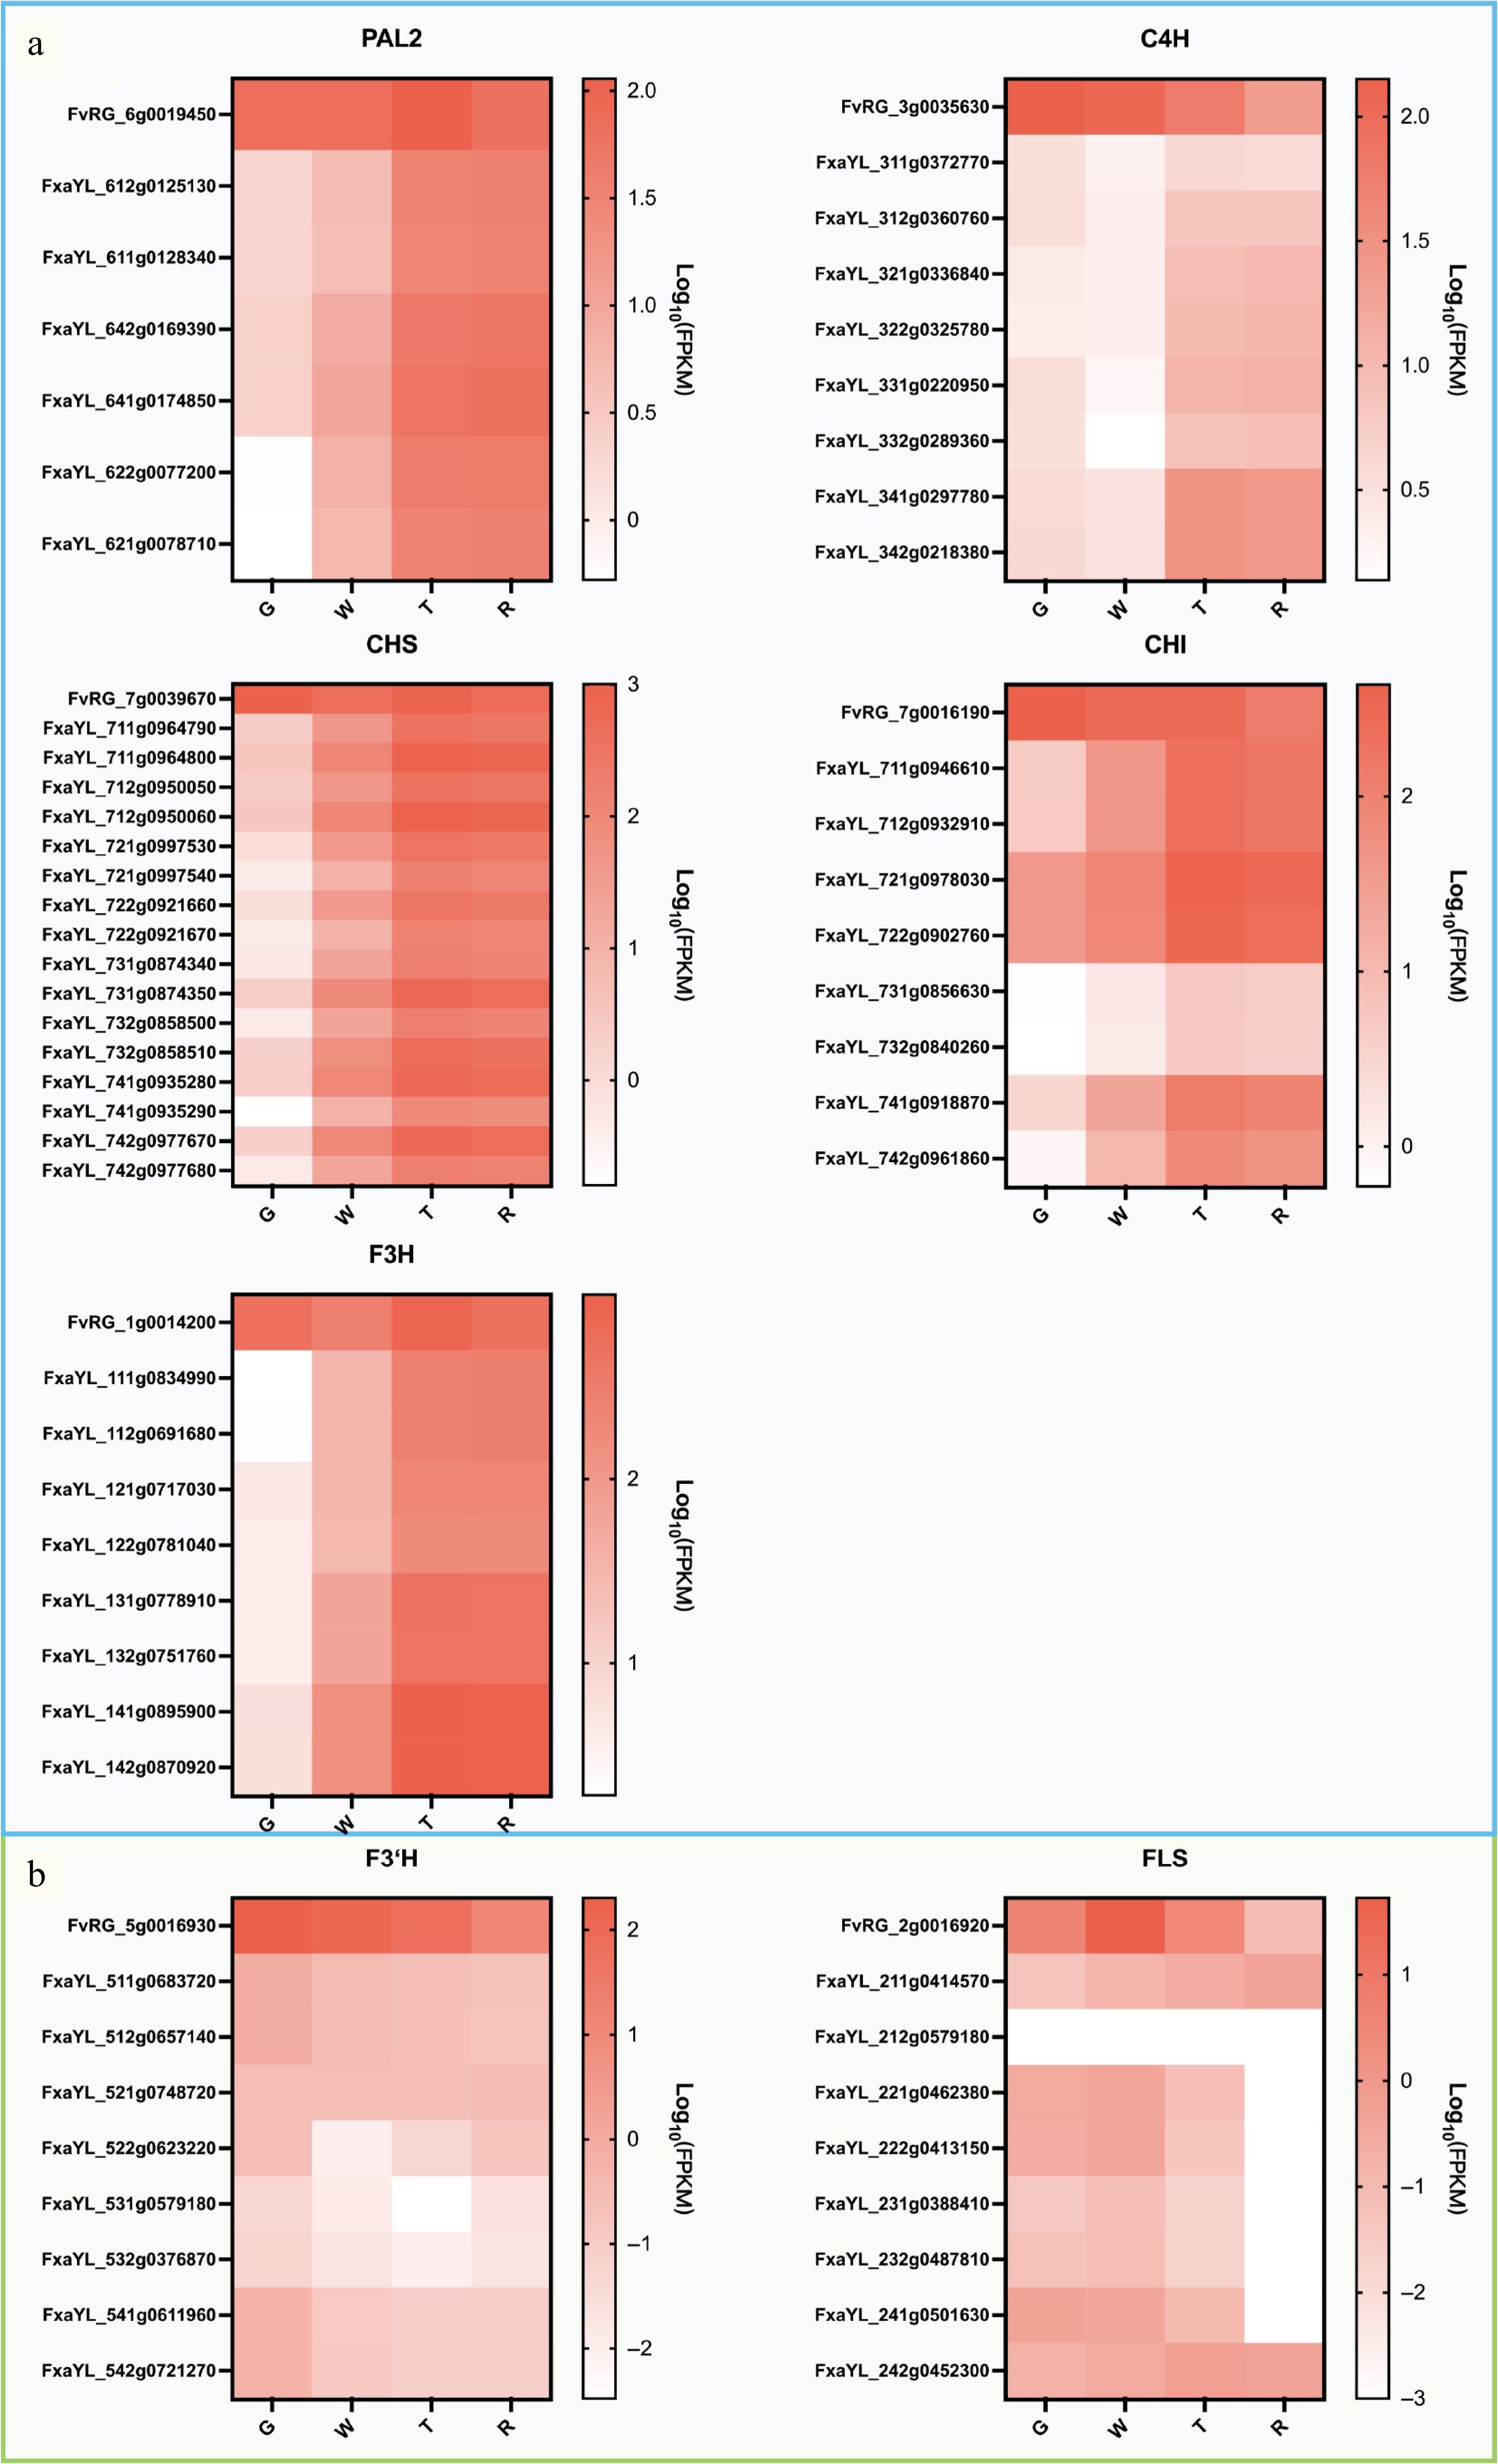
Figure 4.
Heat map of expression levels of EBGs during fruit development in 'Ruegen' (RG) and 'YanLi' (YL). (a) Five EBGs show divergent expression patterns between 'Yanli' (YL) and RG while maintaining consistent allelic expression within YL. (b) F3'H and FLS exhibiting expression patterns concordant with specific YL alleles. The color scale represents log10(FPKM + 0.0001) normalized expression values.
-
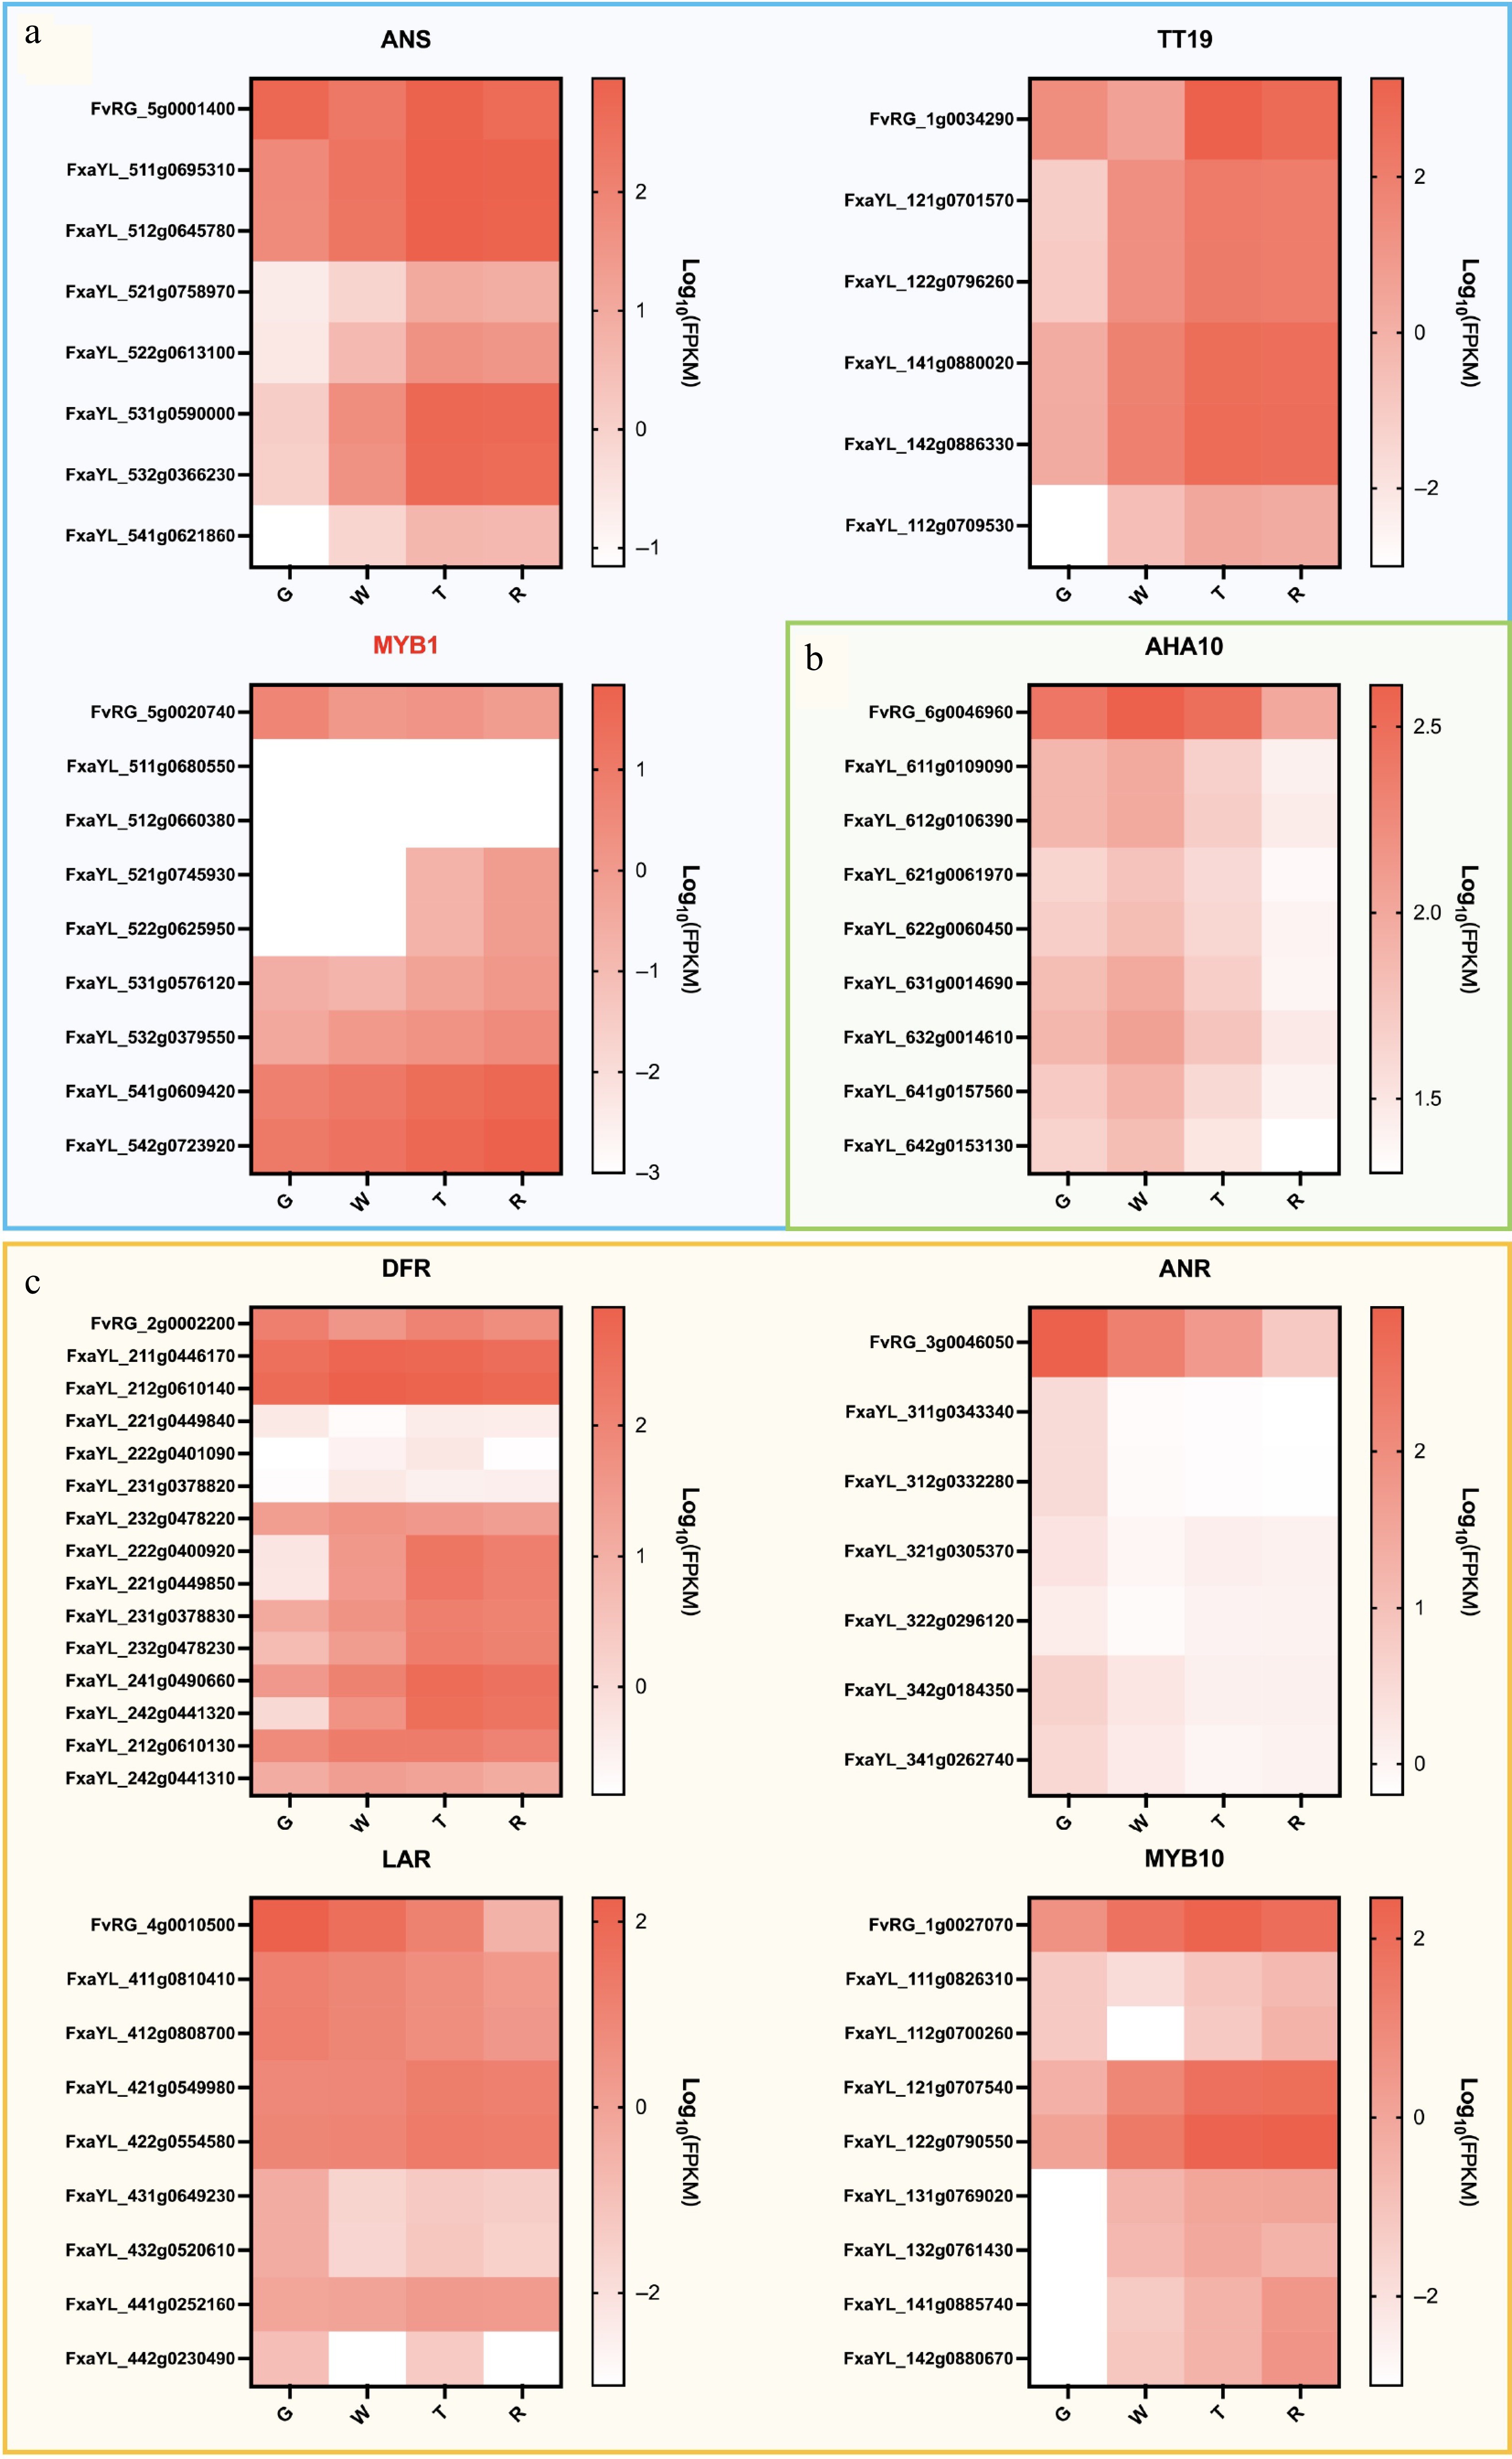
Figure 5.
Heat map of expression levels of LBGs during fruit development in 'Ruegen' (RG) and 'YanLi' (YL). (a) ANS, TT19, and MYB1 show divergent expression patterns between 'Yanli' (YL) and RG while maintaining consistent allelic expression within YL. (b) The expression pattern of AHA10 gene is similar in YL and RG. (c) Four RG LBGs exhibiting expression patterns concordant with specific YL alleles. The color scale represents log10(FPKM + 0.0001) normalized expression values.
-
Assembly feature Number Scaffold number 50 Scaffold length 221,321,825 Scaffold N50 (bp) 33,167,685 Scaffold N90 (bp) 23,655,317 Scaffold max (bp) 40,042,862 Gap total length (bp) 3,010 Contig number 142 Contig length (bp) 221,318,815 Contig N50 (bp) 8,351,392 Contig N90 (bp) 1,040,108 Contig max (bp) 18,184,794 GC content (%) 38.48 Table 1.
Statistical information on genome assembly.
-
Description Reference databases Number Percent (%) Total 36,071 Annotated 31,377 86.99 InterPro 23,870 66.18 GO 16,366 45.37 KEGG_ALL 30,574 84.76 KEGG_KO 10,674 29.59 Swissprot 19,054 52.82 TrEMBL 30,140 83.56 TF 1,736 4.81 Pfam 23,481 65.10 NR 30,947 85.79 KOG 23,055 63.92 Unannotated 4,694 13.01 Table 2.
Functional annotation statistics results.
-
RepBase TEs TE proteins De novo Combined TEs Length (bp) % in genome Length (bp) % in genome Length (bp) % in genome Length (bp) % in genome DNA 22,861,785 10.33 4,802,499 2.17 19,895,368 8.99 29,624,293 13.39 LINE 2,837,652 1.28 1,789,441 0.81 3,417,282 1.54 4,676,541 2.11 SINE 10,031 0 0 0 8,265 0 18,296 0.01 LTR 26,068,846 11.78 9,354,199 4.23 22,028,459 9.95 35,119,957 15.87 Satellite 352,115 0.16 0 0 257,026 0.12 549,061 0.25 Simple_repeat 0 0 0 0 274,771 0.12 274,771 0.12 Other 299 0 747 0 0 0 1,046 0 Unknown 393,519 0.18 18,210 0.01 10,928,536 4.94 11,128,498 5.03 Total 51,904,045 23.45 15,956,836 7.21 56,499,821 25.53 79,971,177 36.13 Table 3.
Statistics of the repeated sequences.
Figures
(5)
Tables
(3)