-
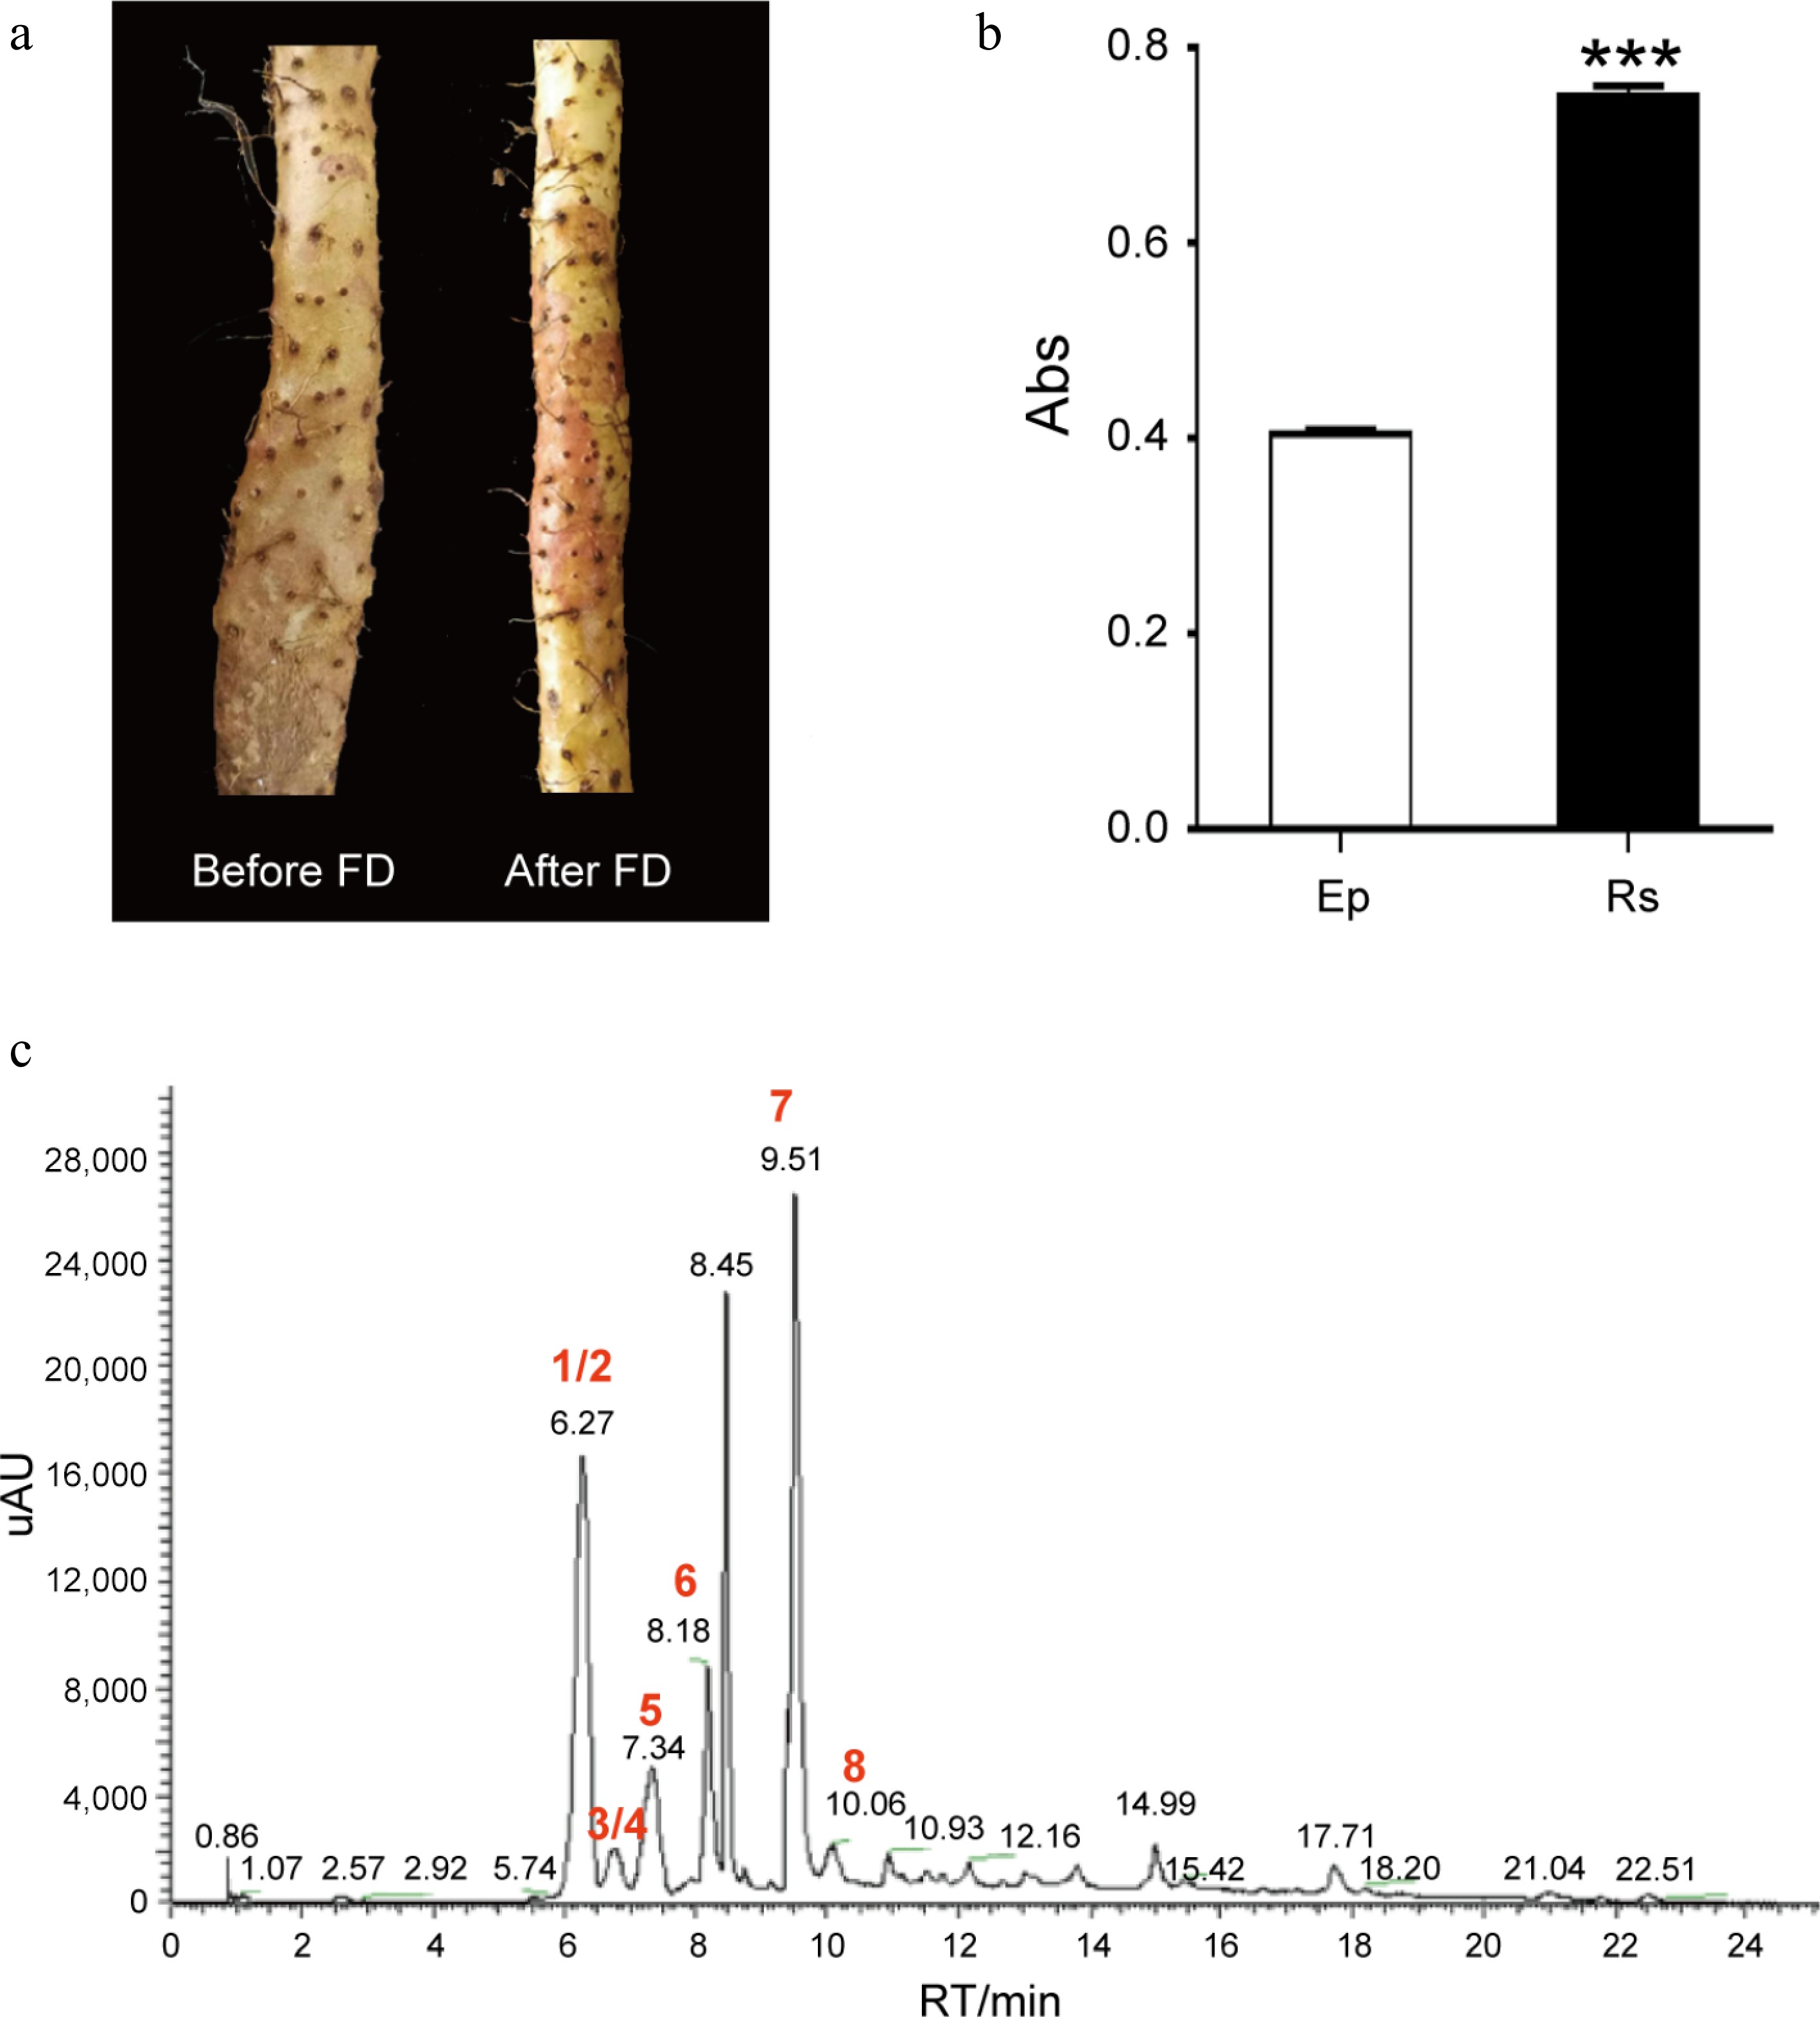
Figure 1.
Rs is the authentic characteristic of D. opposita. (a) Rhizome epidermis of D. opposita before and after Frost's Descent (FD). (b) Determination of anthocyanin content in rhizome epidermis without Rs (Ep) or with Rs by UV spectrum, Values are Mean ± SD, Student test, *** p < 0.001 compared with Rs (n = 3). (c) HPLC analysis of the main types of anthocyanins in Rs. Numbers 1–8 represents compounds cyanidin-3,5-O-diglucoside (1), cyanidin-3-O-sophoroside (2), cyanidin-3-O-galactoside (3), cyanidin-3-O-glucoside (4), peonidin-3,5-O-diglucoside (5), delphinidin (6), cyanidin (7), and peonidin (8), respectively. Among them, 1/2 (and 3/4) means either one of them could be the possible compound. UV: Ultraviolet, HPLC: High Performance Liquid Chromatography.
-
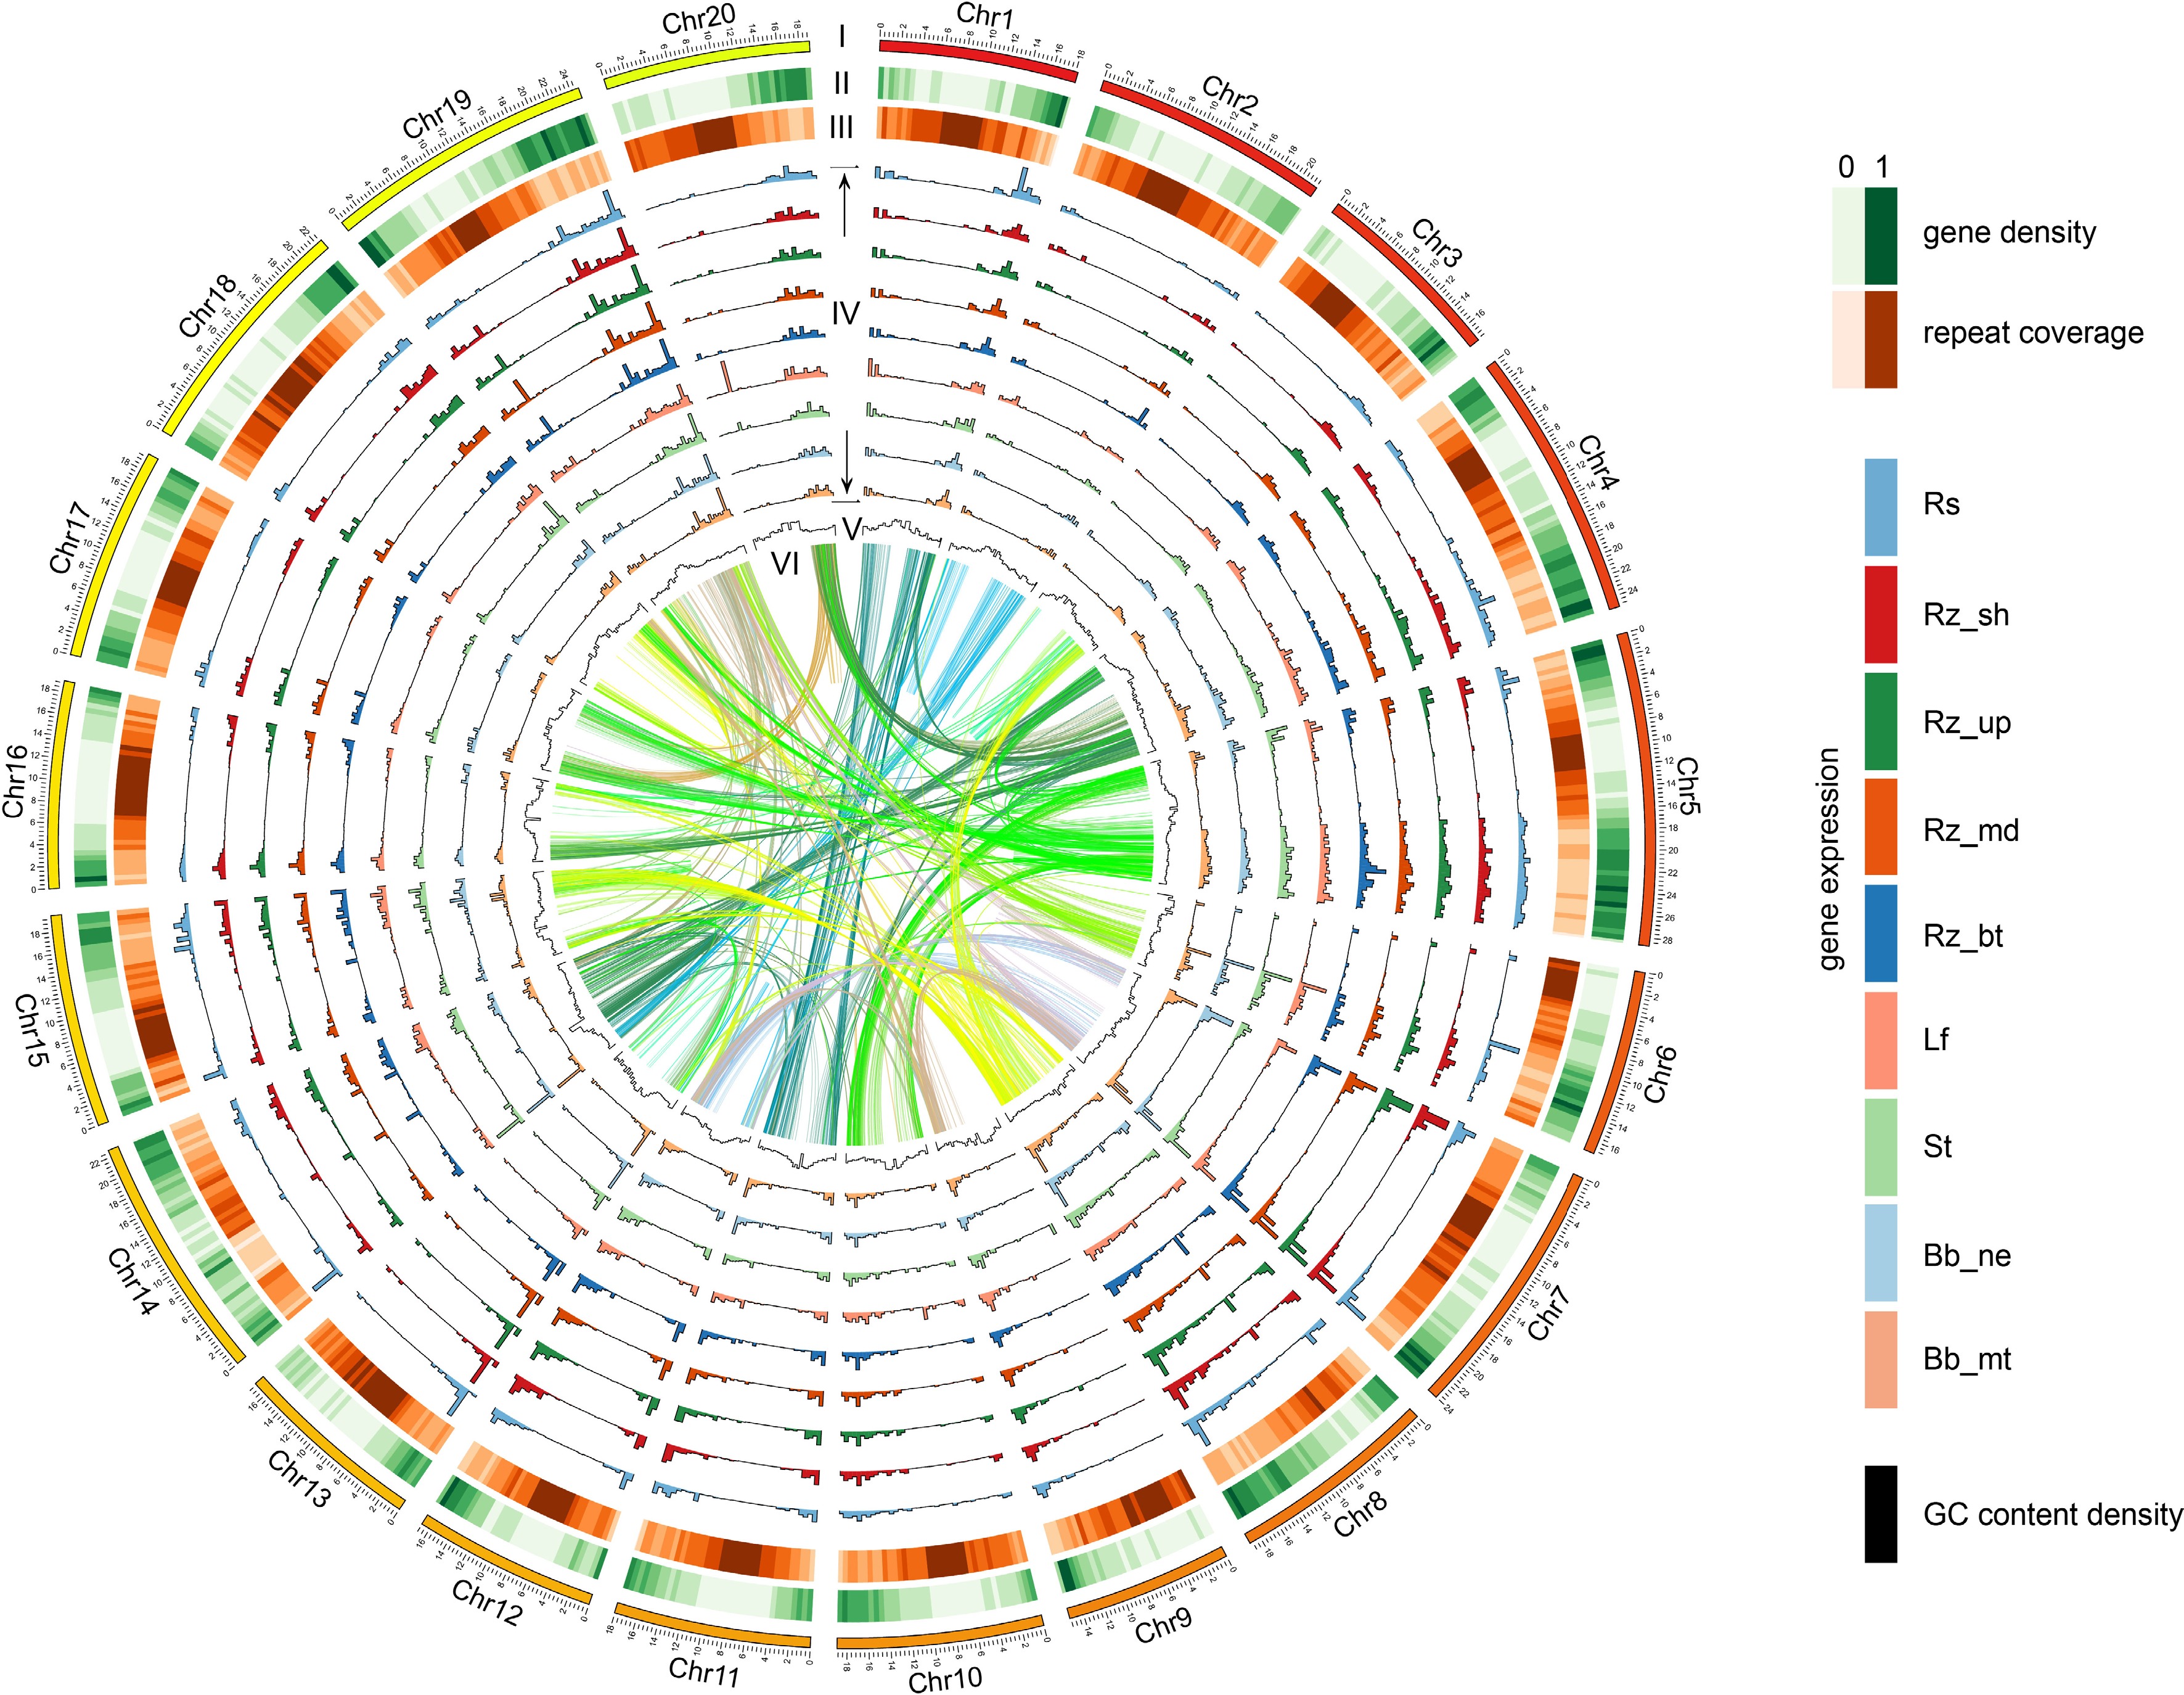
Figure 2.
The chromosomes of D. opposita. Twenty chromosomes were ordered by size (megabases) and featured in 500 kb intervals across the chromosomes. Tracks displayed are: I. chromosome; II. gene density; III. repeat coverage; IV. tissue specific expression level (from outer to inner: Rs, Rz_sh, Rz_up, Rz_md, Rz_bu, Lf, St, Bb_ne, Bb_mt); V. GC content density; VI. relationship between syntenic blocks, as indicated by lines. Each line represents a syntenic block; block size = 3 kb. Rs: rhizome peel with Rs, Rz_sh: rhizome shoot, Rz_up: rhizome upper part, Rz_md: rhizome middle part, Rz_bt: rhizome bottom part, Lf: leaf, St: stem, Bb_ne: new bulbil, Bb_mt: mature bulbil.
-
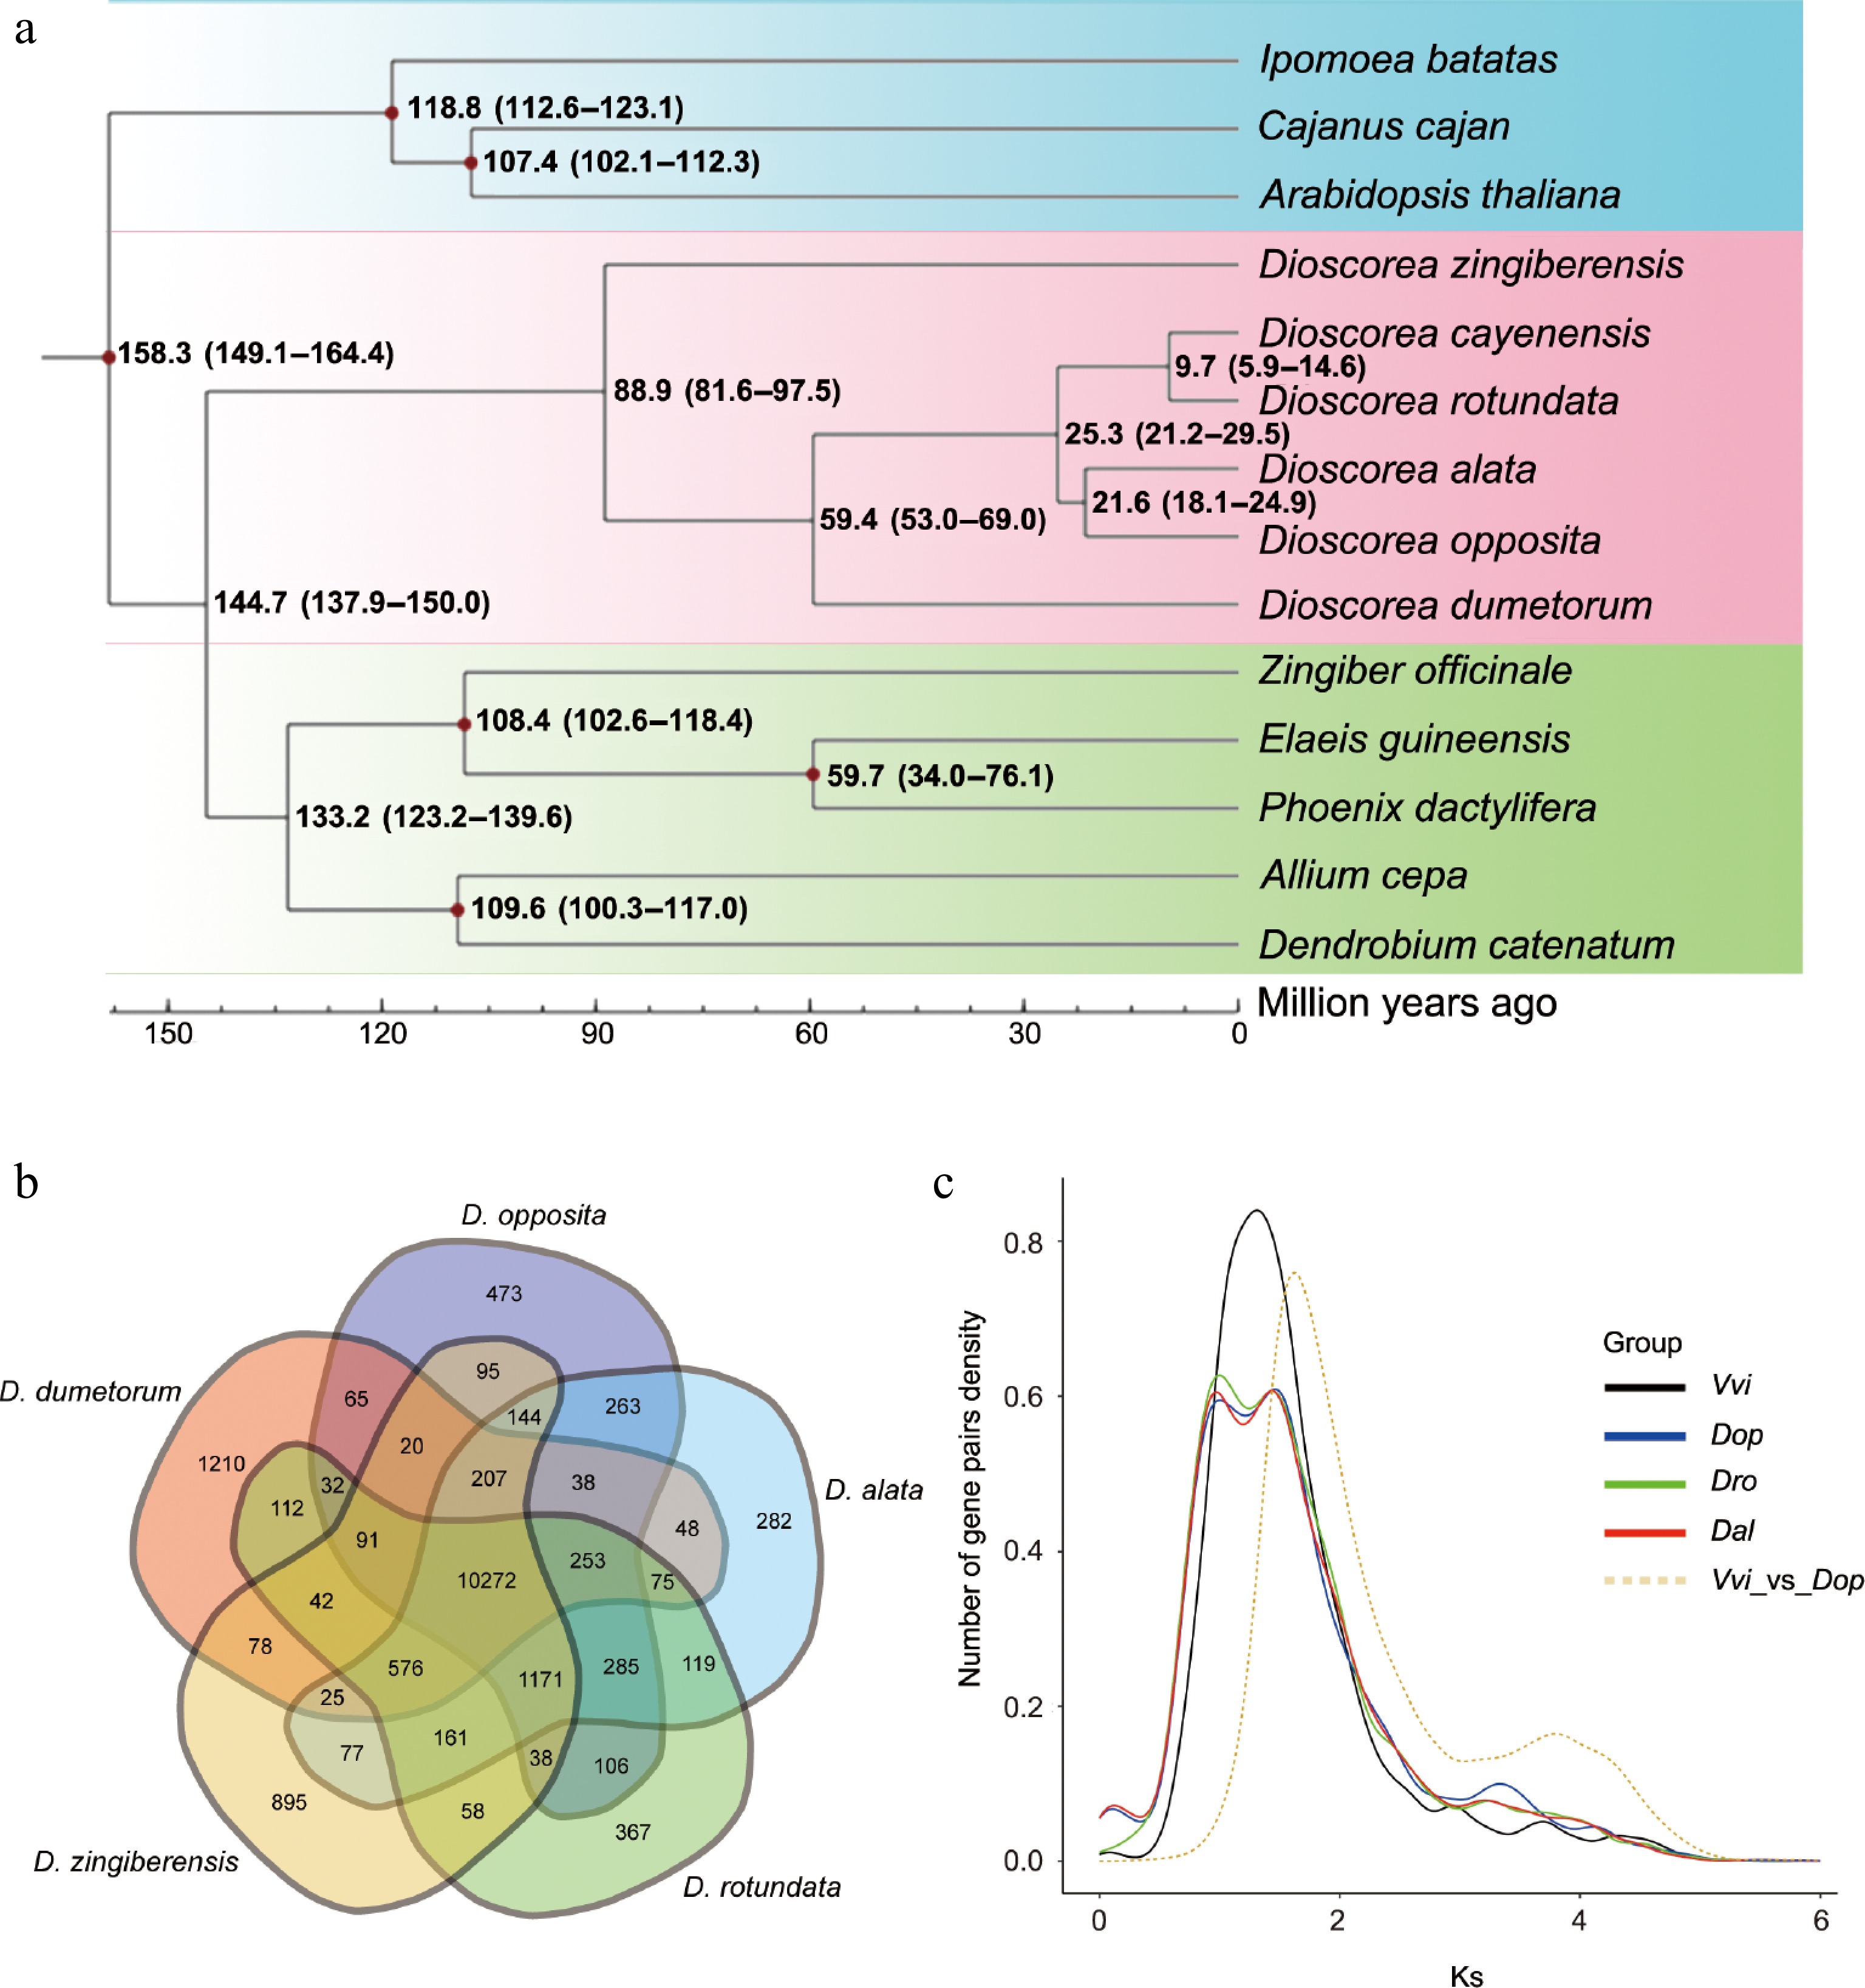
Figure 3.
Evolutionary and gene family analysis of D. opposita. (a) Evolutionary analysis shows the divergence time. (b) Venn diagram displays shared and different gene families among D. opposita, D. alata, D. rotundata, D. zingiberensis, and D. dumetorum. (c) Ks distribution of paralogs identified from V. vinifera (Vvi), D. opposita (Dop), D. alata (Dal), and D. rotundata (Dro).
-
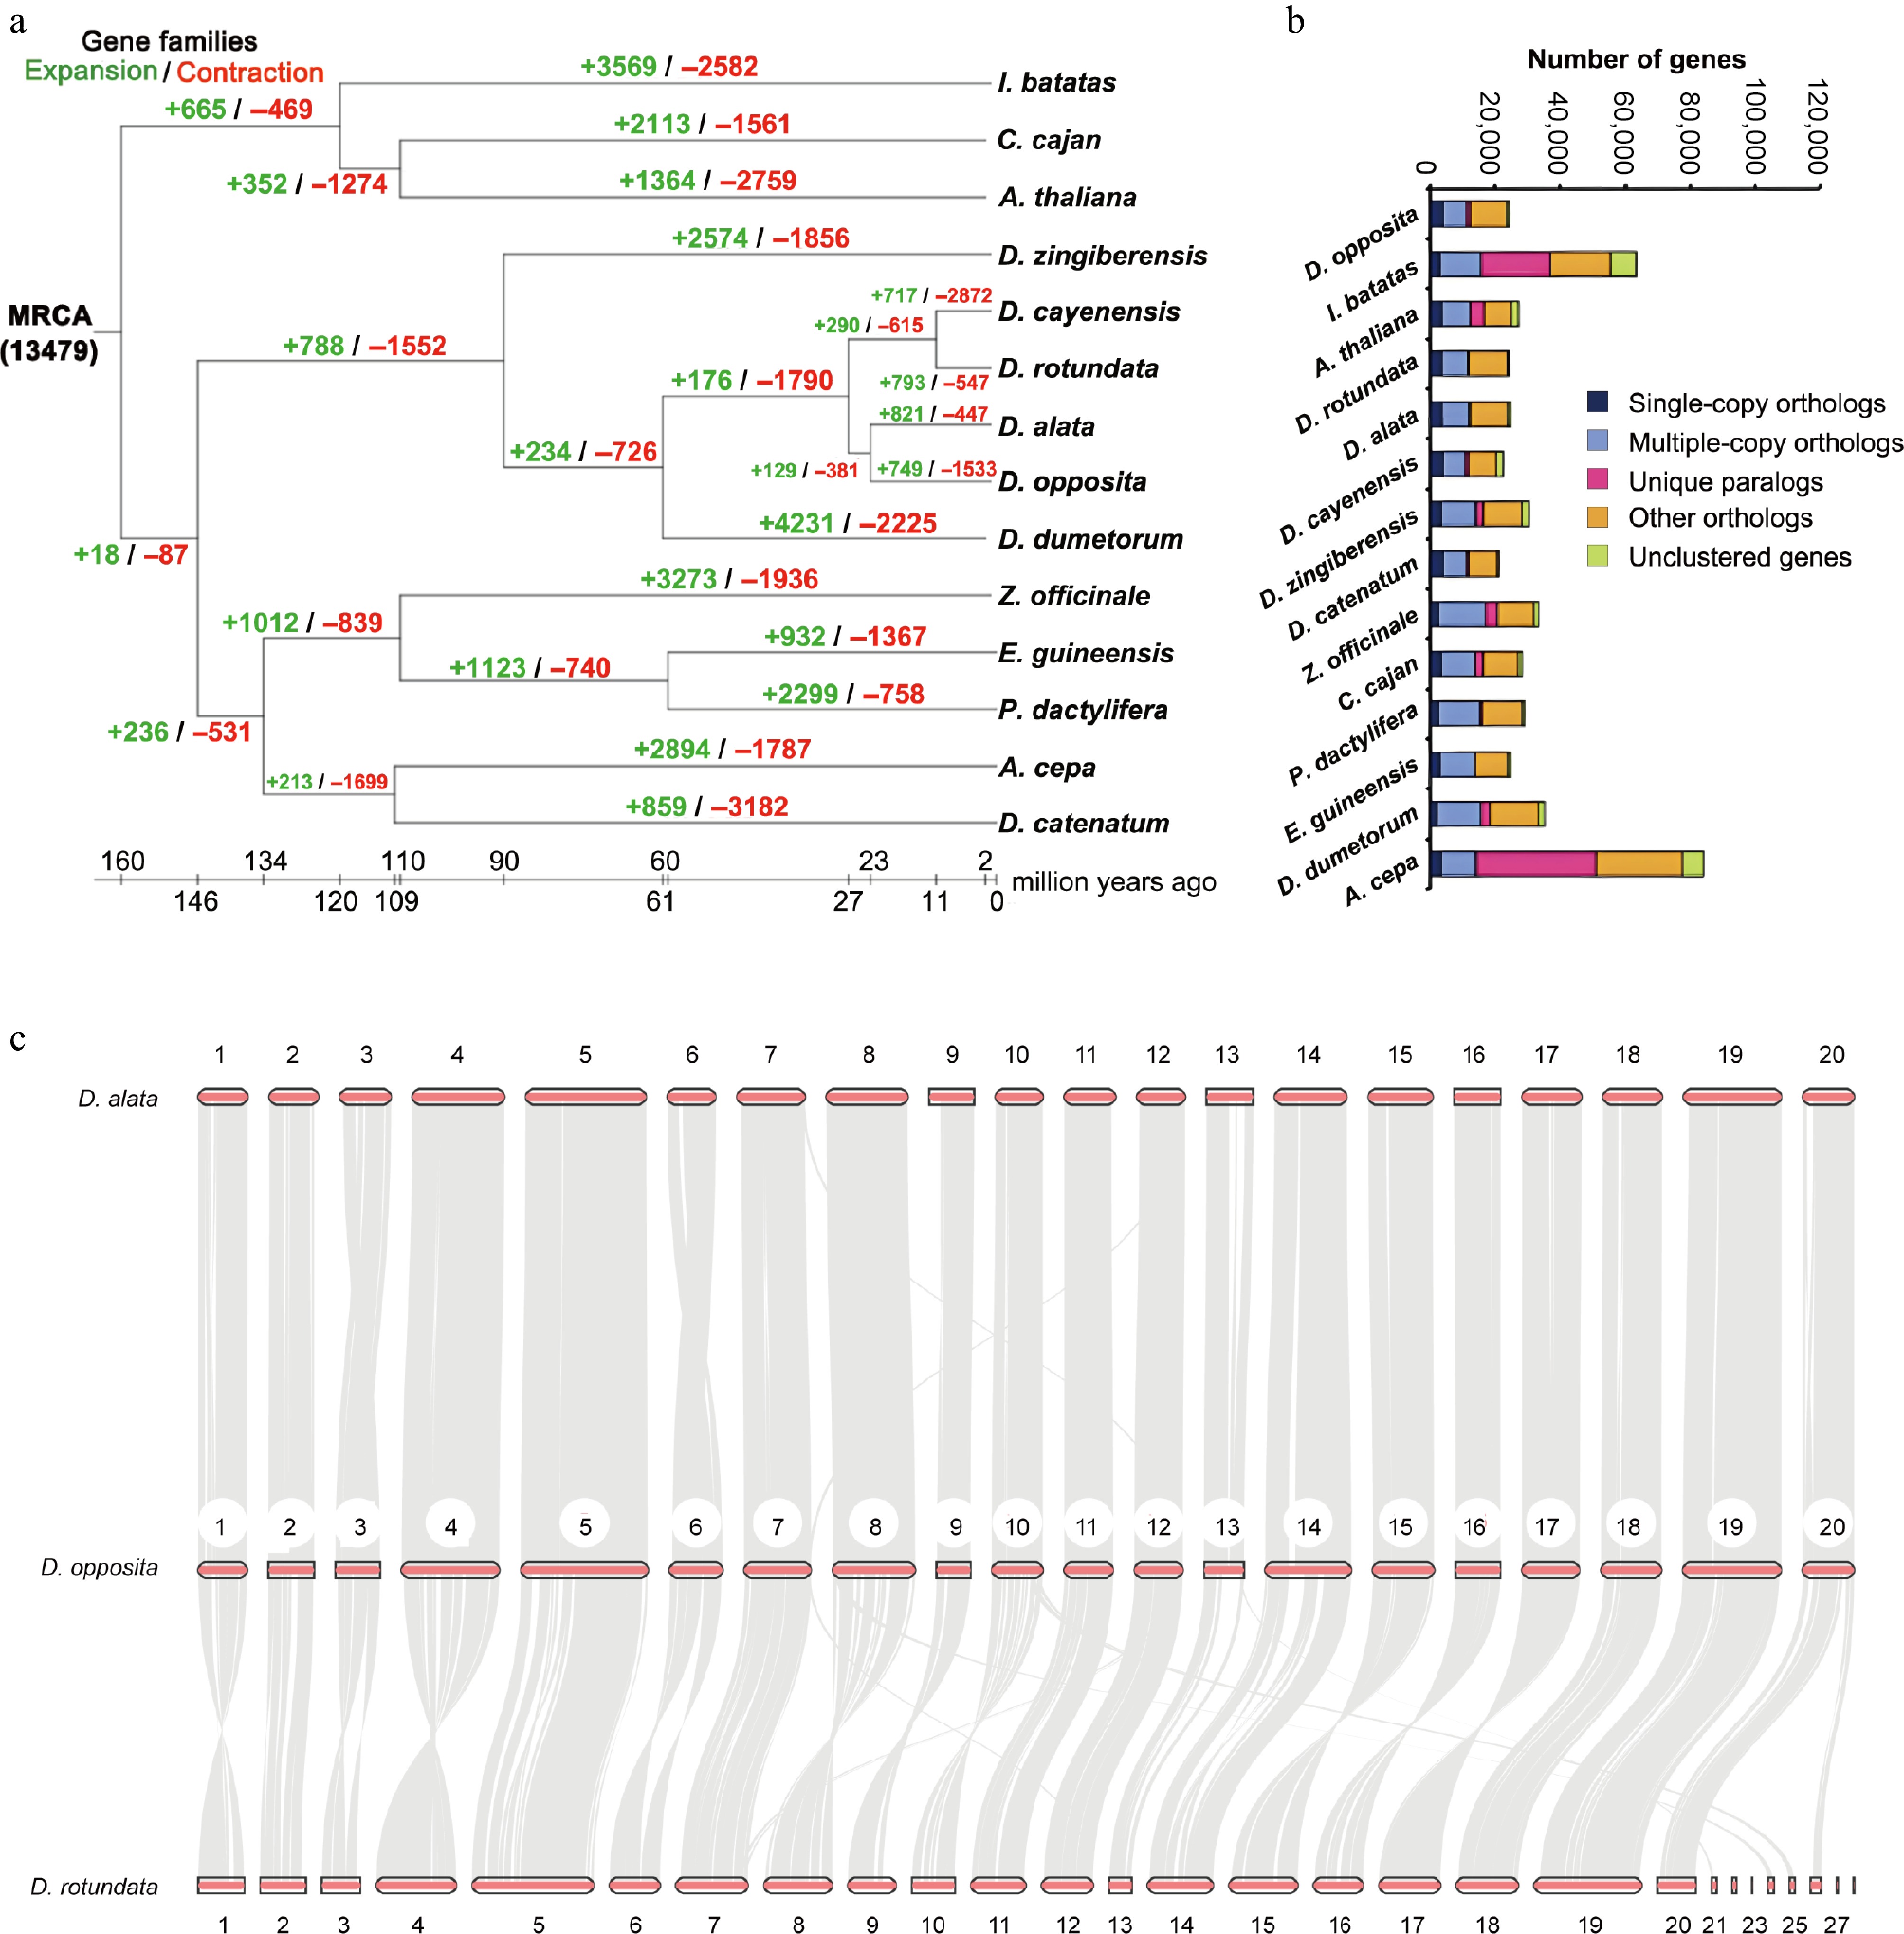
Figure 4.
Genomic comparative analysis. (a) Gene family expansion and contraction of multiple species. (b) Gene numbers of multiple species. (c) Synteny analysis between D. opposita and D. alata, or D. opposita and D. rotundata.
-
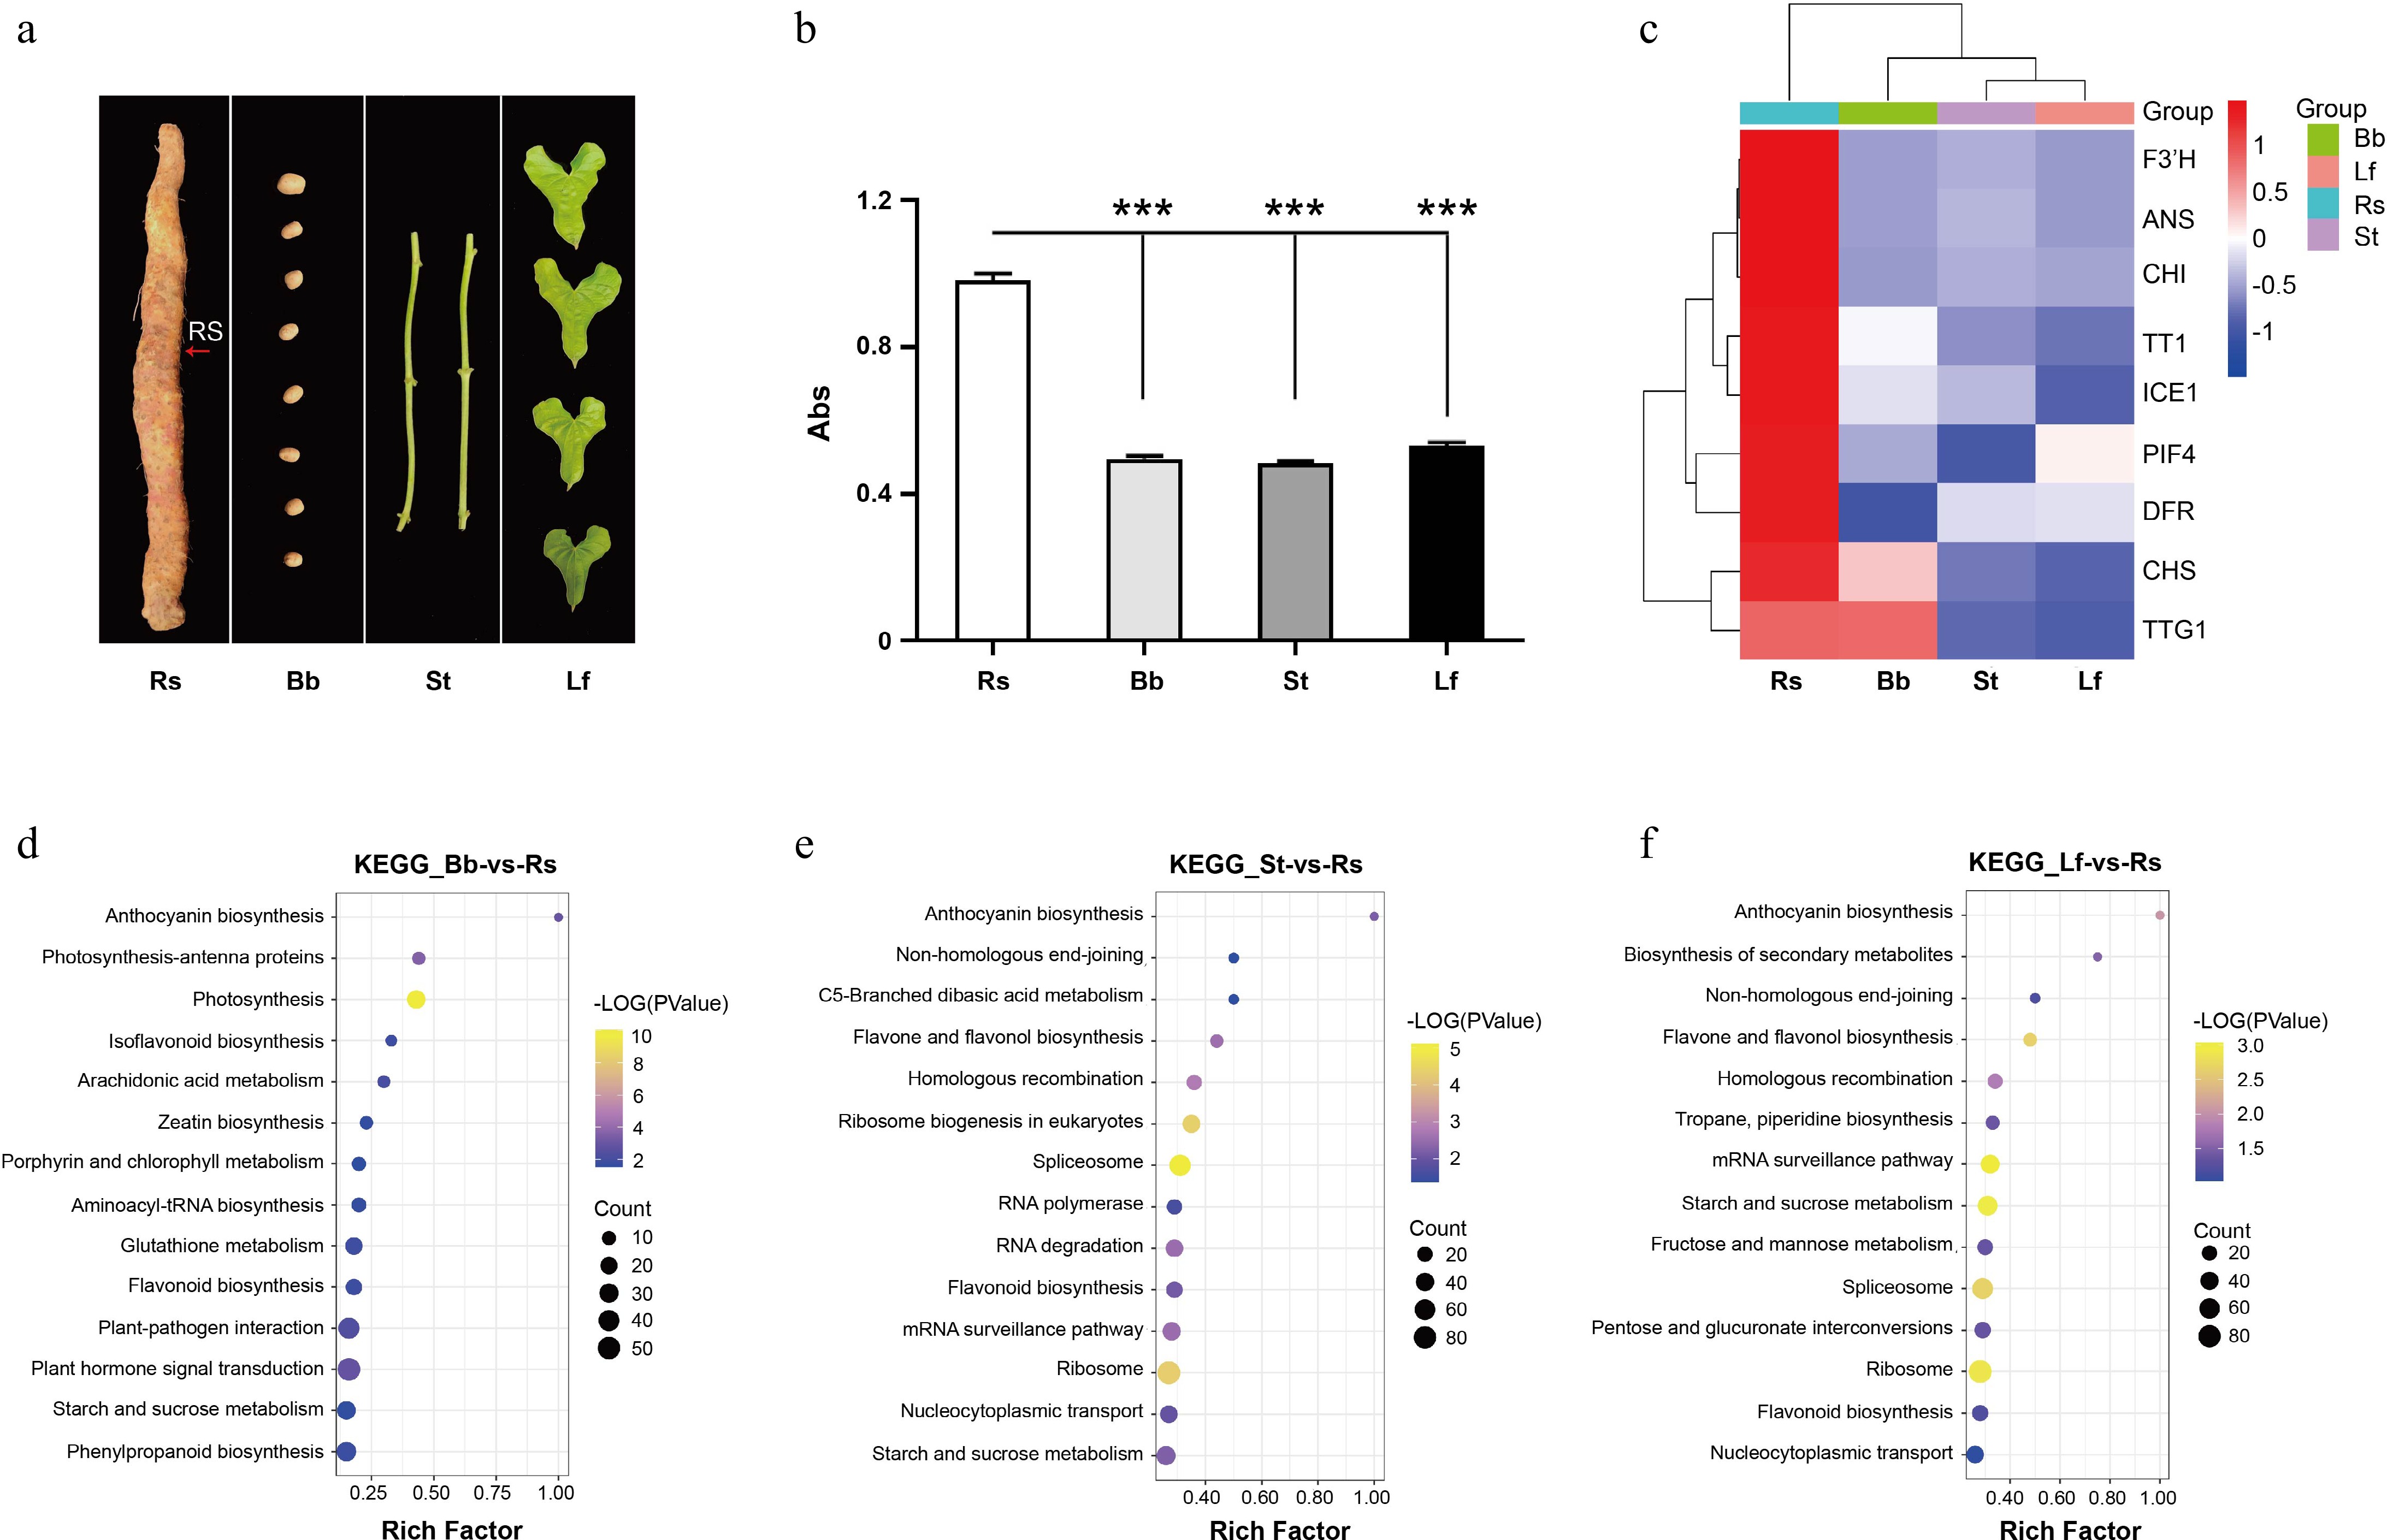
Figure 5.
Transcriptome analysis of D. opposita tissues. (a) Tissues of D. opposita, including rhizome with Rs as the red arrow points, bulbil (Bb), stem (St), and leaf (Lf). (b) UV spectroscopy detection of anthocyanin content in the tissues above, values are Mean ± SD, Student test, *** p < 0.001 compared with Rs (n = 3). (c) Expressions of anthocyanin biosynthesis and regulation related genes in Rs, Bb, St, and Lf of D. opposita. (d) KEGG enrichment analysis of up-regulated DEGs in Rs compared with those in Bb. (e) KEGG enrichment analysis of up-regulated DEGs in Rs compared with those in St. (f) KEGG enrichment analysis of up-regulated DEGs in Rs compared with those in Lf.
-
No. Compound Chemical formula Ionization mode m/z (Predicted) m/z (Measured) RT/min Fragment ion-1 Fragment ion-2 1 Cyanidin-3,5-O-diglucoside C27H31O16 M+ 611.16066 611.16034 6.29 449.10837 287.05466 2 Cyanidin-3-O-sophoroside C27H31O16 M+ 611.16066 611.16034 6.29 287.05466 − 3 Cyanidin-3-O-galactoside C21H21O11 M+ 449.10784 449.10745 6.84 287.05453 − 4 Cyanidin-3-O-glucoside C21H21O11 M+ 449.10784 449.10745 6.84 287.05453 − 5 Peonidin-3,5-O-diglucoside C28H33O16 M+ 625.17631 625.17596 7.41 − 301.07007 6 Delphinidin C15H11O7 M+ 303.04993 303.04956 8.25 303.04944 − 7 Cyanidin C15H11O6 M+ 287.05501 287.05466 9.57 287.05466 − 8 Peonidin C16H13O6 M+ 301.07066 301.07028 10.14 301.07025 − 9 Petunidin C16H13O7 M+ 317.06558 317.06509 19.25 317.06522 − RT: Retention Time of HPLC, SLD: Second-Level Debris of TIC, −: Fragment ion was not detected. Table 1.
The main types of anthocyanins in D. opposita Rs.
-
Feature Number Length (Mb) Percentage Assembly feature Estimated genome size 2,405.58 Assembled scaffold sequences
(> 1 kb)272 424.05 100% N50 scaffold 19.06 N90 scaffold 16.83 Max. scaffold 28.73 Assembled contig sequences
(> 1 kb)349 424.01 100% N50 contig 6.16 N90 contig 1.42 Max. contig 18.98 GC content 38.45% Insert gap 77 3.85 0.01% Chromosome 20 405.00 95.52% Anchored and oriented scaffolds 20 405.00 95.52% Genome annotation Total repetitive sequence 1,463,958 276.39 65.18% Genes 24,405 109.47 25.82% Genes in a chromosome 22,905 106.74 25.17% Noncoding RNAs 2,577 5.62 1.33% Table 2.
Statistics for the D. opposita genome and gene prediction.
Figures
(5)
Tables
(2)