-
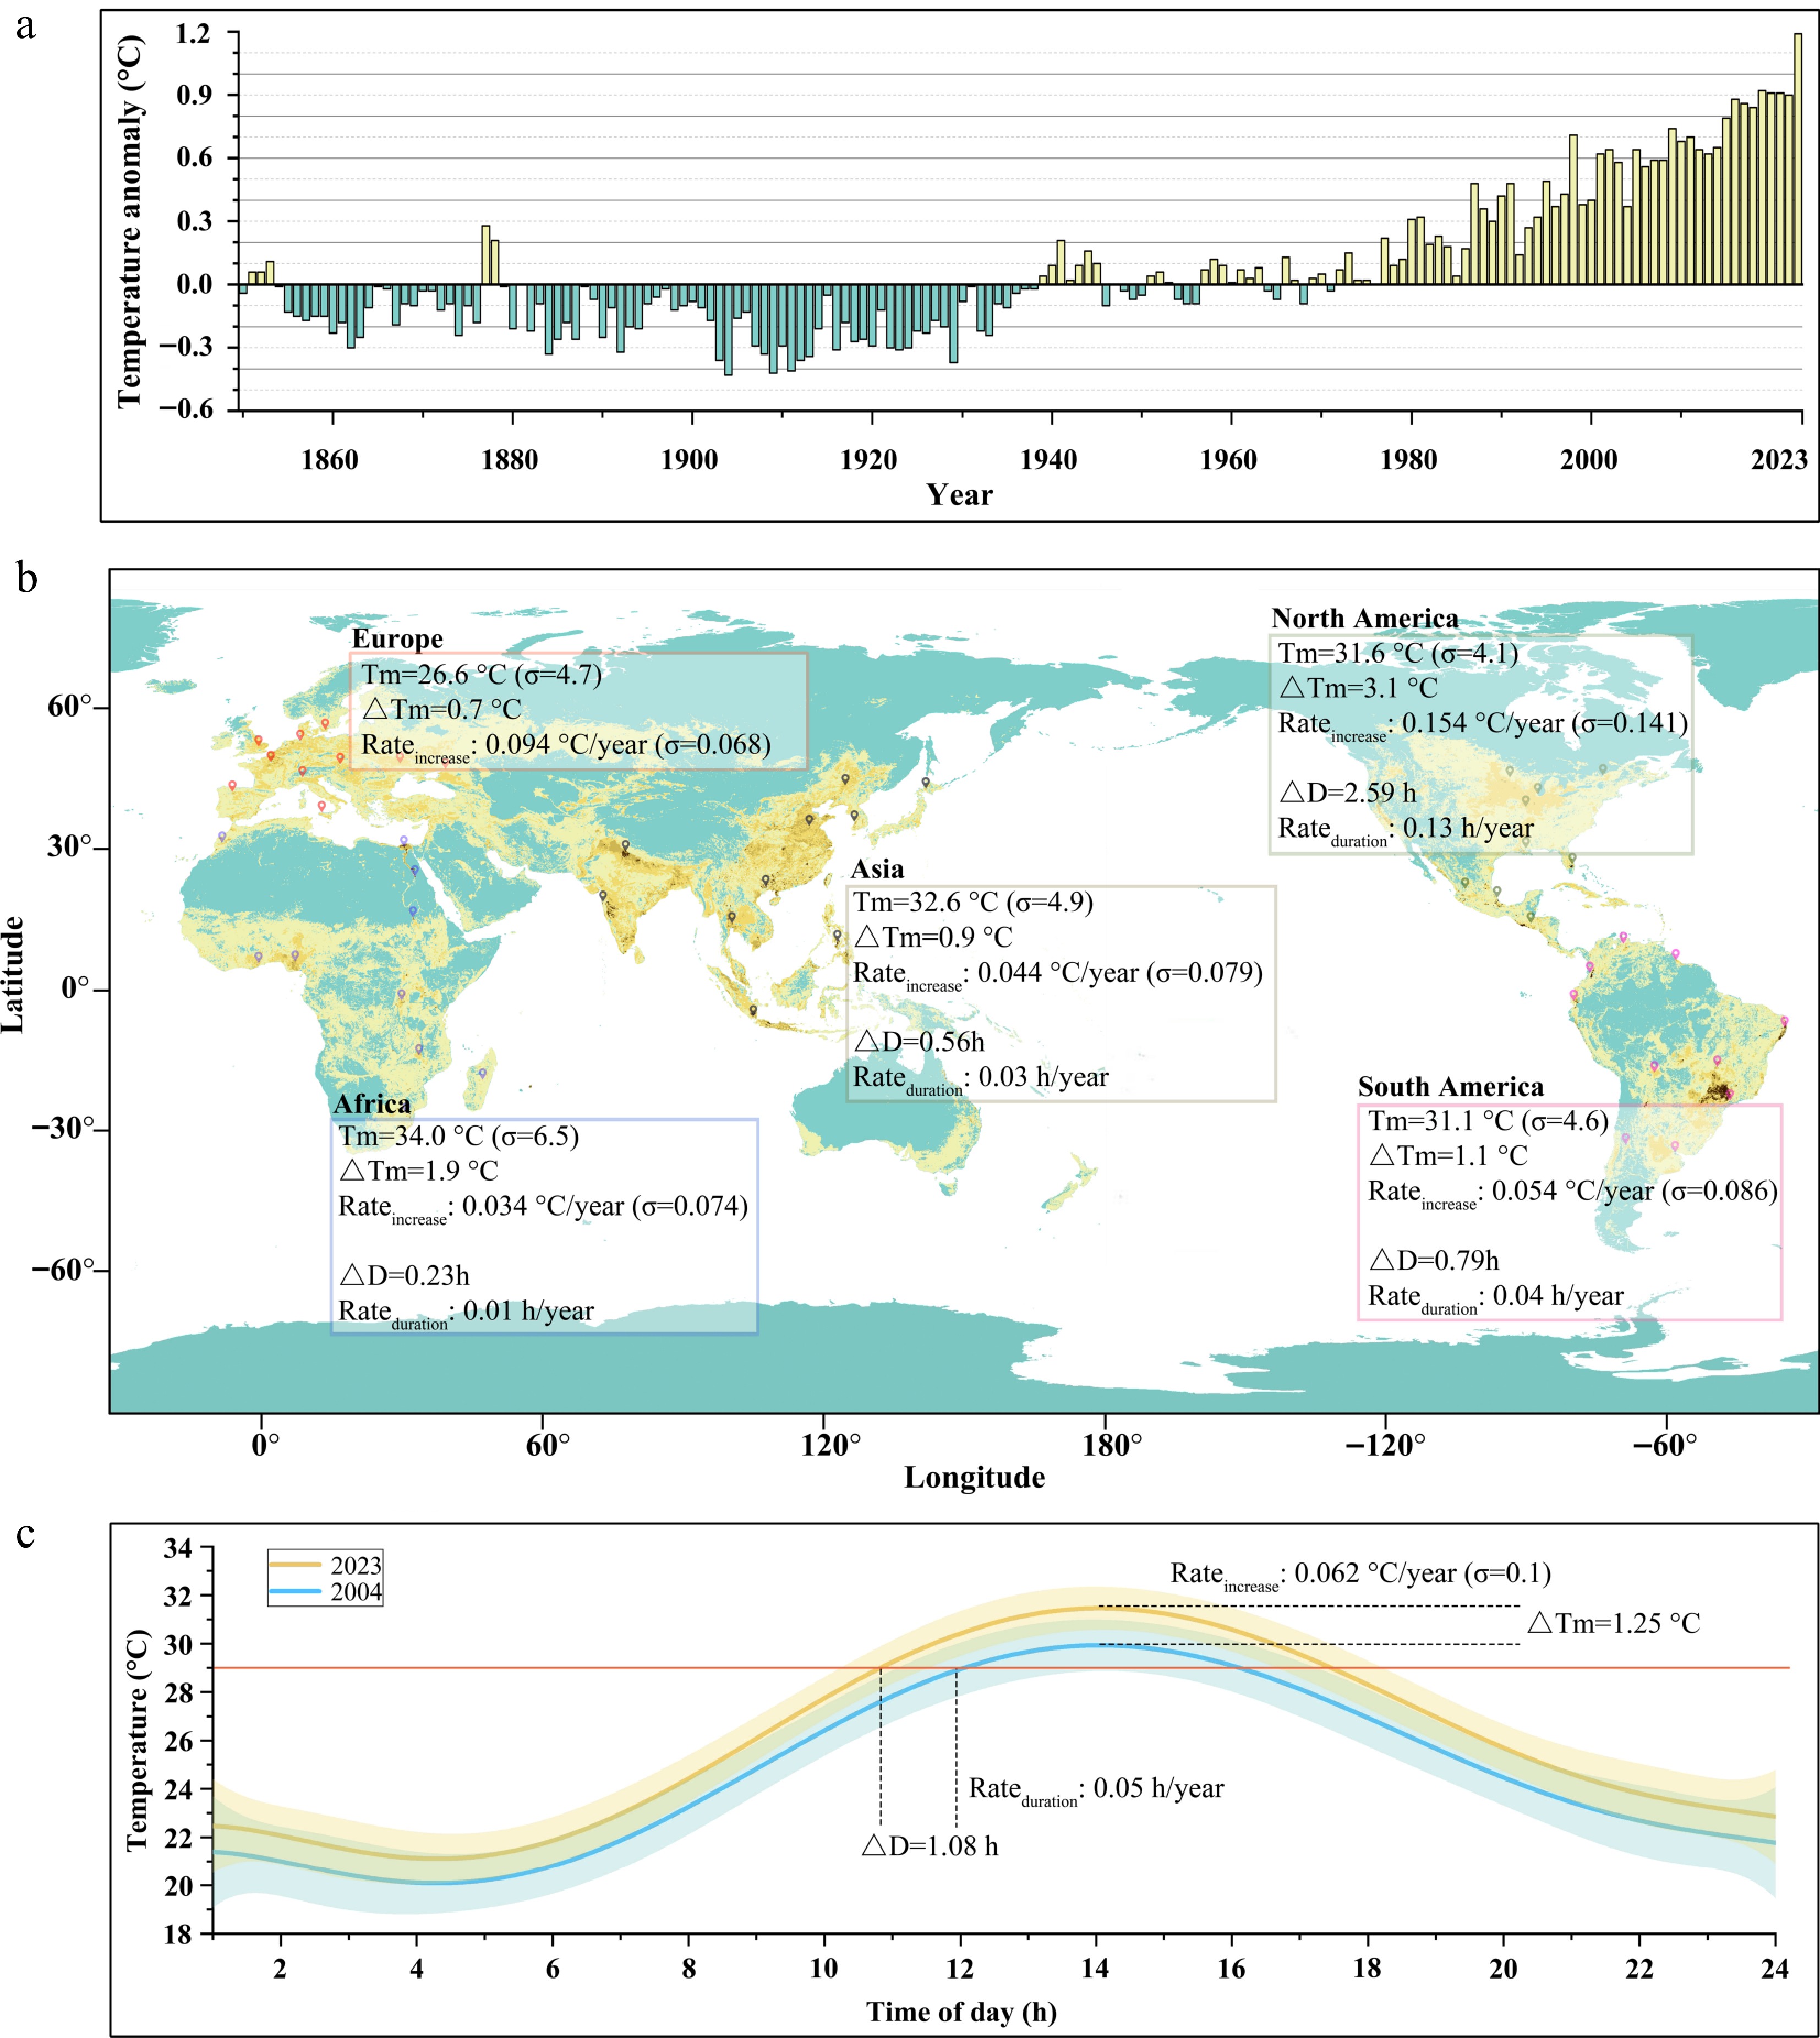
Figure 1.
Global temporal and spatial patterns of changes in temperature. (a) Anomalies of global land annual temperature with respect to the 1901−2000 average, data from NOAA (2024) (
www.ncei.noaa.gov/access/monitoring/monthly-report/global/202313 ). (b) Temperature changes in croplands of Asia, Europe, Africa, North America, and South America from 2004 to 2023. There are 10 sites selected in each continent that are located at the major croplands. Tm refers to the average daily maximum temperature (Tmax) in the hottest months across 10 sites in each region. σ represents the standard deviation of the average maximum temperature of 10 sites. ΔTm indicates the increase in the average Tmax from 2004 to 2023, and Rateincrease represents the rate of annual increase in the average Tmax. ΔD indicates the average extension of midday heat episodes in the hottest months from 2004 to 2023. Due to many crops considered in this study, 29 °C was regarded as critical temperature level examining duration of midday heat episodes[17]. Rateduration indicates the annual extension rate of midday heat episode in the hottest months. Since the average Tmax did not reach 29 °C in Europe, there was neither ΔD nor Rateduration in this continent. Background color in the map represents crop production[39]. (c) Changes of global average Tmax in the hottest months from 2023 to 2004. Data in (b) and (c) are derived from NASA POWER (2024) (https://power.larc.nasa.gov/data-access-viewer/ ). The shading in (c) shows the 95% confidence interval. -
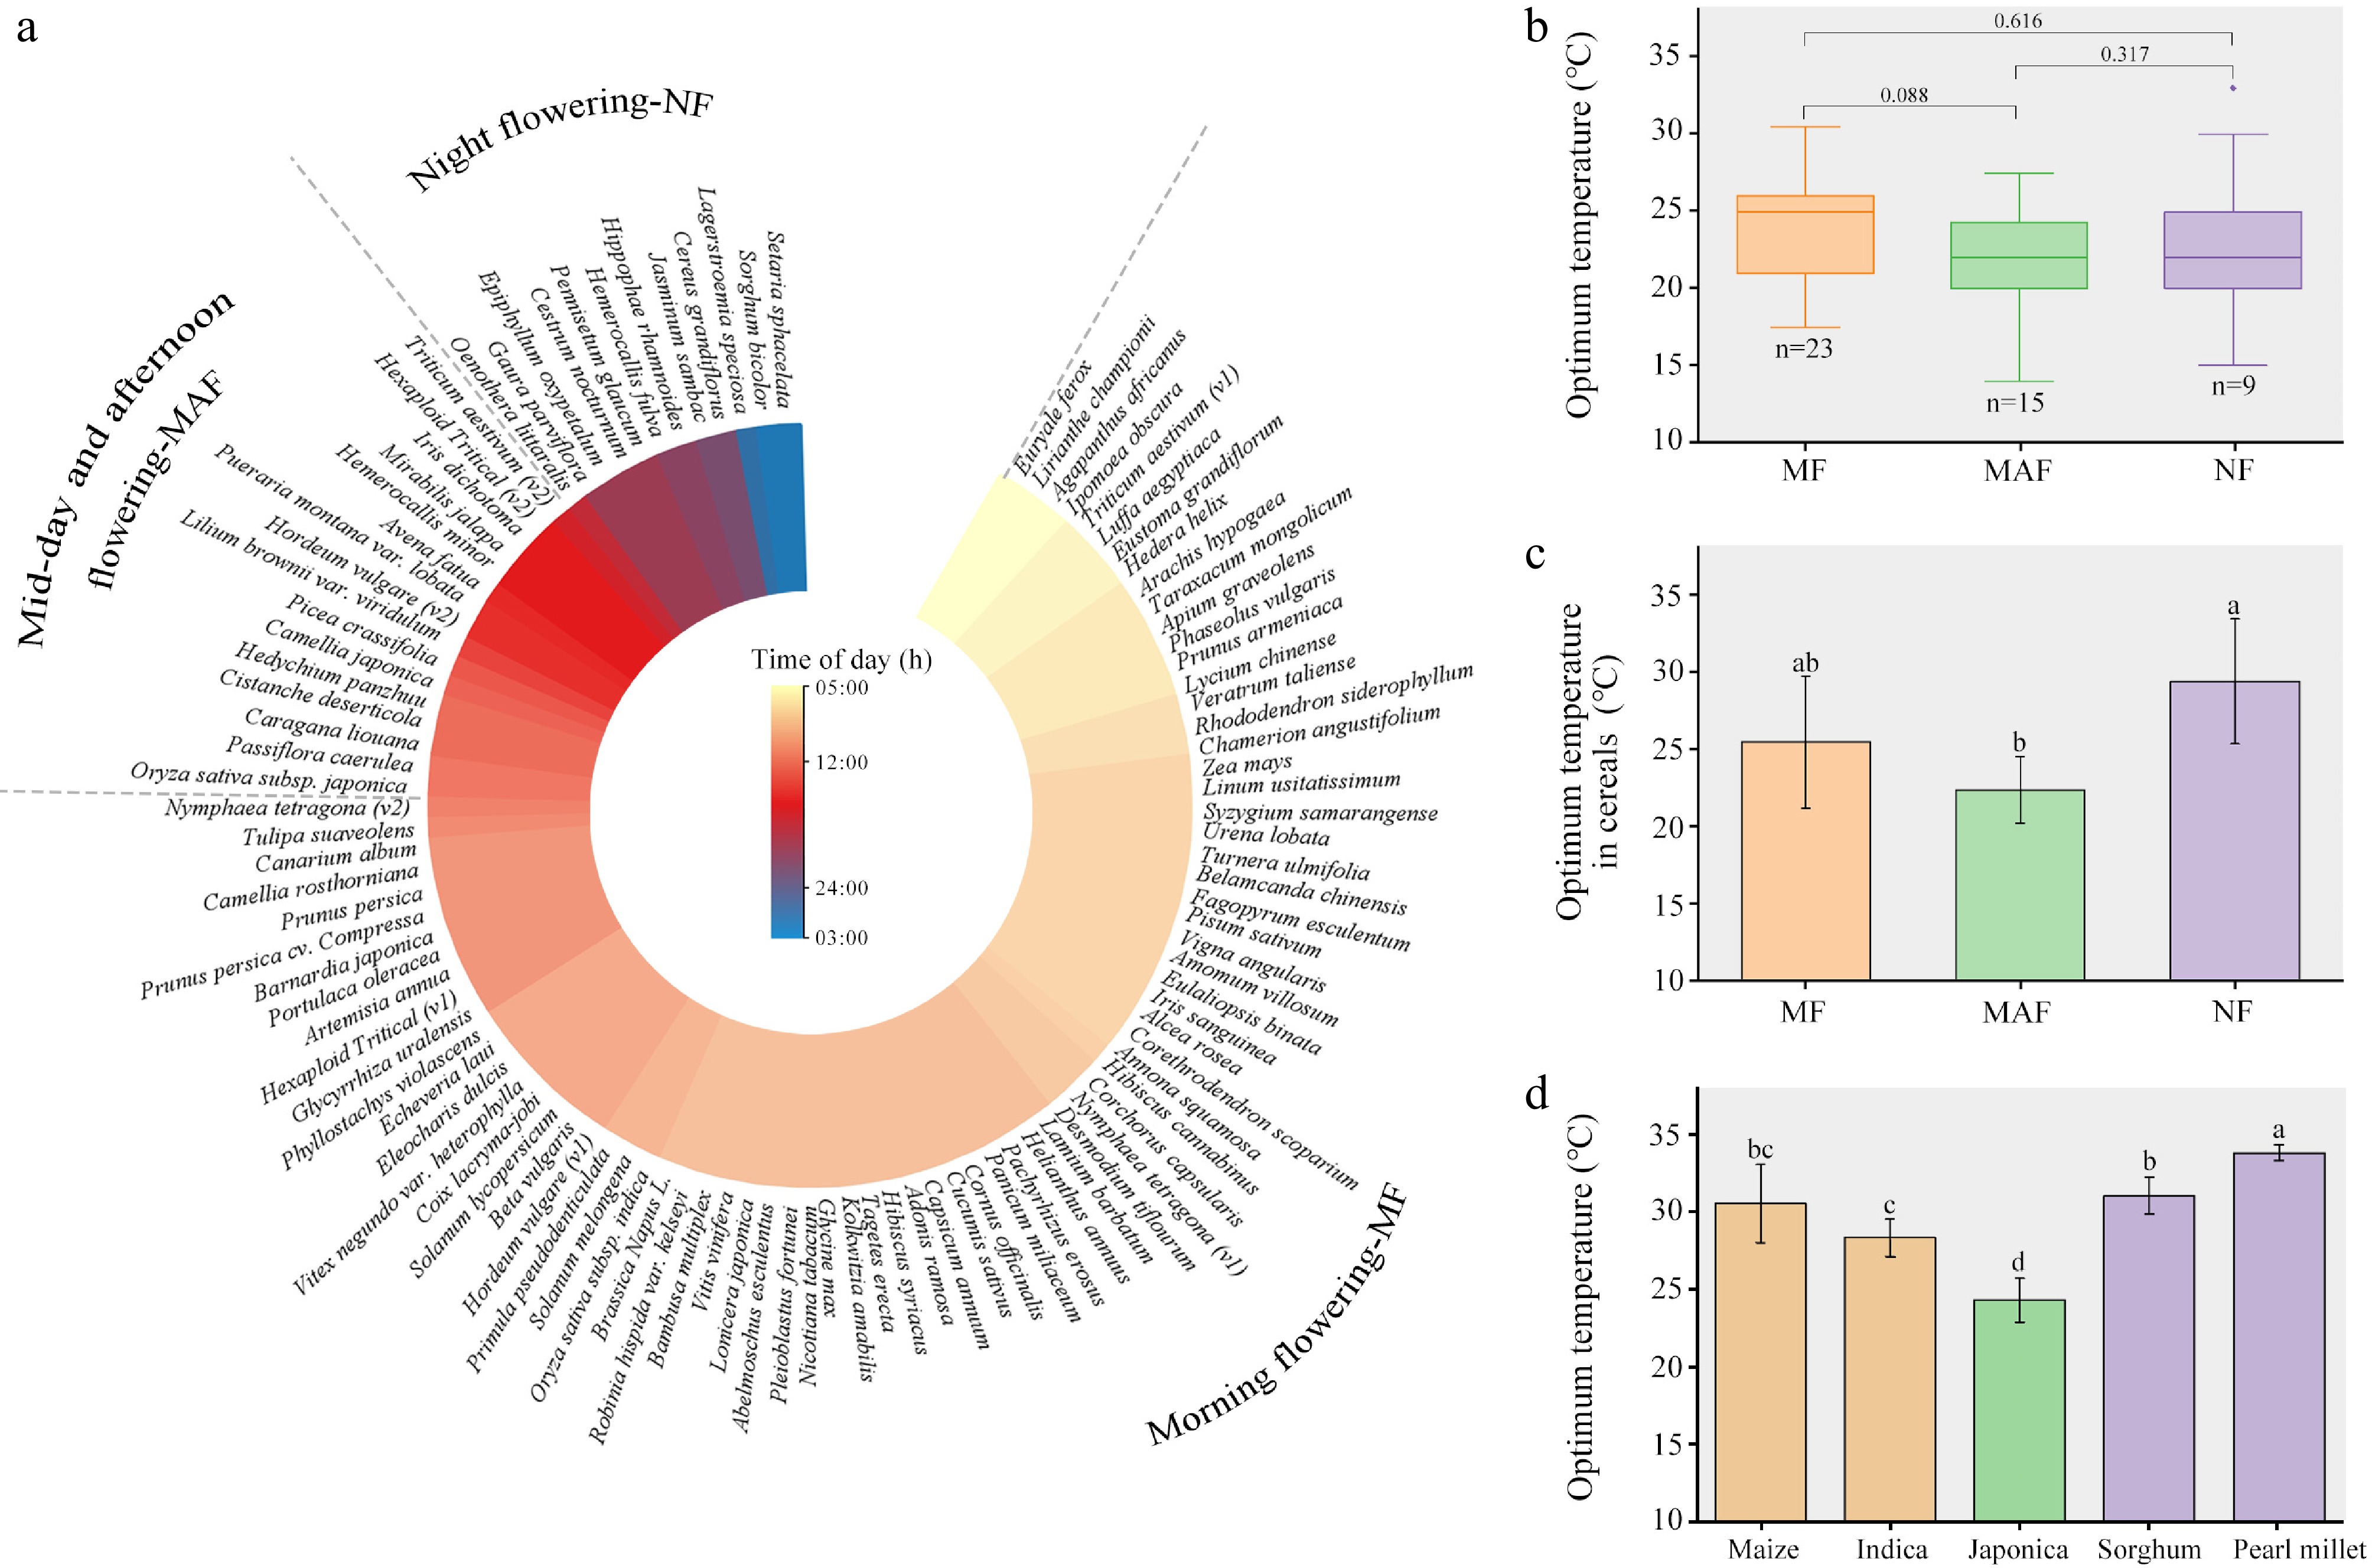
Figure 2.
Diurnal flowering time of plant species and the optimum temperature for flowering. (a) Diurnal floret opening time (DFOT) of 102 plant species. Based on DFOT, these plants are divided into morning flowering (MF, 5:00–11:00), midday and afternoon flowering (MAF, 11:00–17:00), and night flowering (NF, 18:00–3:00). (b) Optimum temperature for floret opening of three groups. The black line in each box represents the mean value. (c) Optimum temperature for floret opening in three groups that only contain cereal plants. (d) Respective optimum temperature for floret opening of maize, indica, japonica, sorghum, and pearl millet. The black line in each box in (b) and (c) represents the mean value. The error bar indicates standard error of the mean. The comparisons in optimum temperature between plant species groups were performed using one-way ANOVA analysis. Details about the diurnal flowering time and optimum temperatures for flowering of plant species are shown in Supplementary Table S1.
-
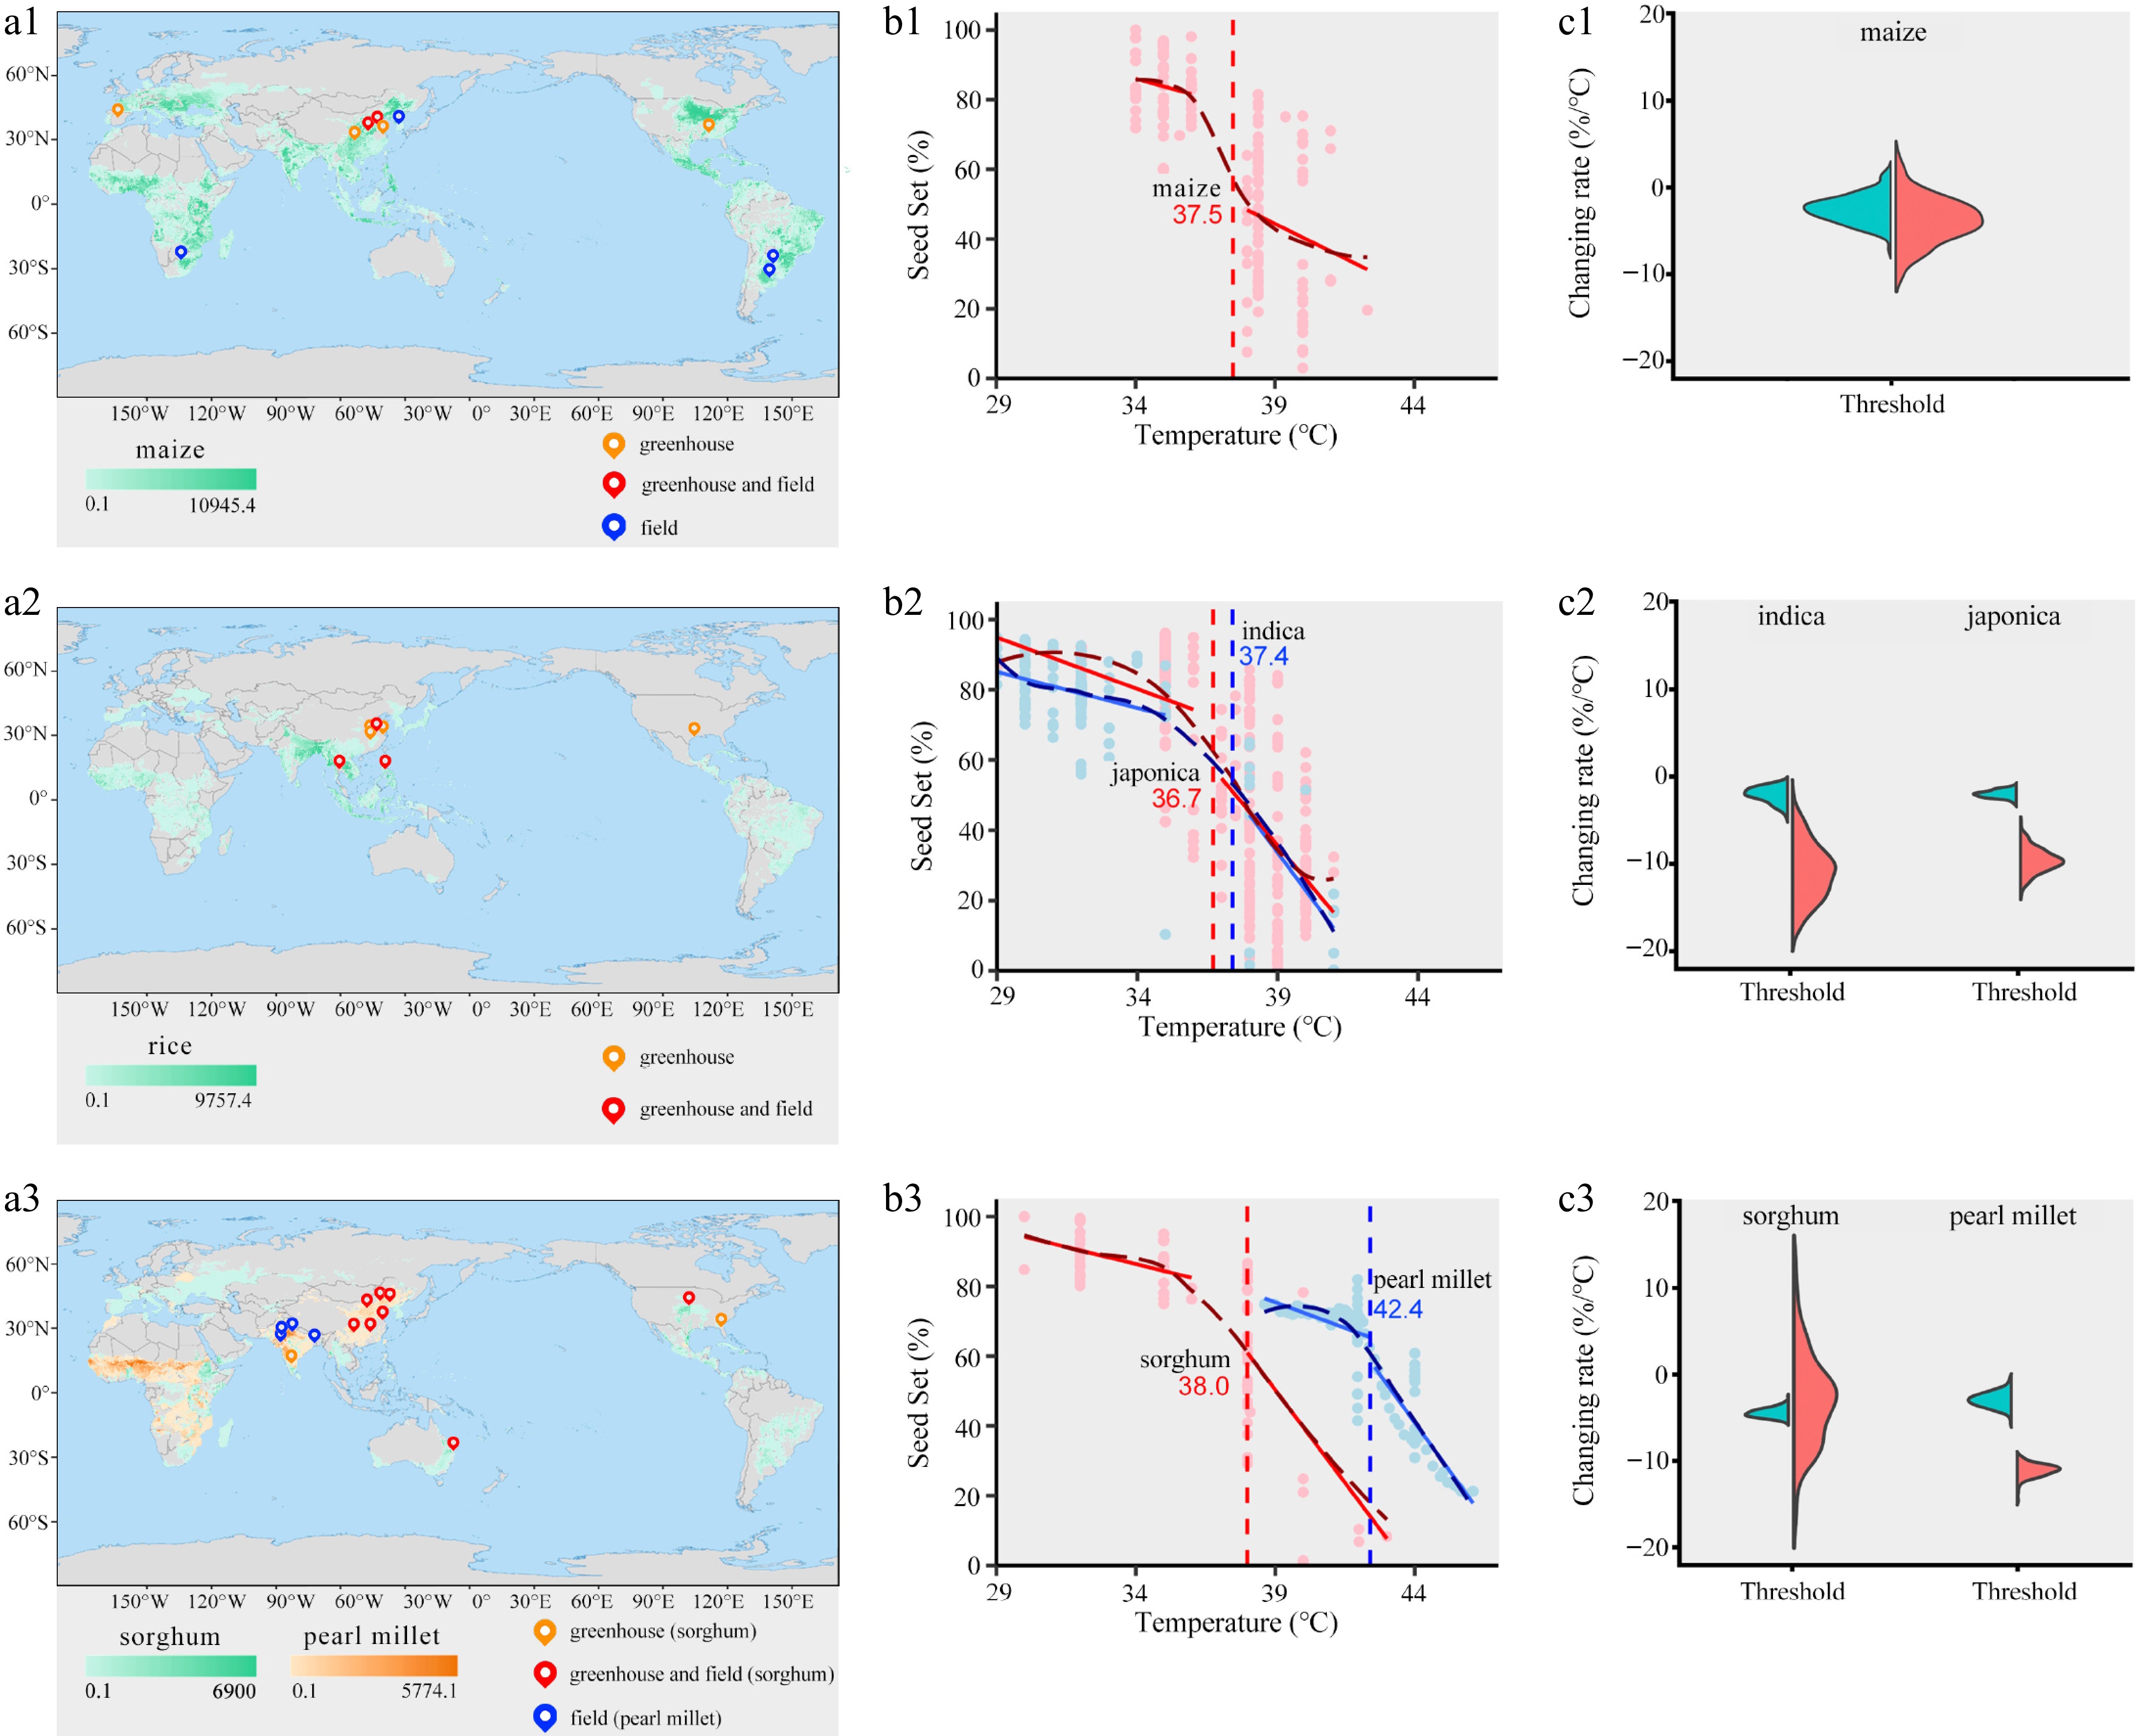
Figure 3.
Fitted high-temperature thresholds for cops. (a1)–(a3) Distribution of temperature-controlled experiments across global croplands in maize, rice, sorghum, and pearl millet, respectively. Background color in the map represents harvest area[39]. The colors of location points in the map represent experimental types (greenhouse, field, or both). (b1)–(b3) Curved dashed lines and solid lines represent the smoothed trend fitted by a generalized additive model and the linear fits, respectively. Inset numbers and the vertical dashed lines both describe the high temperature threshold. (c1)–(c3) Violin diagrams show bootstrapped values of the slope of the two regressions existing each side of each high temperature threshold (blue, before the threshold; red, after the threshold). Experimental data that are collected from peer-reviewed articles are shown in Supplementary Table S2. Details about model comparisons are shown in Supplementary Table S3.
-
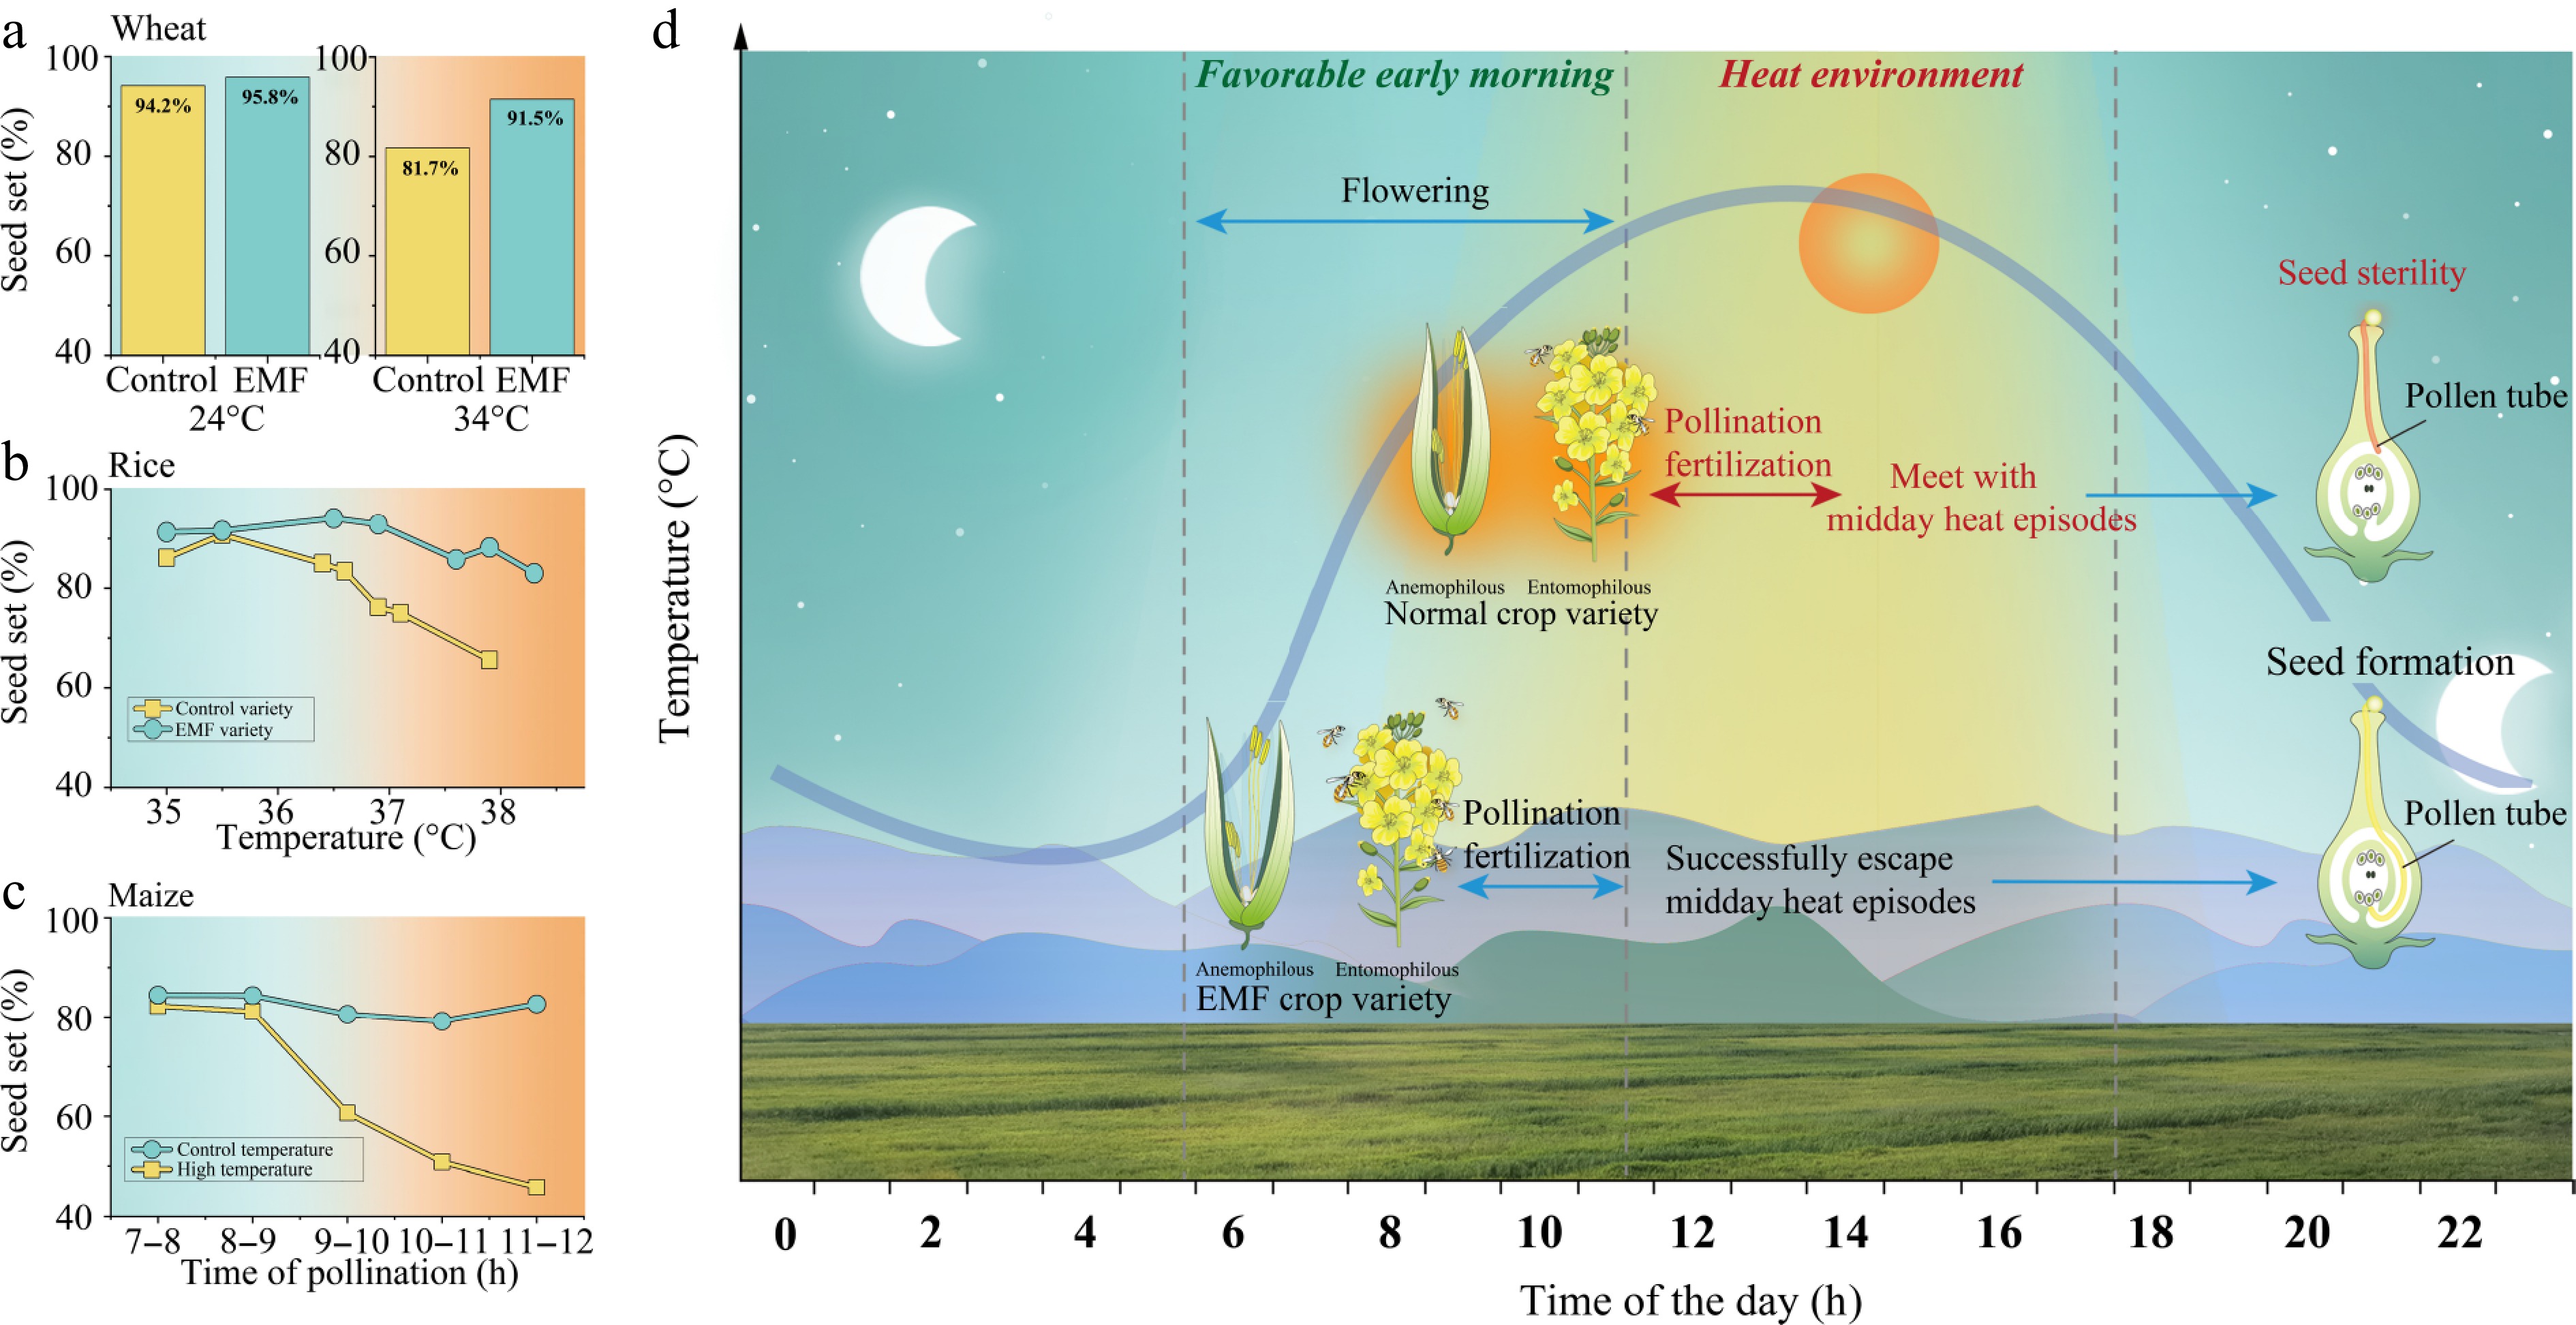
Figure 4.
Heat escape of early-morning flowering (EMF) crops. (a) Seed set ratio of EMF and control varieties in wheat under 24 and 34 °C during flowering. (b) Seed set ratio of EMF and control varieties in rice under different temperature levels. (c) Seed set ratio as effect of pollination time that ranges from 7:00–8:00 to 11:00–12:00 in one-hour interval under control (30/20 °C; daily maximum temperature/daily minimum temperature) and high temperature (40/30 °C). (d) Illustration of heat resistance of EMF crops to high temperature. Experimental data that are collected from previous reports[18–20] and detailed data are shown in Supplementary Tables S4 and S5.
-
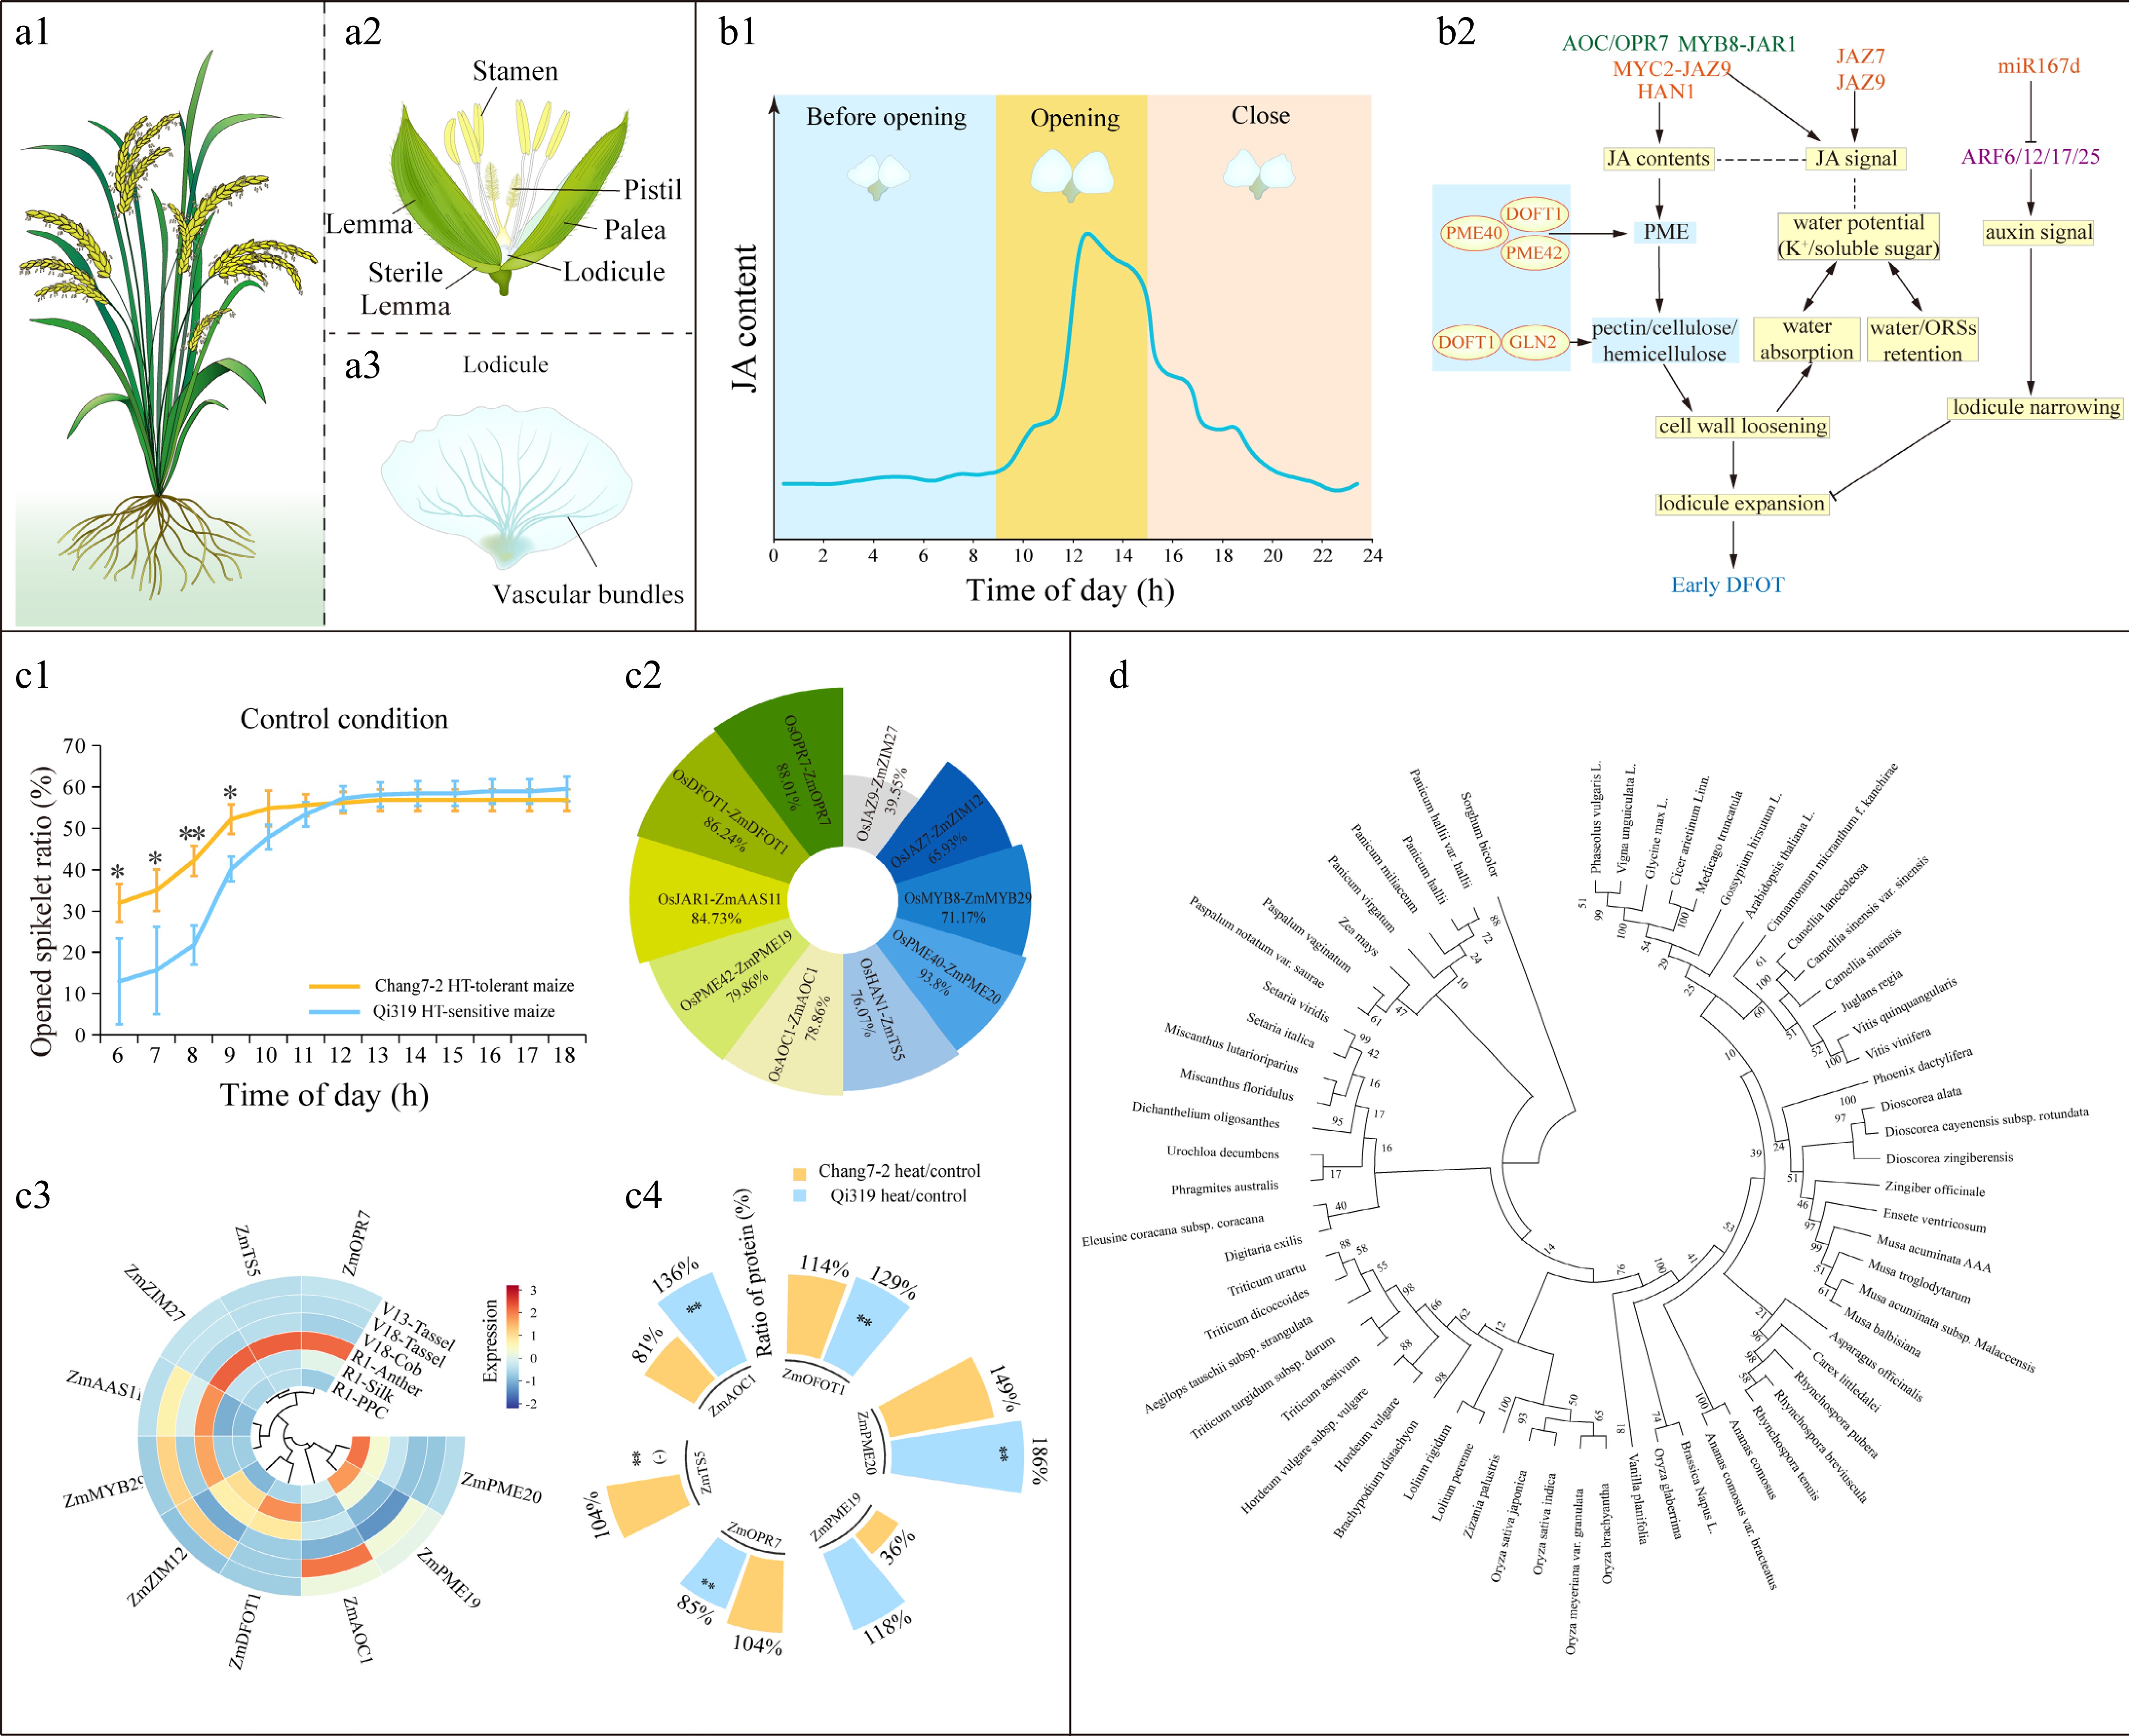
Figure 5.
Molecular mechanisms of diurnal floret opening time (DFOT) in cereal crops. (a1)–(a3) Illustration of flowering plant, spikelet, and lodicules of rice. (b1), (b2) Jasmonic acid (JA) contents in a flowering day and mechanism of JAs for early DFOT in rice[25]. The blue and yellow colors indicate a suppression (decrease) and enhance (increase), respectively, in protein interaction, enzyme activity, and metabolite accumulation. Triangle arrow and t-arrow indicate positive and negative effects. Solid and dashed lines indicate the confirmed and putative interactions. Genes marked with orange and purple mean positive and negative roles in early DFOT. ORSs, osmotic regulation substances. (c) DFOT in maize in response to high-temperature stress. (c1) Ratio of opened spikelet in heat-tolerant inbred lines Chang7-2 and heat-sensitive inbred line Qi319 under high-temperature stress (40/30 °C) during flowering. (c2) Similarities of homologs involved in DFOT between rice and maize. (c3) Gene expression levels of potential DFOT genes in maize. The transcript levels are obtained from Gu[31], and normalized by Z-score for analysis. PPC, pre-pollination cob. (c4) Ratio of protein abundance in Chang7-2 and Qi319 under heat stress compared with relative controls. Raw data are obtained from Liu et al.[21]. The ratio of protein abundance in the comparison heat versus control is calculated (* p < 0.05 and ** p < 0.01). (-) means '0' of the ratio. The ratio greater than 100% means increased in the comparison; otherwise, it is decreased. (d) A phylogenetic tree of OsDFOT1 and its homologs in other plant species. OsDFOT1 mediates diurnal floret opening time in rice[11], and the amino acids of OsDFOT1 were used for BLAST (
https://blast.ncbi.nlm.nih.gov/Blast.cgi ). The phylogenetic tree was constructed according to the amino acid sequences of OsDFOT1 and its homologs. Details about BLAST results and homolog accessions are shown in Supplementary Table S6.
Figures
(5)
Tables
(0)