-
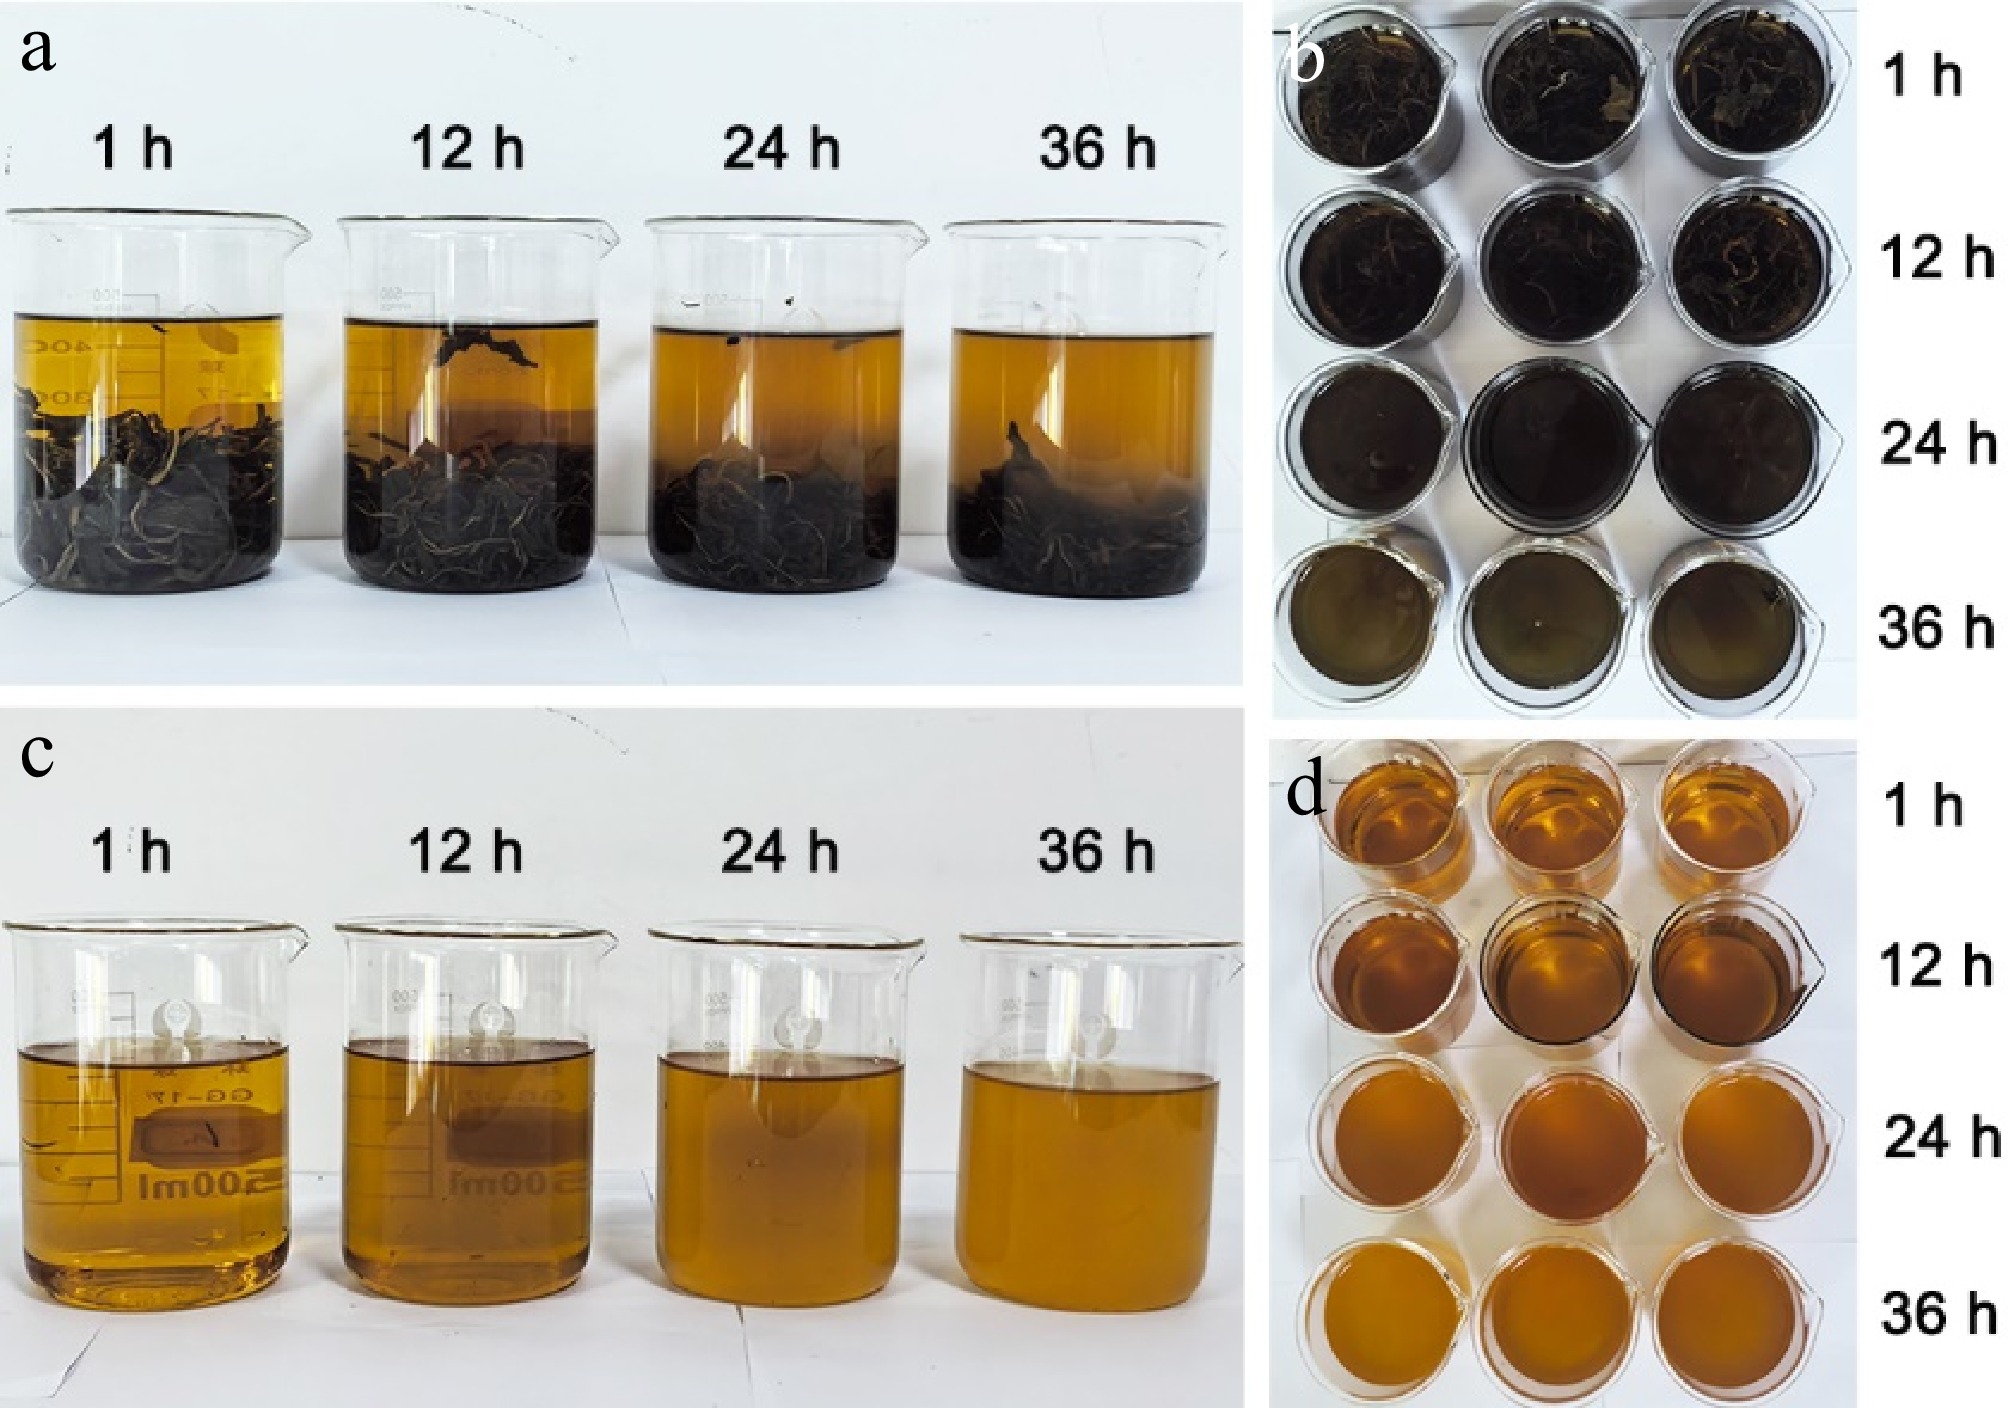
Figure 1.
Comparison of tea infusion colors and sampling at different brewing times. (a), (b) Tea infusions after brewing for 1, 12, 24, and 36 h. (c) Comparison of tea infusion colors after brewing for 1, 12, 24, and 36 h. (d) Sampling of tea infusions after brewing for 1, 12, 24, and 36 h for metabolomic analysis.
-
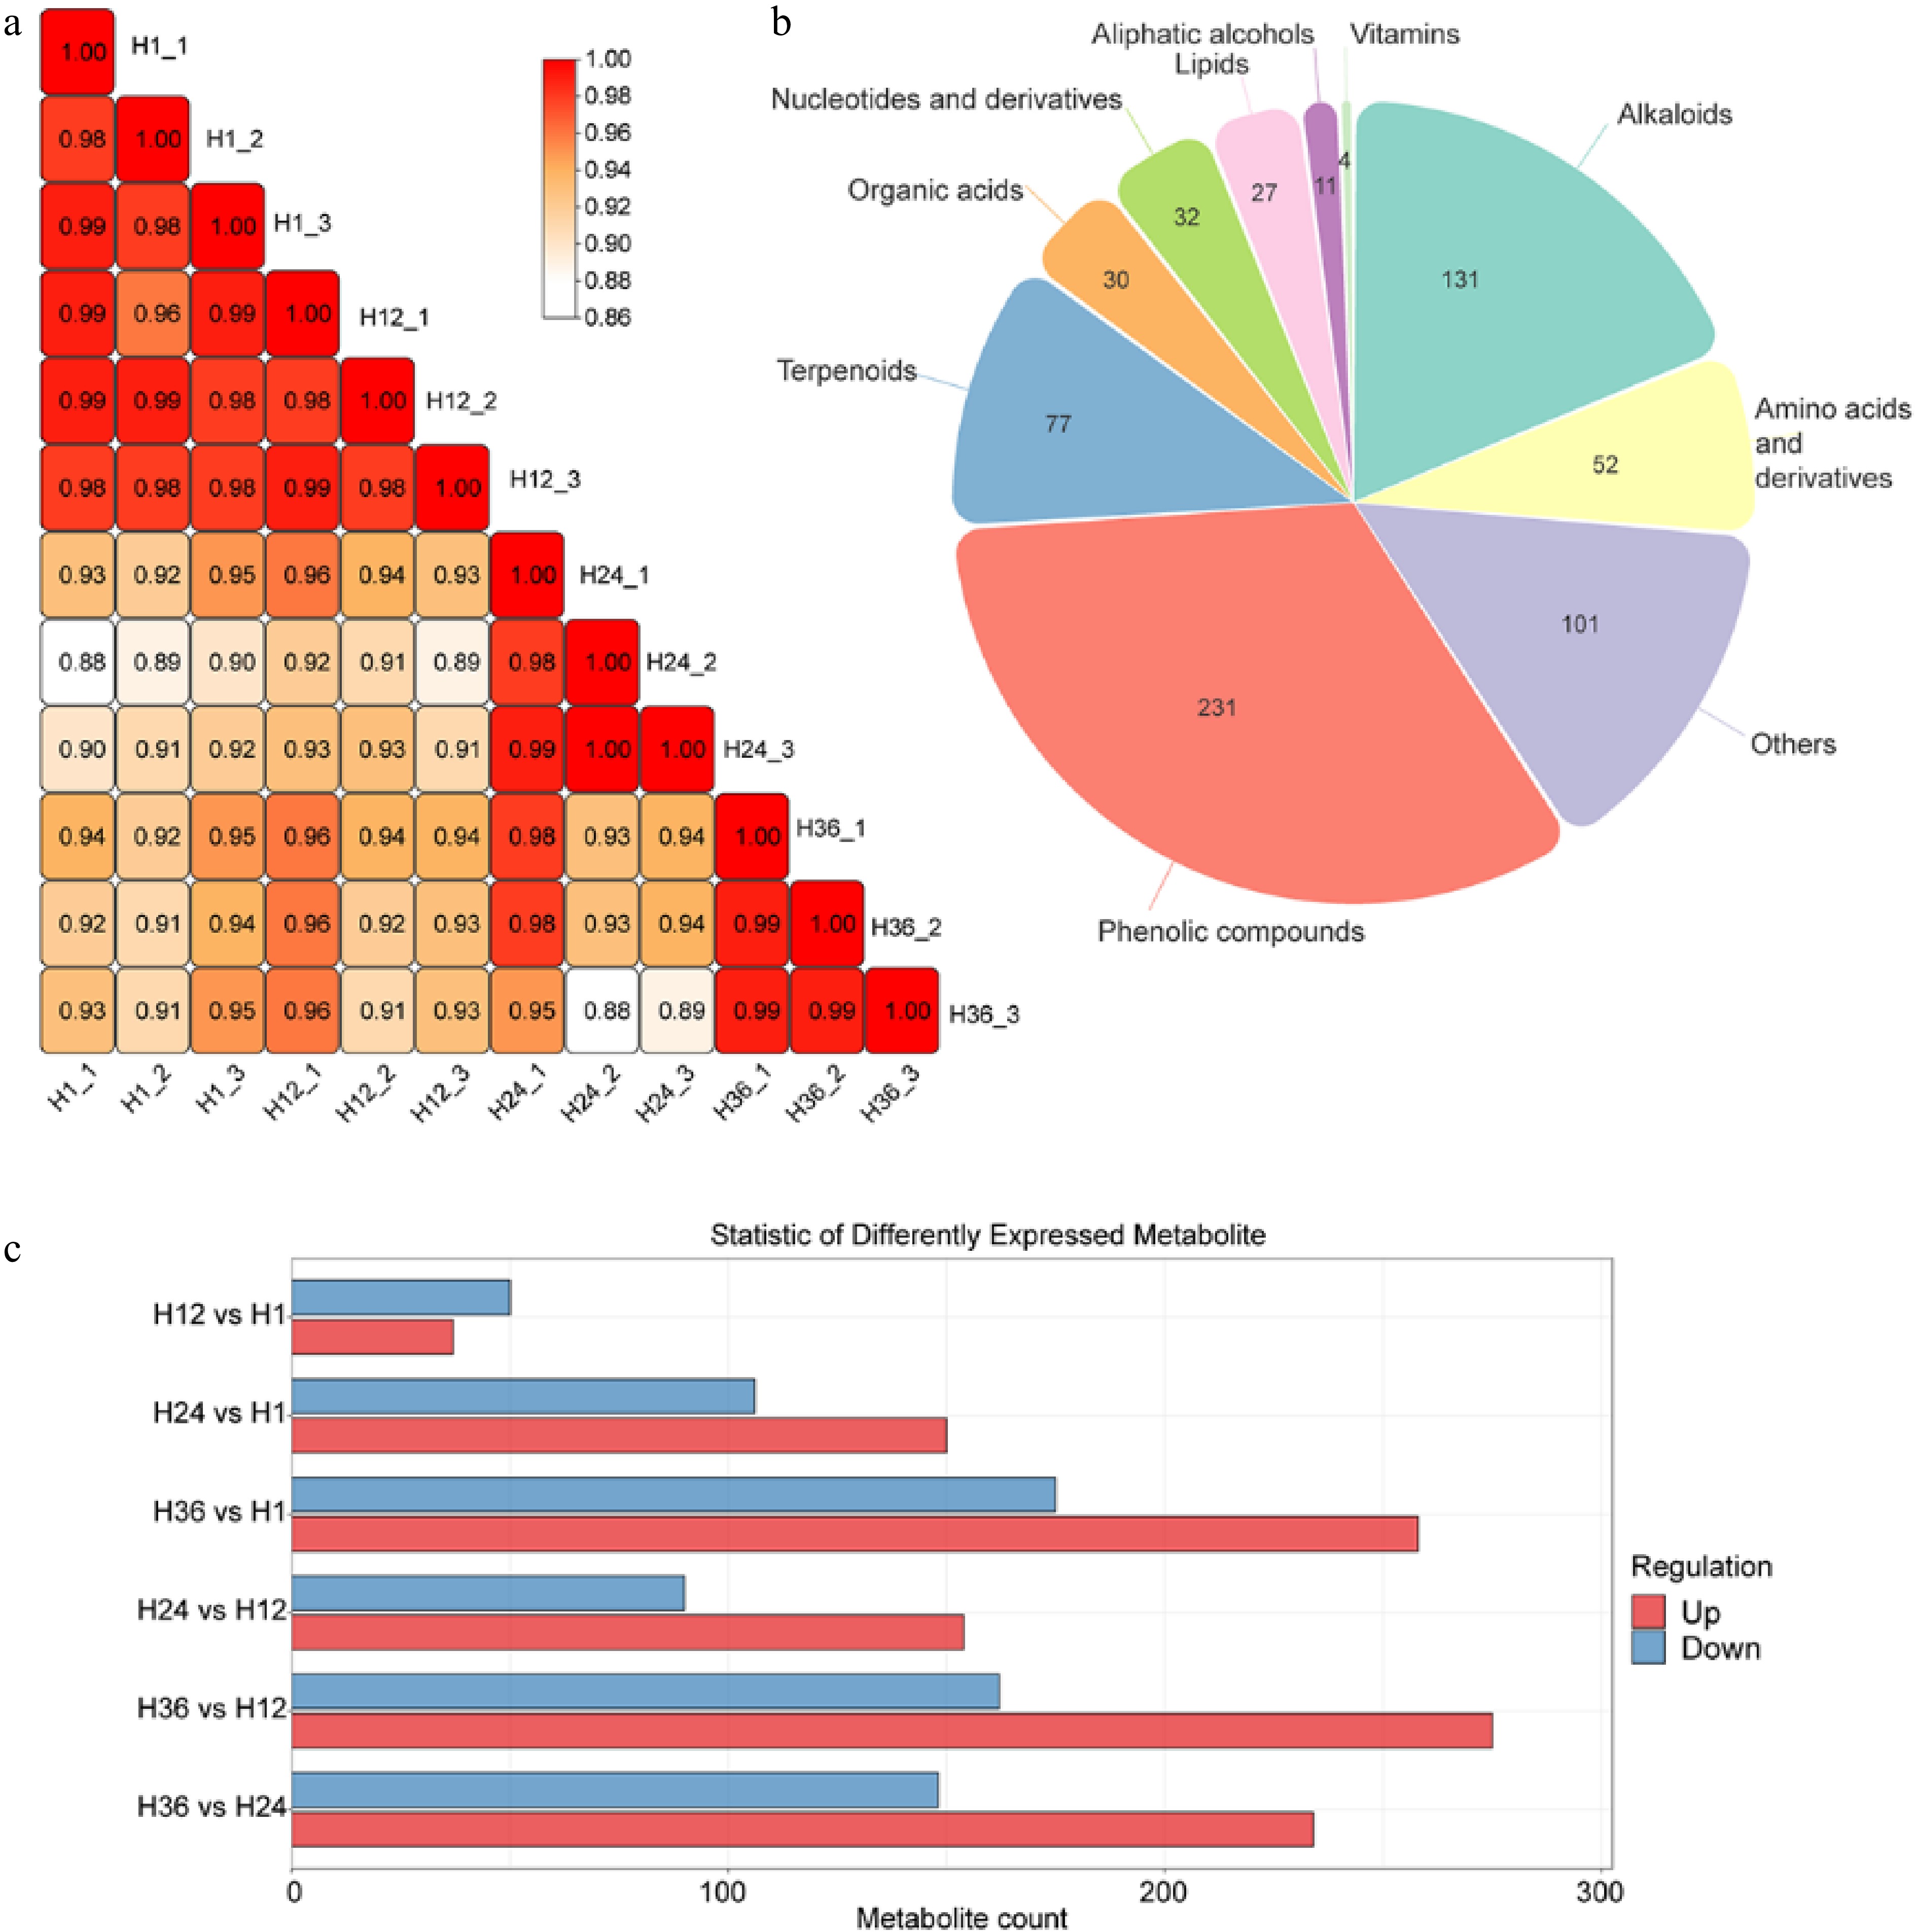
Figure 2.
Metabolomic profiling and comparative analysis of dandelion tea samples across steeping durations. (a) Pearson correlation matrix showing high within-group reproducibility and increasing divergence across groups with longer steeping times. (b) Pie chart representing the classification and number of identified metabolites. (c) Bar graph showing the number of differentially expressed metabolites (DEMs) between sample groups. Red and blue bars represent upregulated and downregulated metabolites, respectively.
-
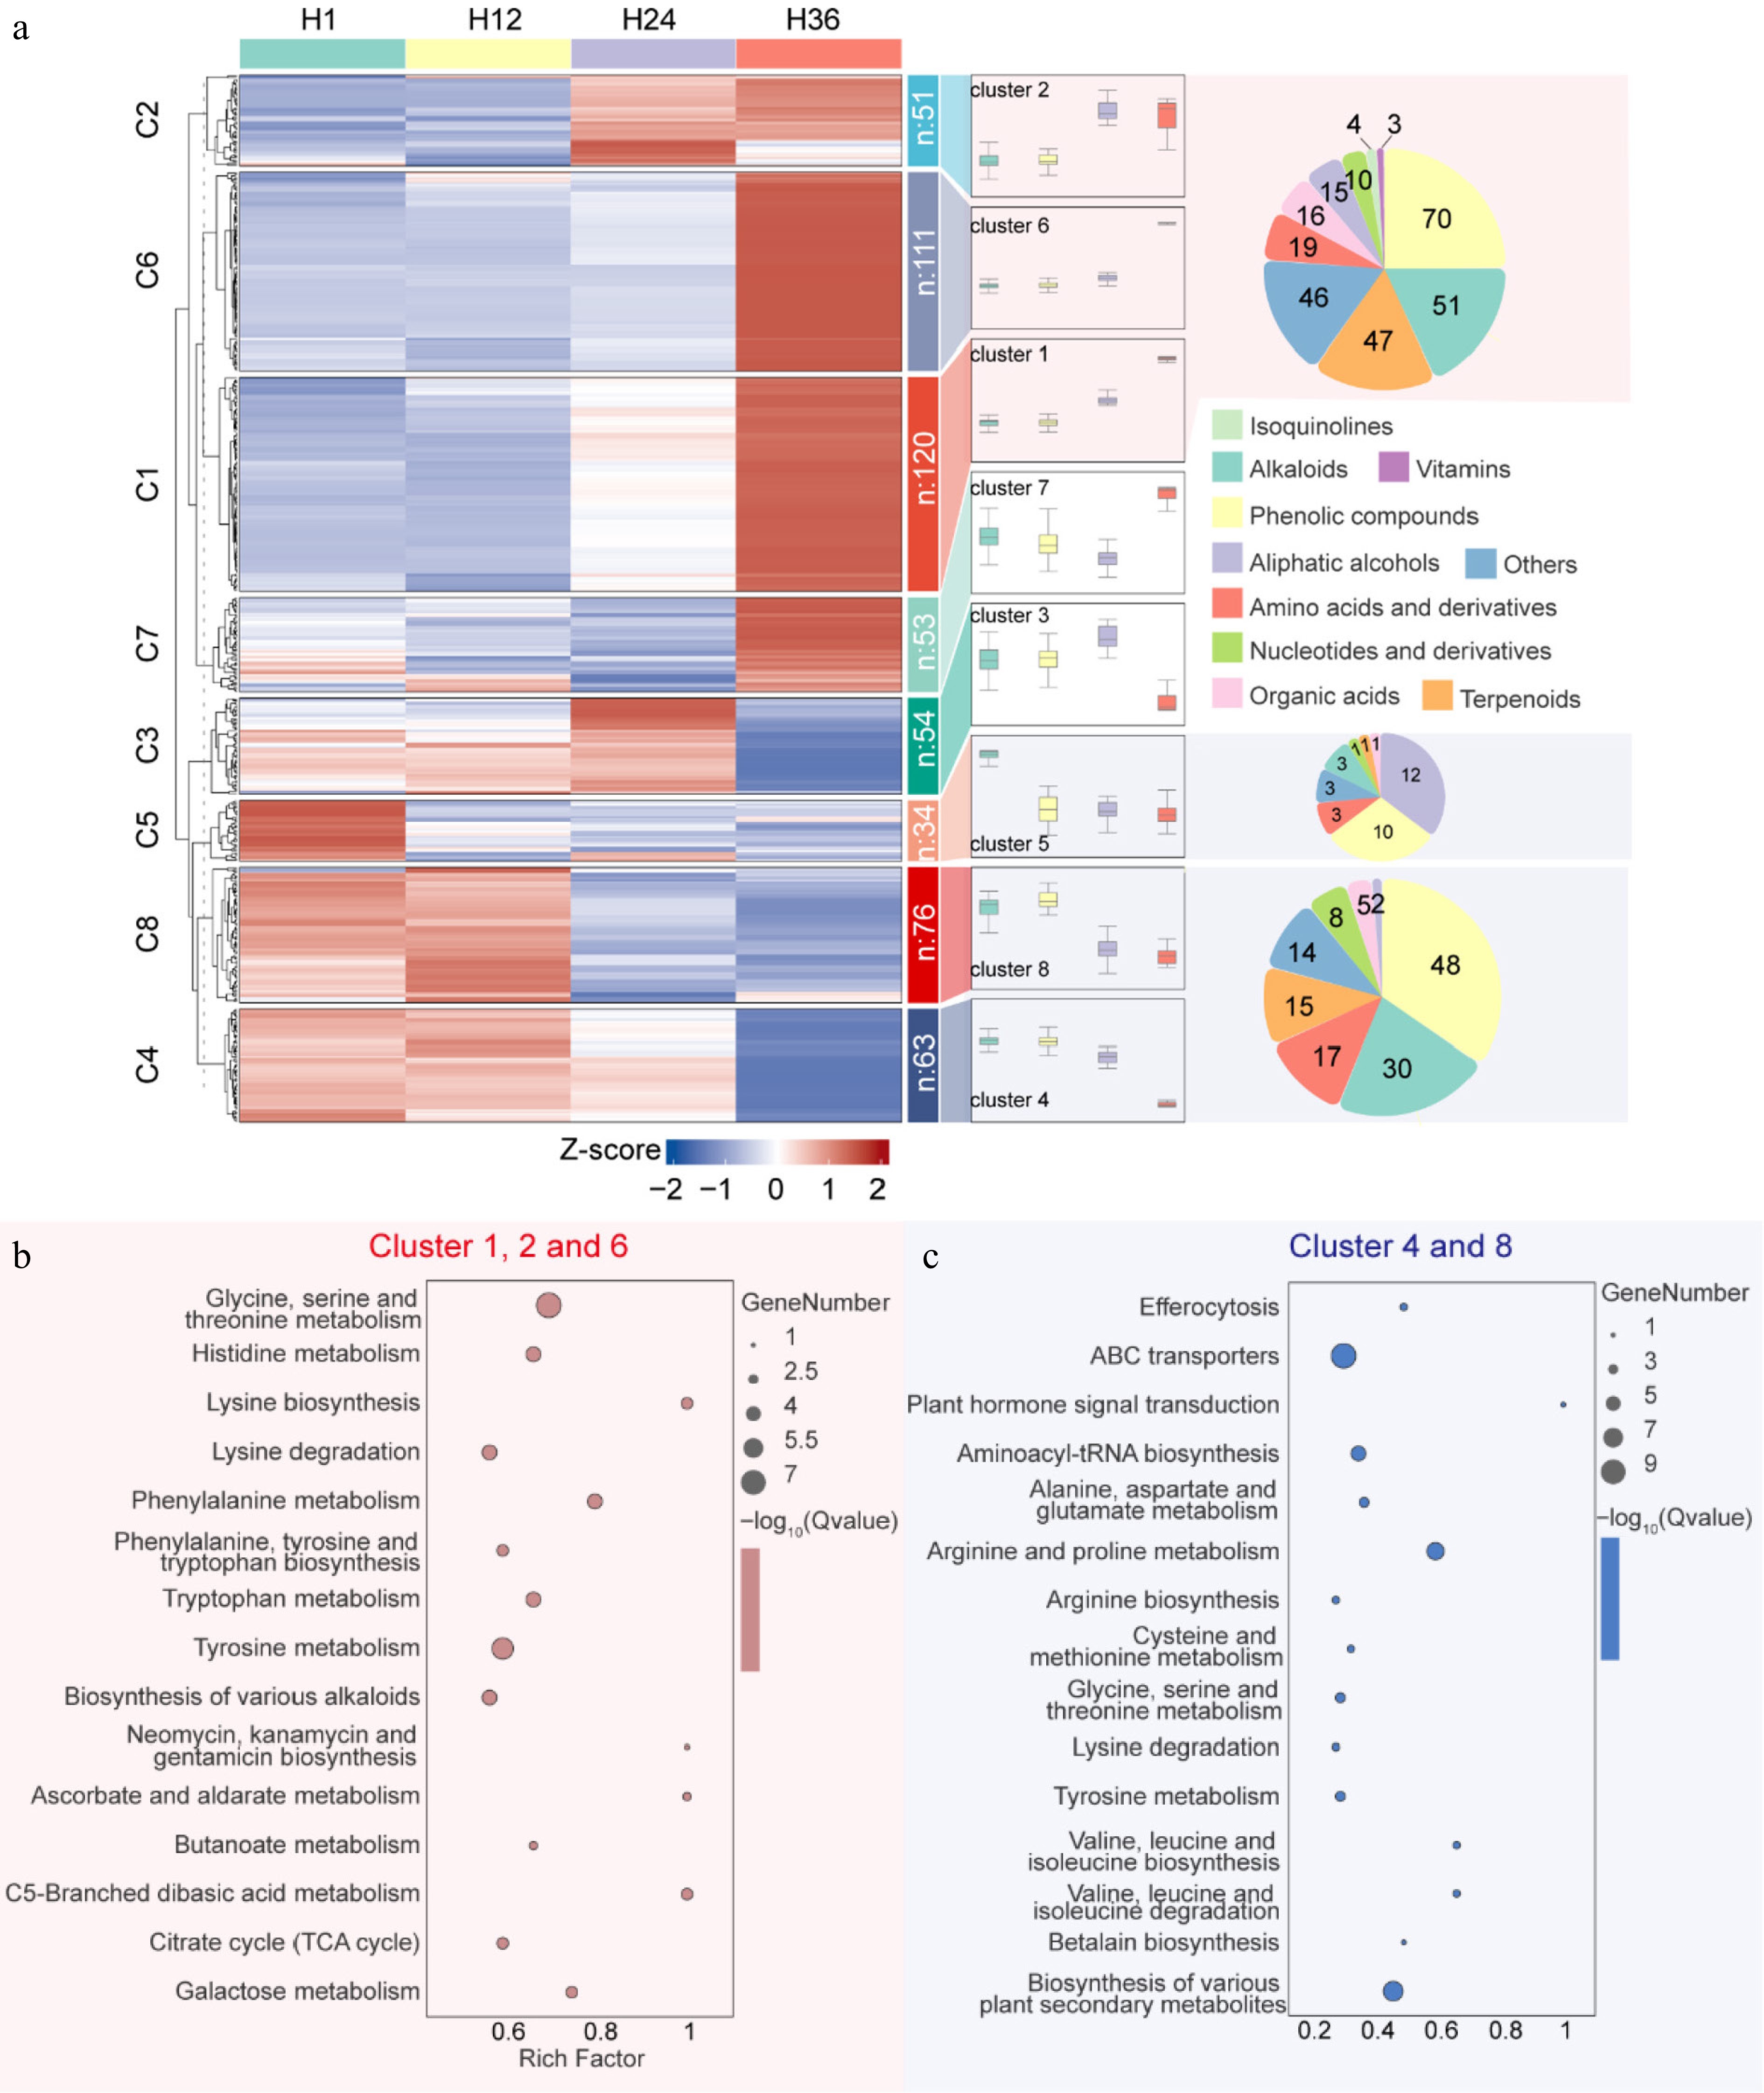
Figure 3.
Trend clustering and KEGG pathway enrichment of differentially expressed metabolites in dandelion tea across steeping durations. (a) Mfuzz time-series clustering of 696 metabolites across four steeping durations (H1, H12, H24, H36), grouped into eight dynamic expression clusters. Boxplots to the right show expression trends per cluster, while pie charts illustrate metabolite class composition. (b) KEGG pathway enrichment of upregulated metabolites in Clusters 1, 2, and 6. (c) KEGG enrichment of downregulated metabolites in Clusters 4 and 8.
-
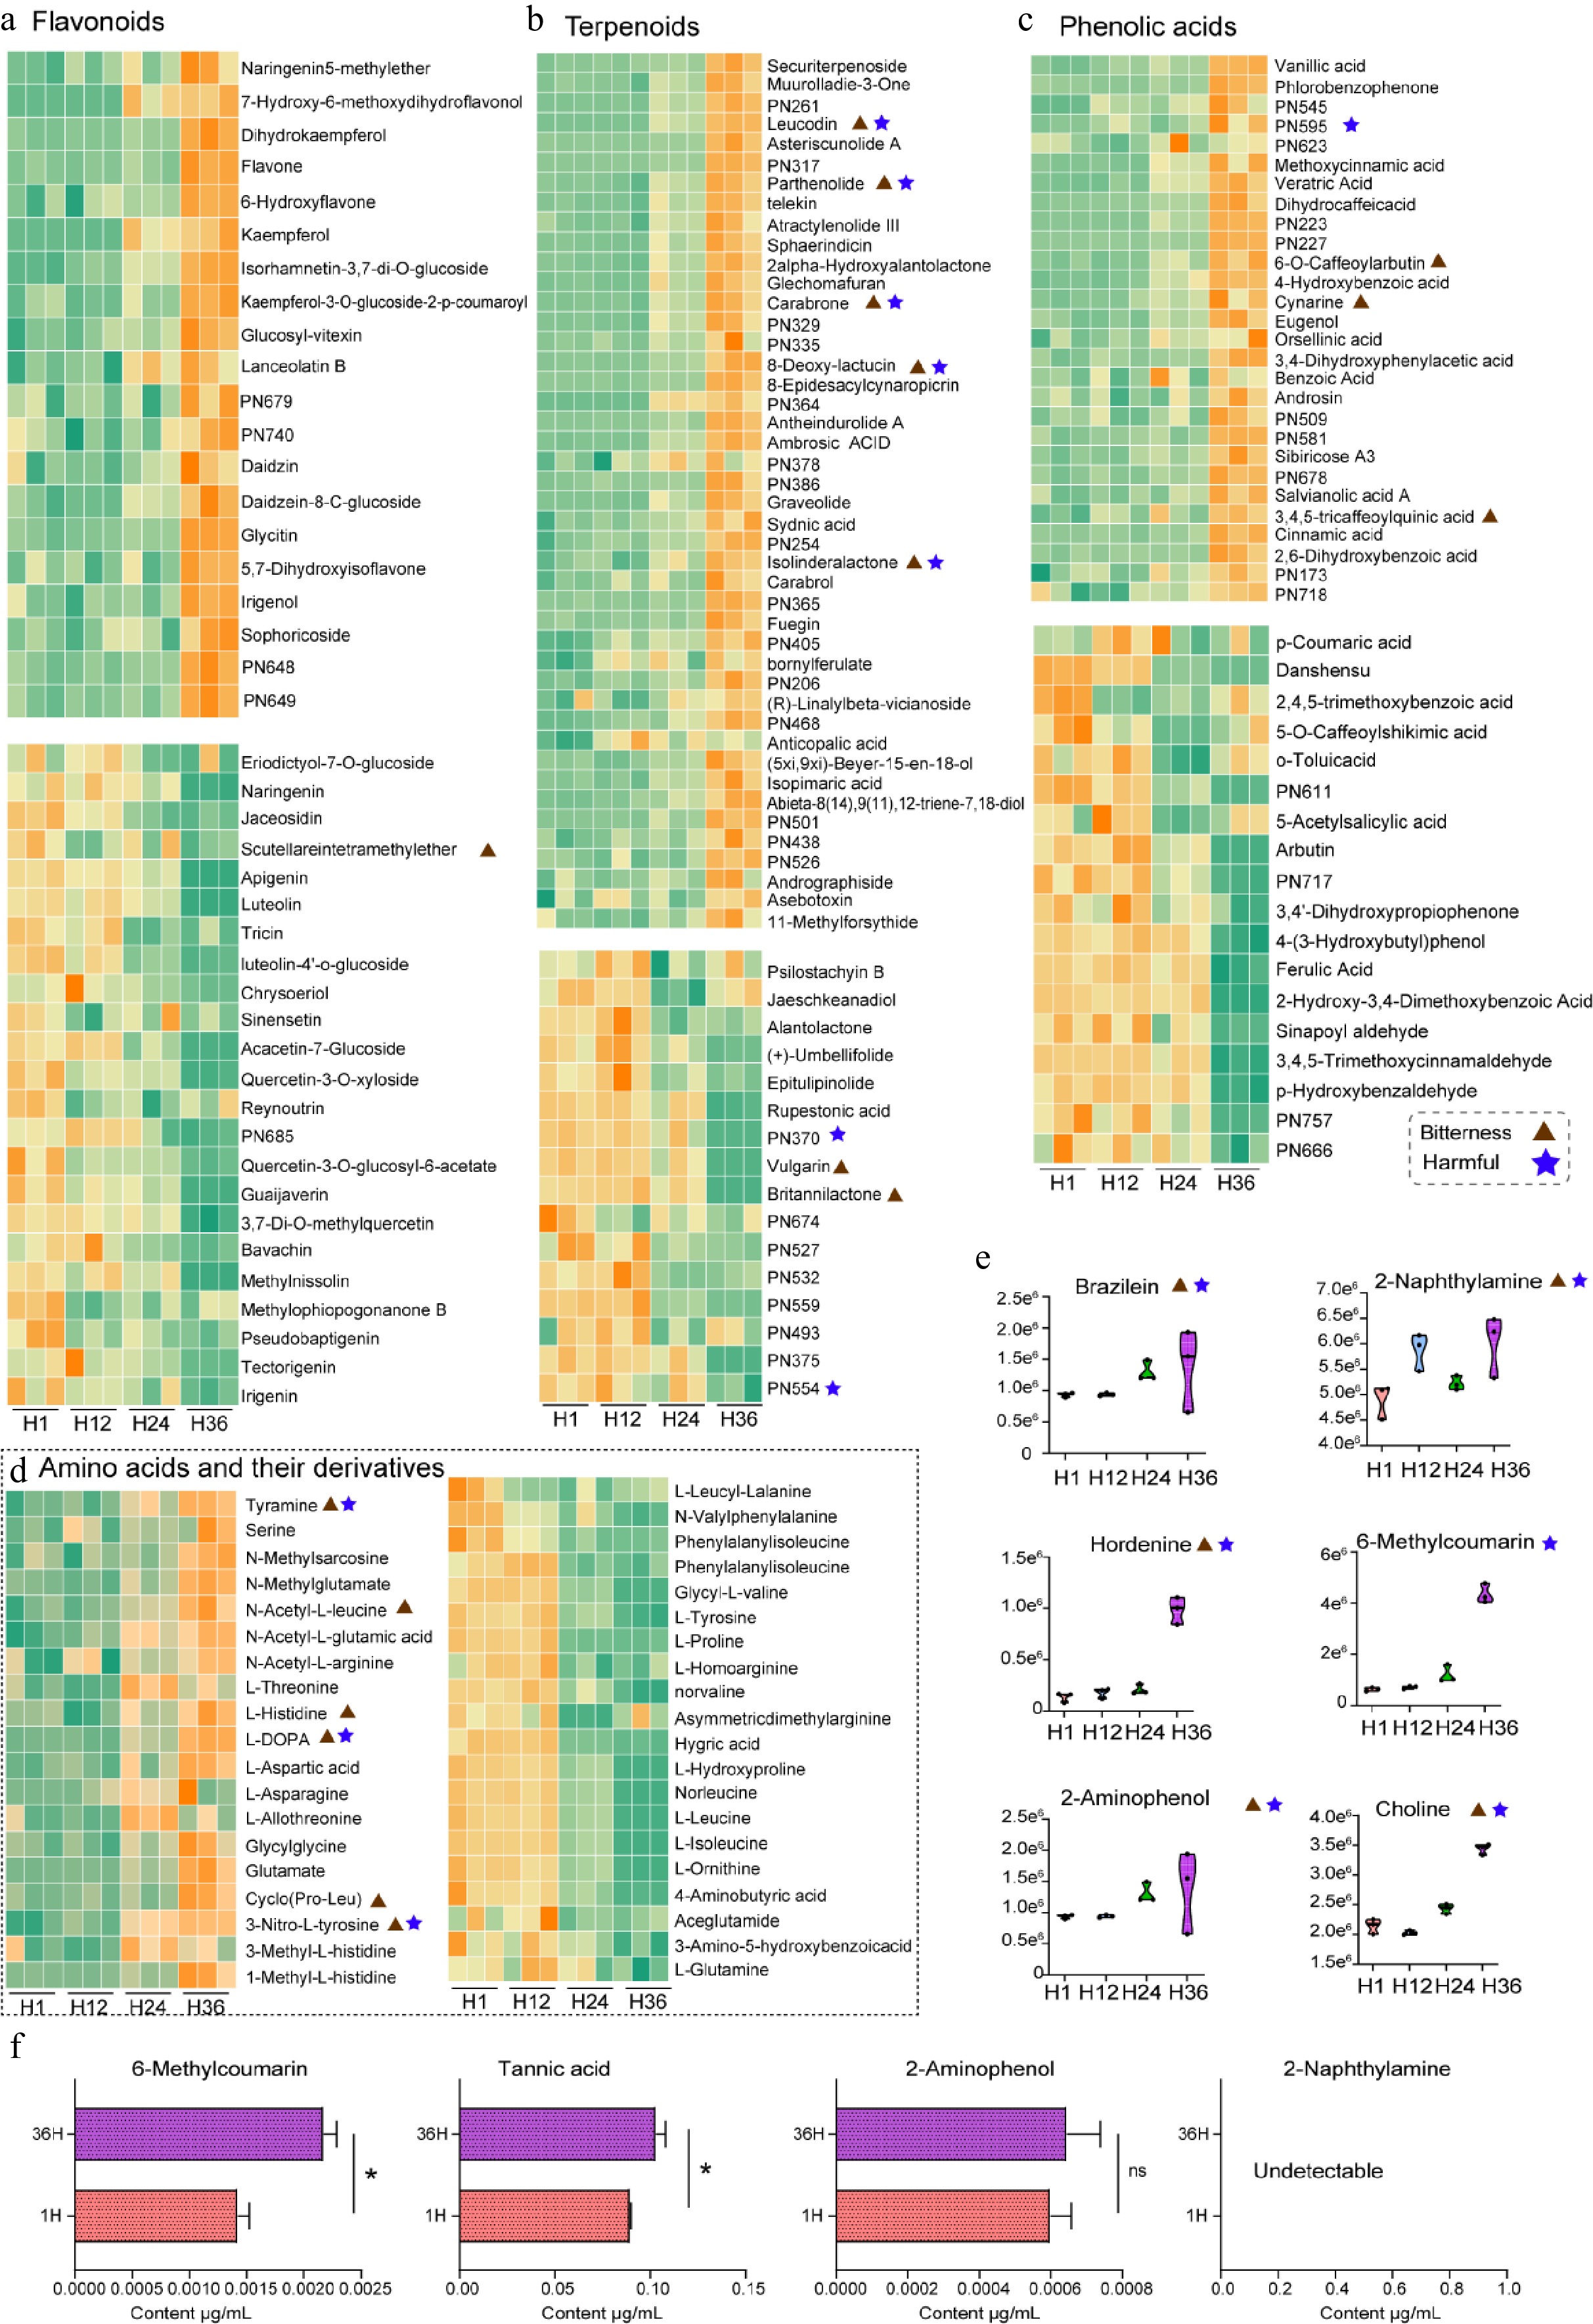
Figure 4.
Temporal variation of key metabolite classes in dandelion tea under different steeping durations (H1, H12, H24, H36). (a)–(d) Heatmaps display the relative abundance of representative metabolites across different steeping time points, classified into four major categories. (a) Flavonoids, (b) terpenoids, (c) phenolic acids, and (d) amino acids and their derivatives. Orange indicates relatively high abundance, while green denotes low abundance. Each row was individually normalized. (e) Violin plots depict the temporal accumulation patterns of selected harmful or bitter metabolites. (f) Quantitative UPLC-MS/MS analysis of selected compounds in dandelion tea infusions after 1 and 36 h of brewing. * p < 0.05.
-
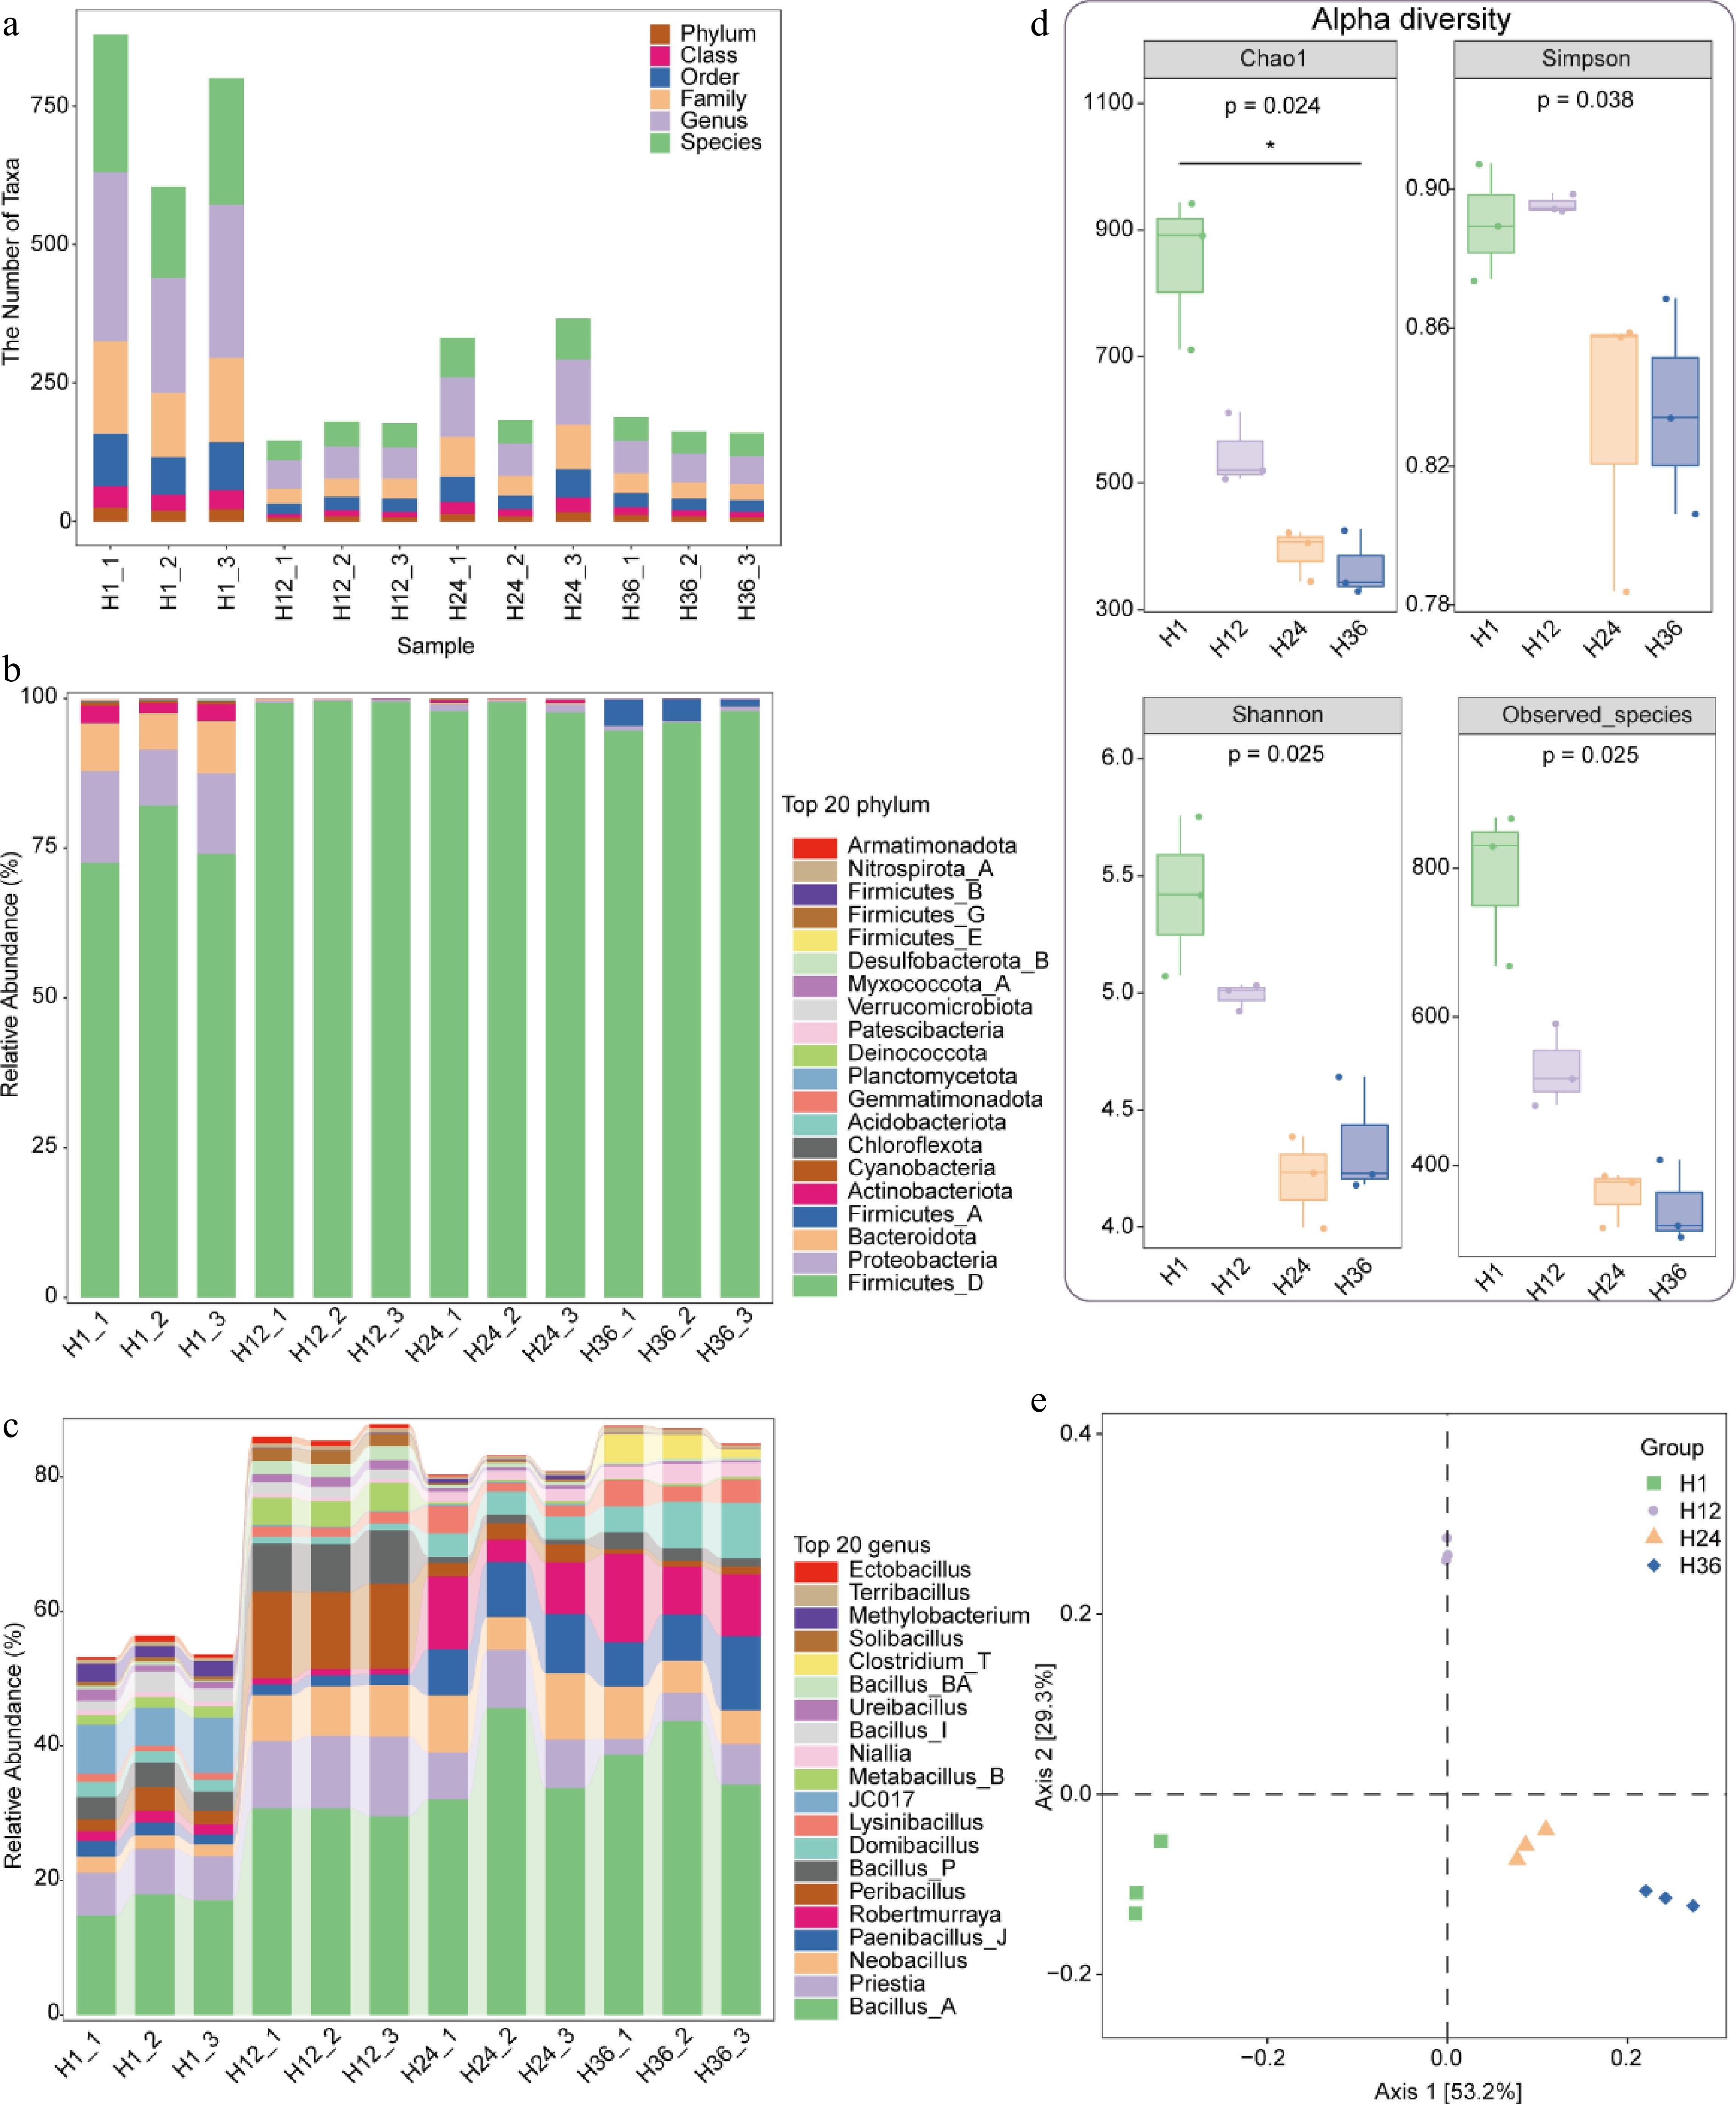
Figure 5.
Taxonomic composition and diversity of microbial communities in dandelion tea under different steeping durations. (a) Number of taxonomic units identified at six hierarchical levels (phylum, class, order, family, genus, and species) across samples steeped for 1 h (H1), 12 h (H12), 24 h (H24), and 36 h (H36). (b) Relative abundance of the top 20 bacterial phyla identified in tea infusions across different steeping durations. (c) Relative abundance of the top 20 bacterial genera. (d) Alpha diversity indices (Chao1, Simpson, Shannon, and Observed_species) of microbial communities in tea infusions. (e) Principal coordinate analysis (PCoA) based on Bray–Curtis distance demonstrates clear separation among samples from different steeping groups.
-
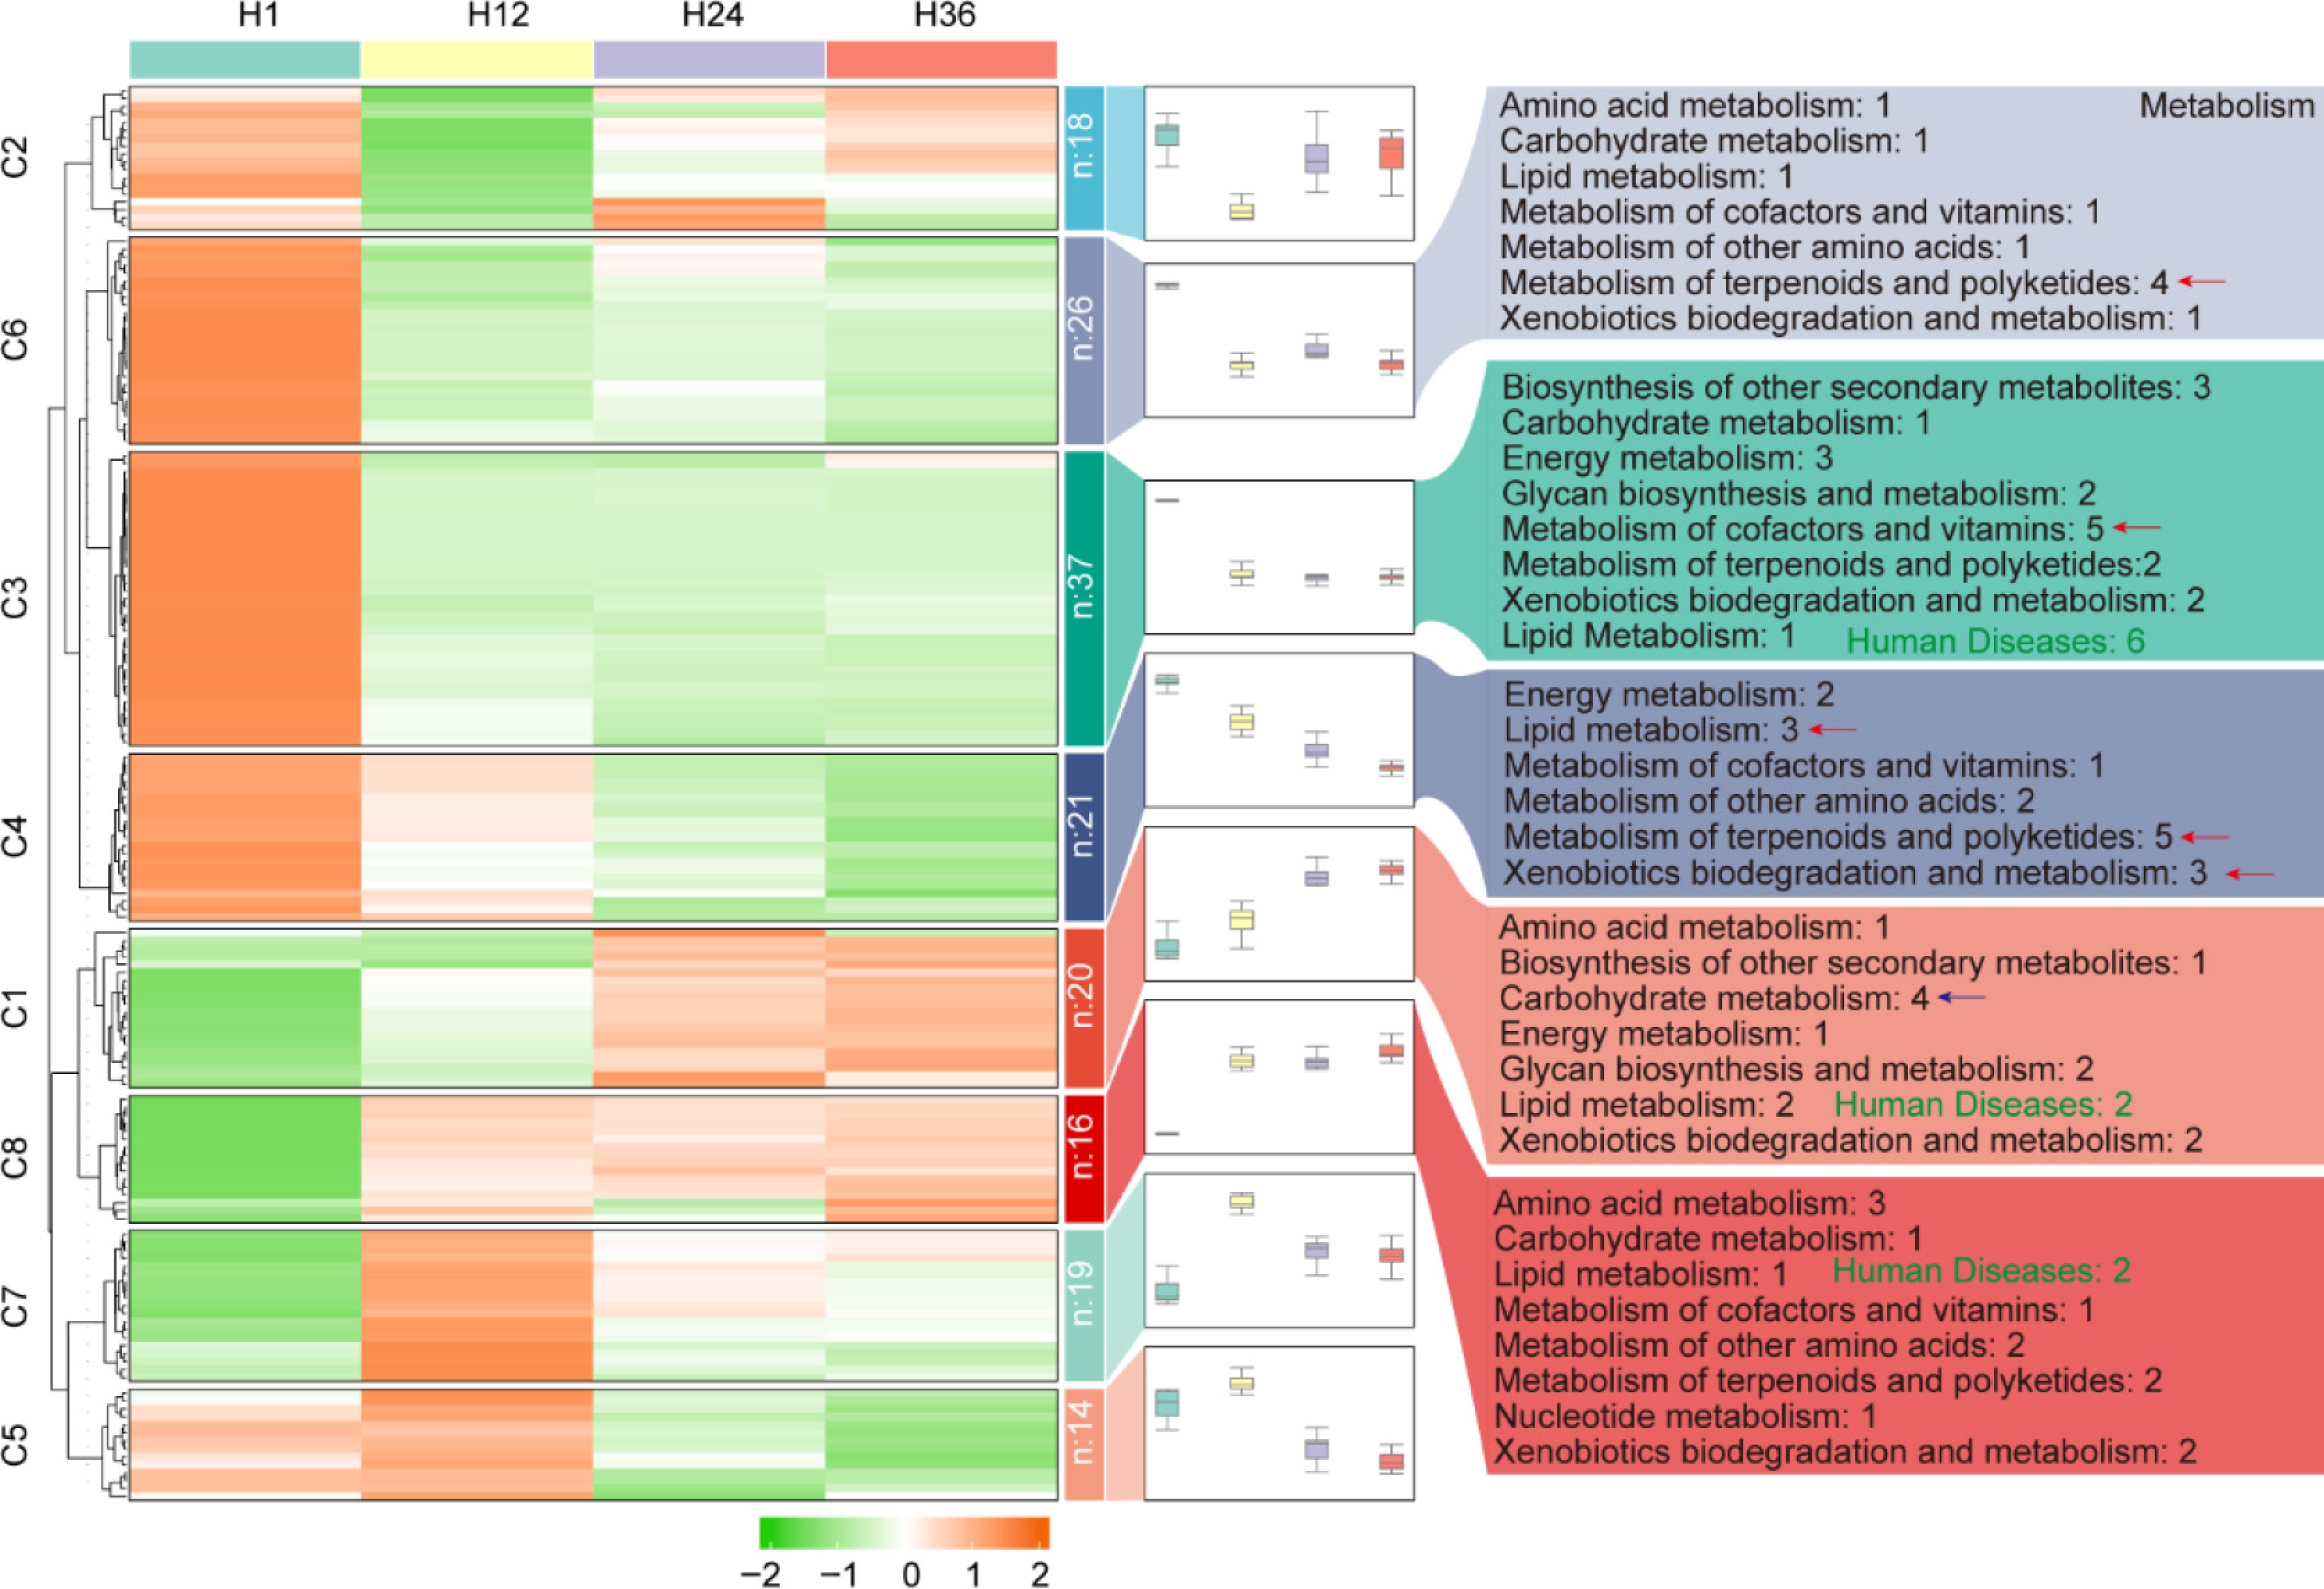
Figure 6.
KEGG functional pathway enrichment of predicted microbial communities across different steeping durations in dandelion tea. Heatmap clustering of microbial functional pathways across H1, H12, H24, and H36 samples. The right panel shows the number of pathways per functional group for each cluster.
-
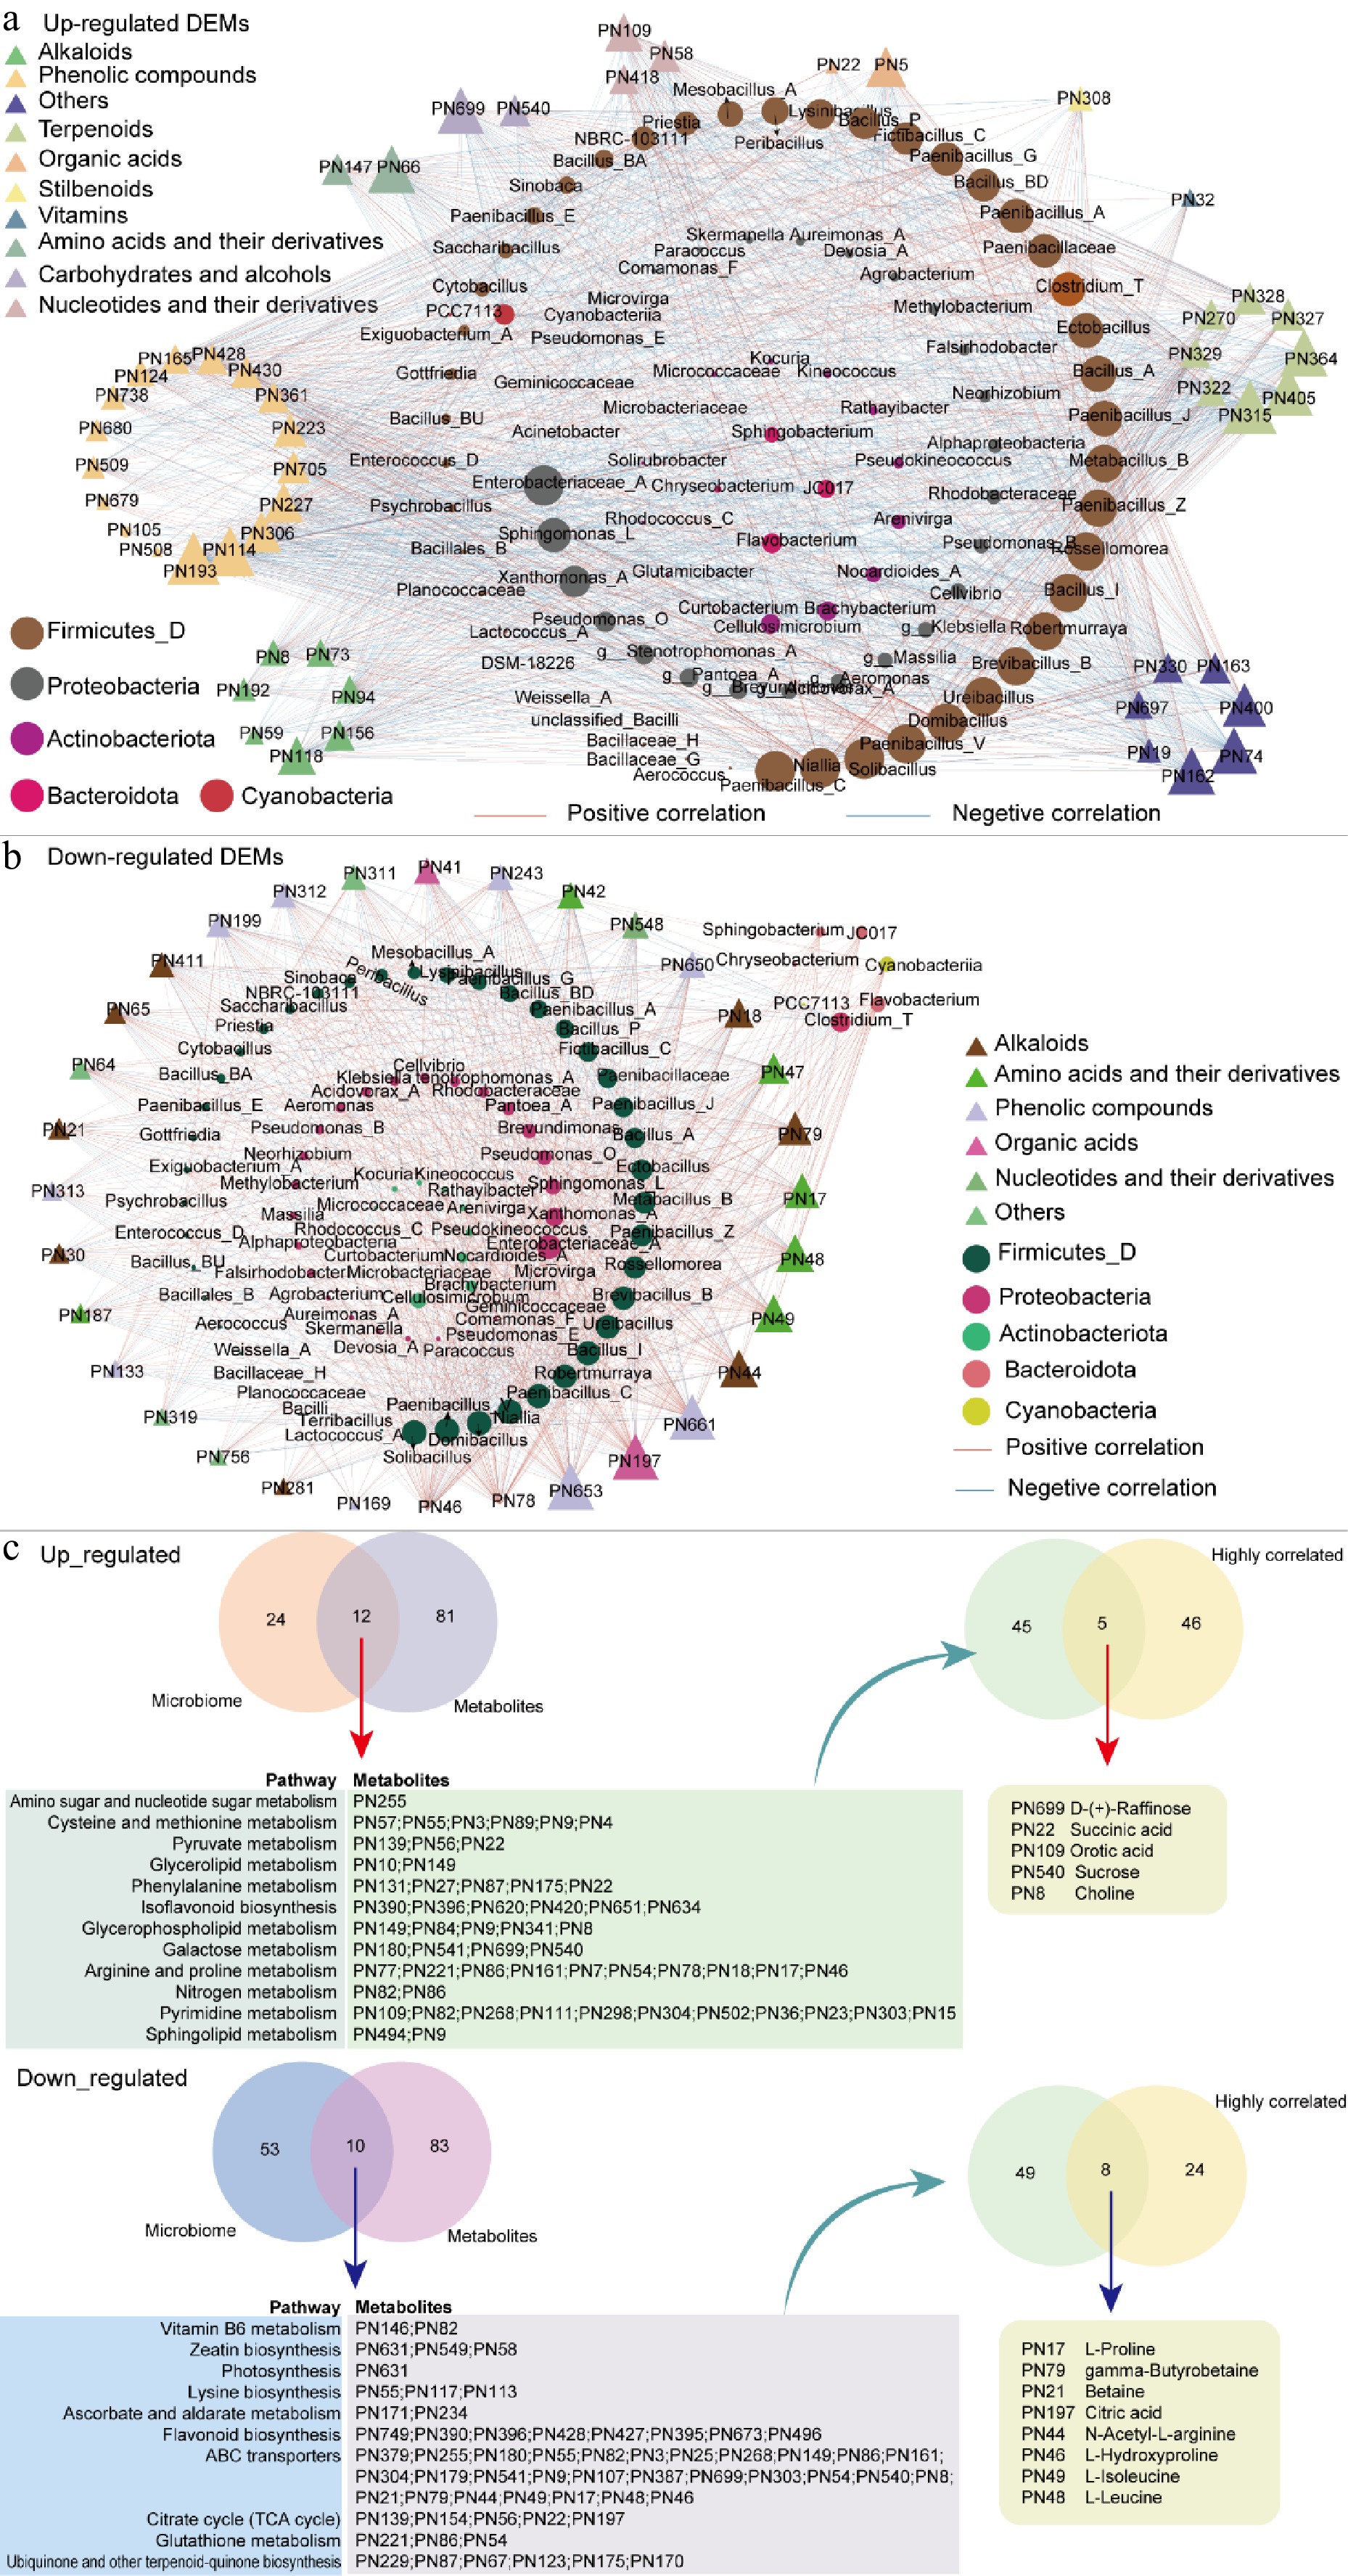
Figure 7.
Correlation network analysis between metabolites and microbial taxa during different steeping durations. (a) Network analysis showing the correlations between upregulated metabolites and microbial genera. (b) Network analysis focusing on downregulated metabolites and their associations with microbial taxa. Node size reflects the degree value, with larger nodes indicating higher connectivity and greater importance within the network. Red and blue edges represent positive and negative correlations, respectively. (c) Overlapping KEGG pathways and metabolites between the microbiome and metabolome (left). Five and eight metabolites showing strong correlations with microbial taxa (as in (a), (b), respectively).
Figures
(7)
Tables
(0)