-
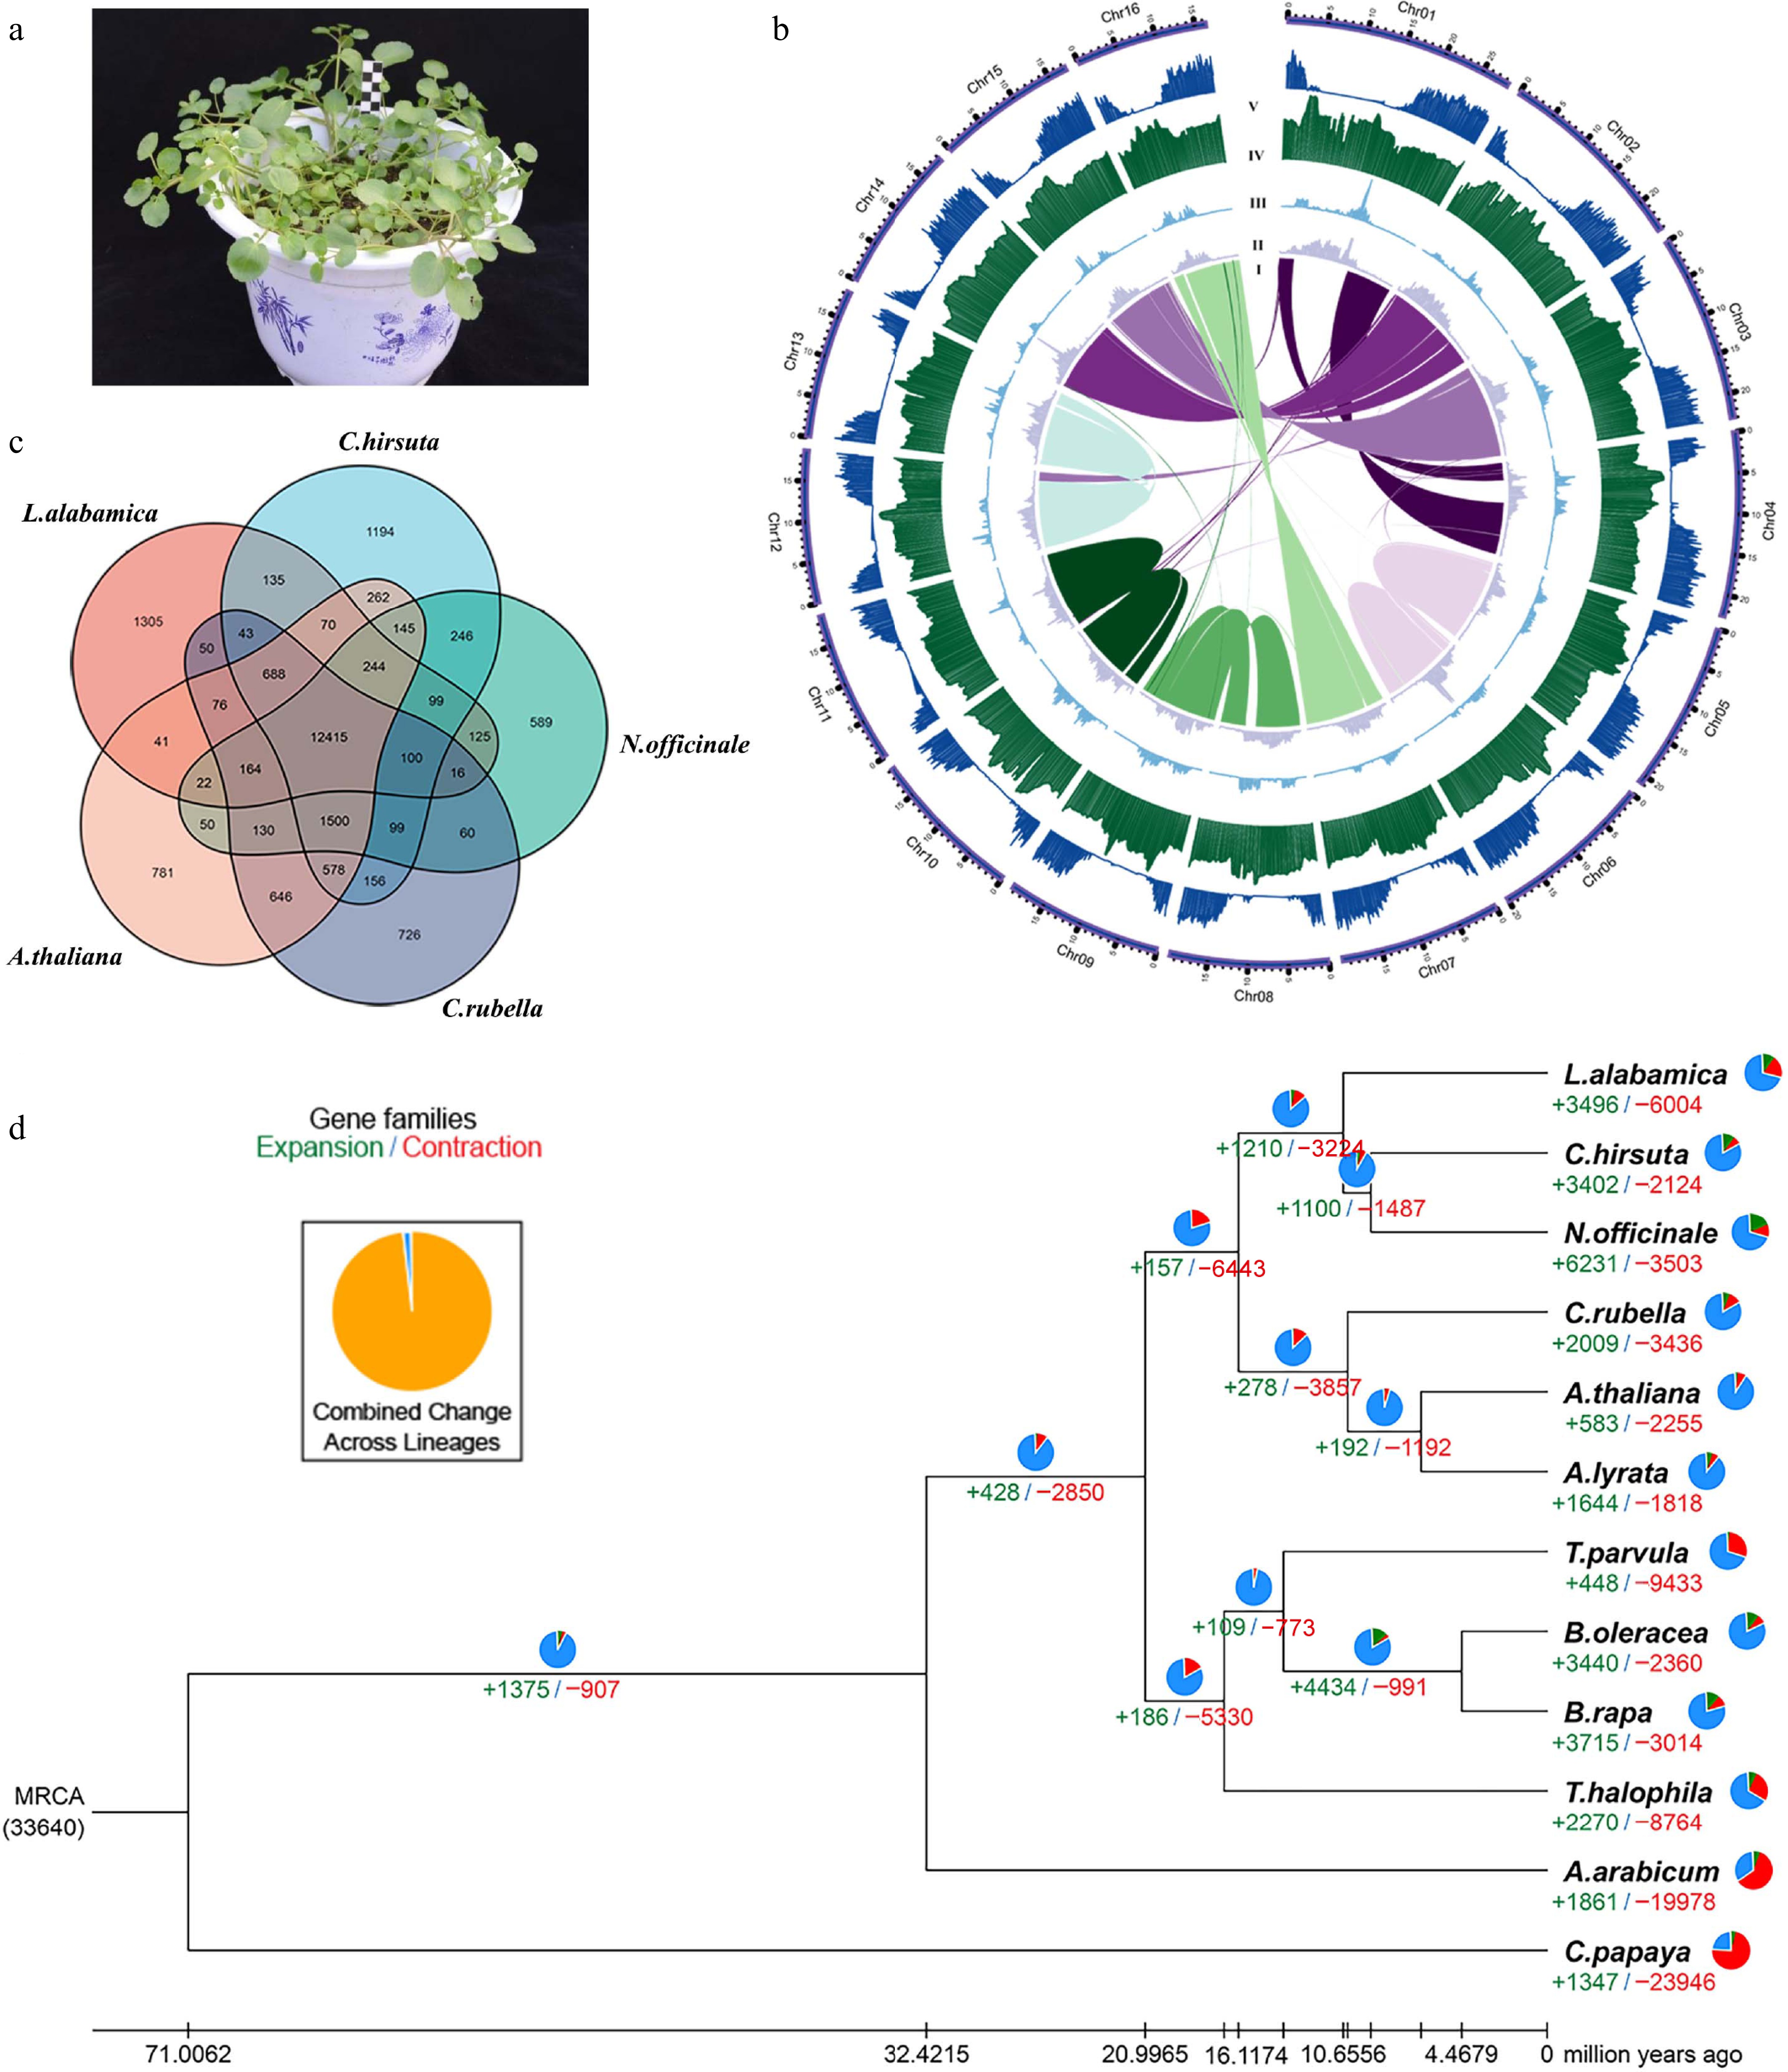
Figure 1.
Plant morphology, genome assembly, and genome features of watercress. (a) the watercress cultivar used in this study. (b) The landscape of the watercress genome: syntenic blocks (I), copia density (II), gyspy density (III), GC content (IV), and gene density (V). (c) Venn diagram representing the shared and unique gene families among watercress, A. thaliana, C. hirsuta, C. rubella, L. alabamica, and N. officinale. (d) Phylogenetic tree showing the divergence time and the evolution of gene family size for 12 species including watercress. The numbers at the branches represent gained (green) and lost (red) gene families. The small pie charts represent the percentage of expanded (green), contracted (red), and unchanged (blue) gene families.
-
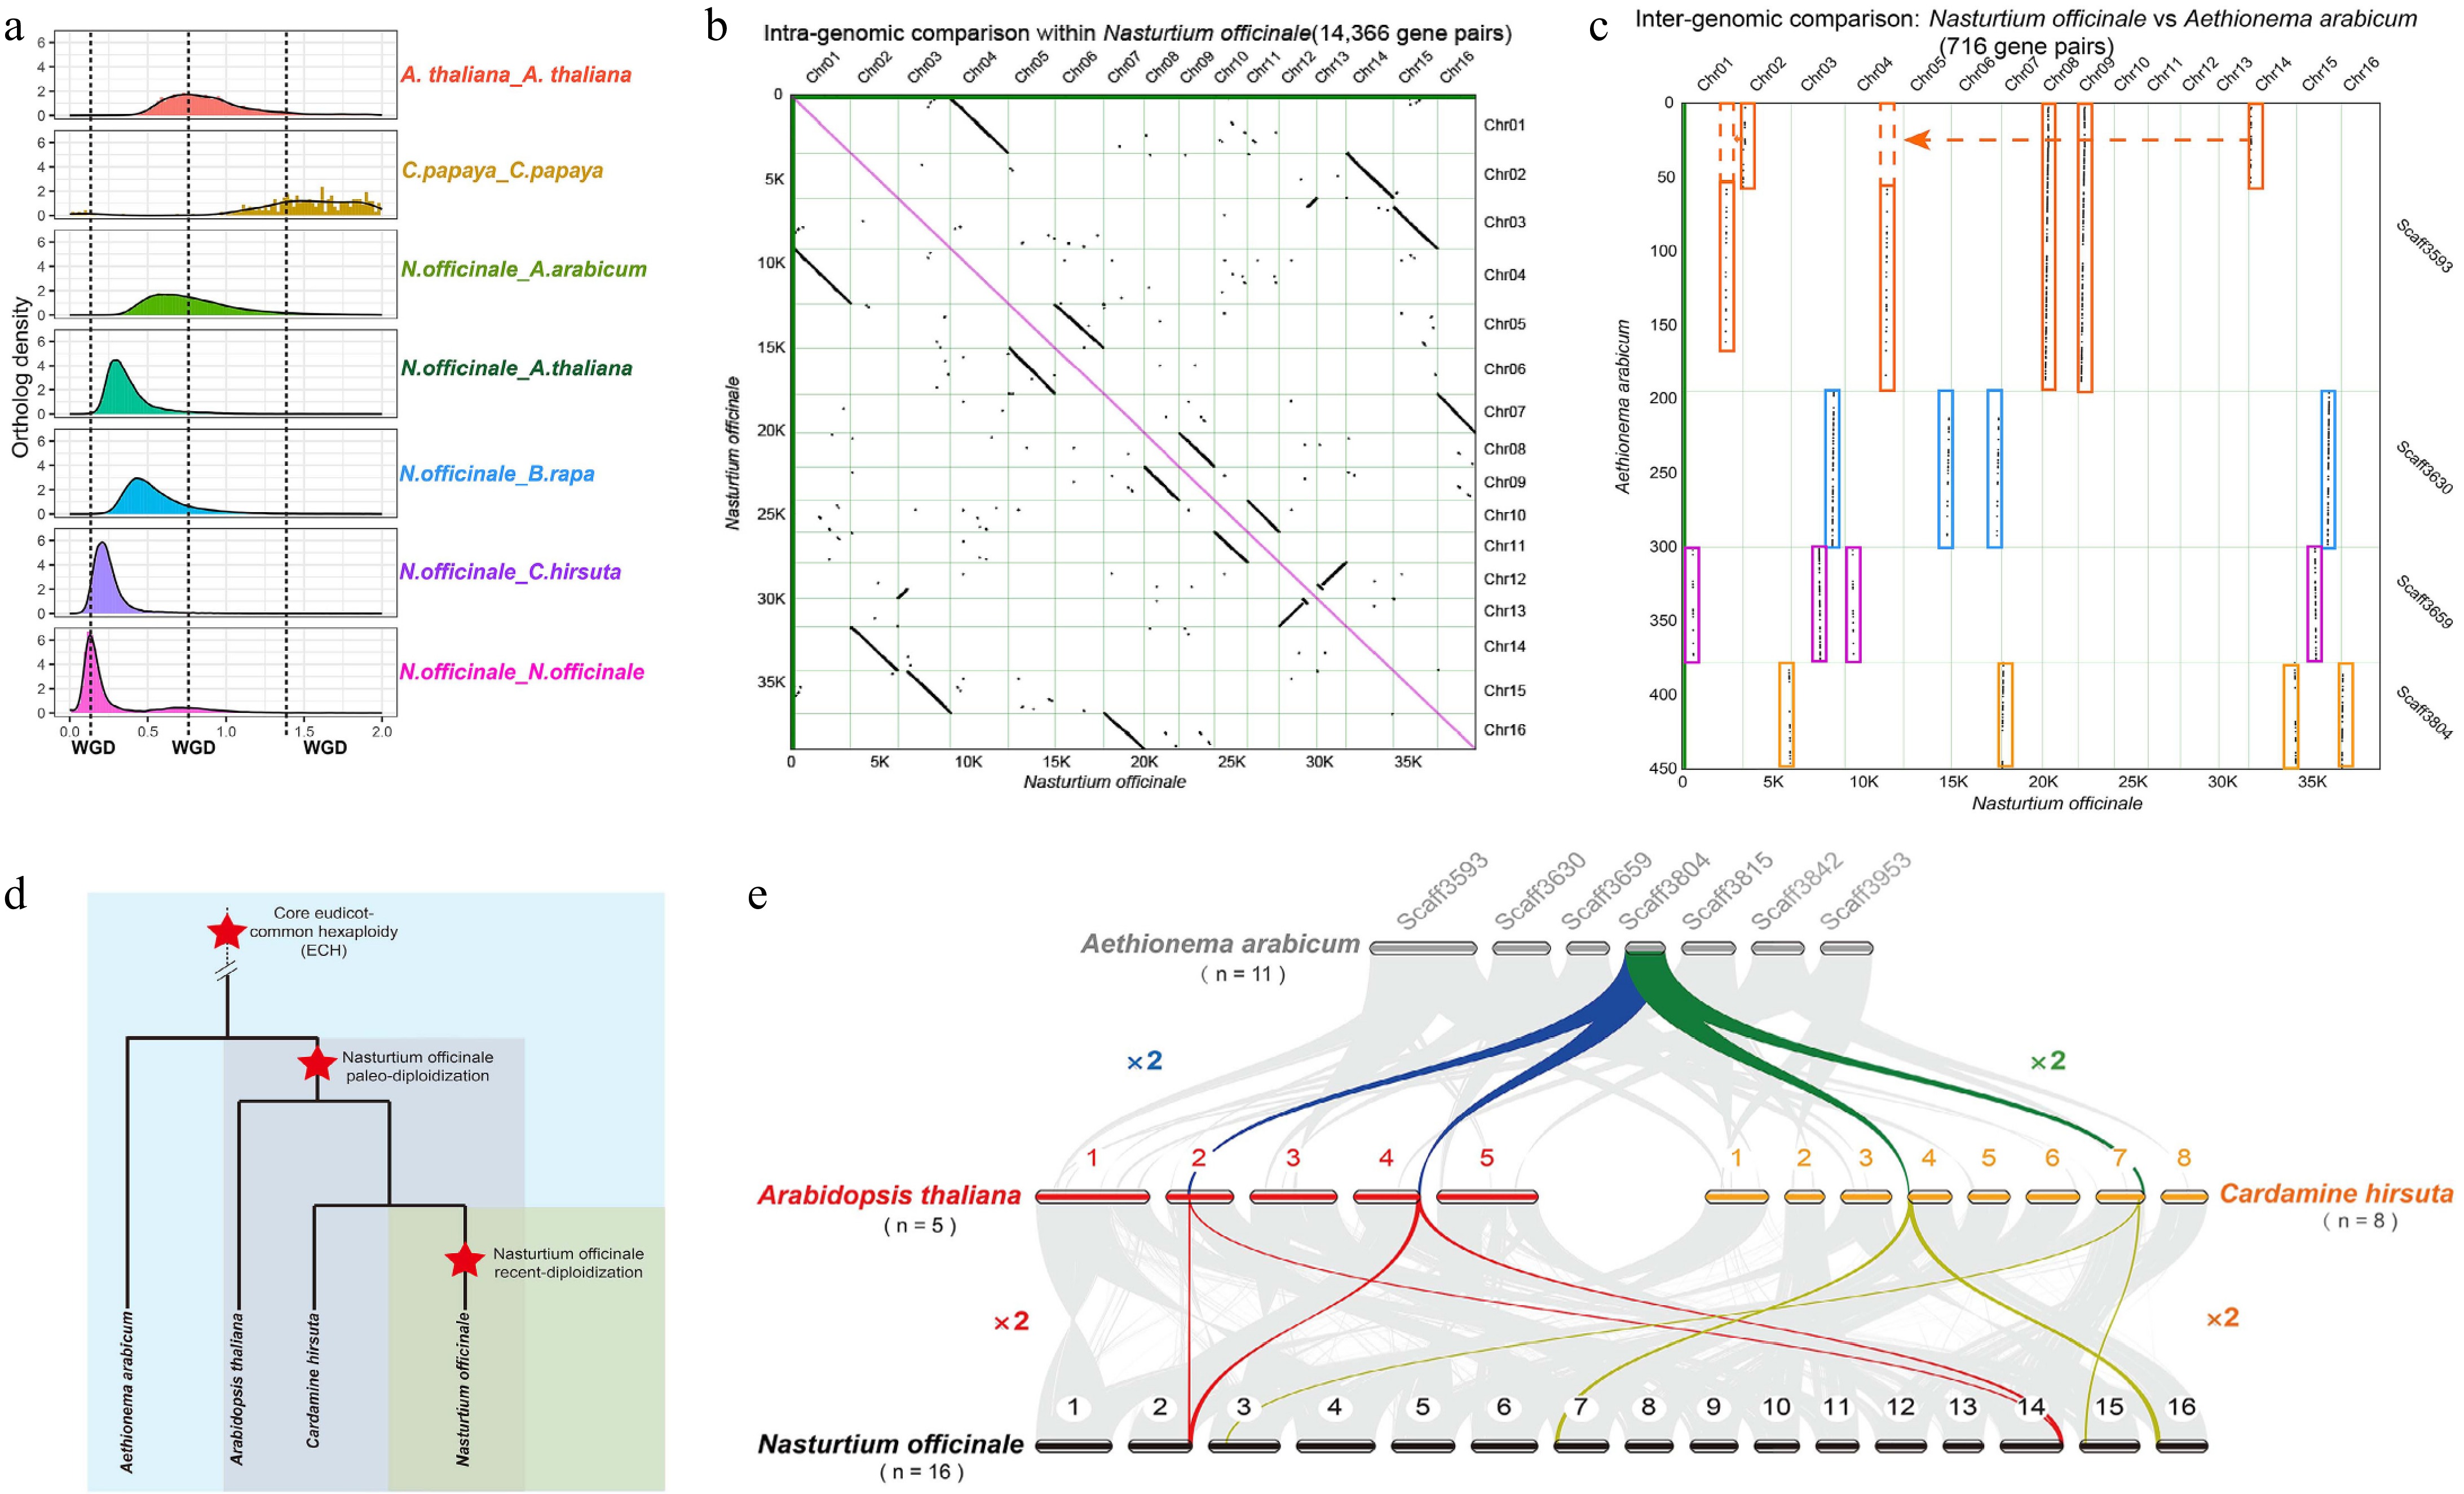
Figure 2.
Whole-genome duplication in the watercress genome. (a) The density distribution of Ks for paralogs and orthologs within and between species. (b) Dot plot of syntenic genes within the watercress genome. (c) Dot plot of syntenic genes between the genomes of A. arabicum and watercress. (d) Model of species divergence. (e) Model of species WGD.
-
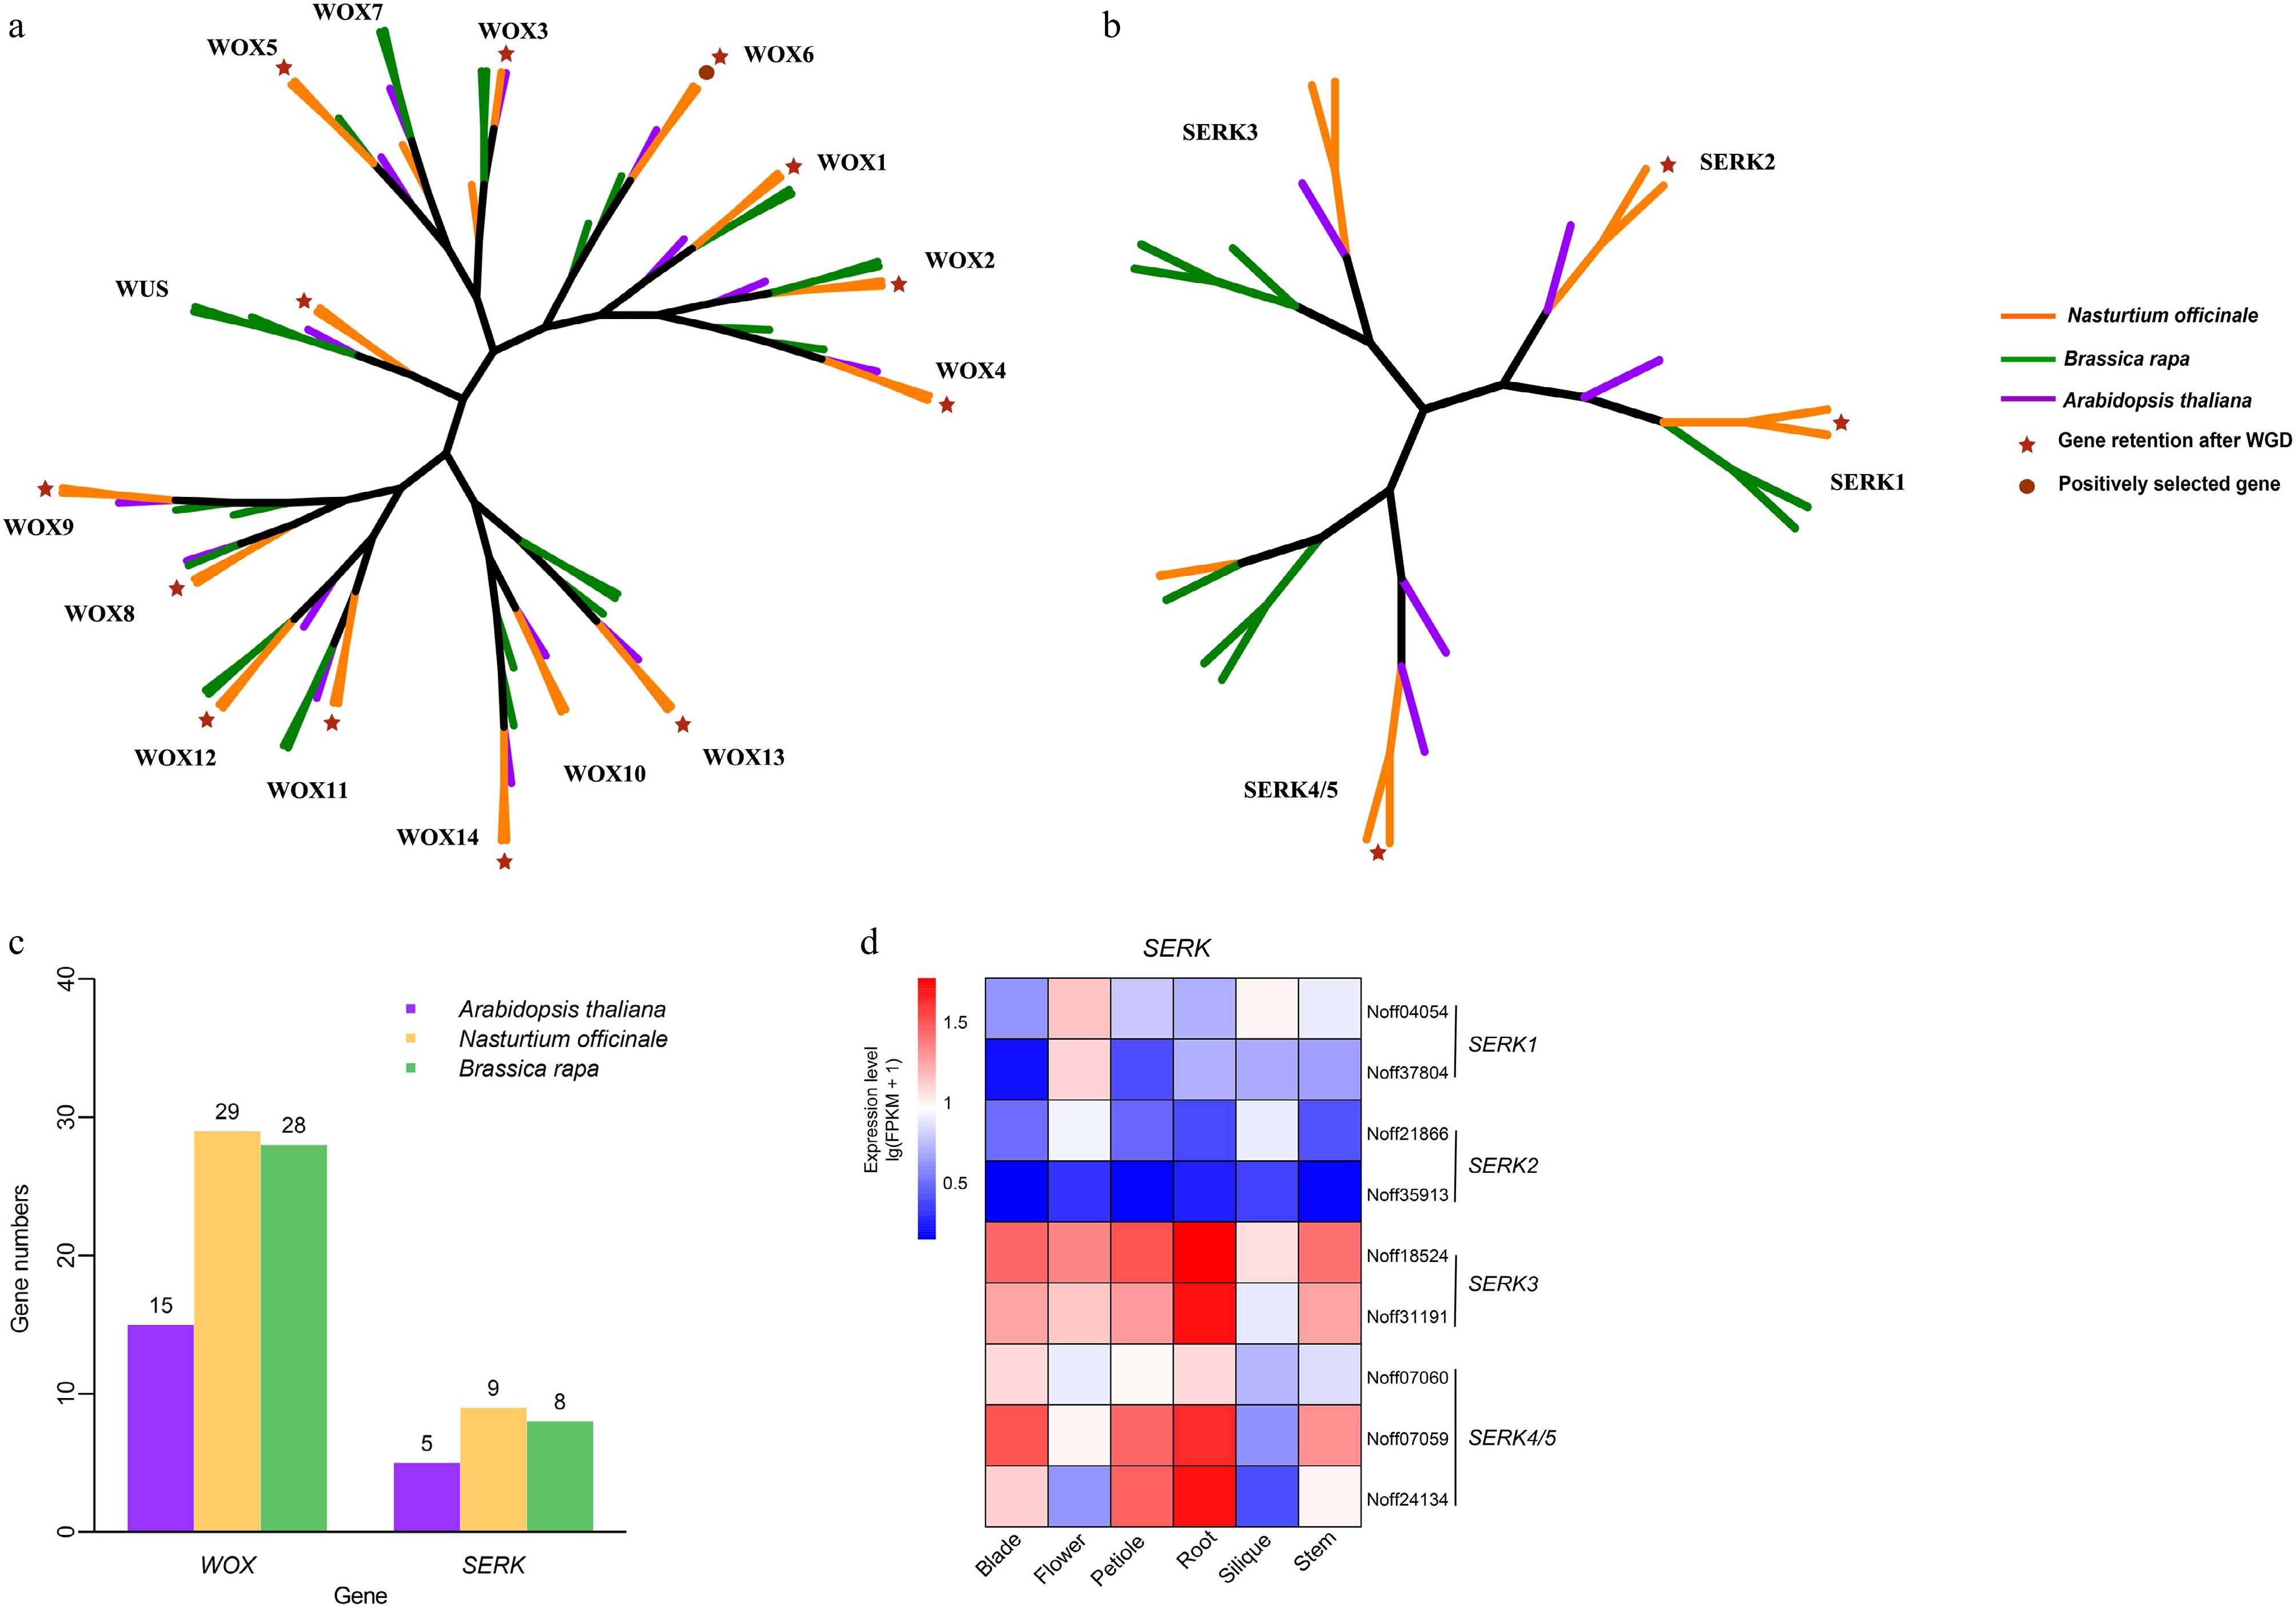
Figure 3.
Analysis of genes related to regeneration. (a) Phylogenetic tree of the WOX gene family. (b) Phylogenetic tree of the SERK gene family. (c) The distribution of WOX and SERK gene family members in Arabidopsis thaliana, Brassica rapa, and Nasturtium officinale. (d) The expression pattern of SERK gene family members in different organs of Nasturtium officinale.
-
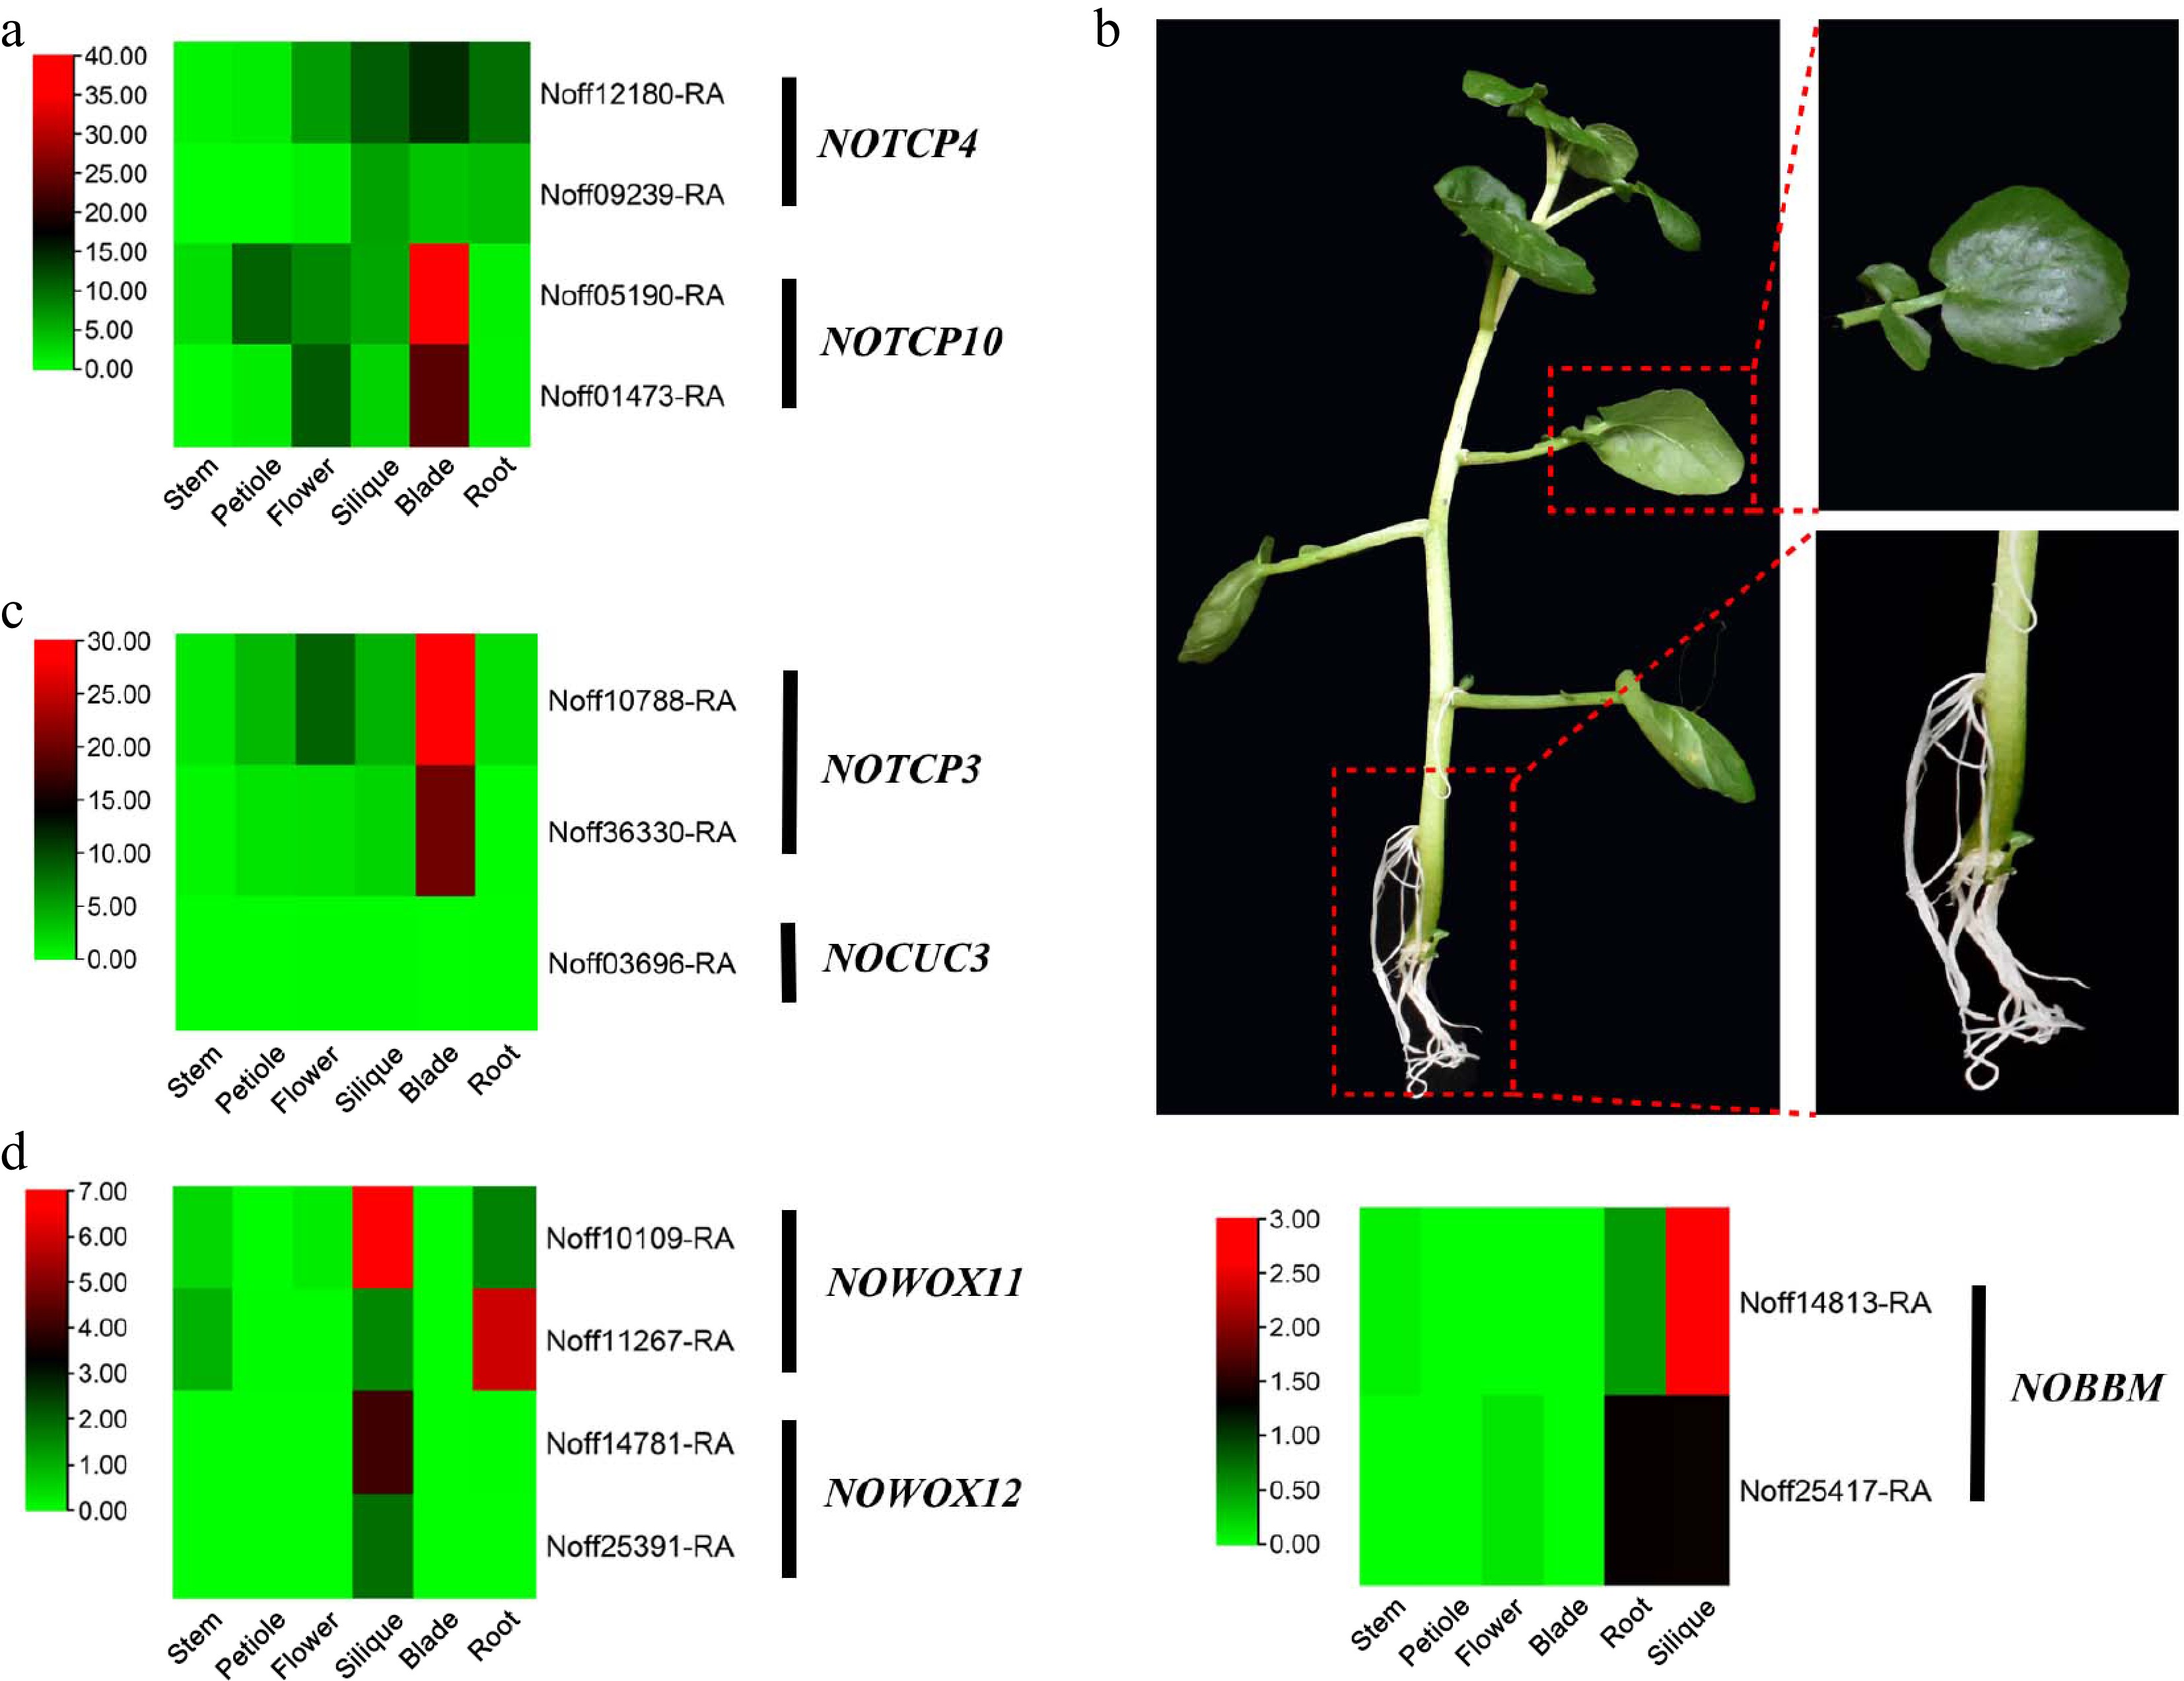
Figure 4.
Evolution of genes involved in leaf and root morphogenesis in the watercress genome. (a) Heatmap of the expression levels of NoTCP4 and NoTCP10 in different organs. (b) Leaves and aerial adventitious roots of watercress. (c) Heatmap of the expression levels of NoTCP3 and NoCUC3 in different organs. (d) Heatmap of the expression levels of NoBBM, NoWOX11, and NoWOX12 in different organs.
Figures
(4)
Tables
(0)