-
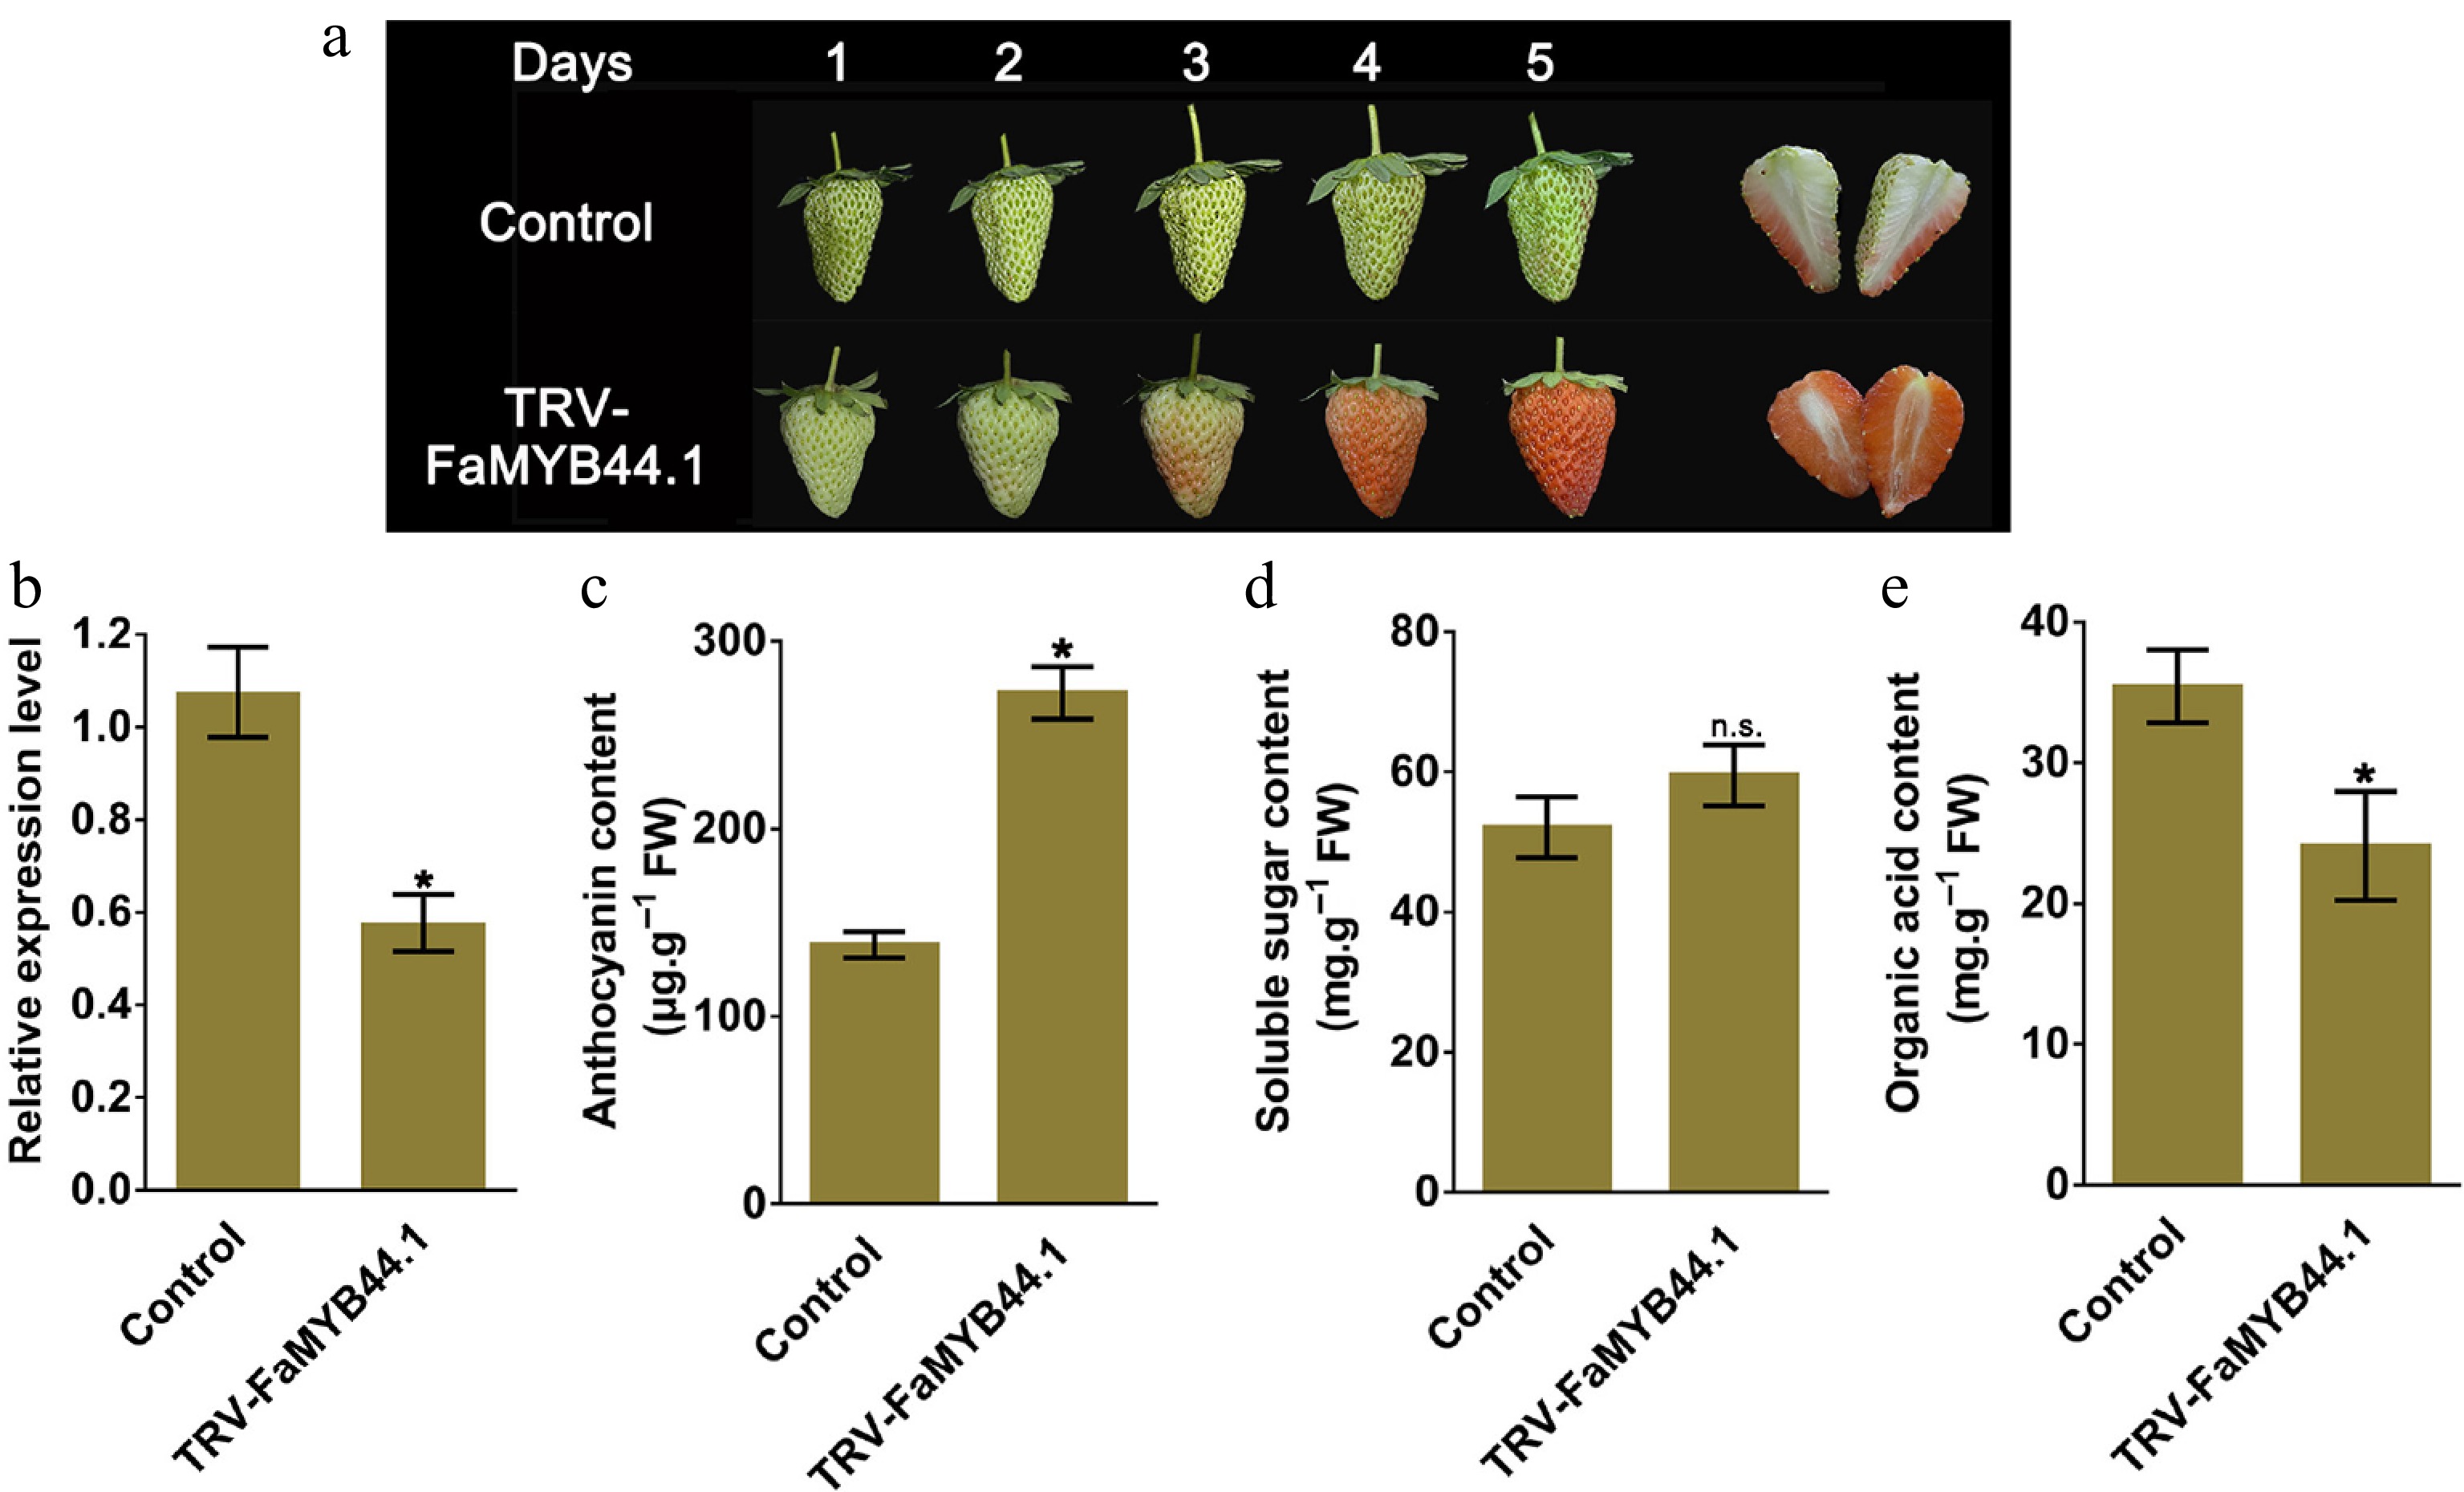
Figure 1.
Five days after injecting the FaMYB44.1 bacterial suspension, changes in strawberry fruit characteristics and related parameters were measured. (a) Phenotypic changes. (b) FaMYB44.1 expression levels. (c) Anthocyanin content. (d) Soluble sugar concentration. (e) Organic acid content in TRV-FaMYB44.1 fruits. Statistical significance compared to the control group is indicated as follows: n.s. = No significant difference; * = p < 0.05. Values represent the meaning of three biological replicates ± SD.
-
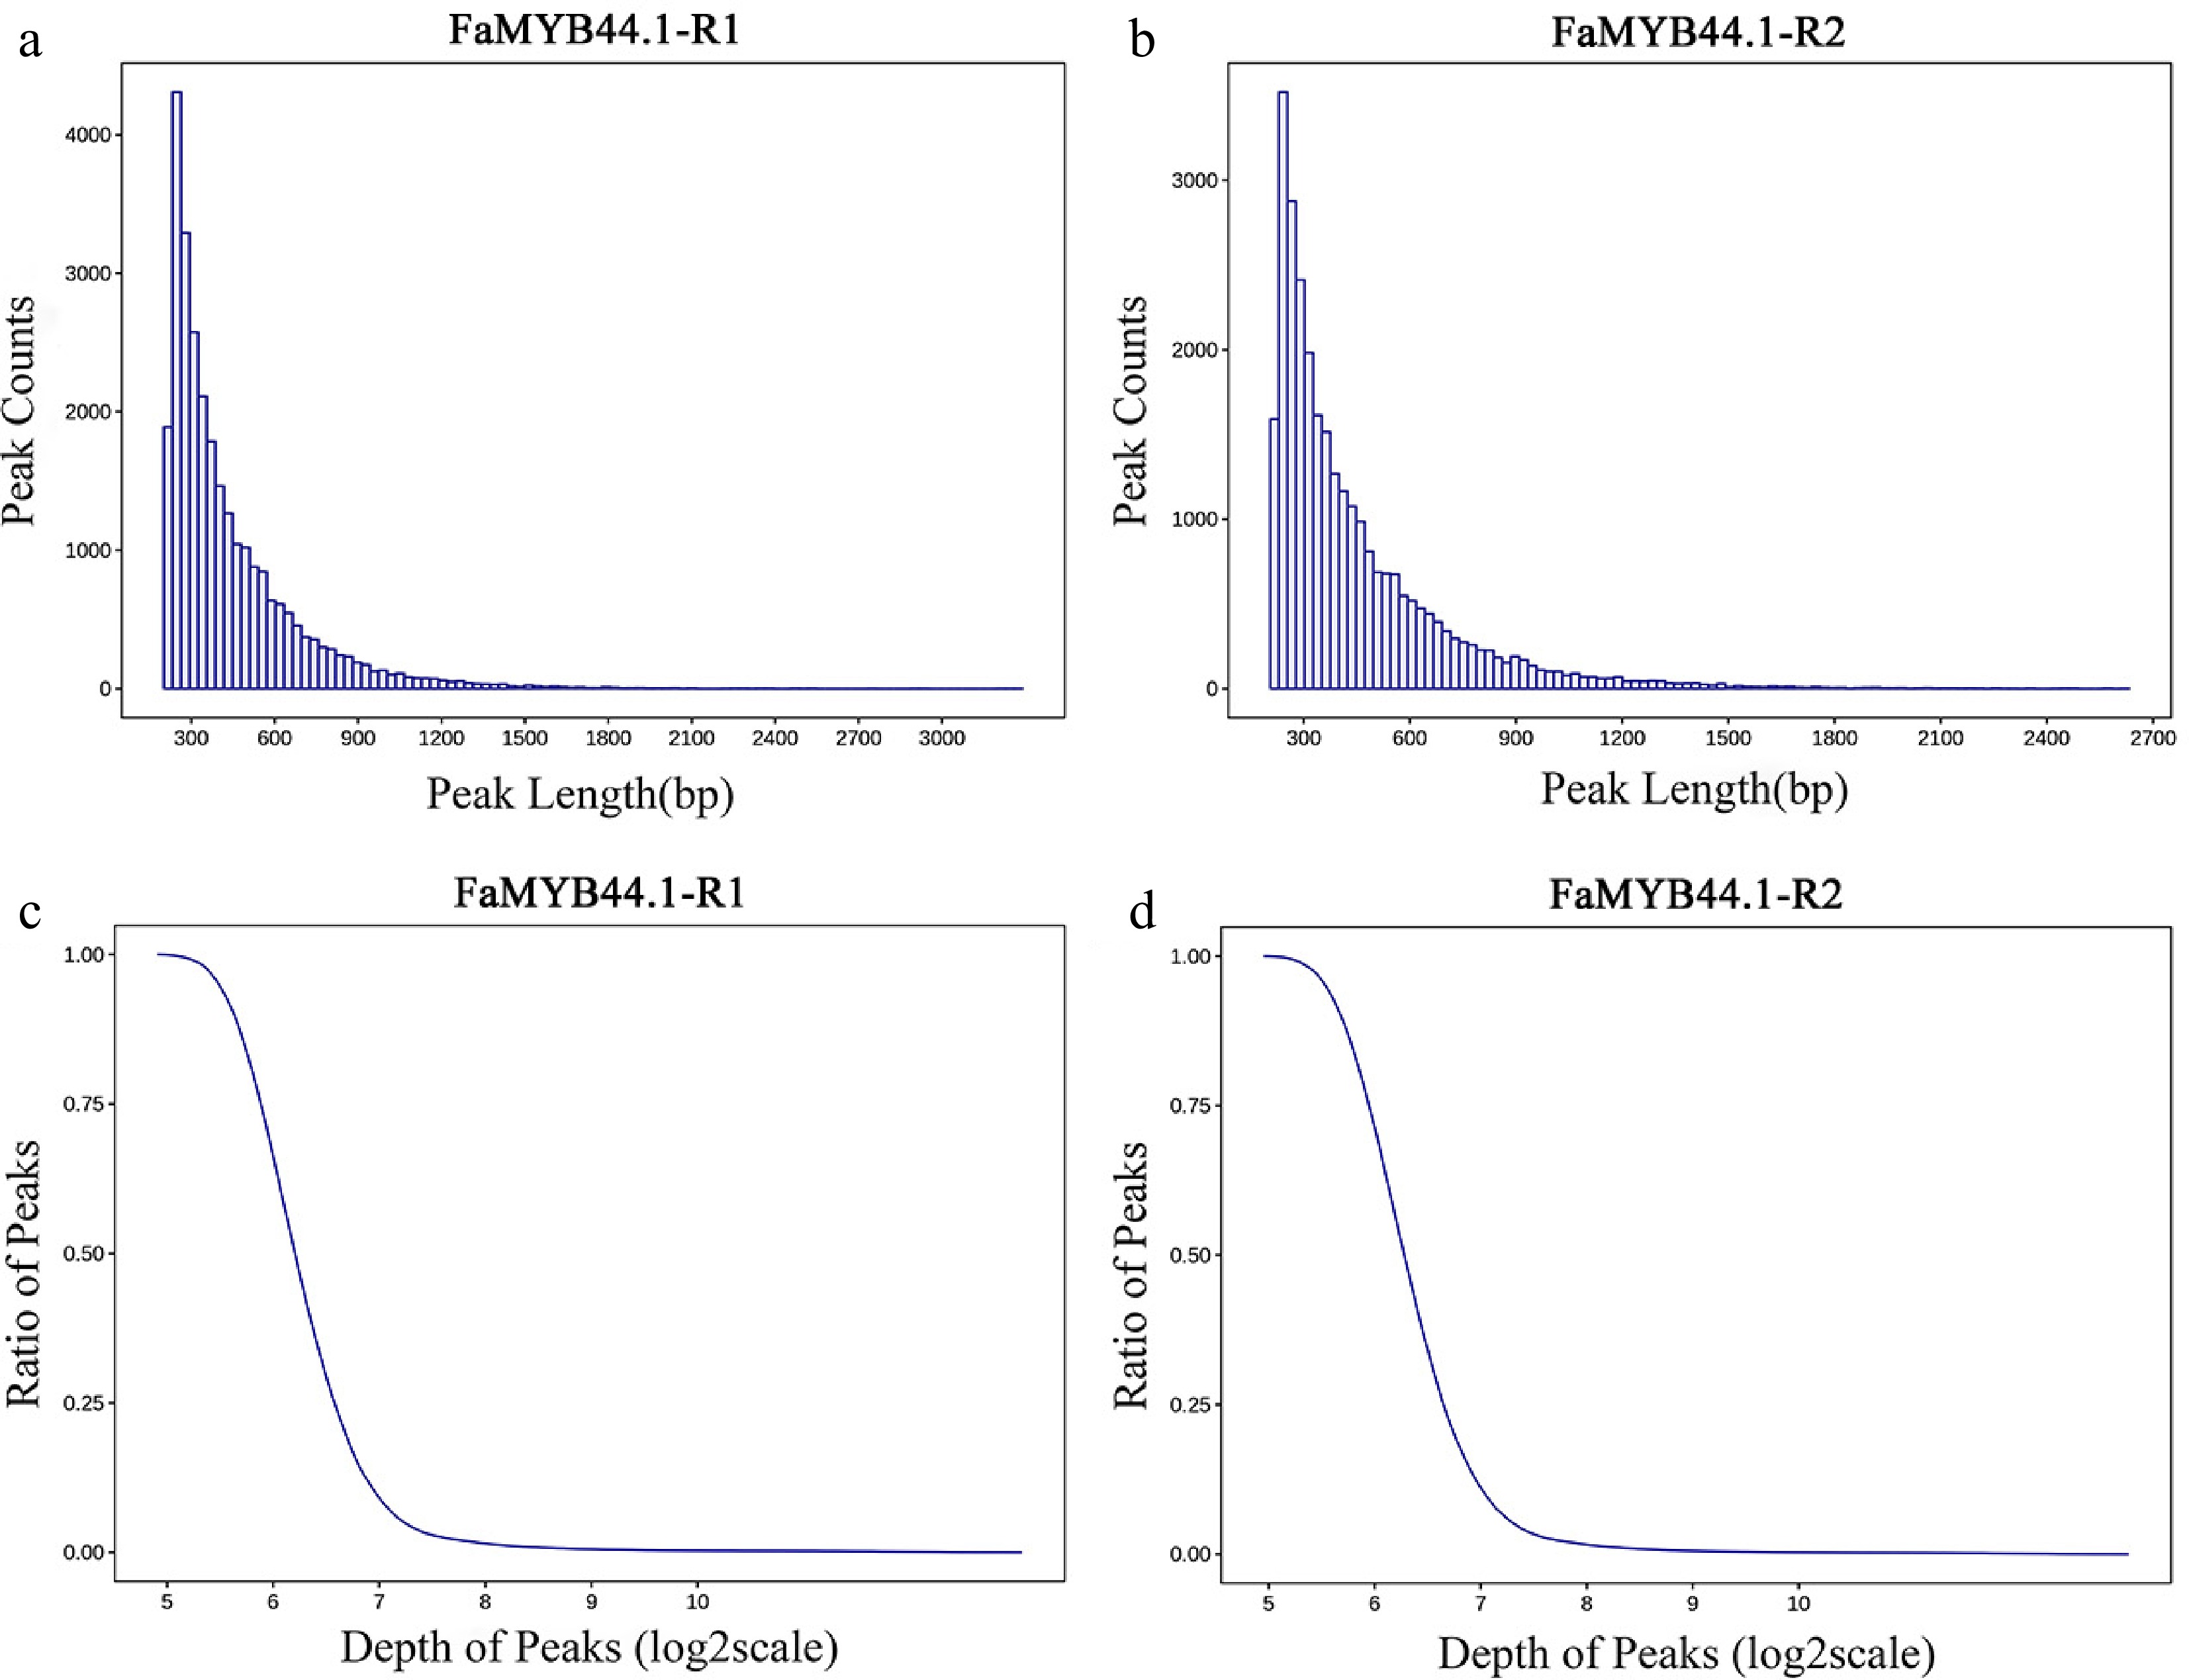
Figure 2.
Distribution of peak length and depth. (a) Peak length distribution for FaMYB44.1-R1, demonstrating a concentration around 300 bp. (b) Peak length distribution for FaMYB44.1-R2, exhibiting similar characteristics to FaMYB44.1-R1 with a peak around 300 bp. (c) Peak ratio vs sequencing depth (log2 scale) for FaMYB44.1-R1, displaying a concentration in the five to seven range. (d) Peak ratio vs sequencing depth (log2 scale) for FaMYB44.1-R2, reflecting the pattern observed in FaMYB44.1-R1.
-
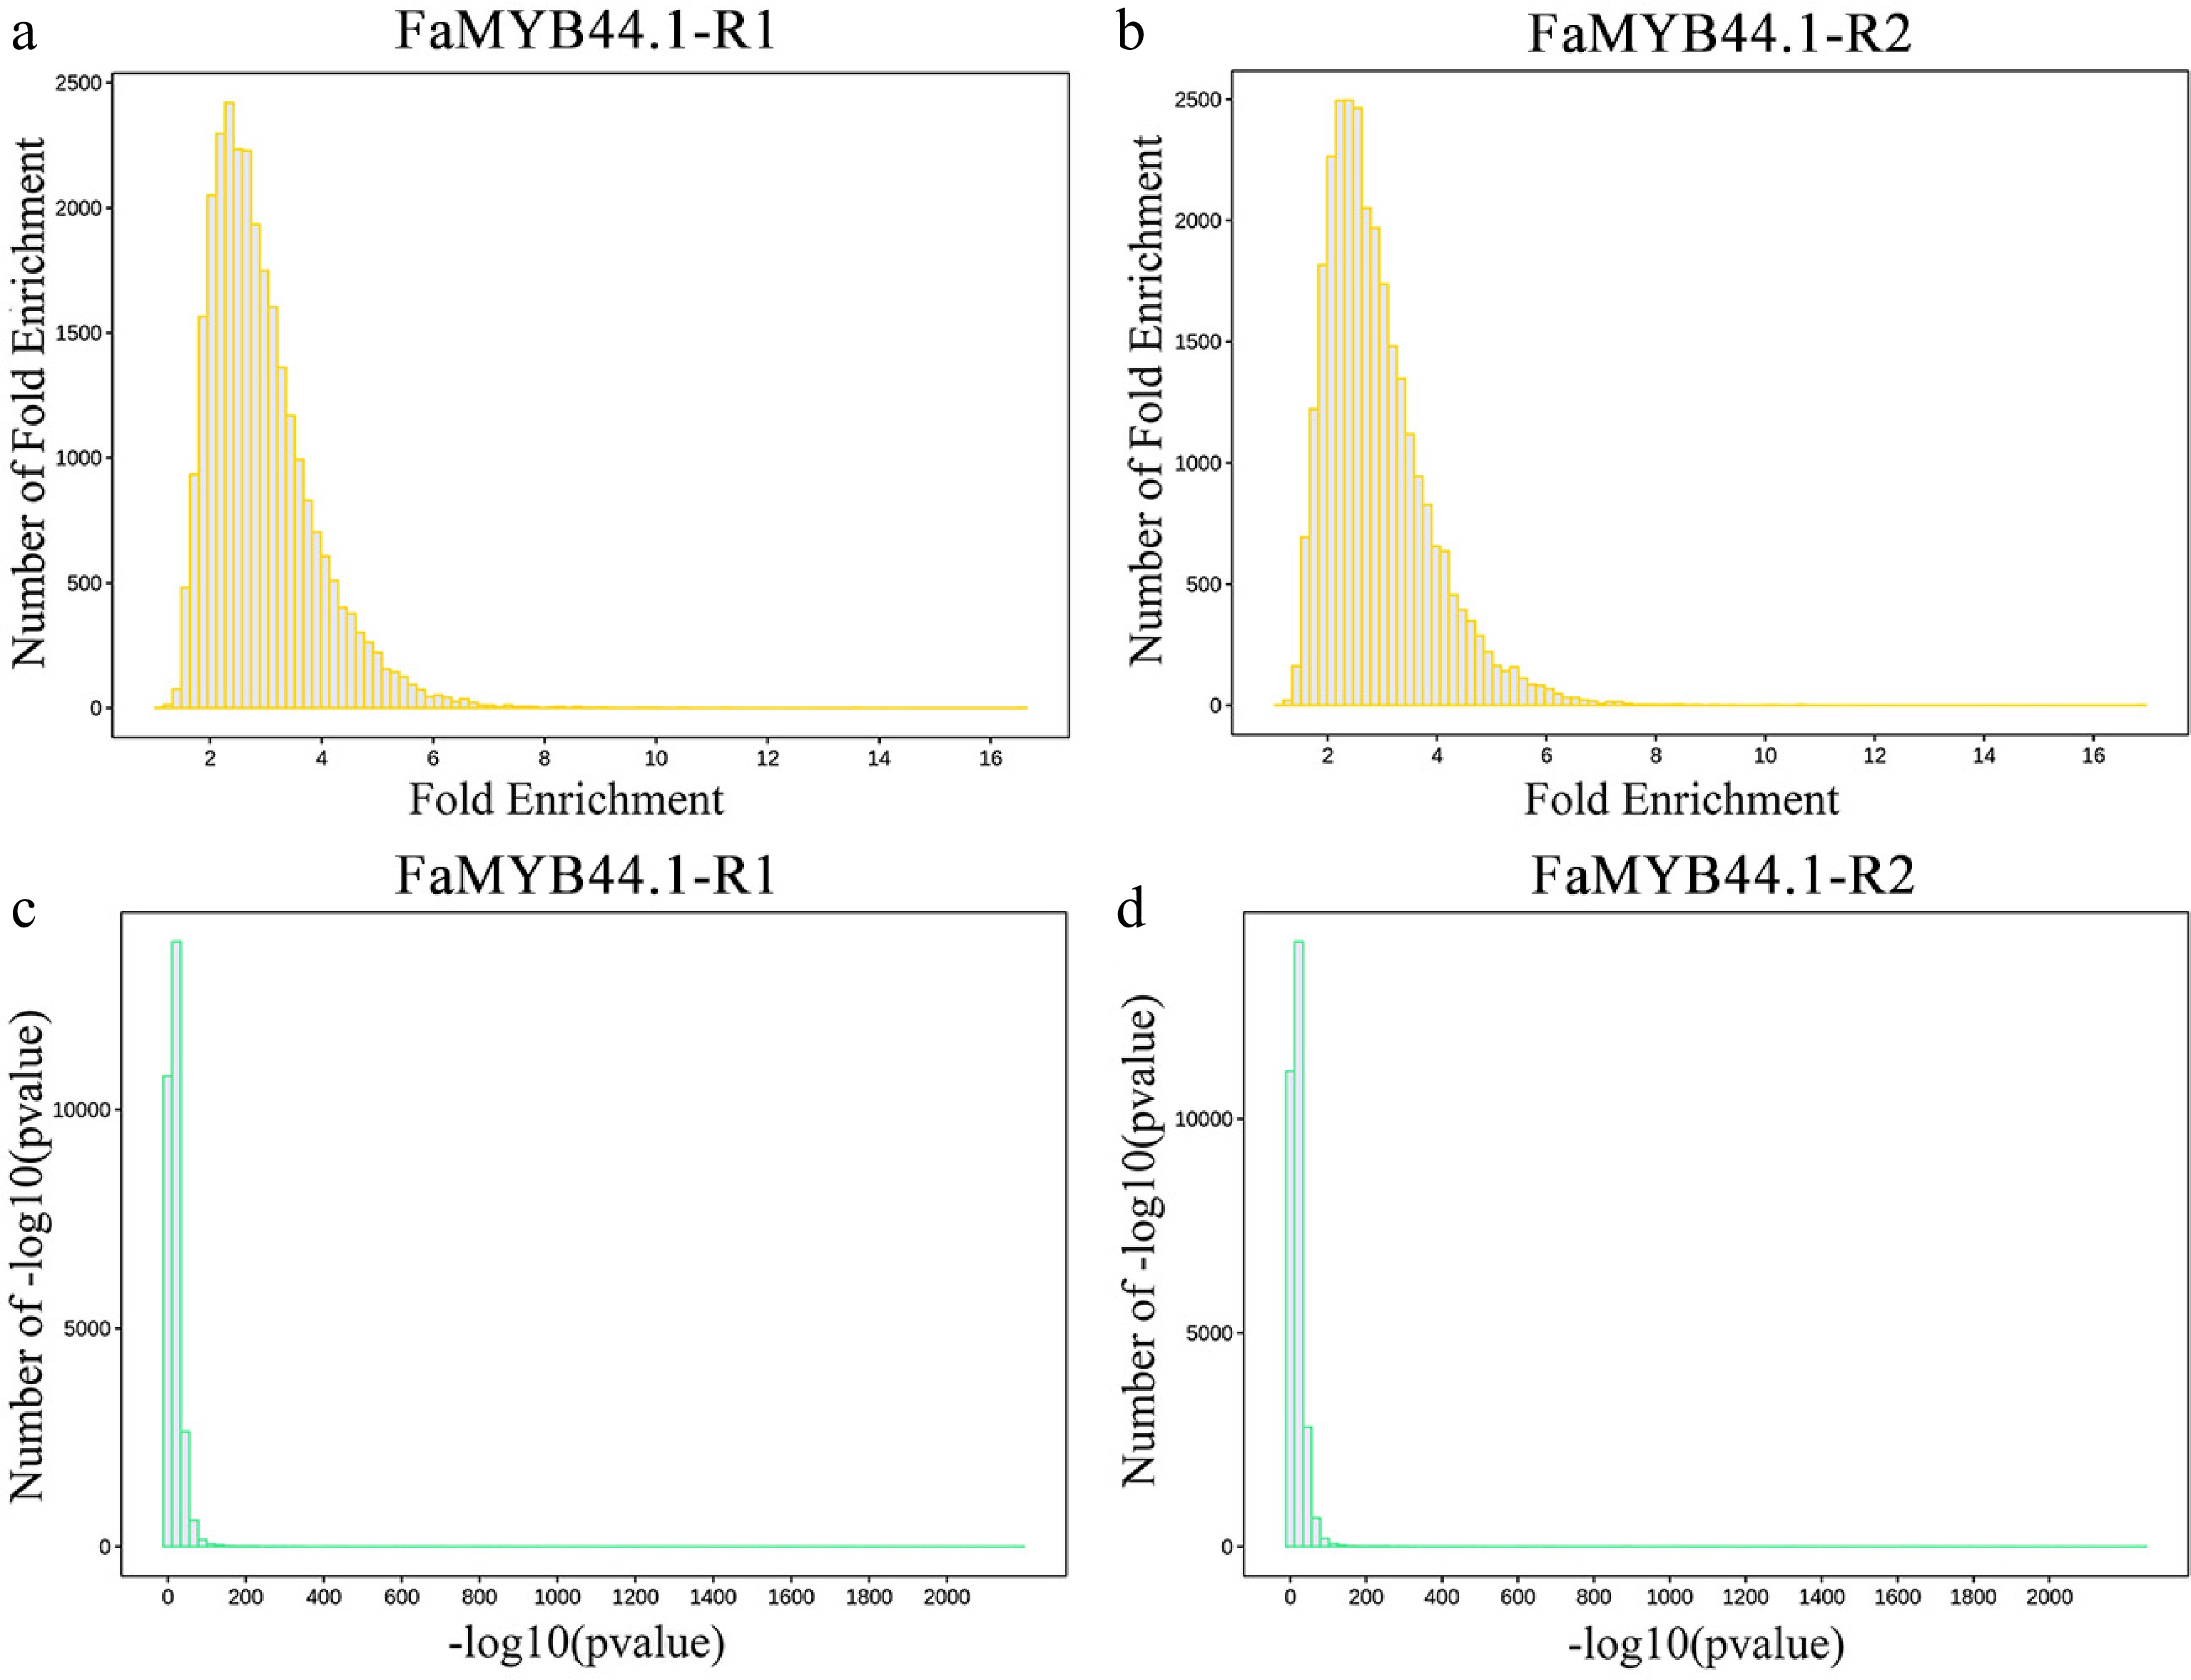
Figure 3.
Distribution of peak enrichment multiples and confidence levels. (a) FaMYB44.1-R1 fold enrichment distribution, with peaks predominantly ranging from two to six folds. (b) FaMYB44.1-R2 fold enrichment distribution, exhibiting a comparable peak concentration. (c) FaMYB44.1-R1 –log10(p-value) distribution, demonstrating significant peaks concentrated between zero and 100. (d) FaMYB44.1-R2 –log10(p-value) distribution, reflecting a similar significant peak concentration as observed in FaMYB44.1-R1.
-
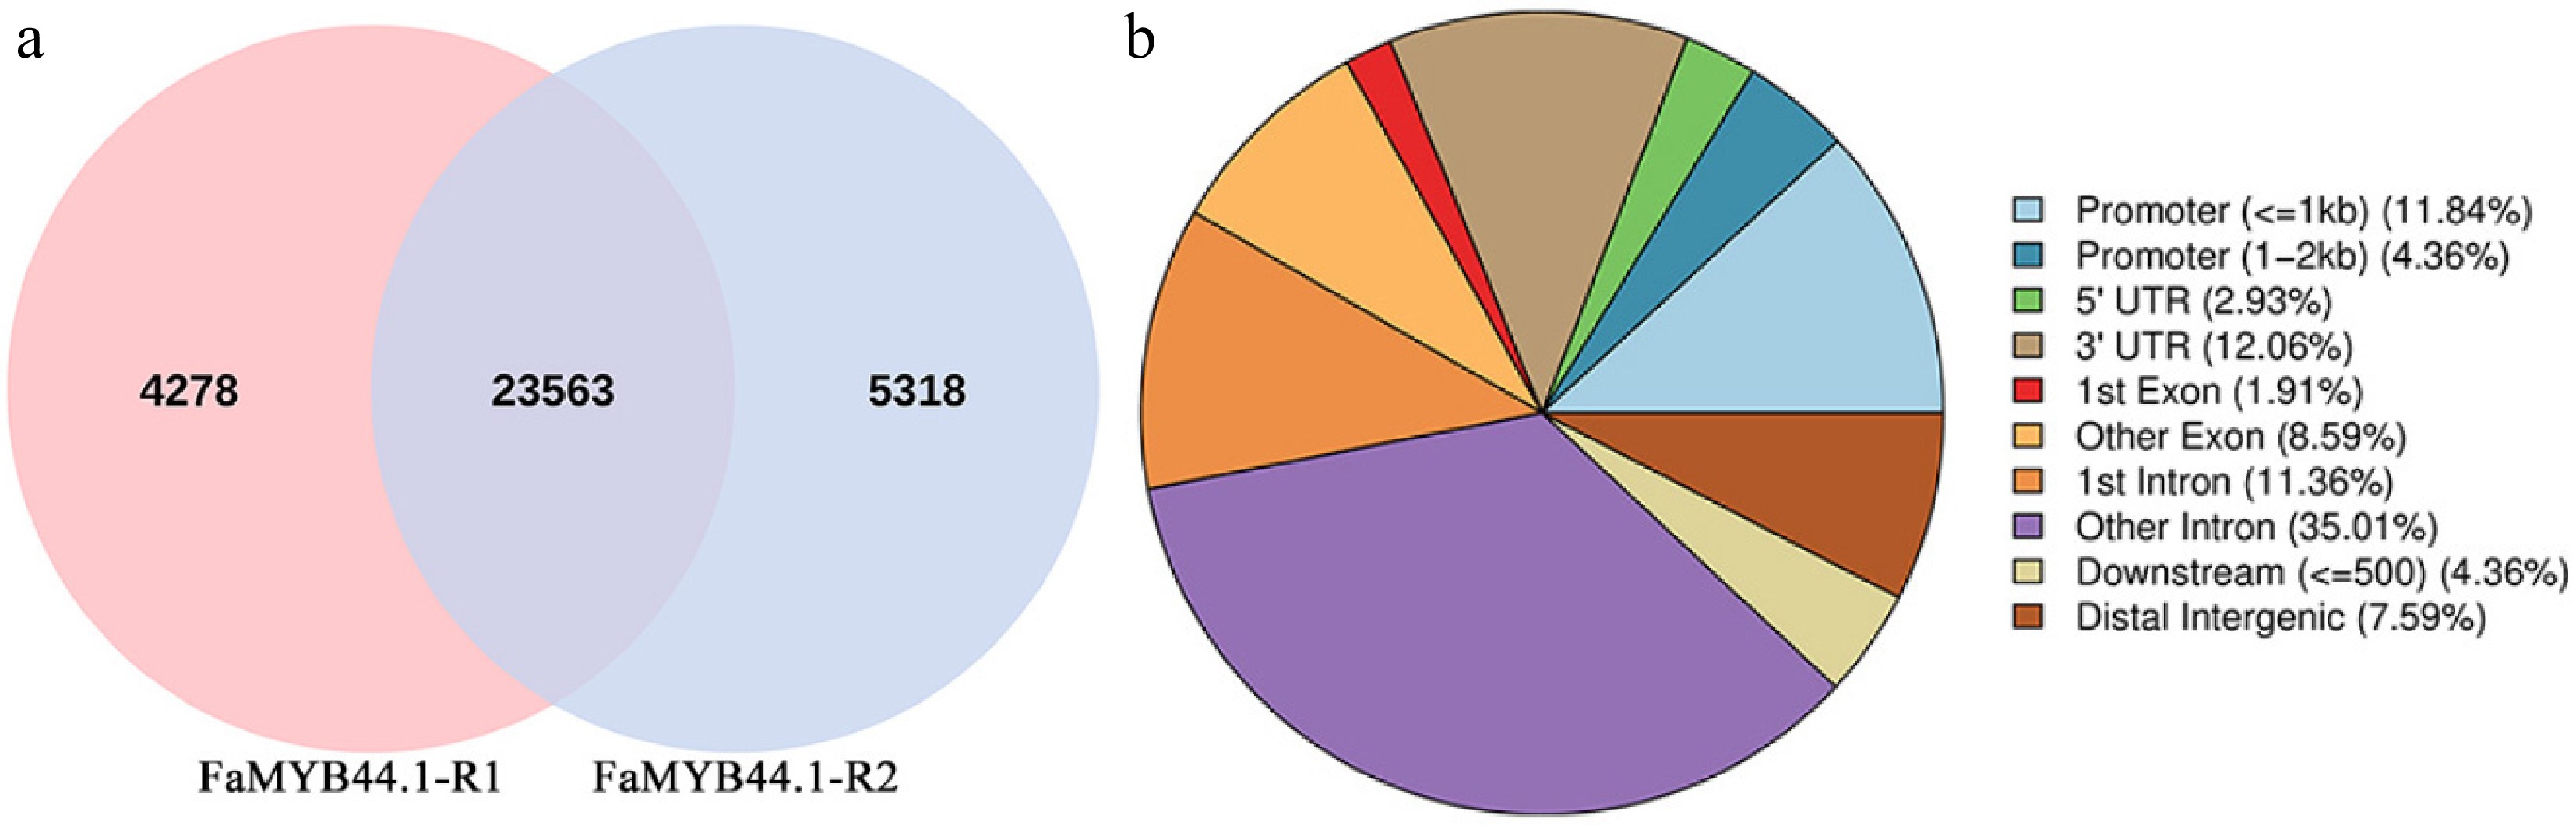
Figure 4.
Venn diagram of peaks and pie chart of peak distribution on gene functional elements. (a) Venn diagram depicting 4,278 unique peaks for FaMYB44.1-R1, 5,318 for FaMYB44.1-R2, and 23,563 shared peaks. (b) Pie chart illustrating peak distribution across gene elements, with intronic regions comprising 46.37%, promoters 16.20%, and UTRs 14.99%, while downstream peaks constitute the smallest proportion at 4.36%.
-
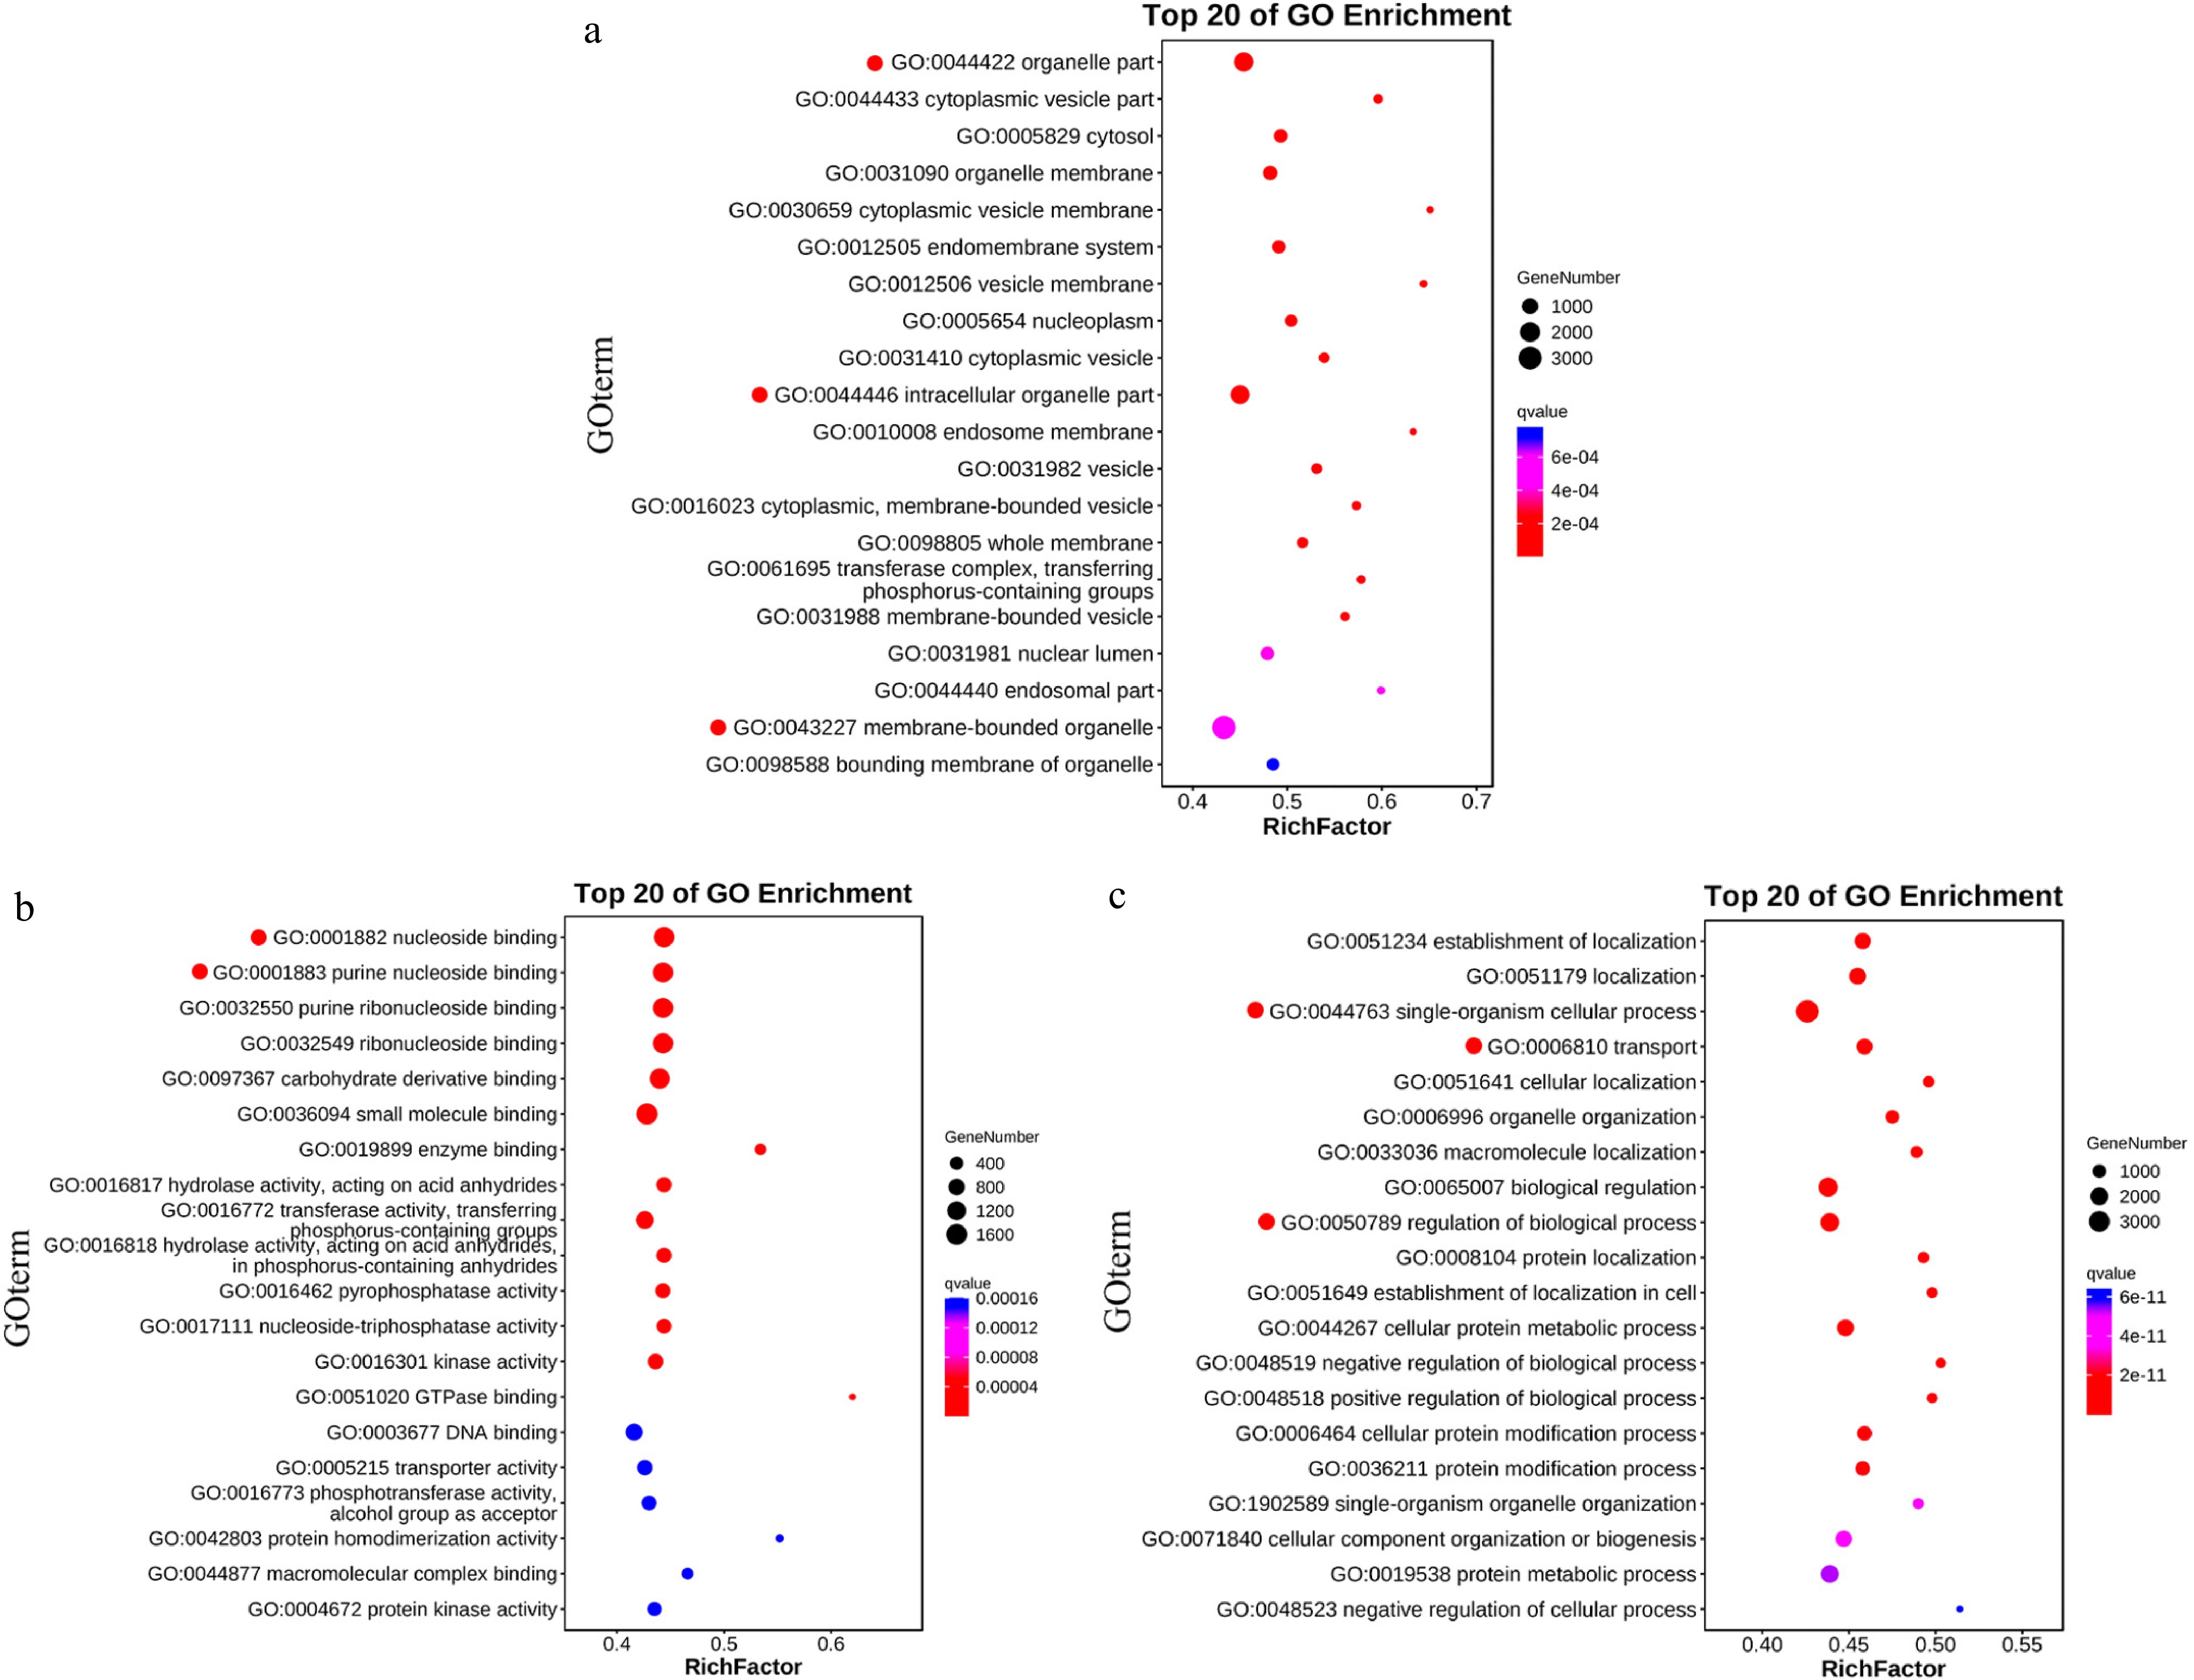
Figure 5.
Enrichment bubble chart. (a) CC enrichment demonstrates significant representation in organelle parts, intracellular organelle parts, and membrane-bound organelles. (b) MF enrichment indicates substantial enrichment in nucleoside binding and purine nucleoside binding. (c) BP enrichment reveals notable representation in cellular processes of single organisms, transport, and regulation of biological processes.
-
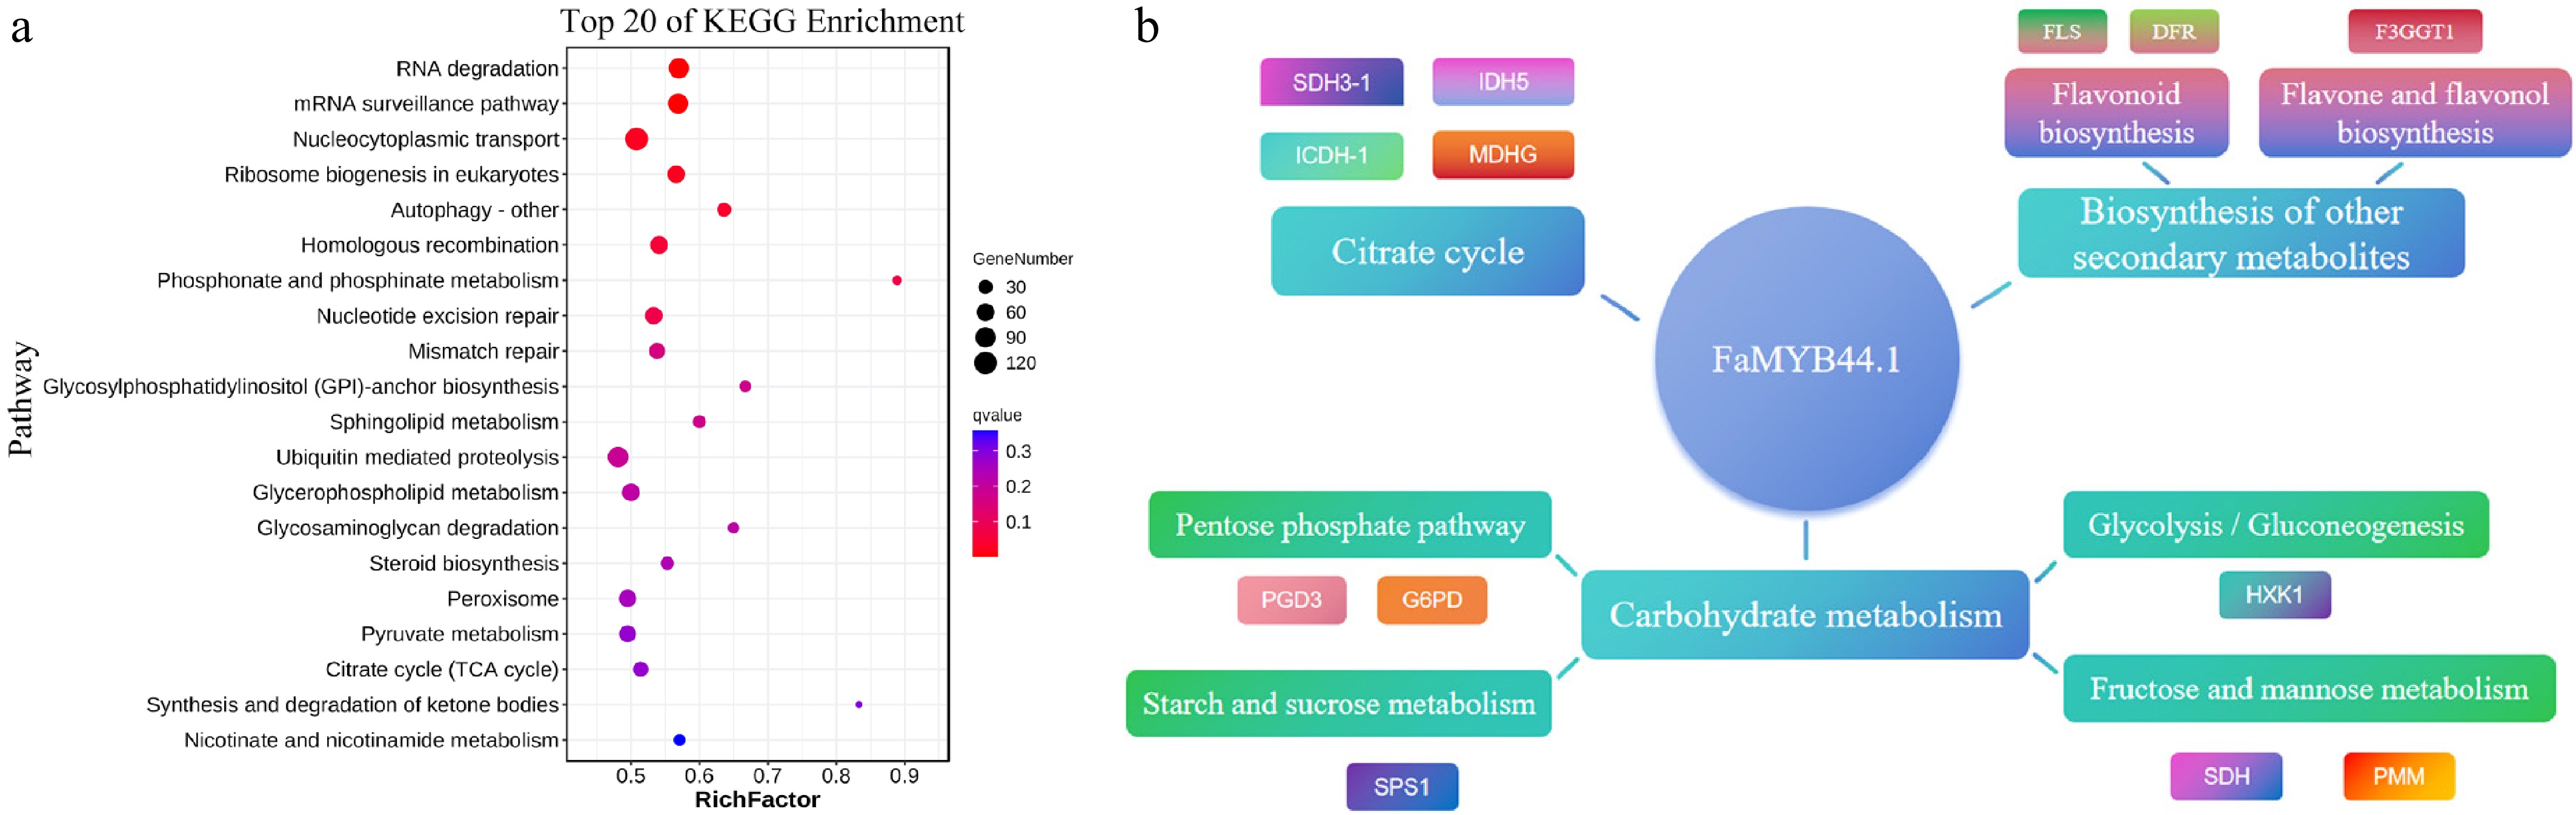
Figure 6.
KEGG pathway enrichment and regulatory network of FaMYB44.1. (a) Top 20 KEGG pathways enriched among peak-associated genes, emphasizing RNA degradation, mRNA surveillance, and nucleocytoplasmic transport. (b) Regulatory network centered on FaMYB44.1, linking to pathways involved in carbohydrate metabolism, citrate cycle, and secondary metabolite biosynthesis, with key target genes including SDH3-1, FLS, and SPS1.
-
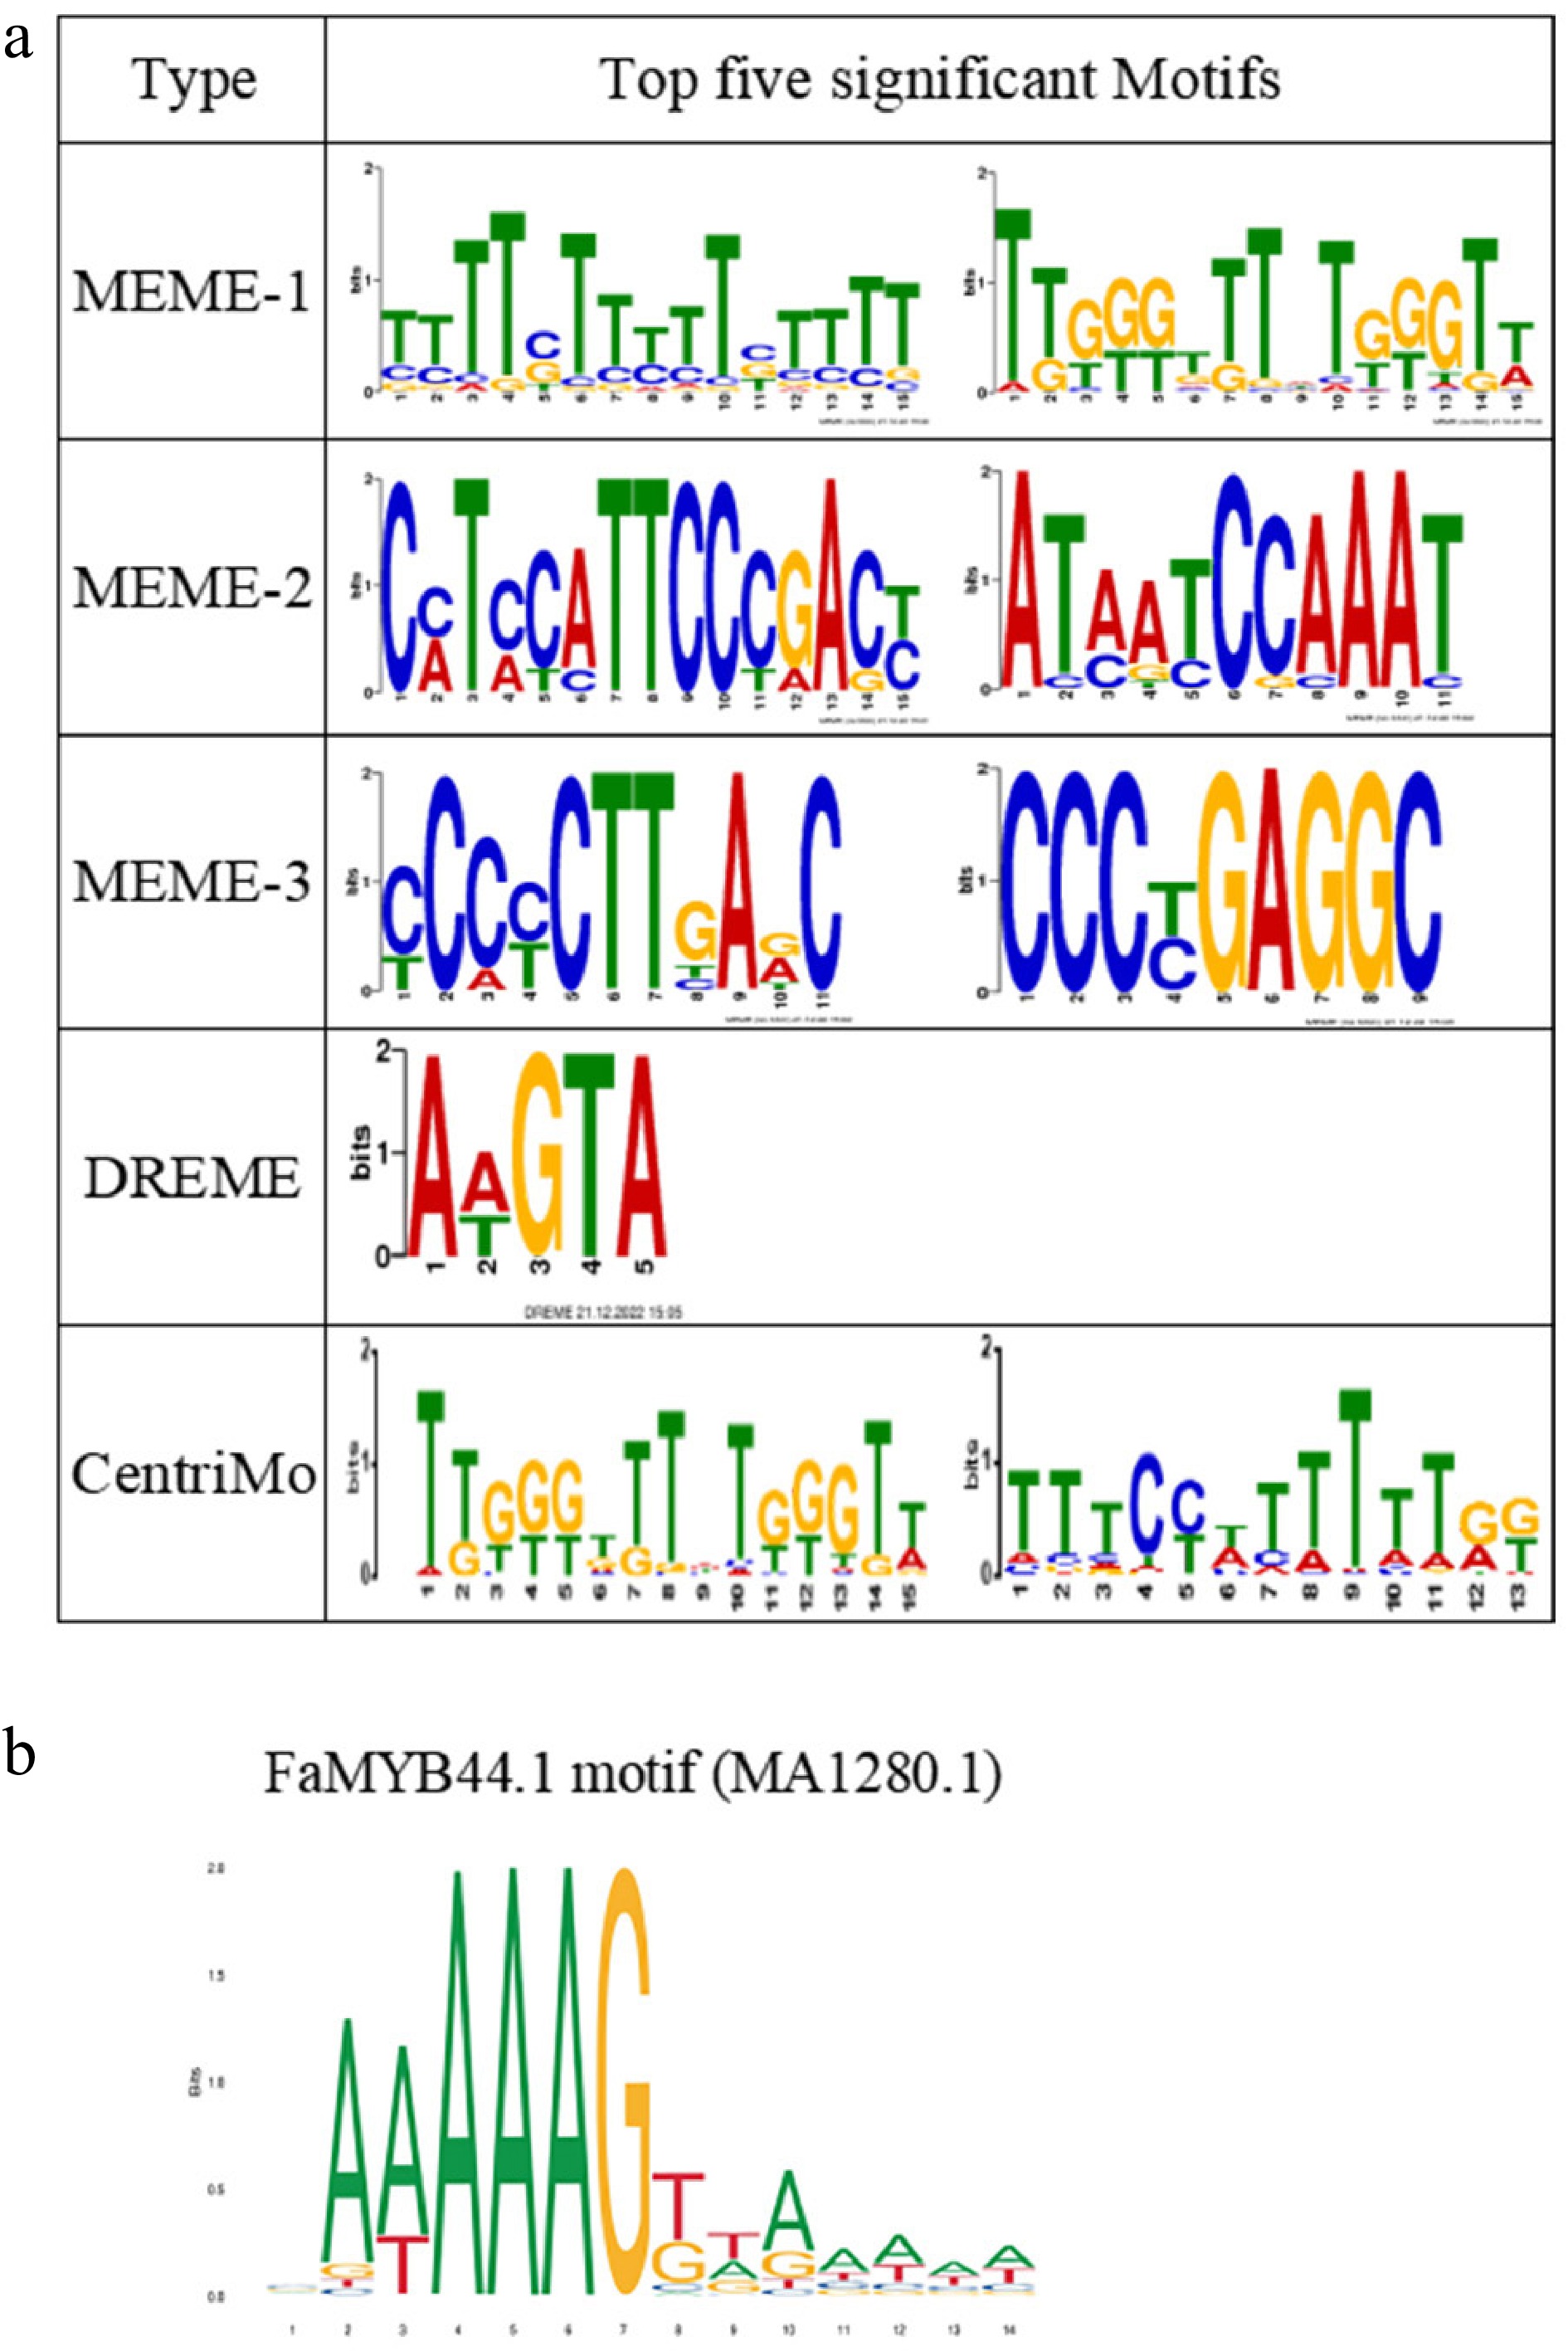
Figure 7.
Identification of FaMYB44.1 DNA binding motifs. (a) The five most significant motifs identified using MEME Suite, DREME, and CentriMo, displaying the consensus sequences and their frequency logos. (b) The FaMYB44.1 motif (MA1280.1) closely resembles the secondary motif of MEME-1, suggesting its potential binding site in strawberry.
Figures
(7)
Tables
(0)