-
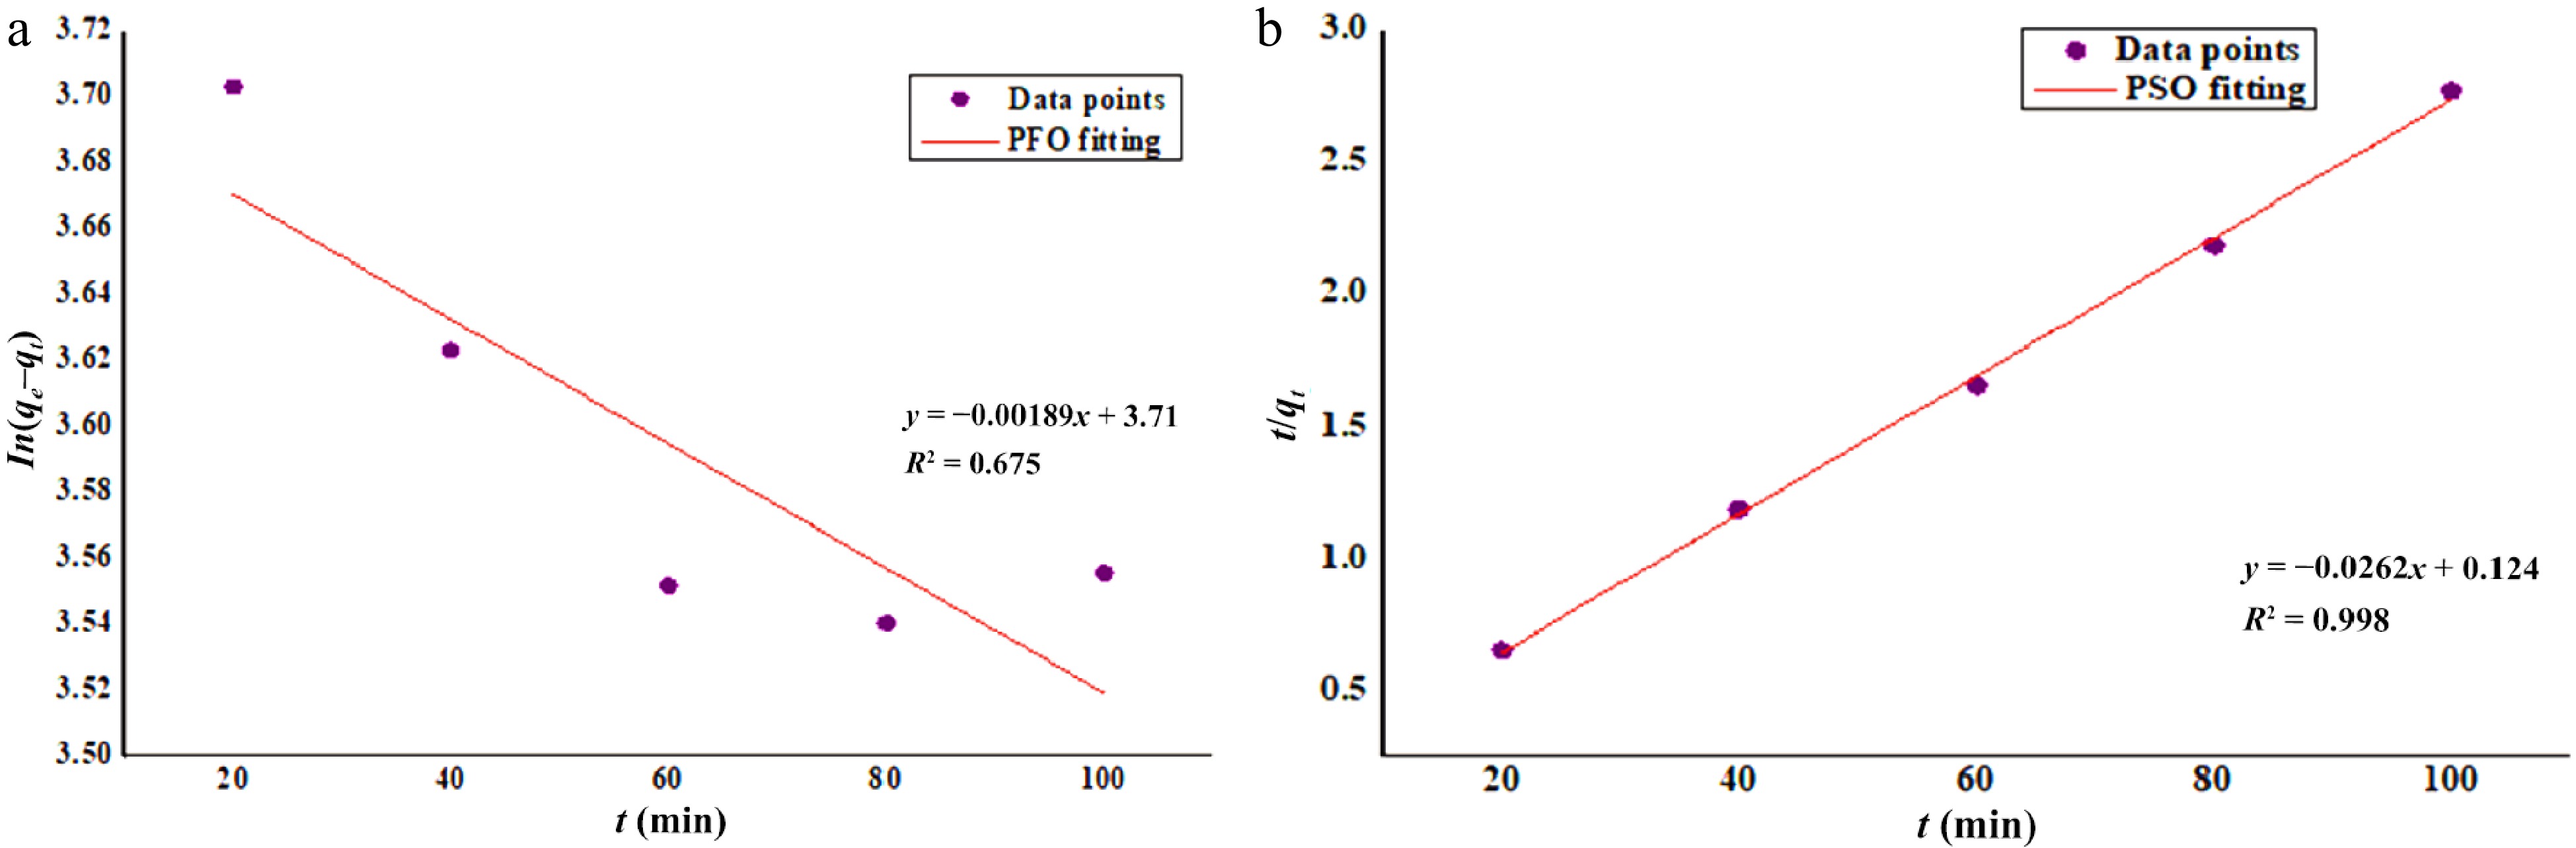
Figure 1.
Kinetics study of Zn2+ biosorption onto DAFM (a) PFO and (b) PSO.
-
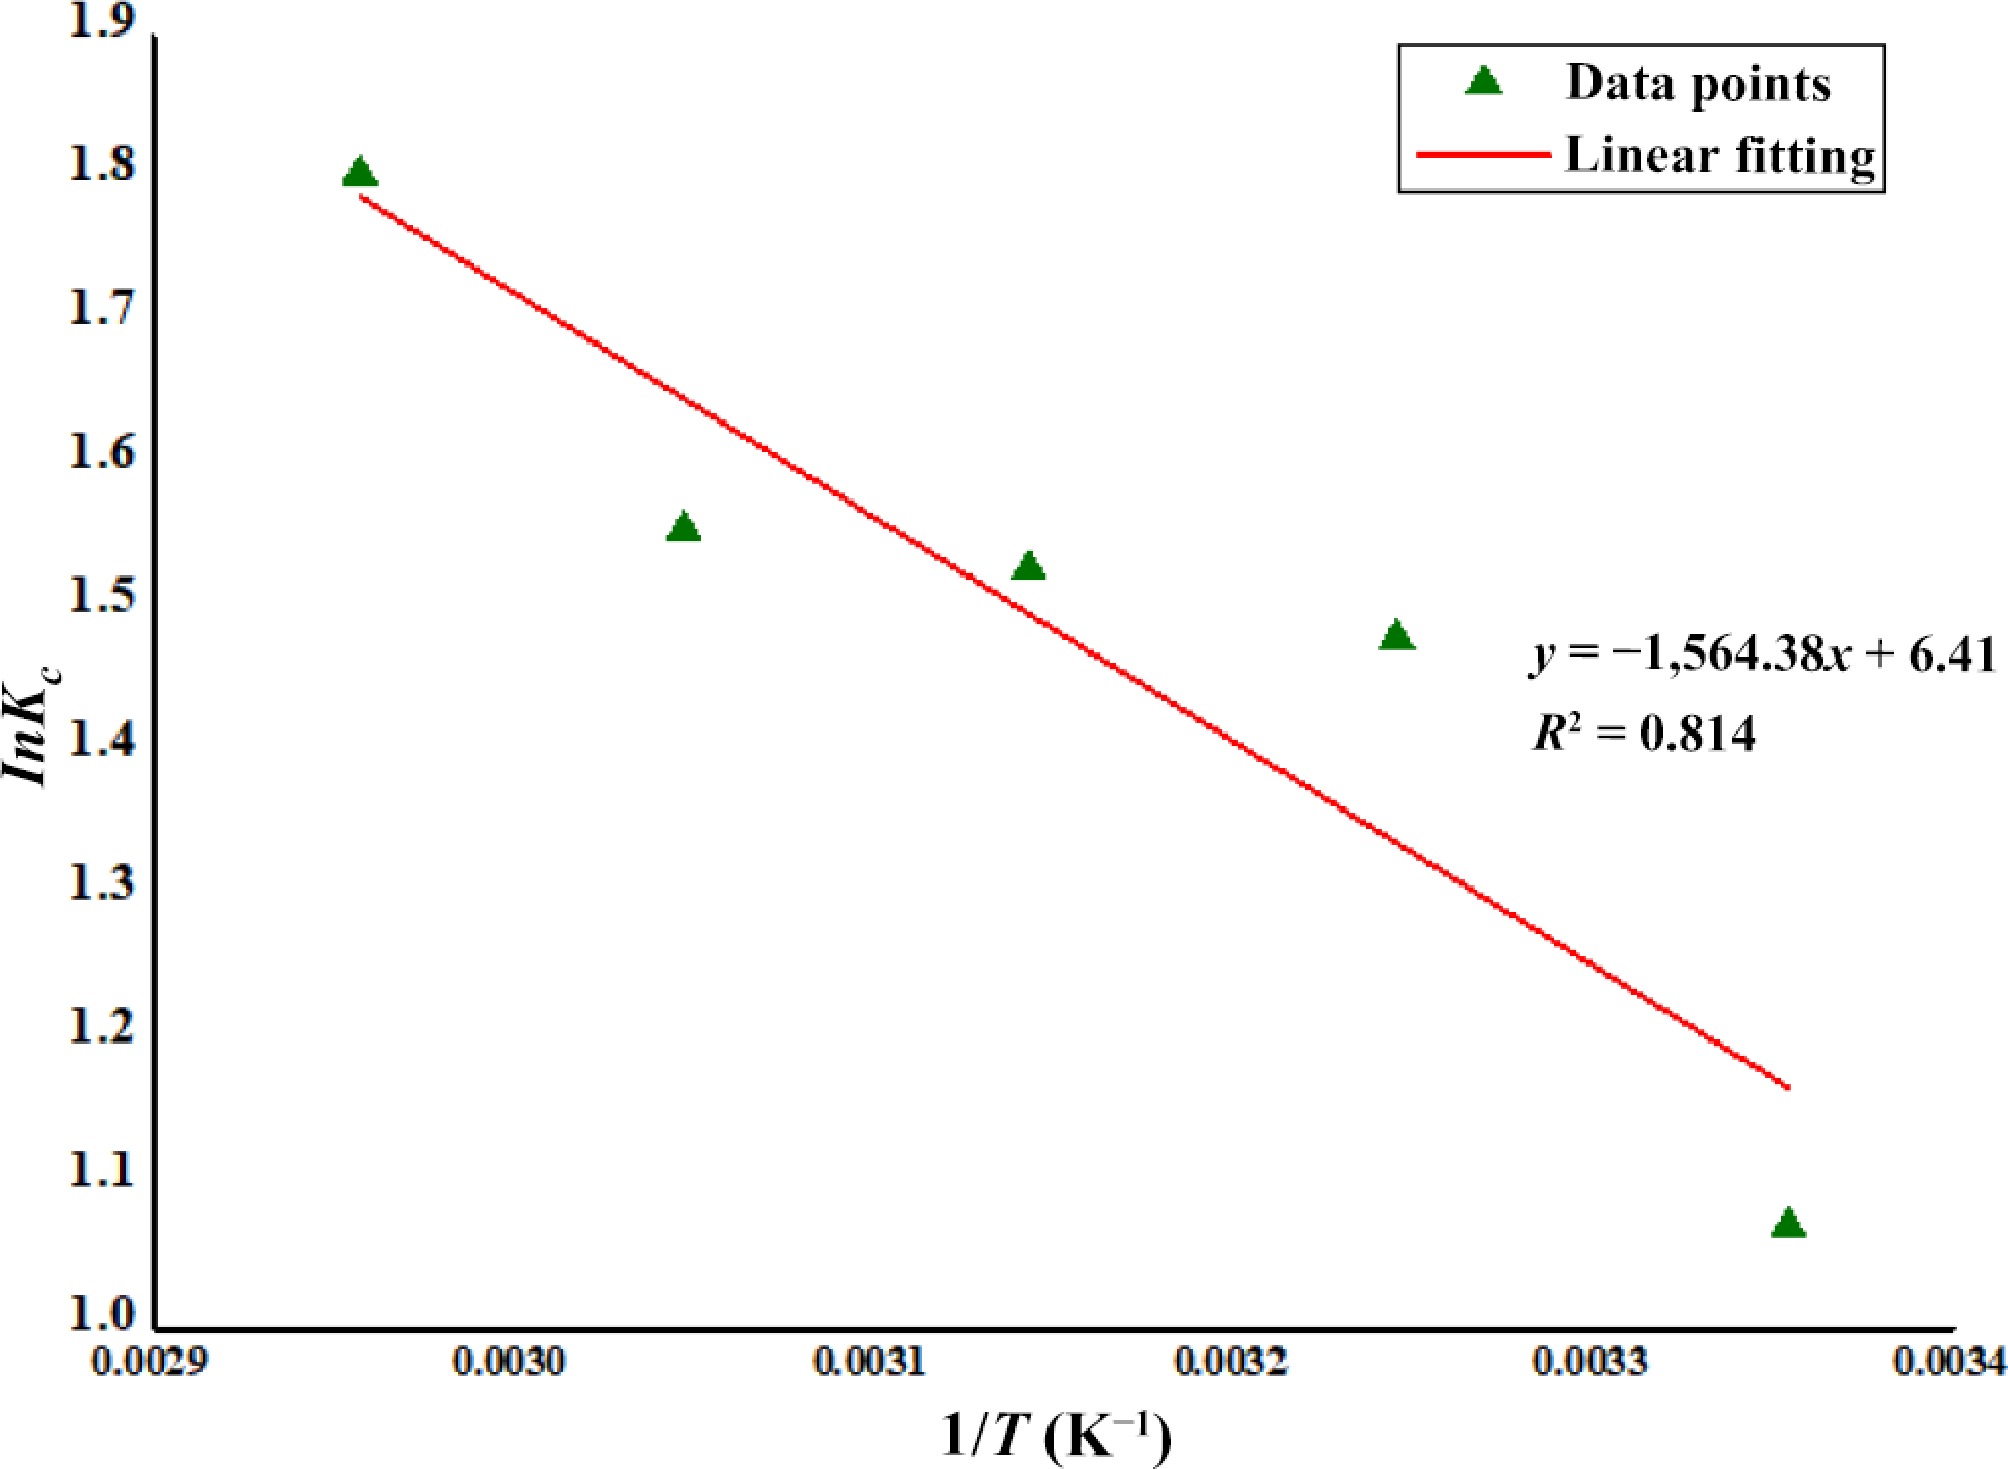
Figure 2.
Thermodynamic study of Zn2+ biosorption using DAFM.
-
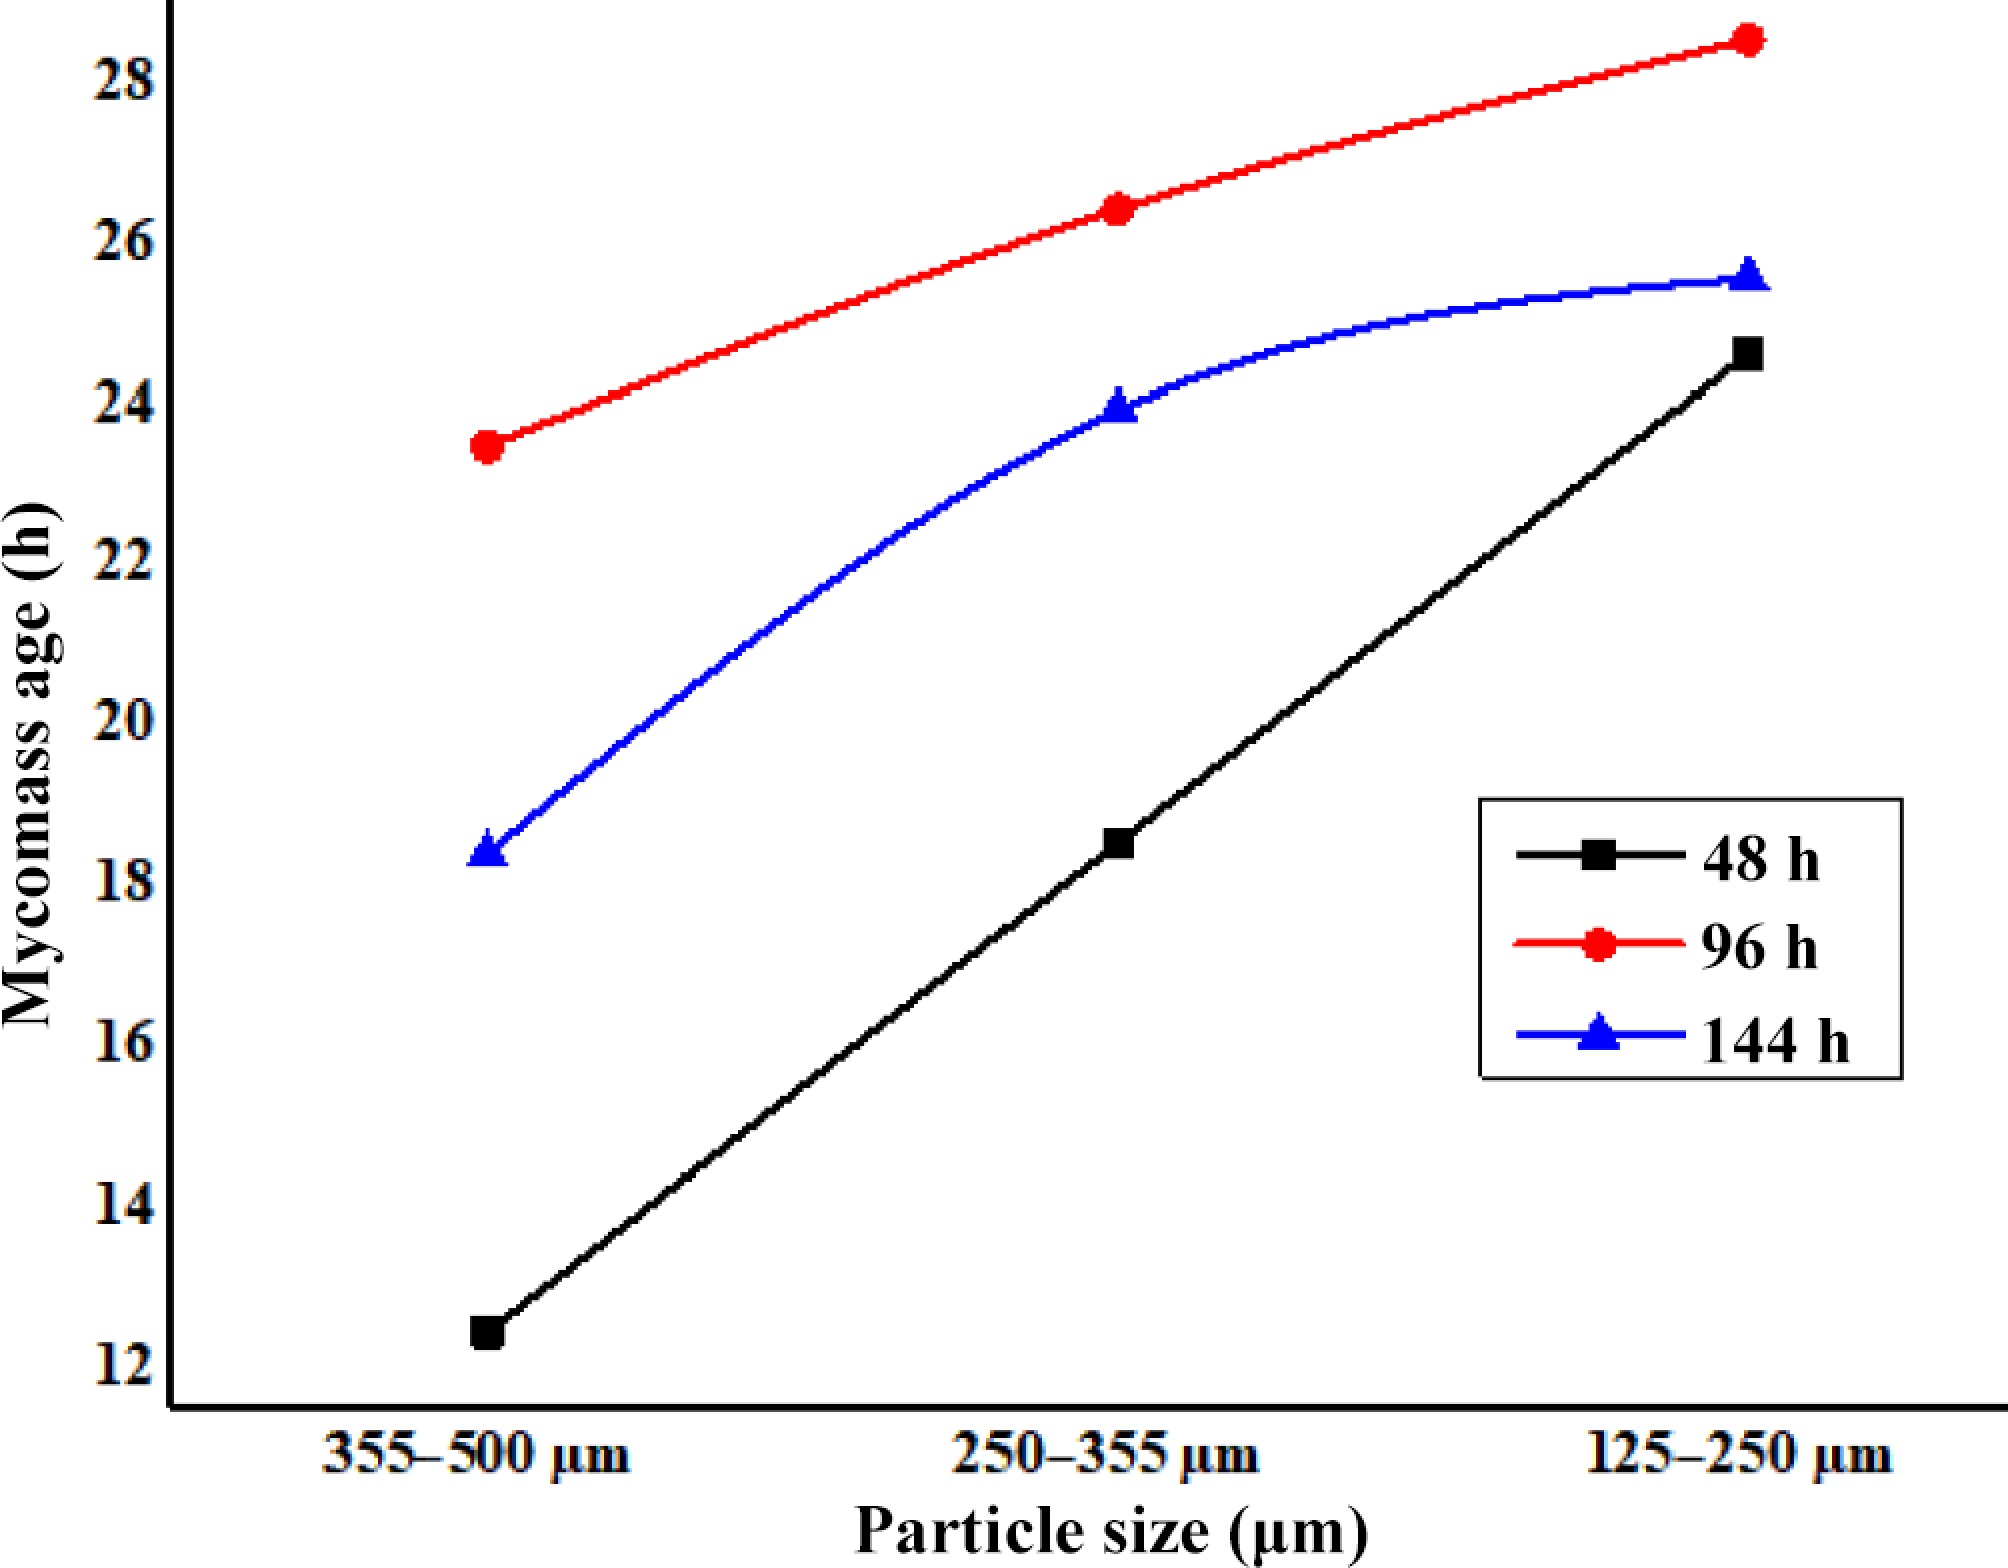
Figure 3.
Effect of age and particle size of DAFM on biosorption of Zn2+.
-
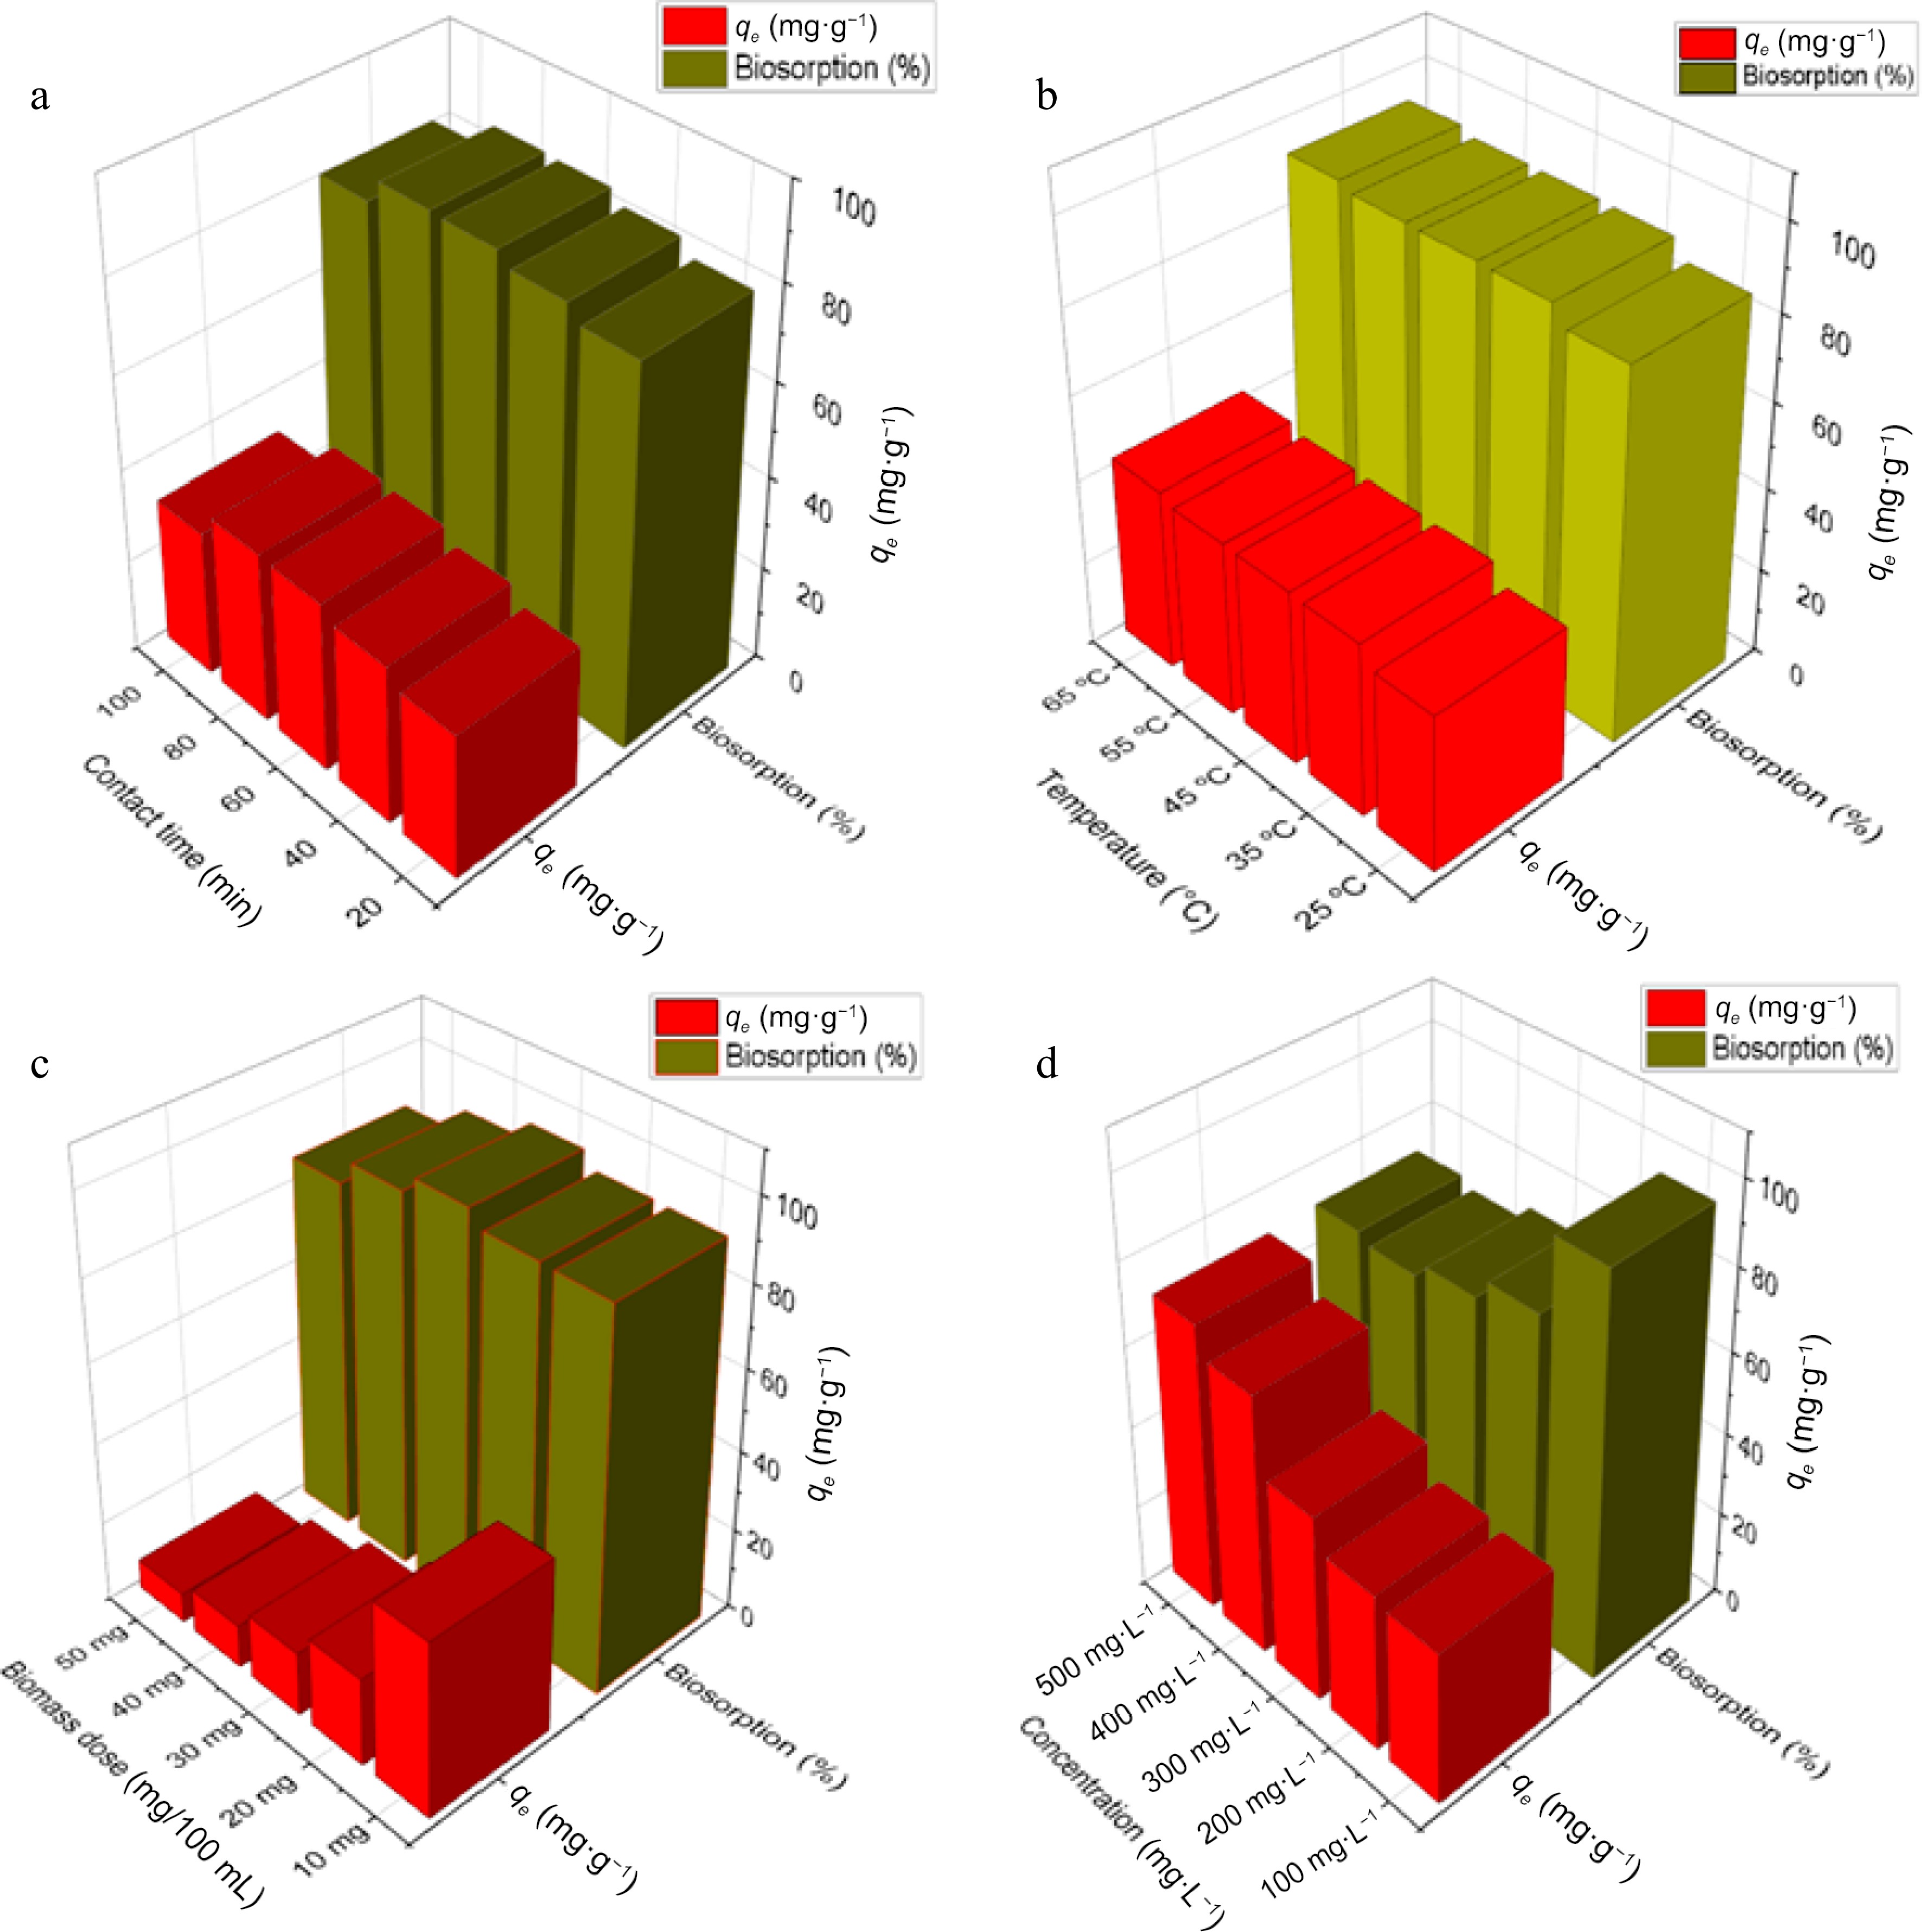
Figure 4.
Effect of different parameters on biosorption of Zn2+ by DAFM. (a) Effect of contact time; (b) effect of temperature; (c) effect of DAFM dose; and (d) effect of initial Zn2+ concentrations.
-
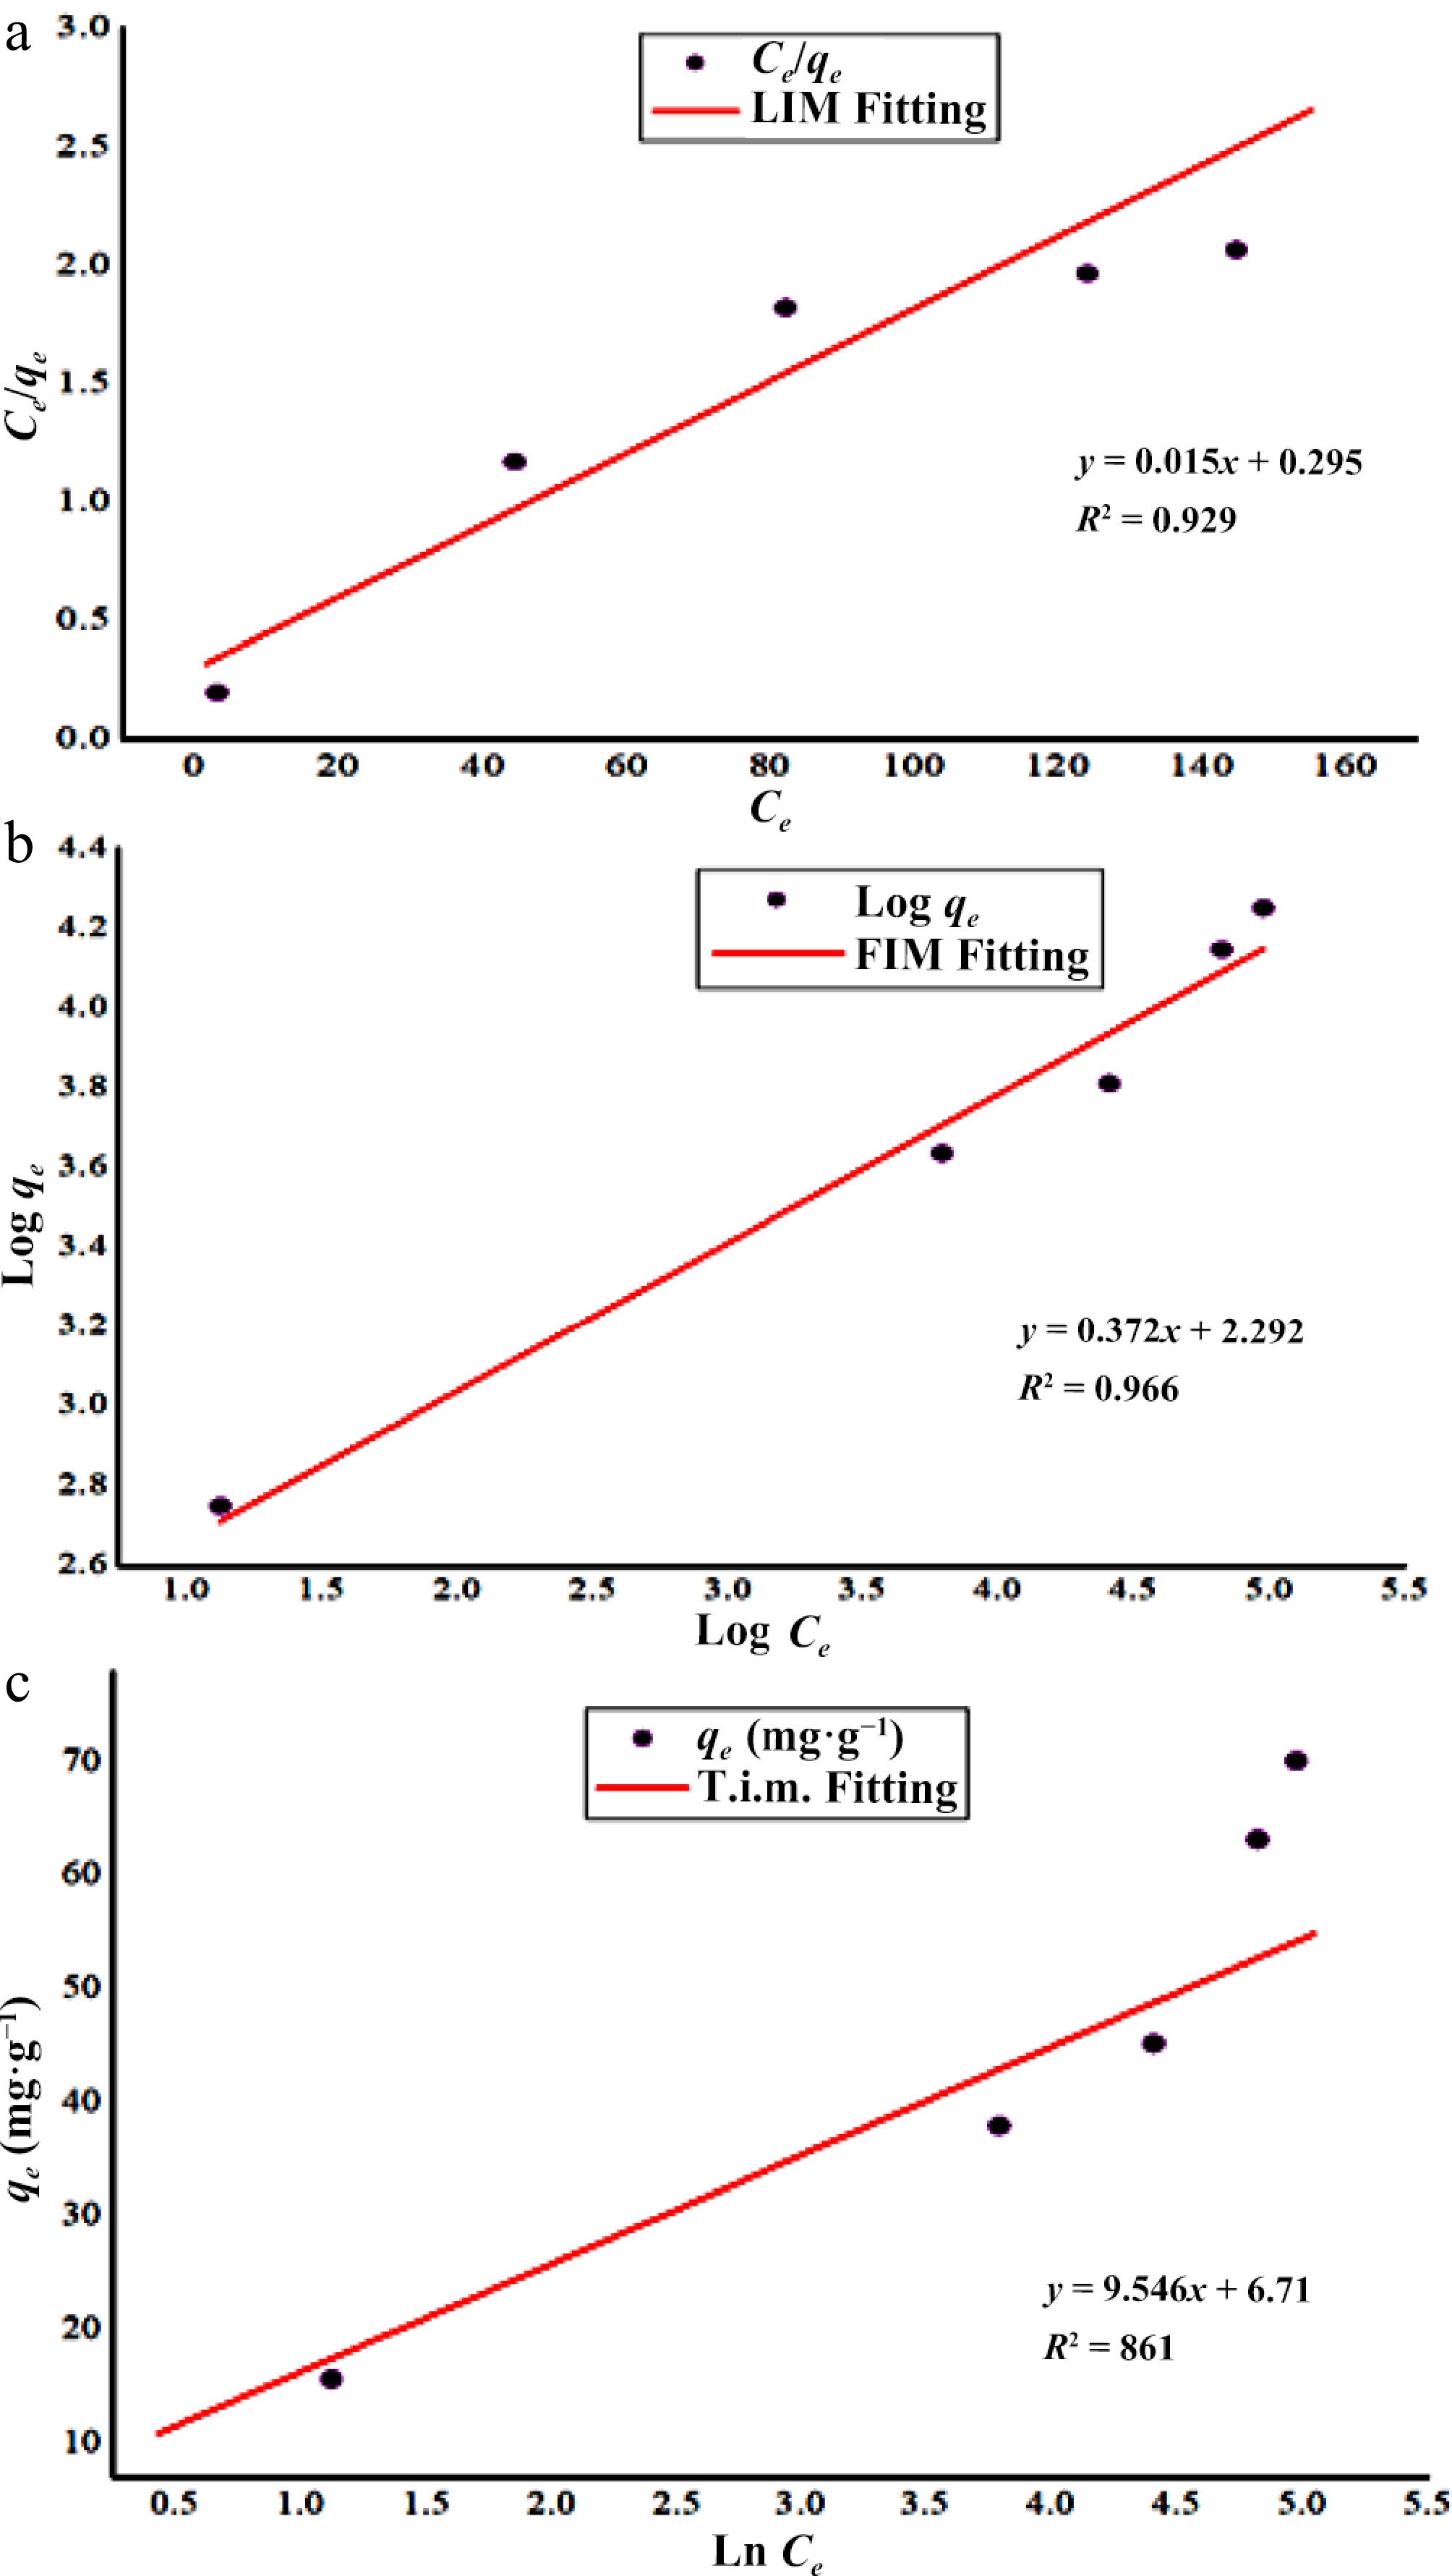
Figure 5.
Isothermic study of Zn2+ biosorption onto DAFM. (a) Langmuir's isotherm; (b) Freundlich's isotherm; and (c) Tempkin's isotherm.
-
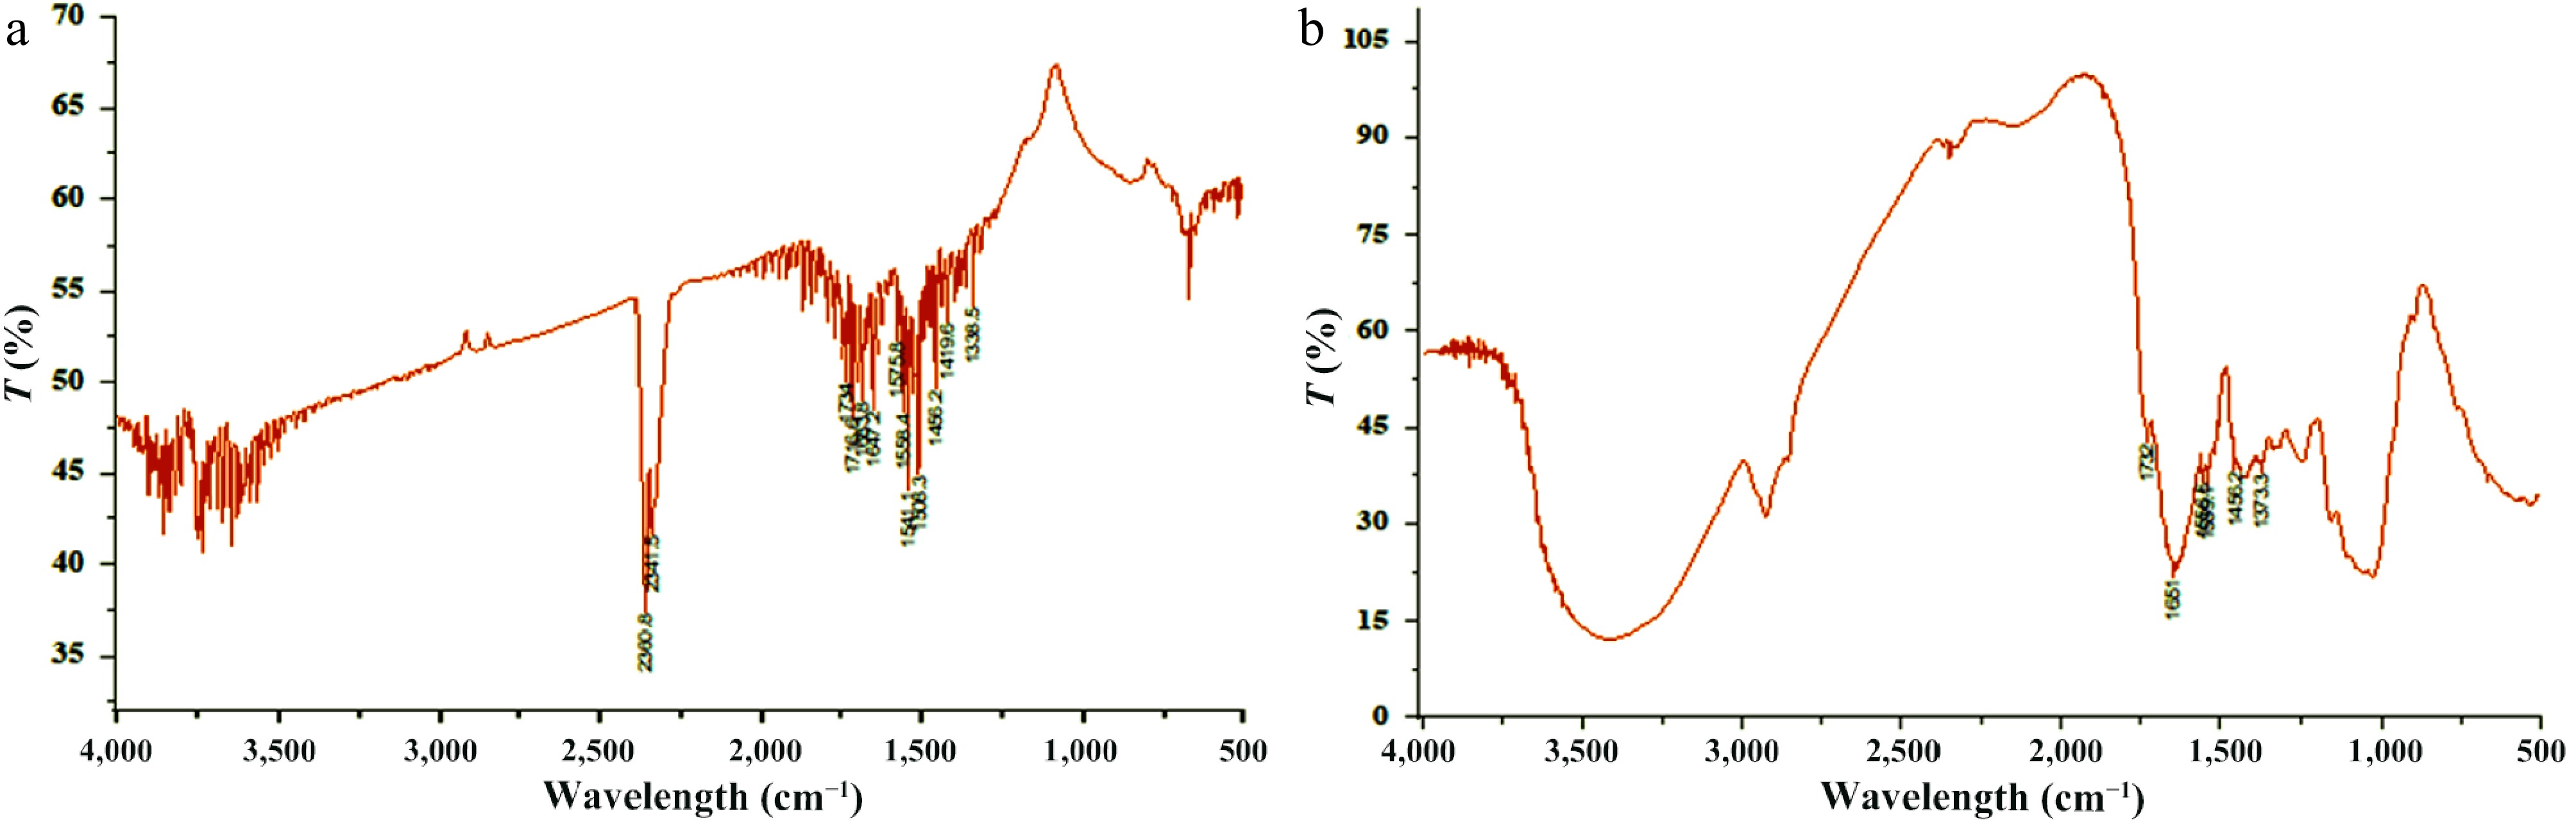
Figure 6.
FT-IR spectra of DAFM. (a) Before biosorption of Zn2+ and (b) after biosorption of Zn2+.
-
Name of the agency Type of water Discharge
limit (mg·L−1)Ref. World Health Organization (WHO) Drinking water 5 [4,8,9] Minimum National Standards (MINAS), Ministry of Environment and Forest, Government of India Surface water 5 [10] Minimum National Standards (MINAS), Ministry of Environment and Forest, Government of India Potable water 3 [11] Central Pollution Control Board, India Wastewater 5 [12] United States Environment Protection Agency Drinking water 5 Table 1.
Discharge limit of Zn2+ suggested by various government agencies.
-
LIM FIM TIM qe (exp.) (mg·g−1) = 70.13 qmax (mg·g−1) = 65.79 KF (L·mg−1) = 196.47 BT (J·mol−1) = 9.55 KL (L·mg−1) = 0.51 1/n = 0.37 KT (L·mg−1) = 2.0 R2 = 0.929 R2 = 0.966 R2 = 0.861 Table 2.
The values of parameters of different isotherm models studied for biosorption of Zn2+ onto DAFM.
-
PFO PSO qe (exp.) (mg·g−1) = 70.13 qe (cal.) (mg·g−1) = 42.52 qe (cal.) (mg·g−1) = 38.21 K1 (g·mg–1·min−1) = 1.89 × 10⁻⁵ K2 (g·mg−1·min−1) = 0.01 R2 = 0.675 R2 = 0.998 Table 3.
Values of kinetic parameters for biosorption of Zn2+ onto DAFM.
-
Adsorbent T (K) ΔG‡
(kJ·mol−1)ΔH‡
(kJ·mol−1)ΔS‡
(J·K−1·mol−1)Correlation coefficient DAFM 298.15 −15.88 13.01 53.29 R2 = 0.814 308.15 −16.41 318.15 −16.94 328.15 −17.48 338.15 −18.01 Table 4.
Calculated thermodynamic parameters for Zn2+ biosorption onto DAFM.
-
Adsorbents Zn2+ removal %/
uptake (mg·g−1)Ref. Graphite-iron alloy 72.5% [79] Penicillium sp. 52.14 mg·g−1 [80] Aspergillus terreus 10.7 mg·g−1 [81] Microcystis aeruginosa 67 mg·g−1 [82] Gauva leaves 14.5 mg·g−1 [65] Aspergillus terreus 10.7 mg·g−1 [81] Tinospora cordifolia 87% [83] Agaricus biosporus biomass 19.61 mg·g−1 [84] Inula viscosa leaves 85% [20] Lantana camara leaves 2.778 mg·g−1 [85] Walnut carbon nanoparticles 90% [86] Sargassum myriocystum 86.67% [87] Spirulina platensis 50.7 mg·g−1 [78] Reynoutria japonica 17 mg·g−1 [88] Dalbergia sissoo sawdust 6.36 mg·g−1 [89] Pithophora cleveana 13.58 mg·g−1 [90] Groundnut husk ash 80.00% [91] Penicillium simplicissimum 1.25 mg·g−1 [92] DAFM 70.13 mg·g−1 Present study Table 5.
Comparable potential of some adsorbents for Zn2+ biosorption in recent years.
-
Functional groups Before biosorption After biosorption Functional groups involved in biosorption Stretching/
bending/
vibrationC−CH3 1 1 − − Aromatic azo 2 − 2 C−C stretch Sulfate 1 − 1 S=O stretch Sulfonyl chloride 1 − 1 S=O stretch Alcohol 1 1 − − Phenol 1 1 − − CH2 1 1 − − CH3 1 − 1 C=O stretch Carboxylic acid 5 3 2 C=O stretch Aromatic ring 2 1 1 C−C stretch Alkane 1 1 − − Nitro 4 2 2 N−O stretch Aliphatic azo 3 1 2 N=N stretch Aromatic/hetero rings 2 1 1 C−C stretch Amide 4 2 2 N−H bend Ketone 2 1 1 C−C stretch vibration C=C 1 1 − − C=N 1 1 − − Alkene 1 1 − − Imine 1 1 − − Urethane 1 − 1 N−H stretch Aldehyde 2 1 1 C=O stretch Ester 2 1 1 C=O stretch Aliphatic ester 1 1 − − P−H 2 − 2 C-H stretching vibration Total 44 of 25 types 23 of 19 types 21 of 15
types− Table 6.
Functional groups of DAFM before and after biosorption of Zn2+ and the involved functions groups with relevant stretching or bending/vibrations.
Figures
(6)
Tables
(6)