-
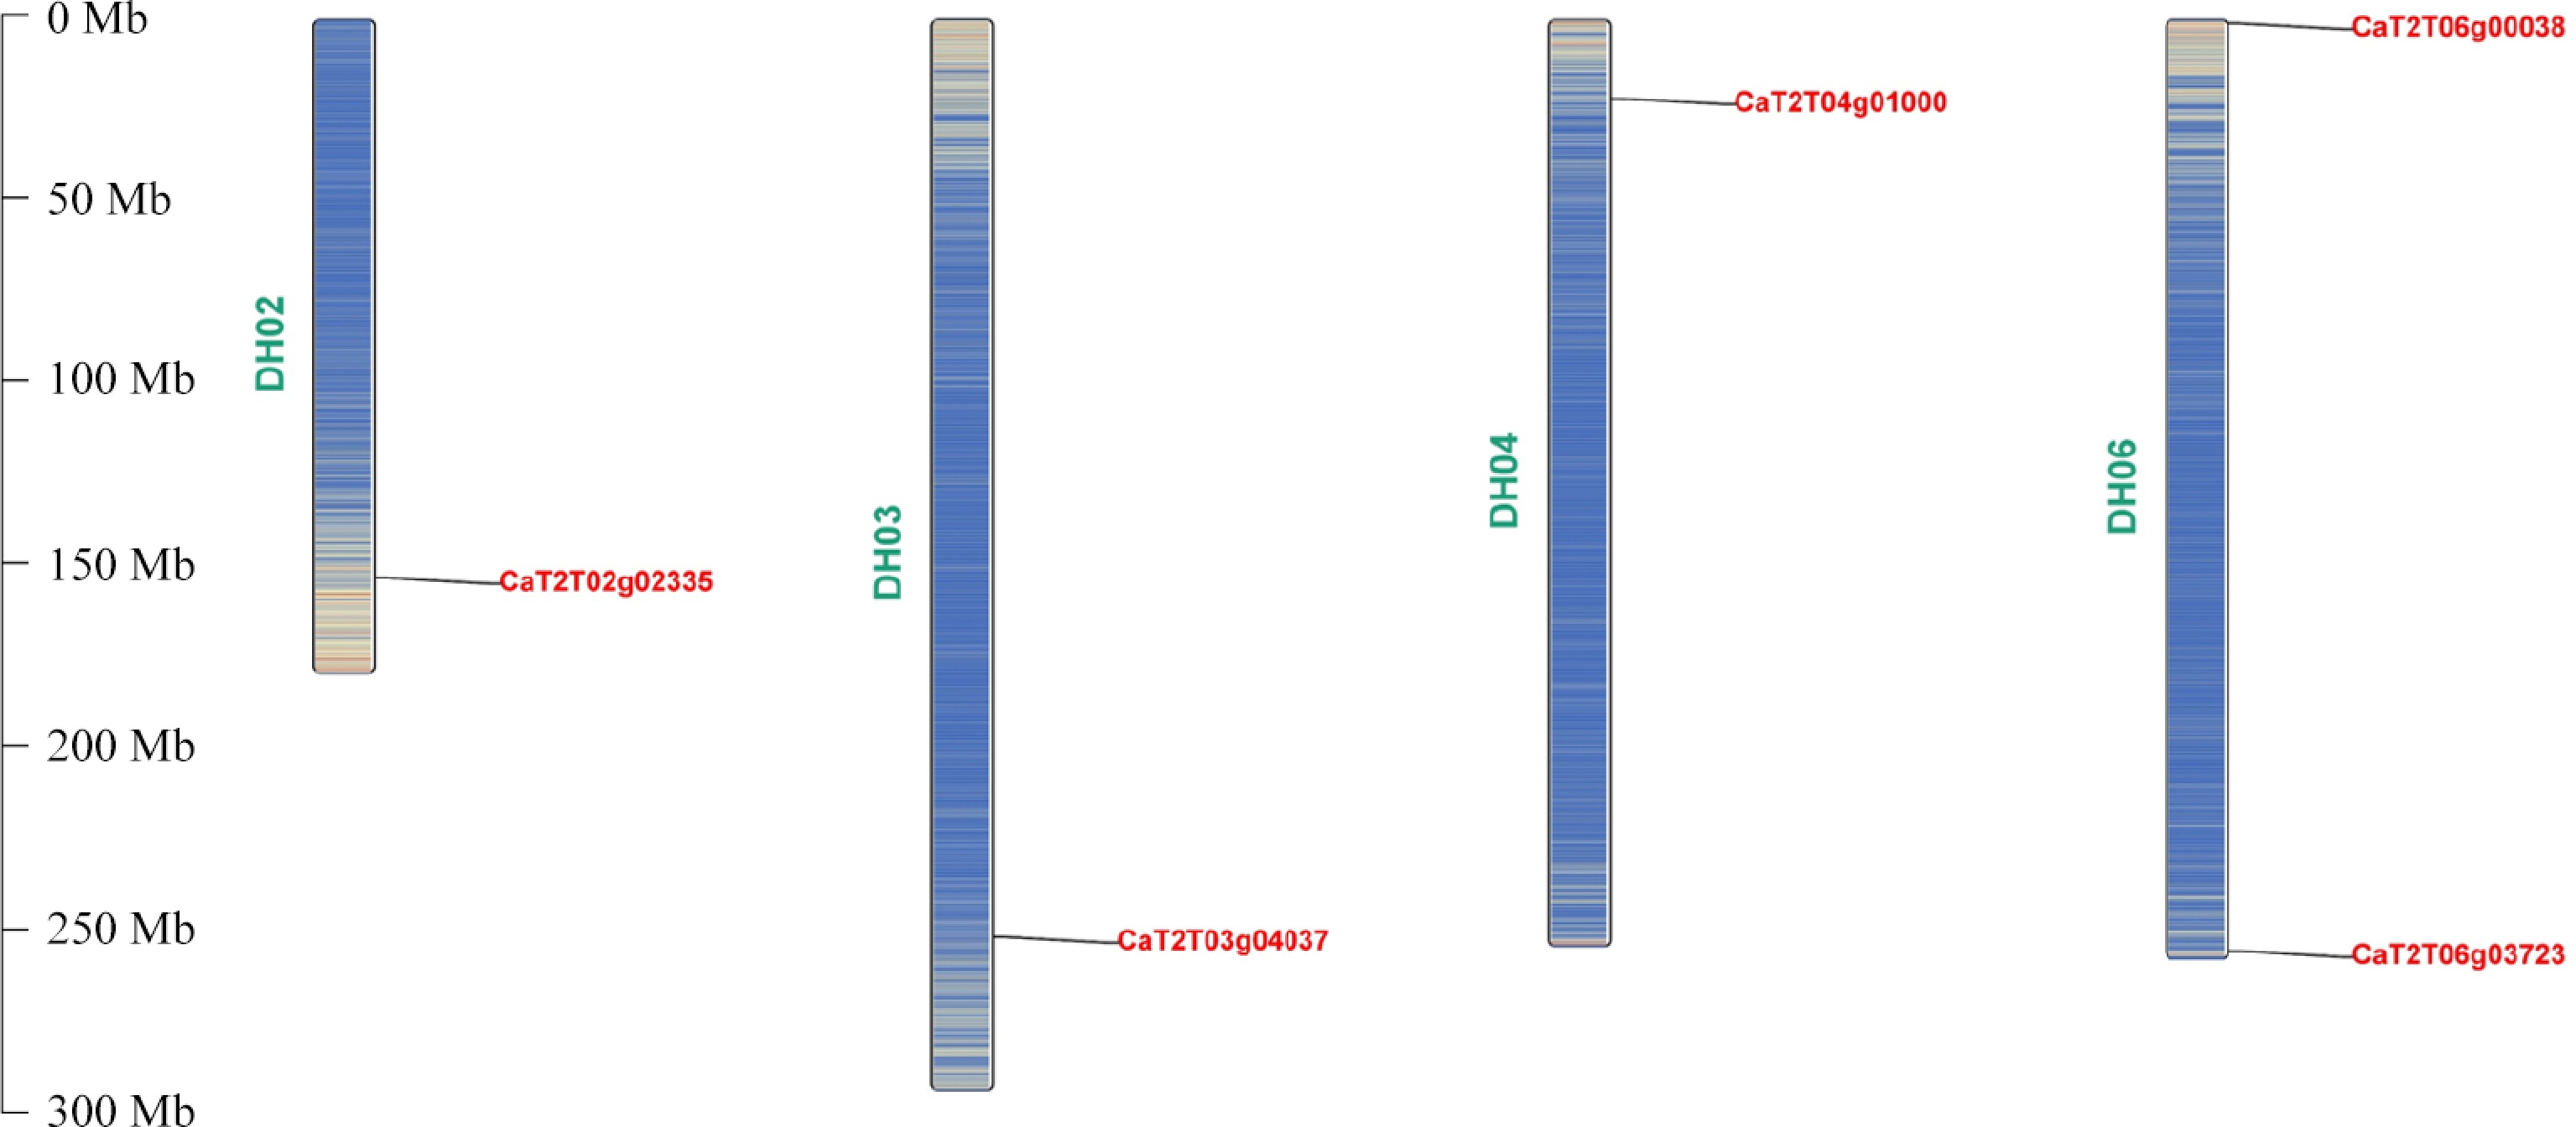
Figure 1.
Chromosomal location of the five CaTIR1/AFB genes.
-
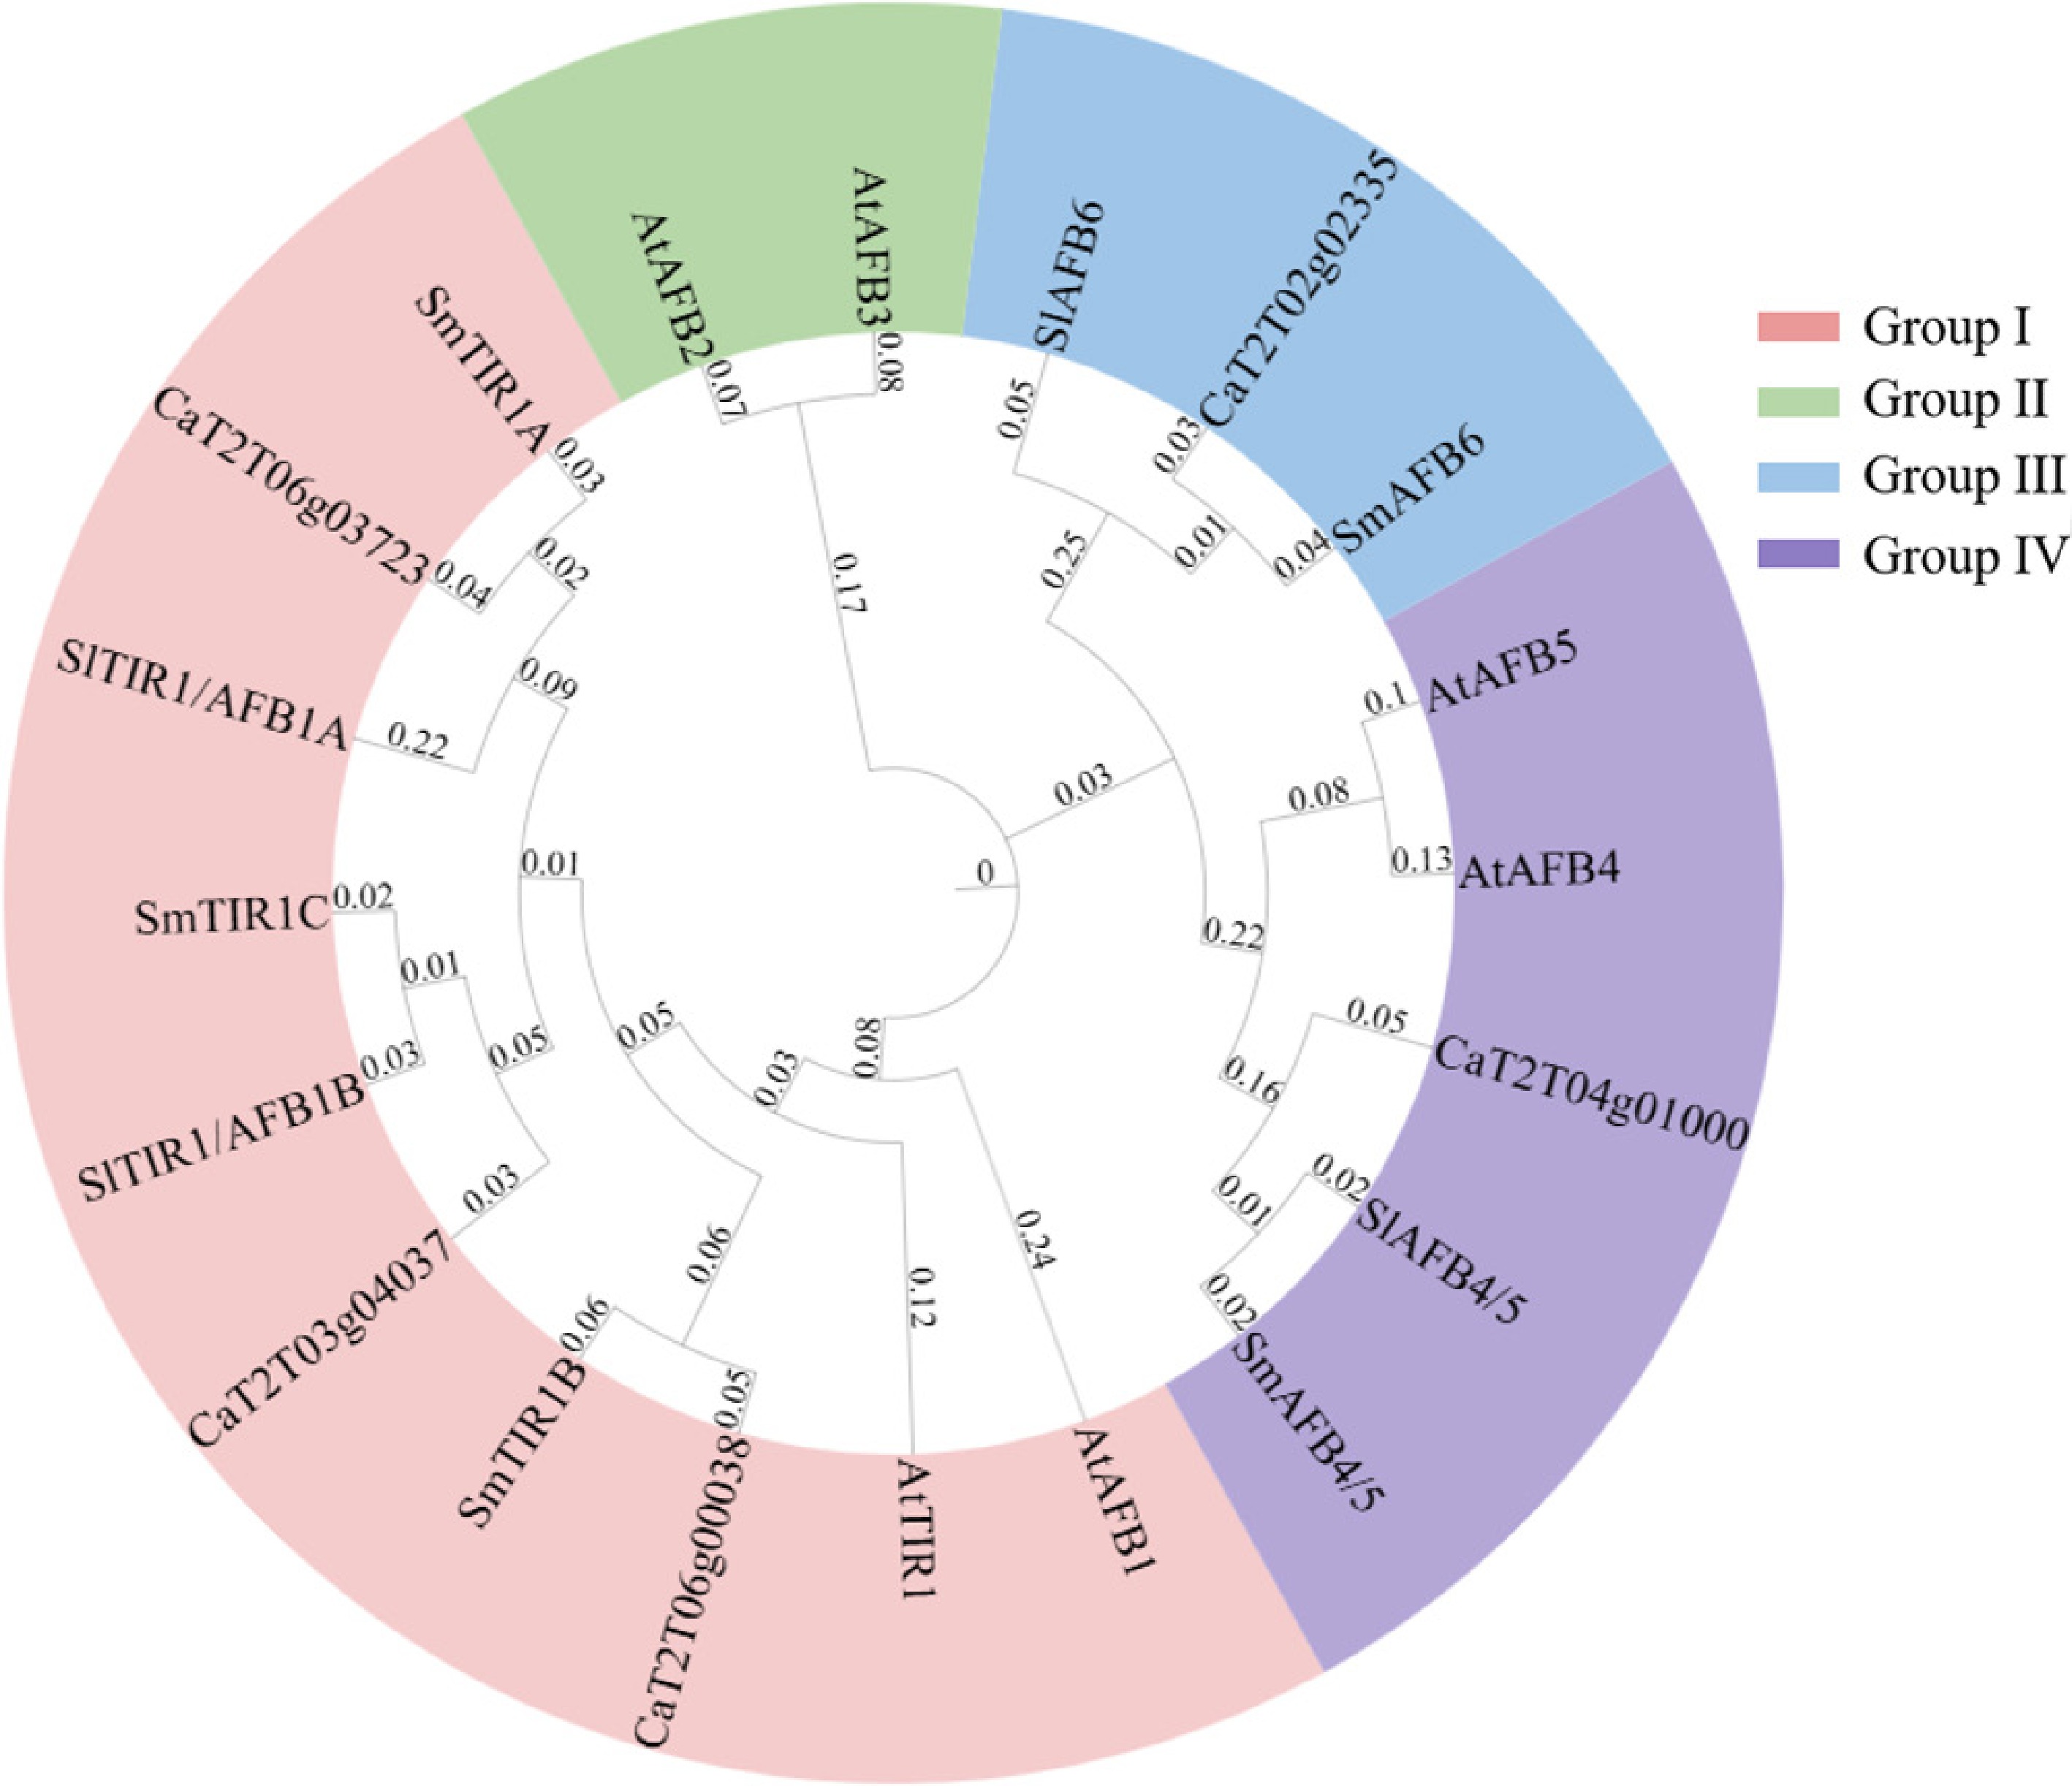
Figure 2.
Phylogenetic analyses of TIR1/AFB proteins identified in pepper, Arabidopsis, tomato, and eggplant. Protein sequences of the five TIR1/AFBs from pepper were used to construct a phylogenetic tree under the neighbor-joining algorism with 1,000 bootstrap replicates. The TIR1/AFBs were clustered into four groups (Groups I, II, III, and IV) with each highlighted in a different color.
-
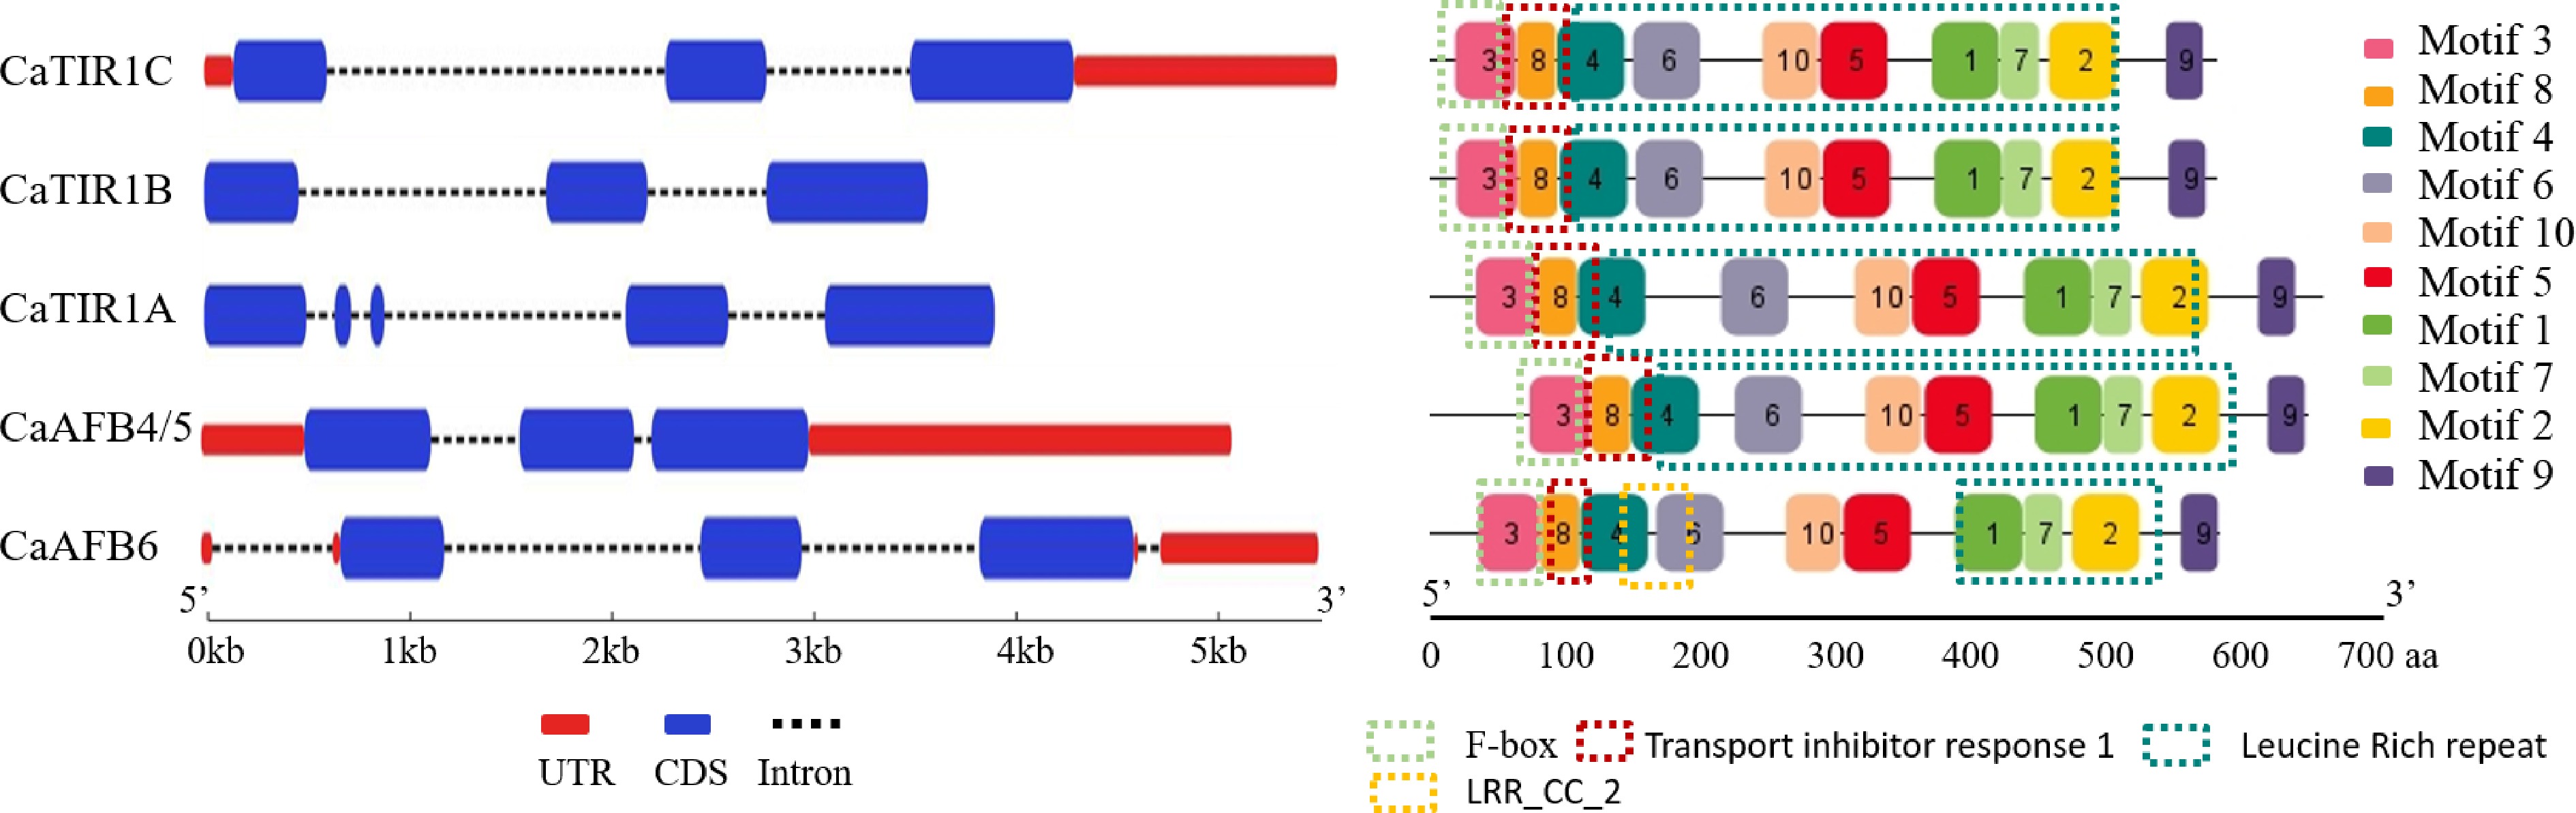
Figure 3.
Gene (left) structure and conserved domain (right) of CaTIR1/AFBs.
-
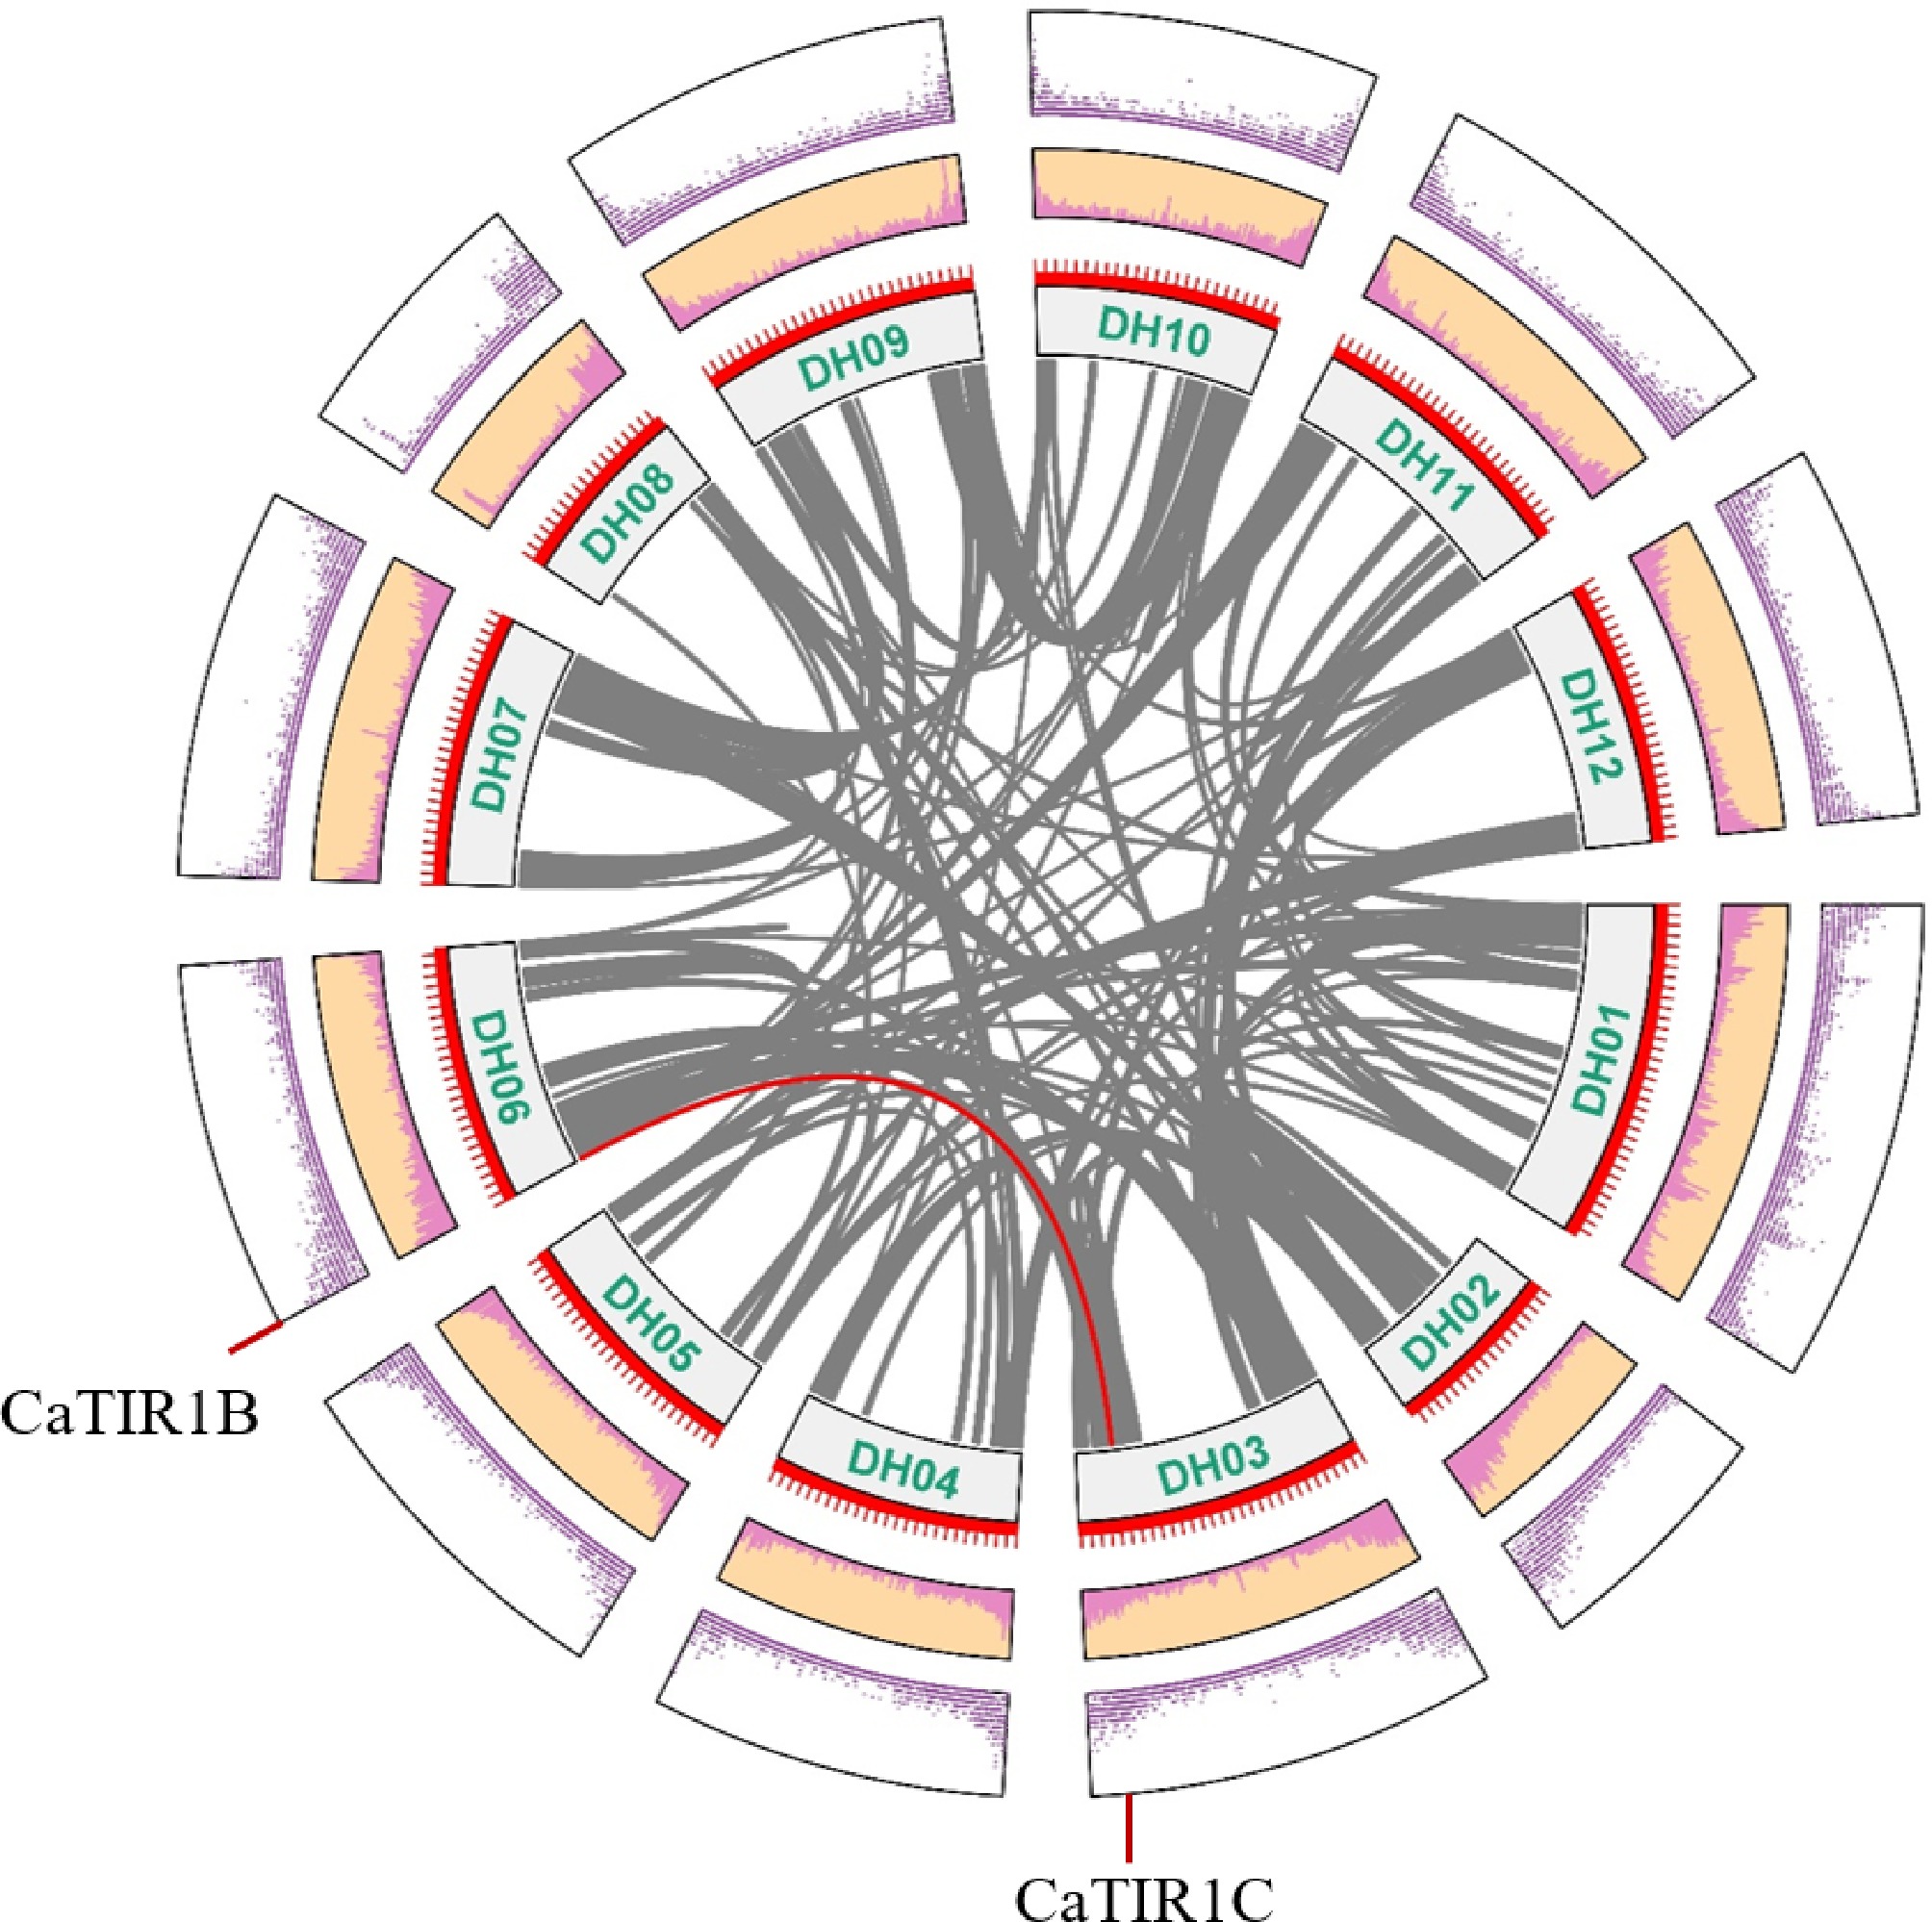
Figure 4.
Circos figure for the chromosome locations with the CaTIR1/AFBs segmental duplication links. Red lines indicate the syntenic cyclin gene pairs between the mentioned genes. Gray lines in the backdrop represent the syntenic cyclin gene pairs of other genes in pepper.
-
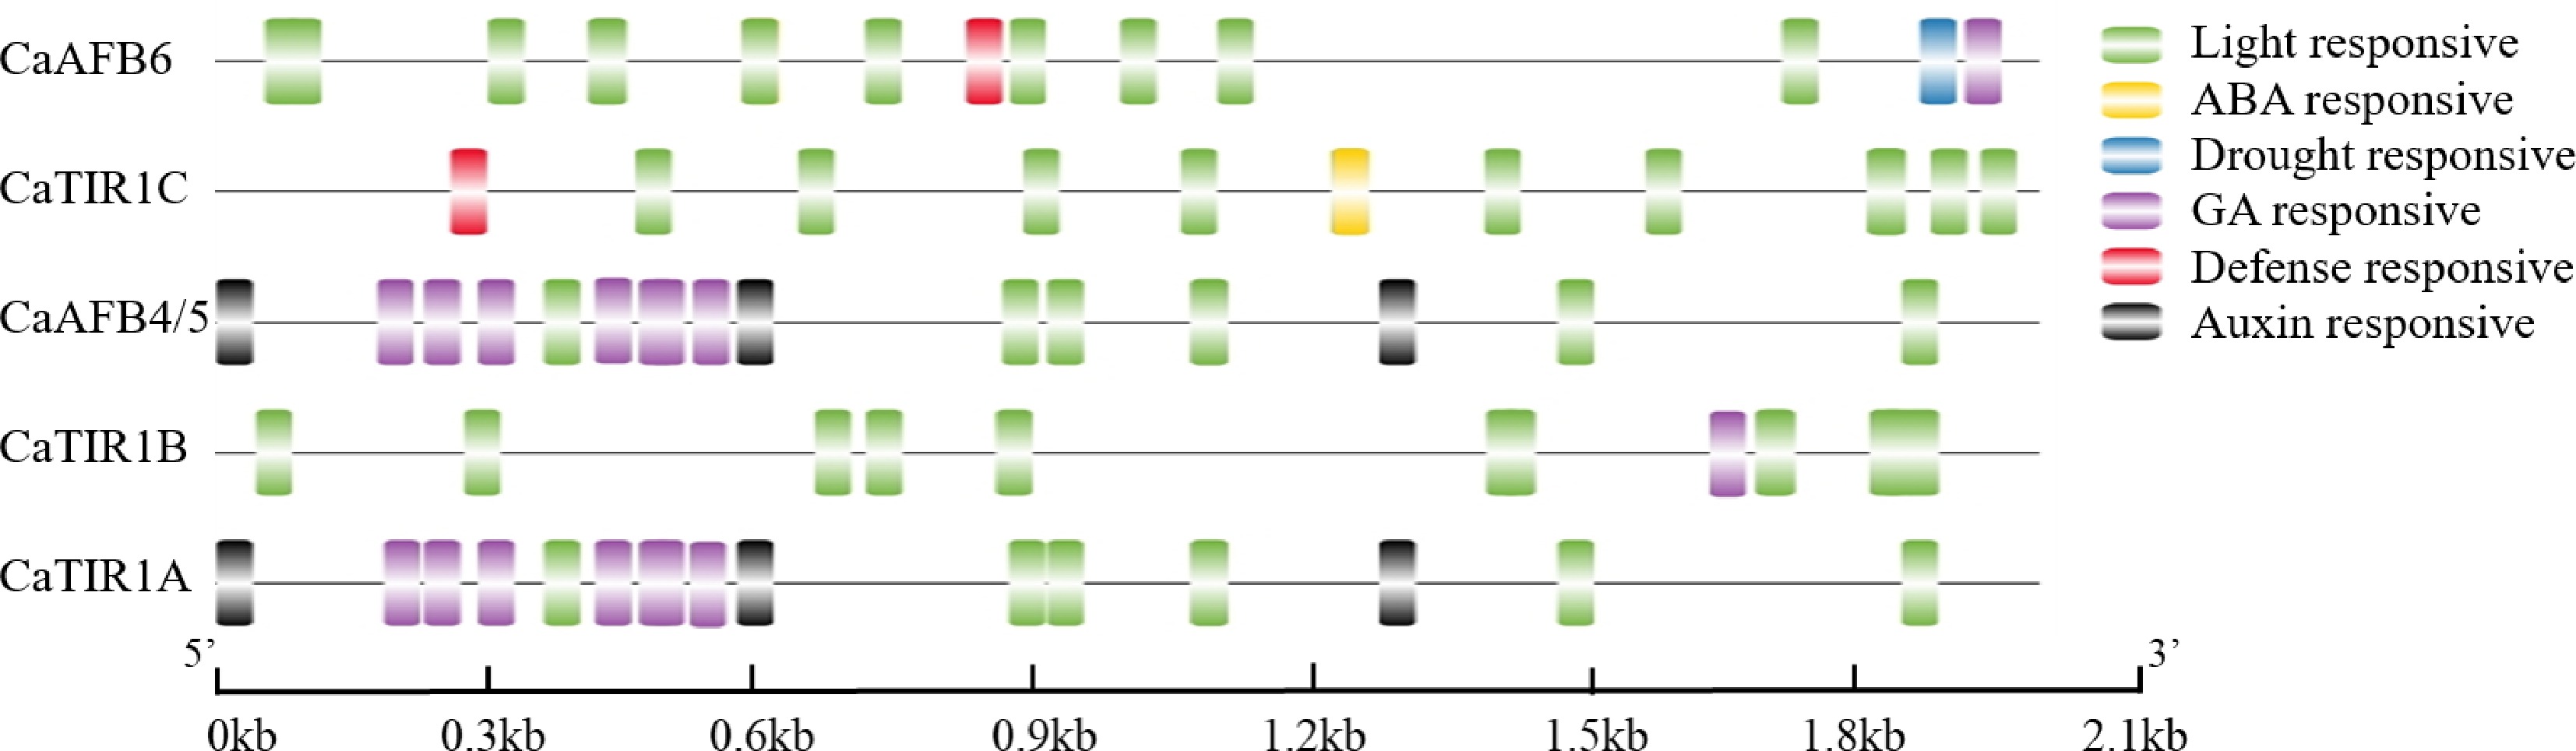
Figure 5.
Identified cis-elements in the promoters at 2 kb upstream of the CaTIR1/AFBs. Hormone, drought, light, and stress-responsive elements were identified and linked to cis-elements of the TIR1/AFBs genes.
-
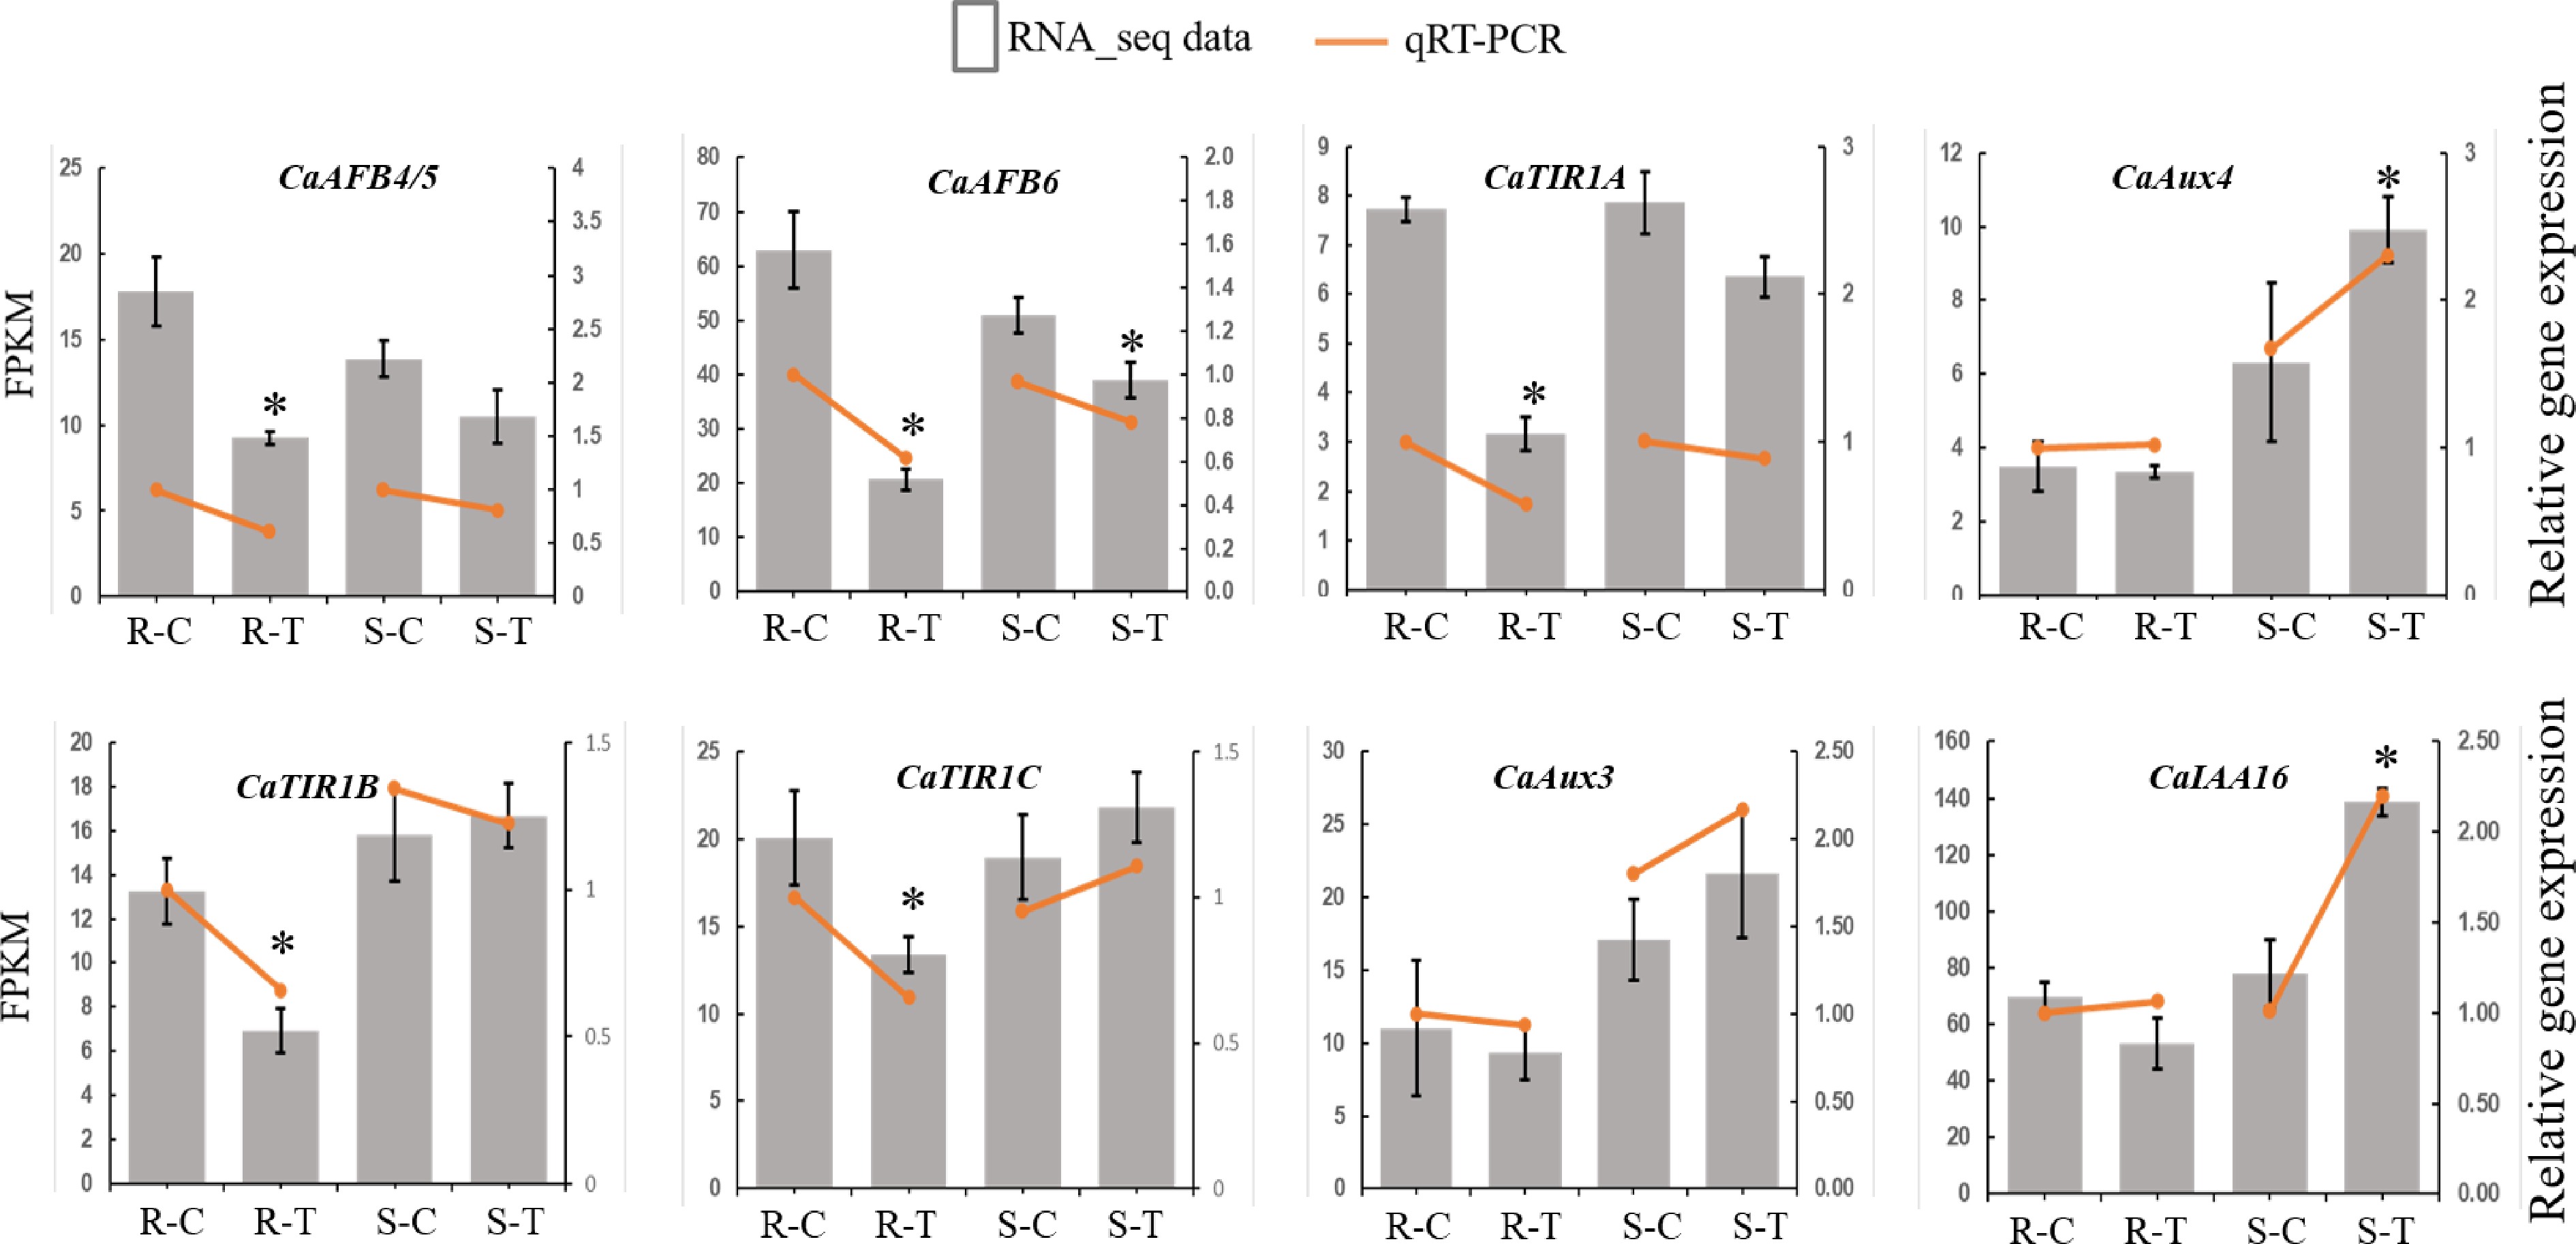
Figure 6.
Expression of CaTIR1/AFB genes under control or R. solanacearum treatment as measured by qRT-PCR (orange symbols) and RNA-seq (bars). For qRT-PCR, gene expression levels were normalized to those of CaUBI, and qRT-PCR expression levels in the resistant variety treated with control (R-C) were set to 1. Results were presented as the means ± SE of three biological replicates. * p < 0.05 (Student's t-test, qRT-PCR data).
-
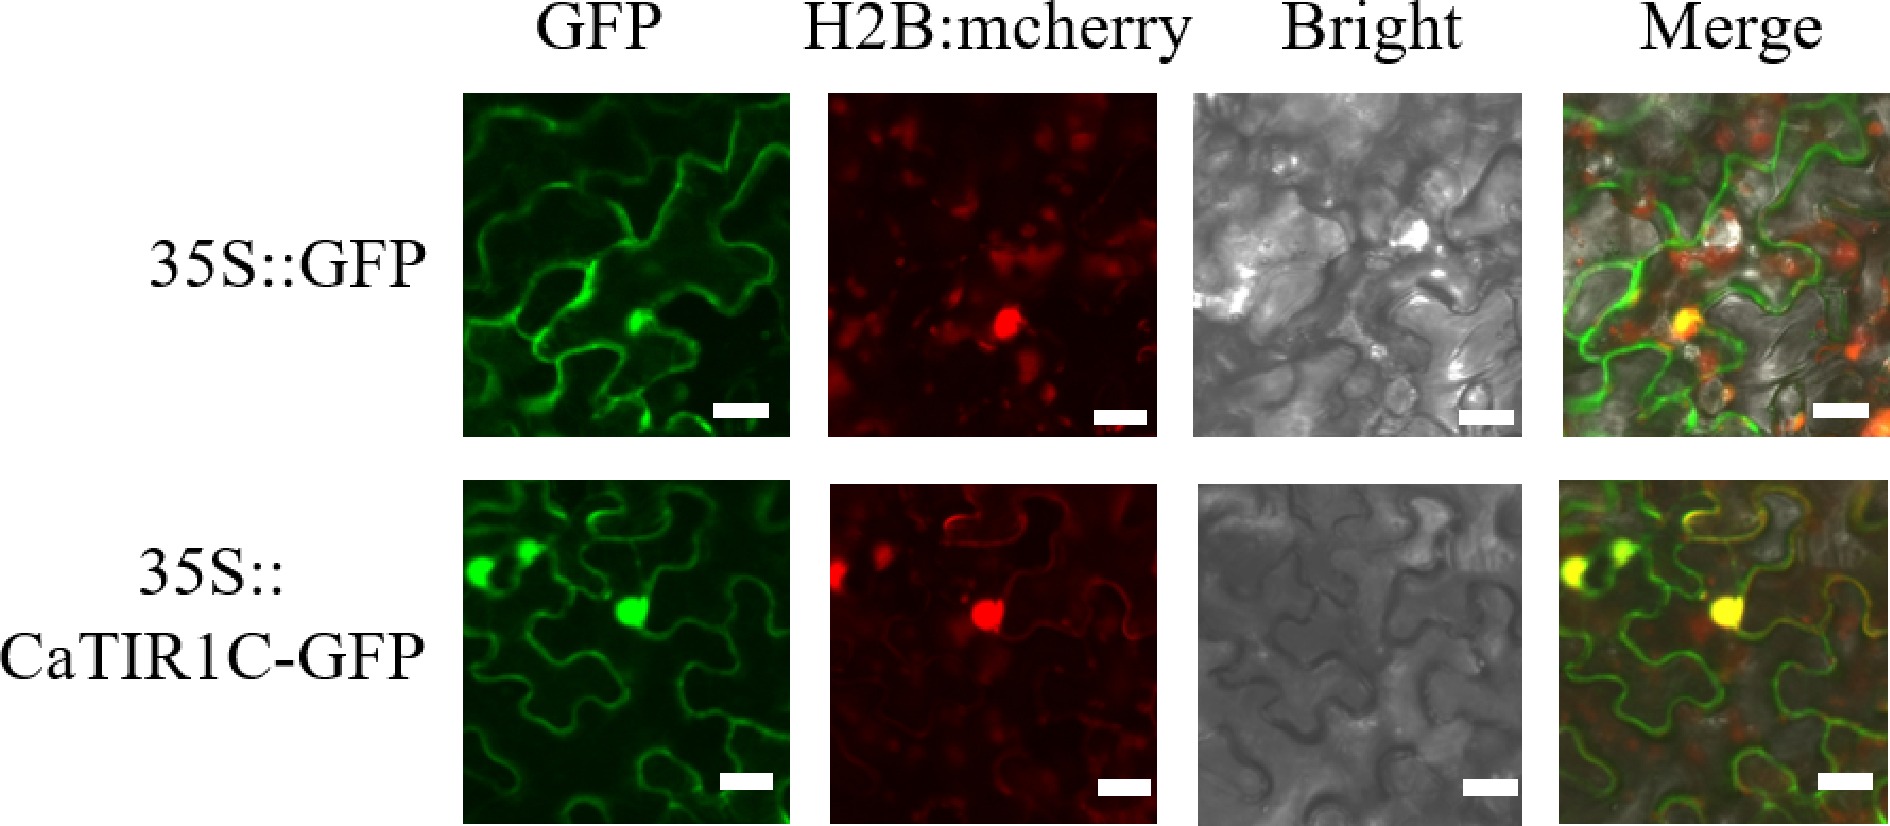
Figure 7.
Subcellular location and expression patterns of CaTIR1C in tobacco epidermal cells. The first column shows the fluorescence of the 35S::GFP, 35S::CaTIR1C-GFP proteins; the second column shows a bright-field image of the 35S::GFP, 35S::CaTIR1C-GFP proteins; the third column shows a bright-field image of the proteins; the fourth column represents an overlay of the fluorescent images. Bar = 20 μm.
-
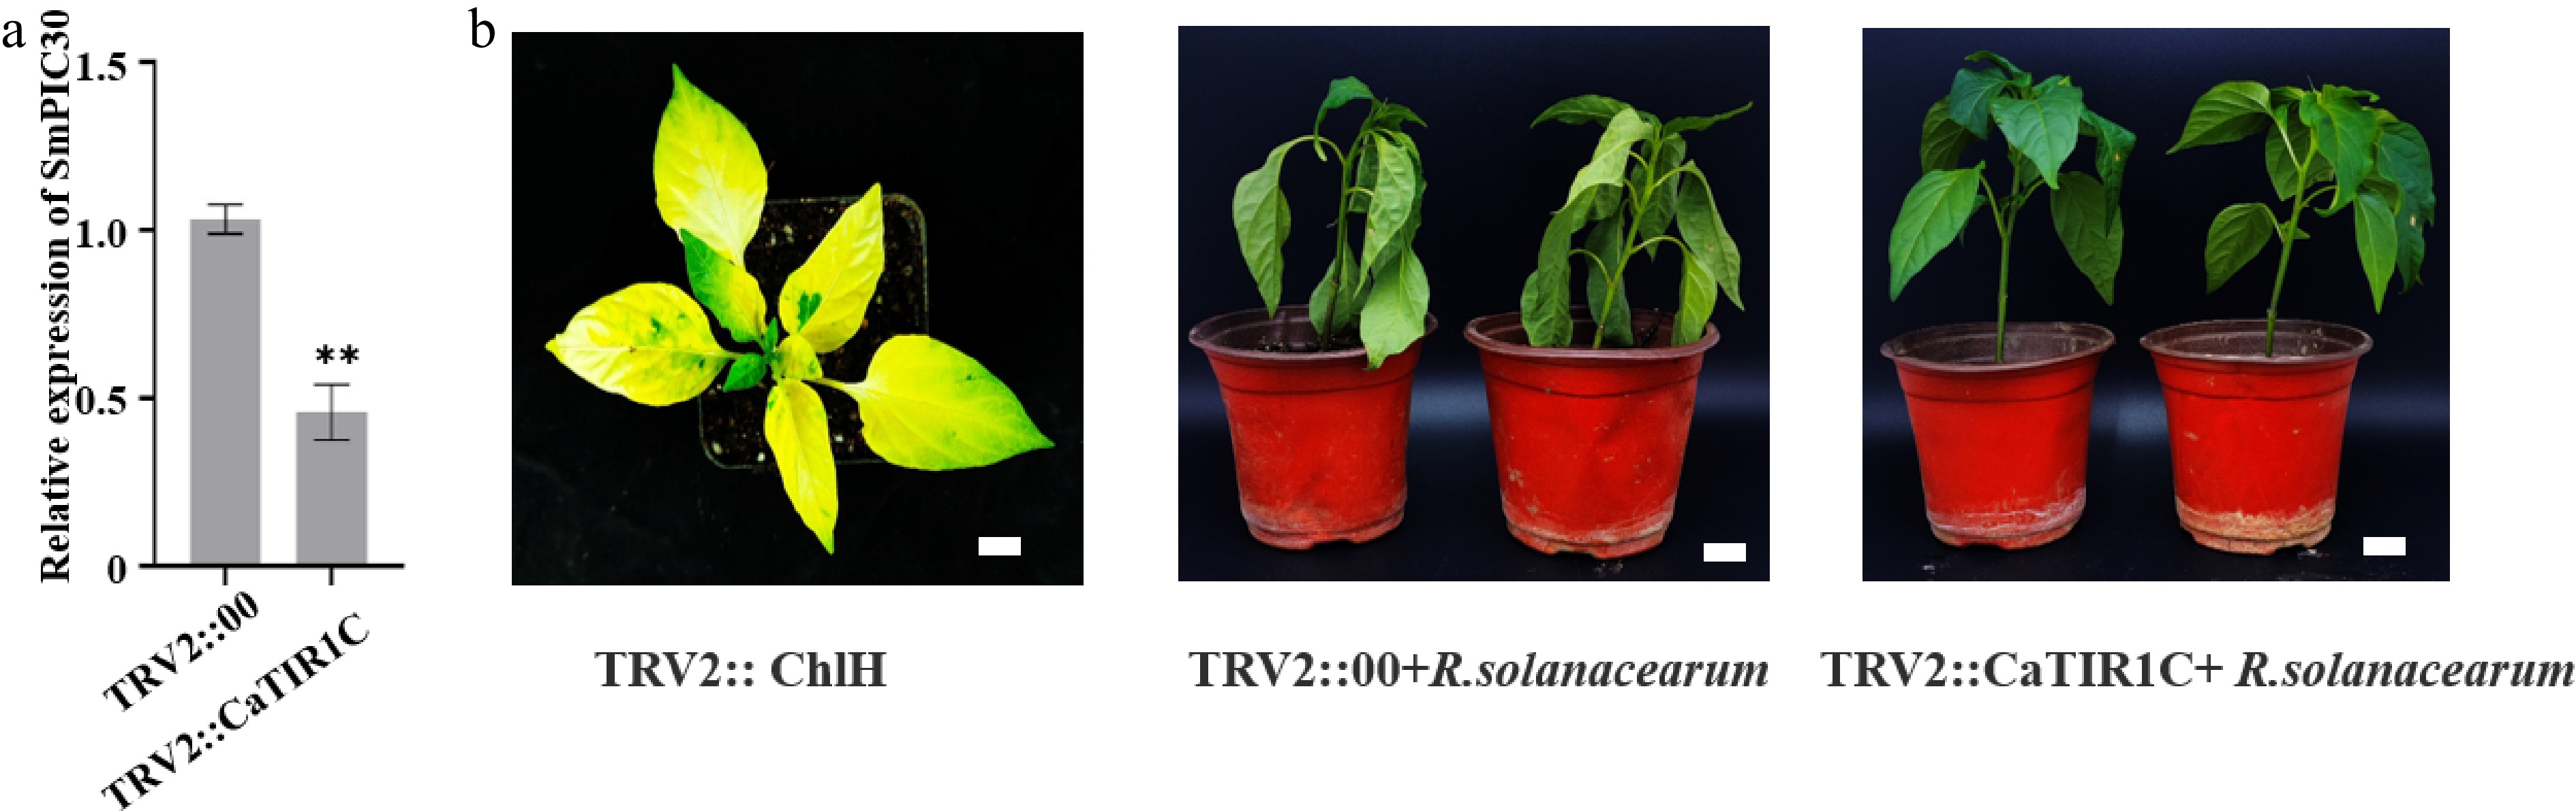
Figure 8.
Effects of CaTIR1C on pepper susceptibility to R. solanacearum. (a) Expression of CaTIR1C in leaves at 25 d after VIGS infection. Asterisks indicate statistical significance as determined by the two-tailed Student's t-test: **p < 0.01. (b) Young pepper plants at 6 d after the inoculation with 0.1 mL R. solanacearum injection (+ R. solanacearum). Bar = 0.5 cm.
-
Gene ID Instability index Amino acids GRAVY score Predicted subcellular location Aliphatic index Annotation CaT2T02g02335 37.89 583 −0.058 Nucleus 91.97 CaAFB6 CaT2T03g04037 53.39 581 −0.026 Nucleus 95.51 CaTIR1C CaT2T04g01000 42.25 646 0.051 Nucleus 91.02 CaAFB4/5 CaT2T06g00038 51.41 580 0.015 Nucleus 96.50 CaTIR1B CaT2T06g03723 47.65 658 0.047 Nucleus 98.80 CaTIR1A Table 1.
Predicted pepper TIR1/AFBs genes and related information.
Figures
(8)
Tables
(1)