-
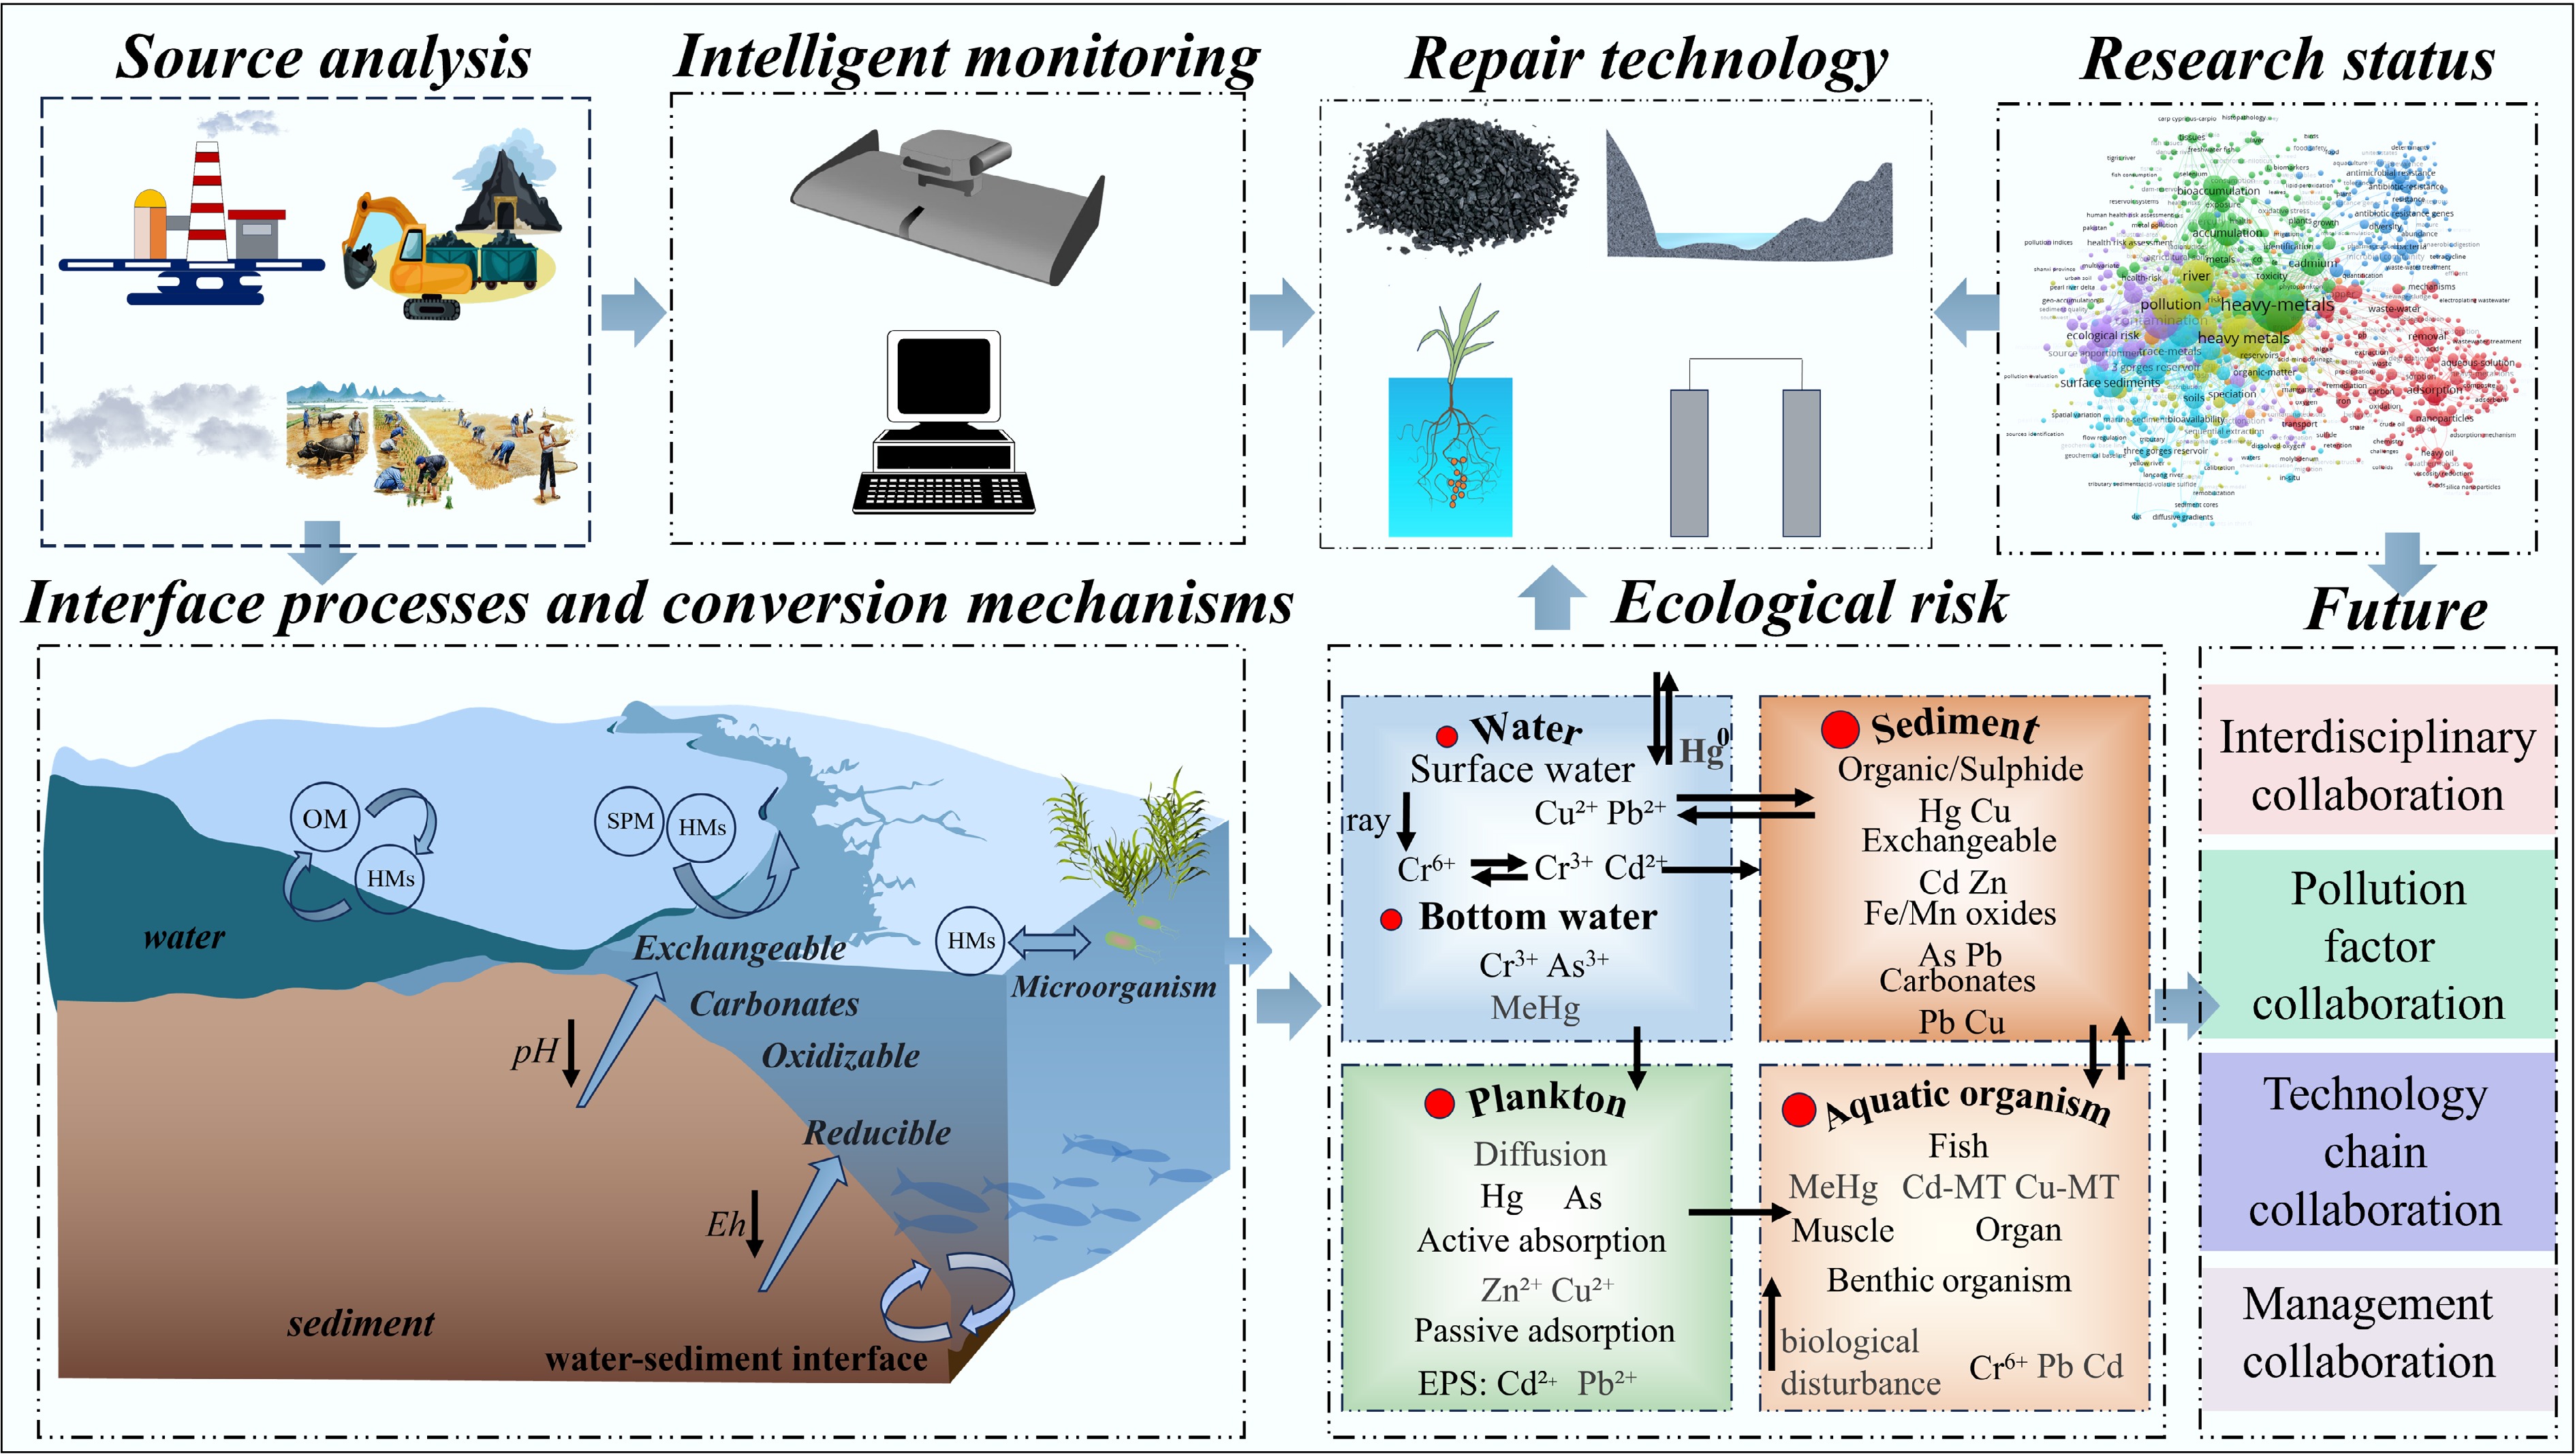
Figure 1.
Framework diagram of the entire process of heavy metal pollution research and control in reservoirs.
-
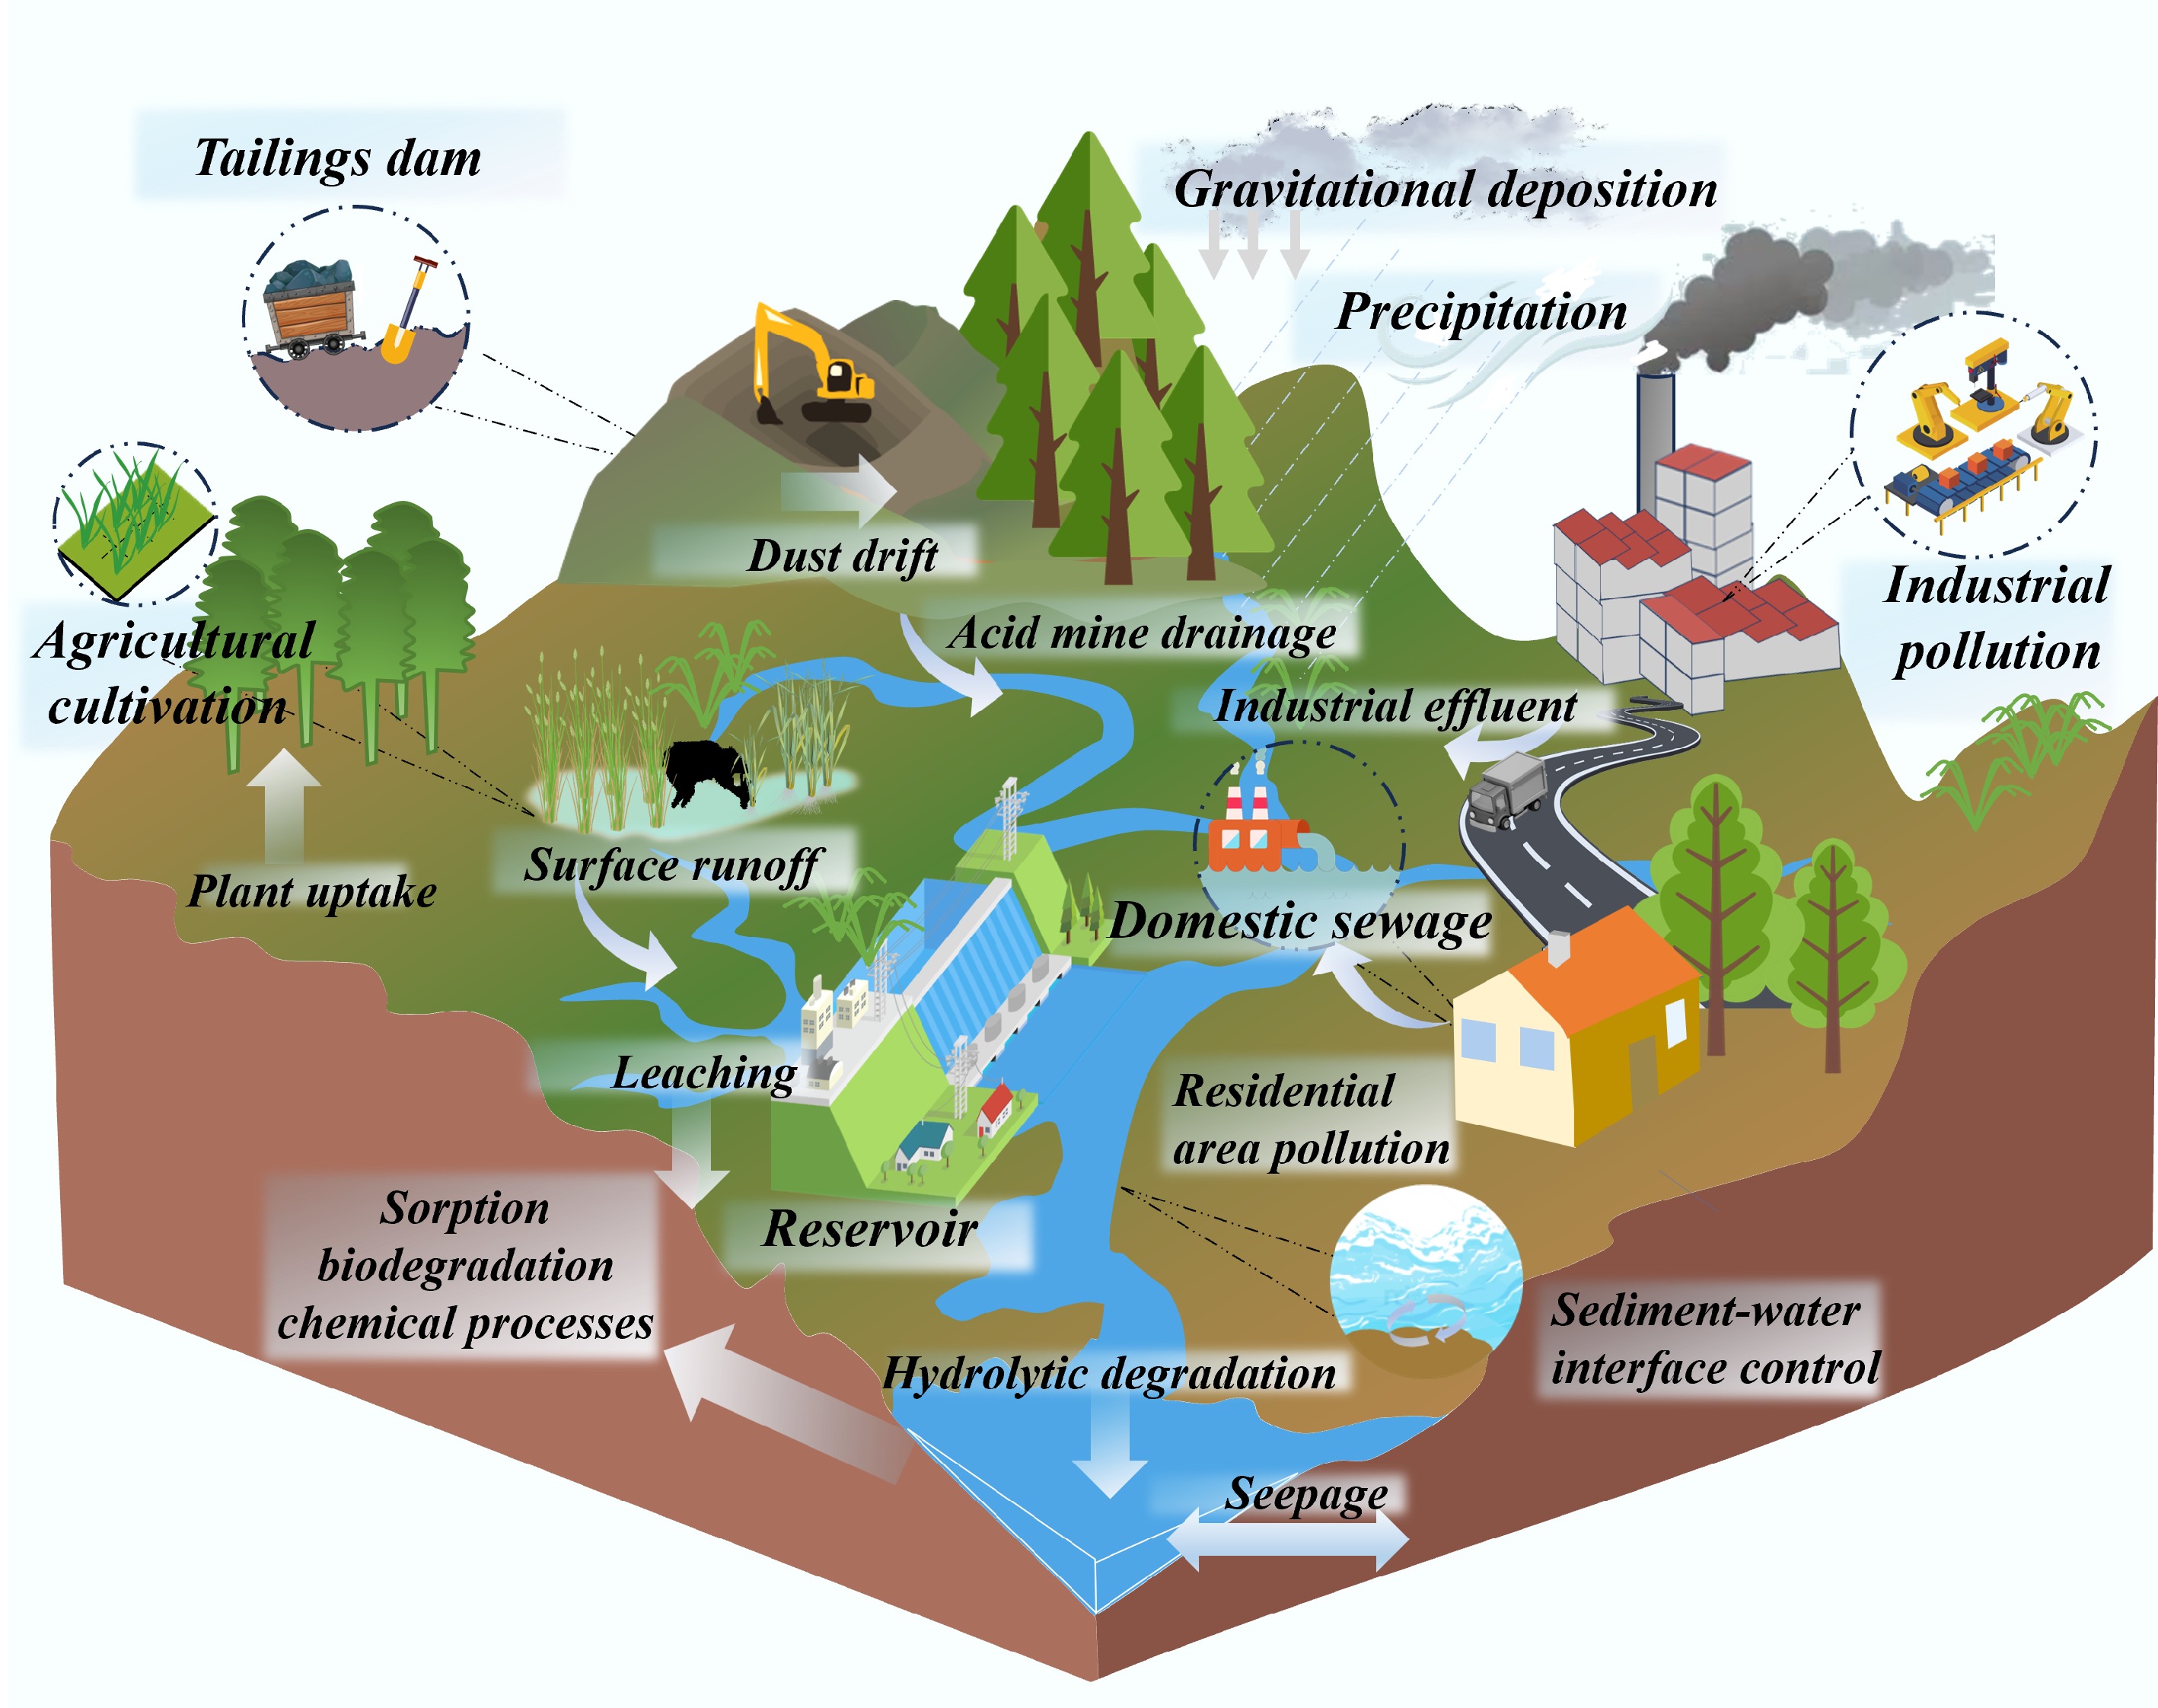
Figure 2.
Schematic diagram of multi-source input of HM pollution in reservoirs.
-
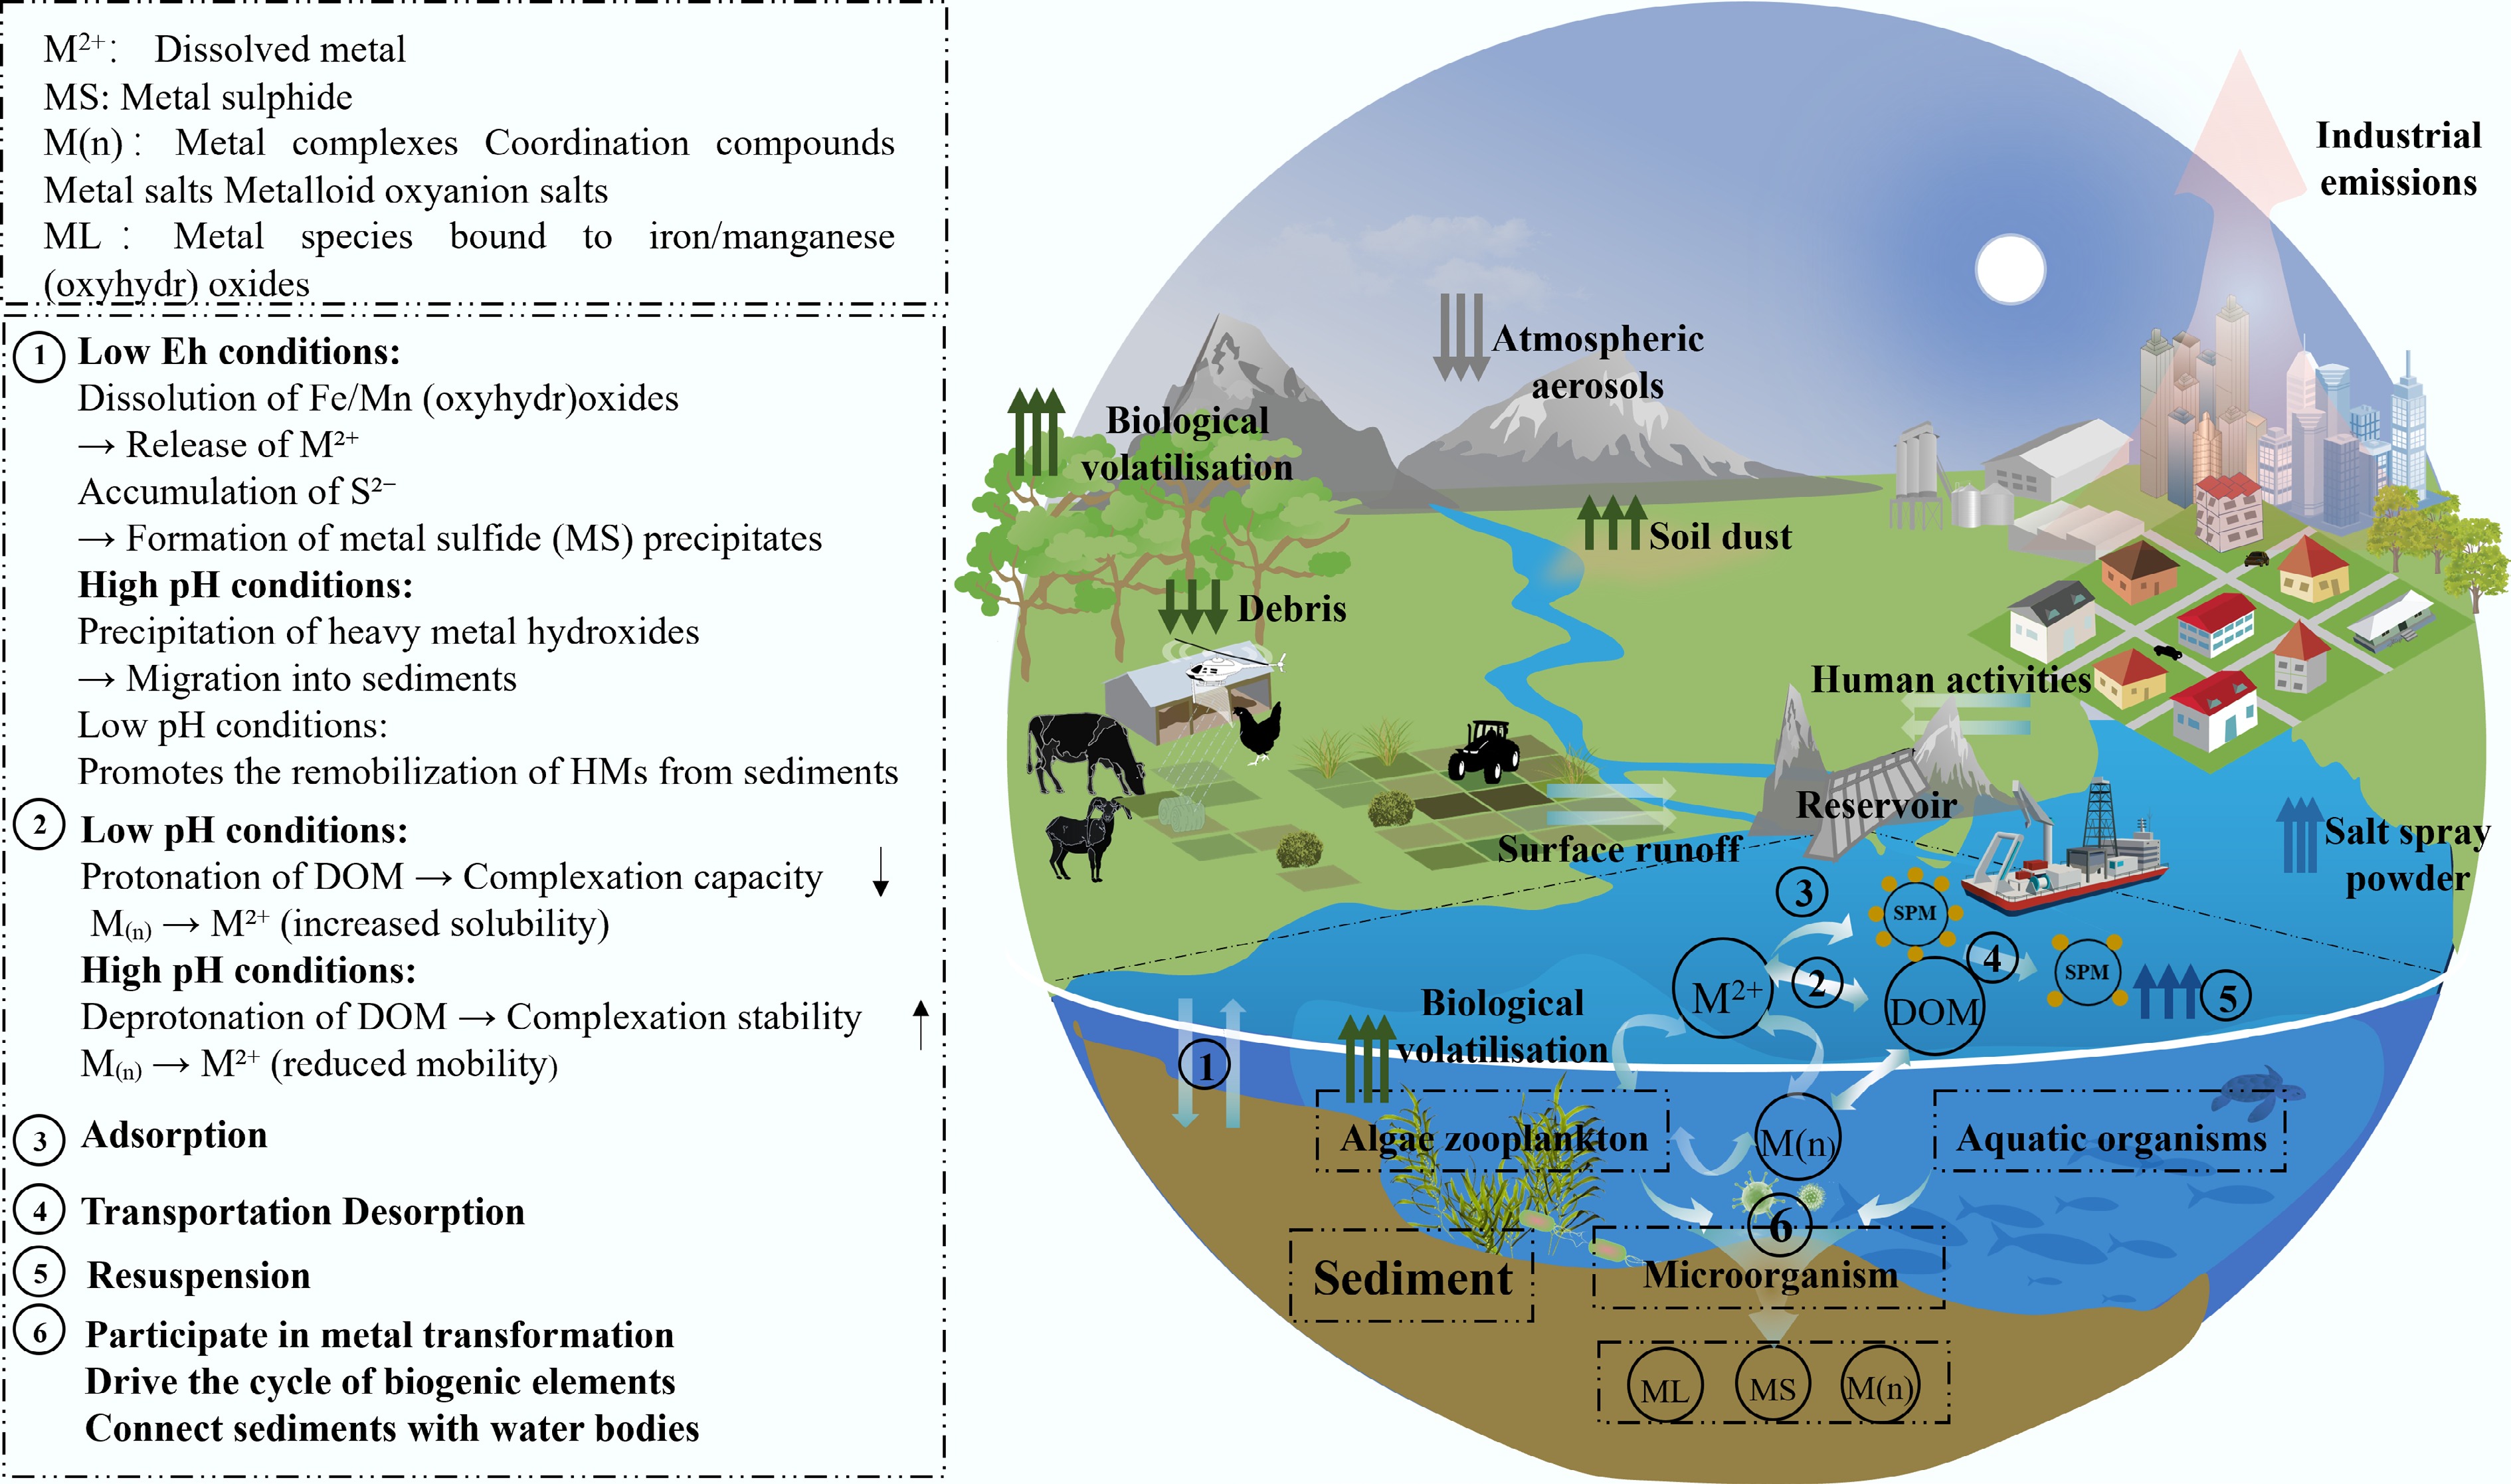
Figure 3.
Sources, migration processes, and biogeochemical cycles of HM in the reservoir environment.
-
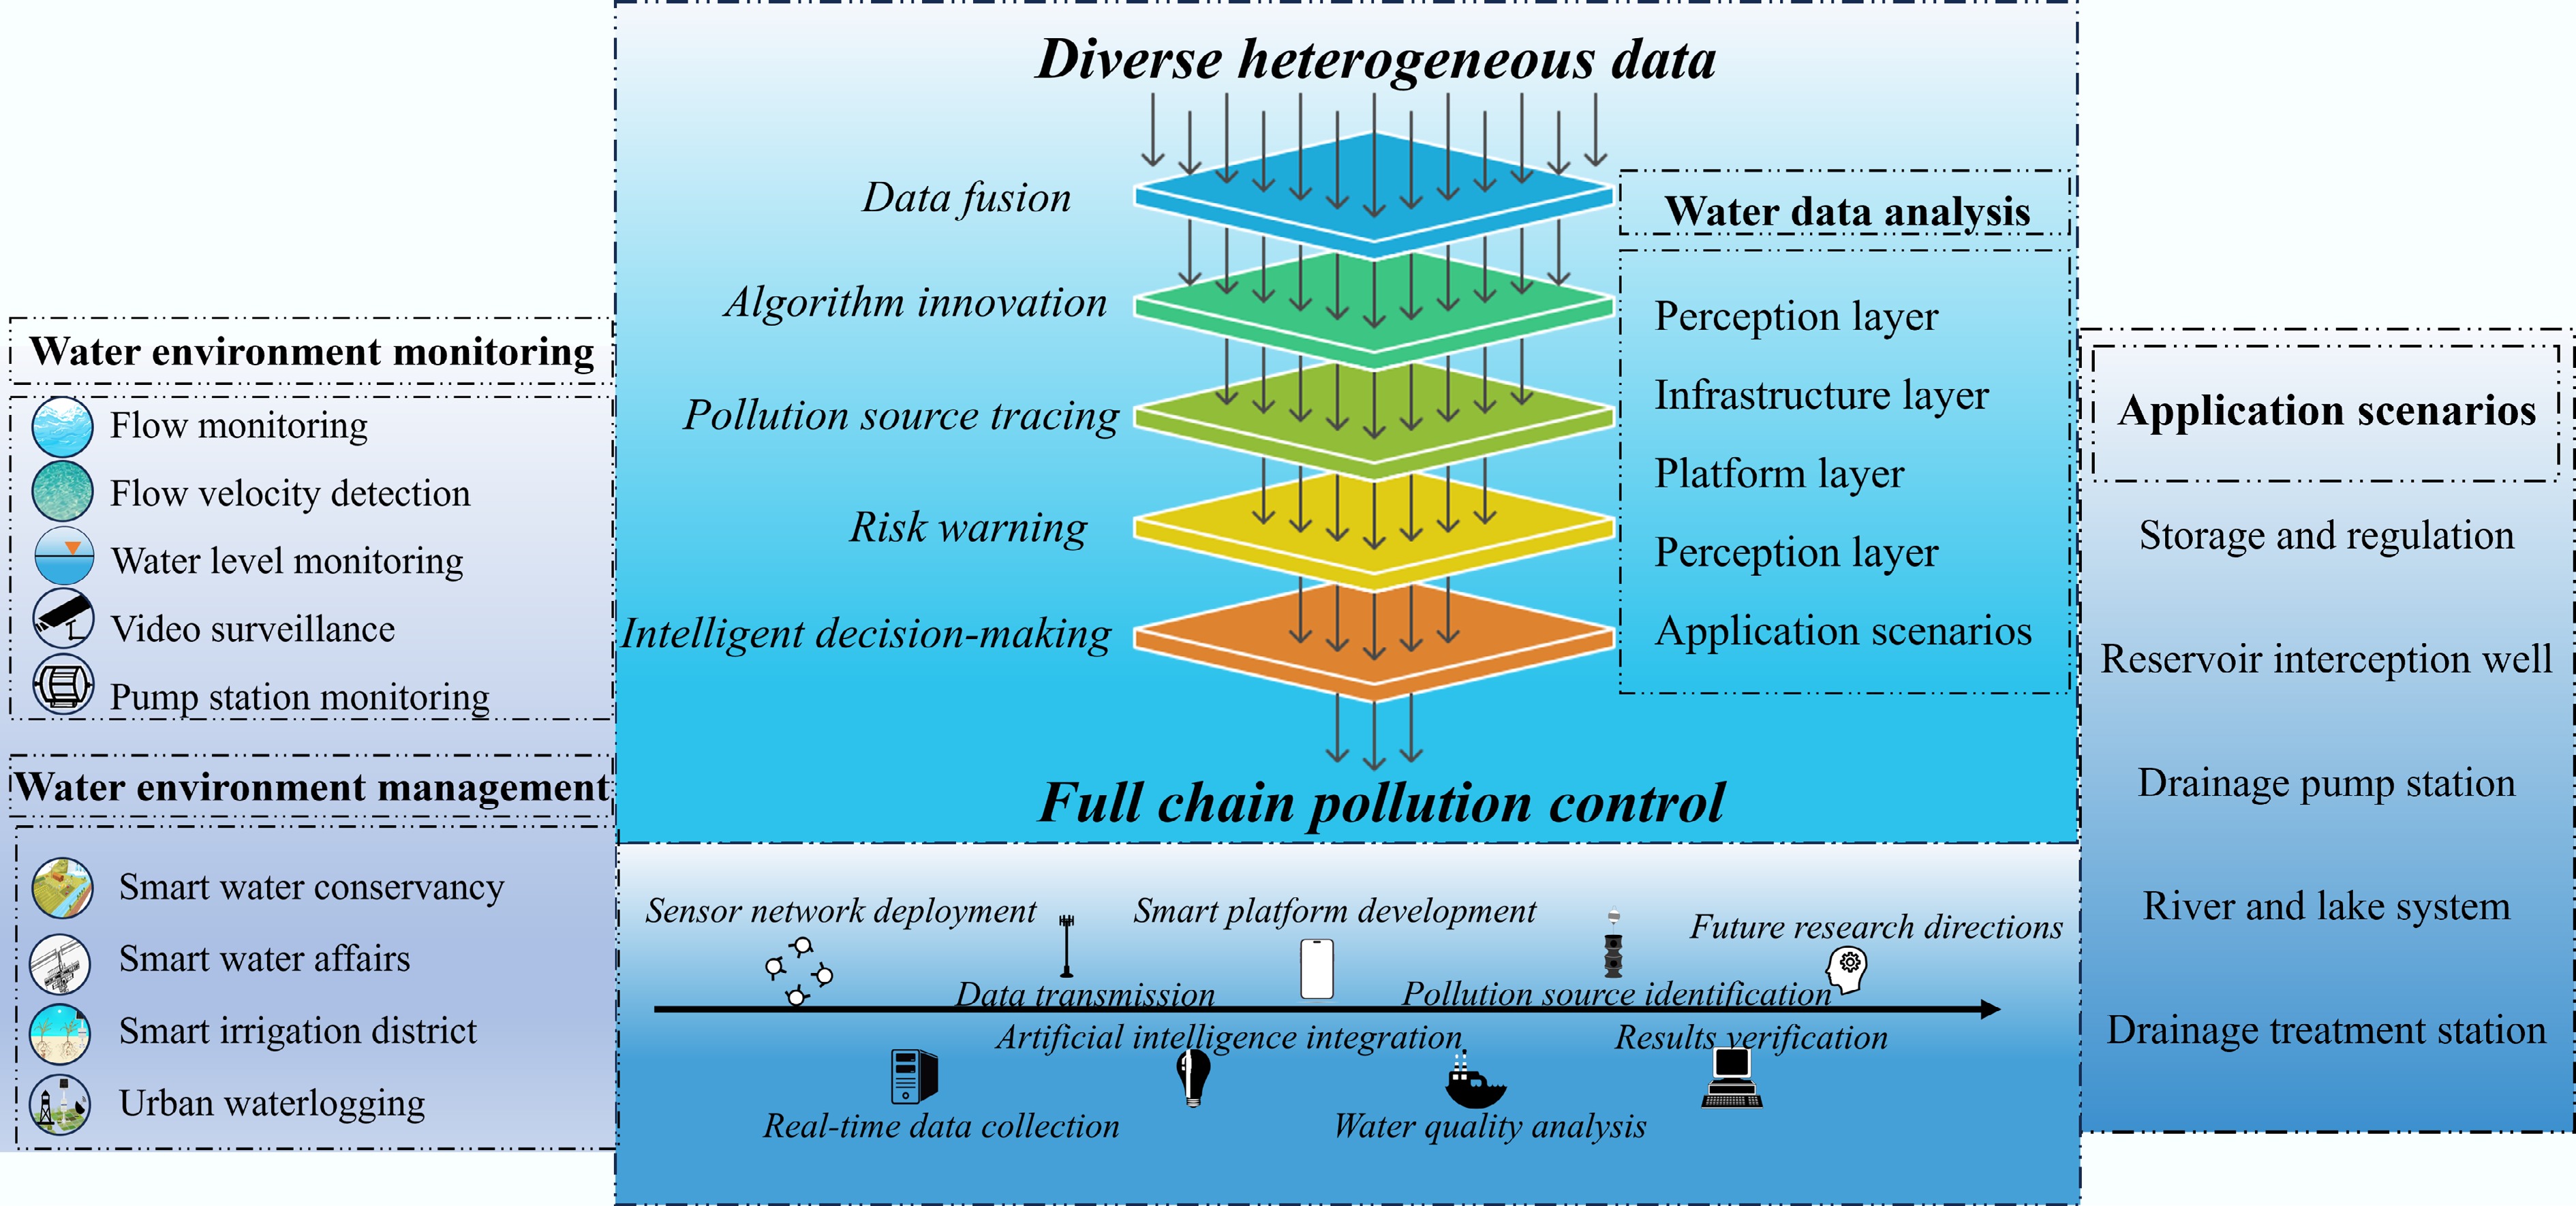
Figure 4.
Schematic diagram of the full-chain technical architecture for smart water environment management.
-
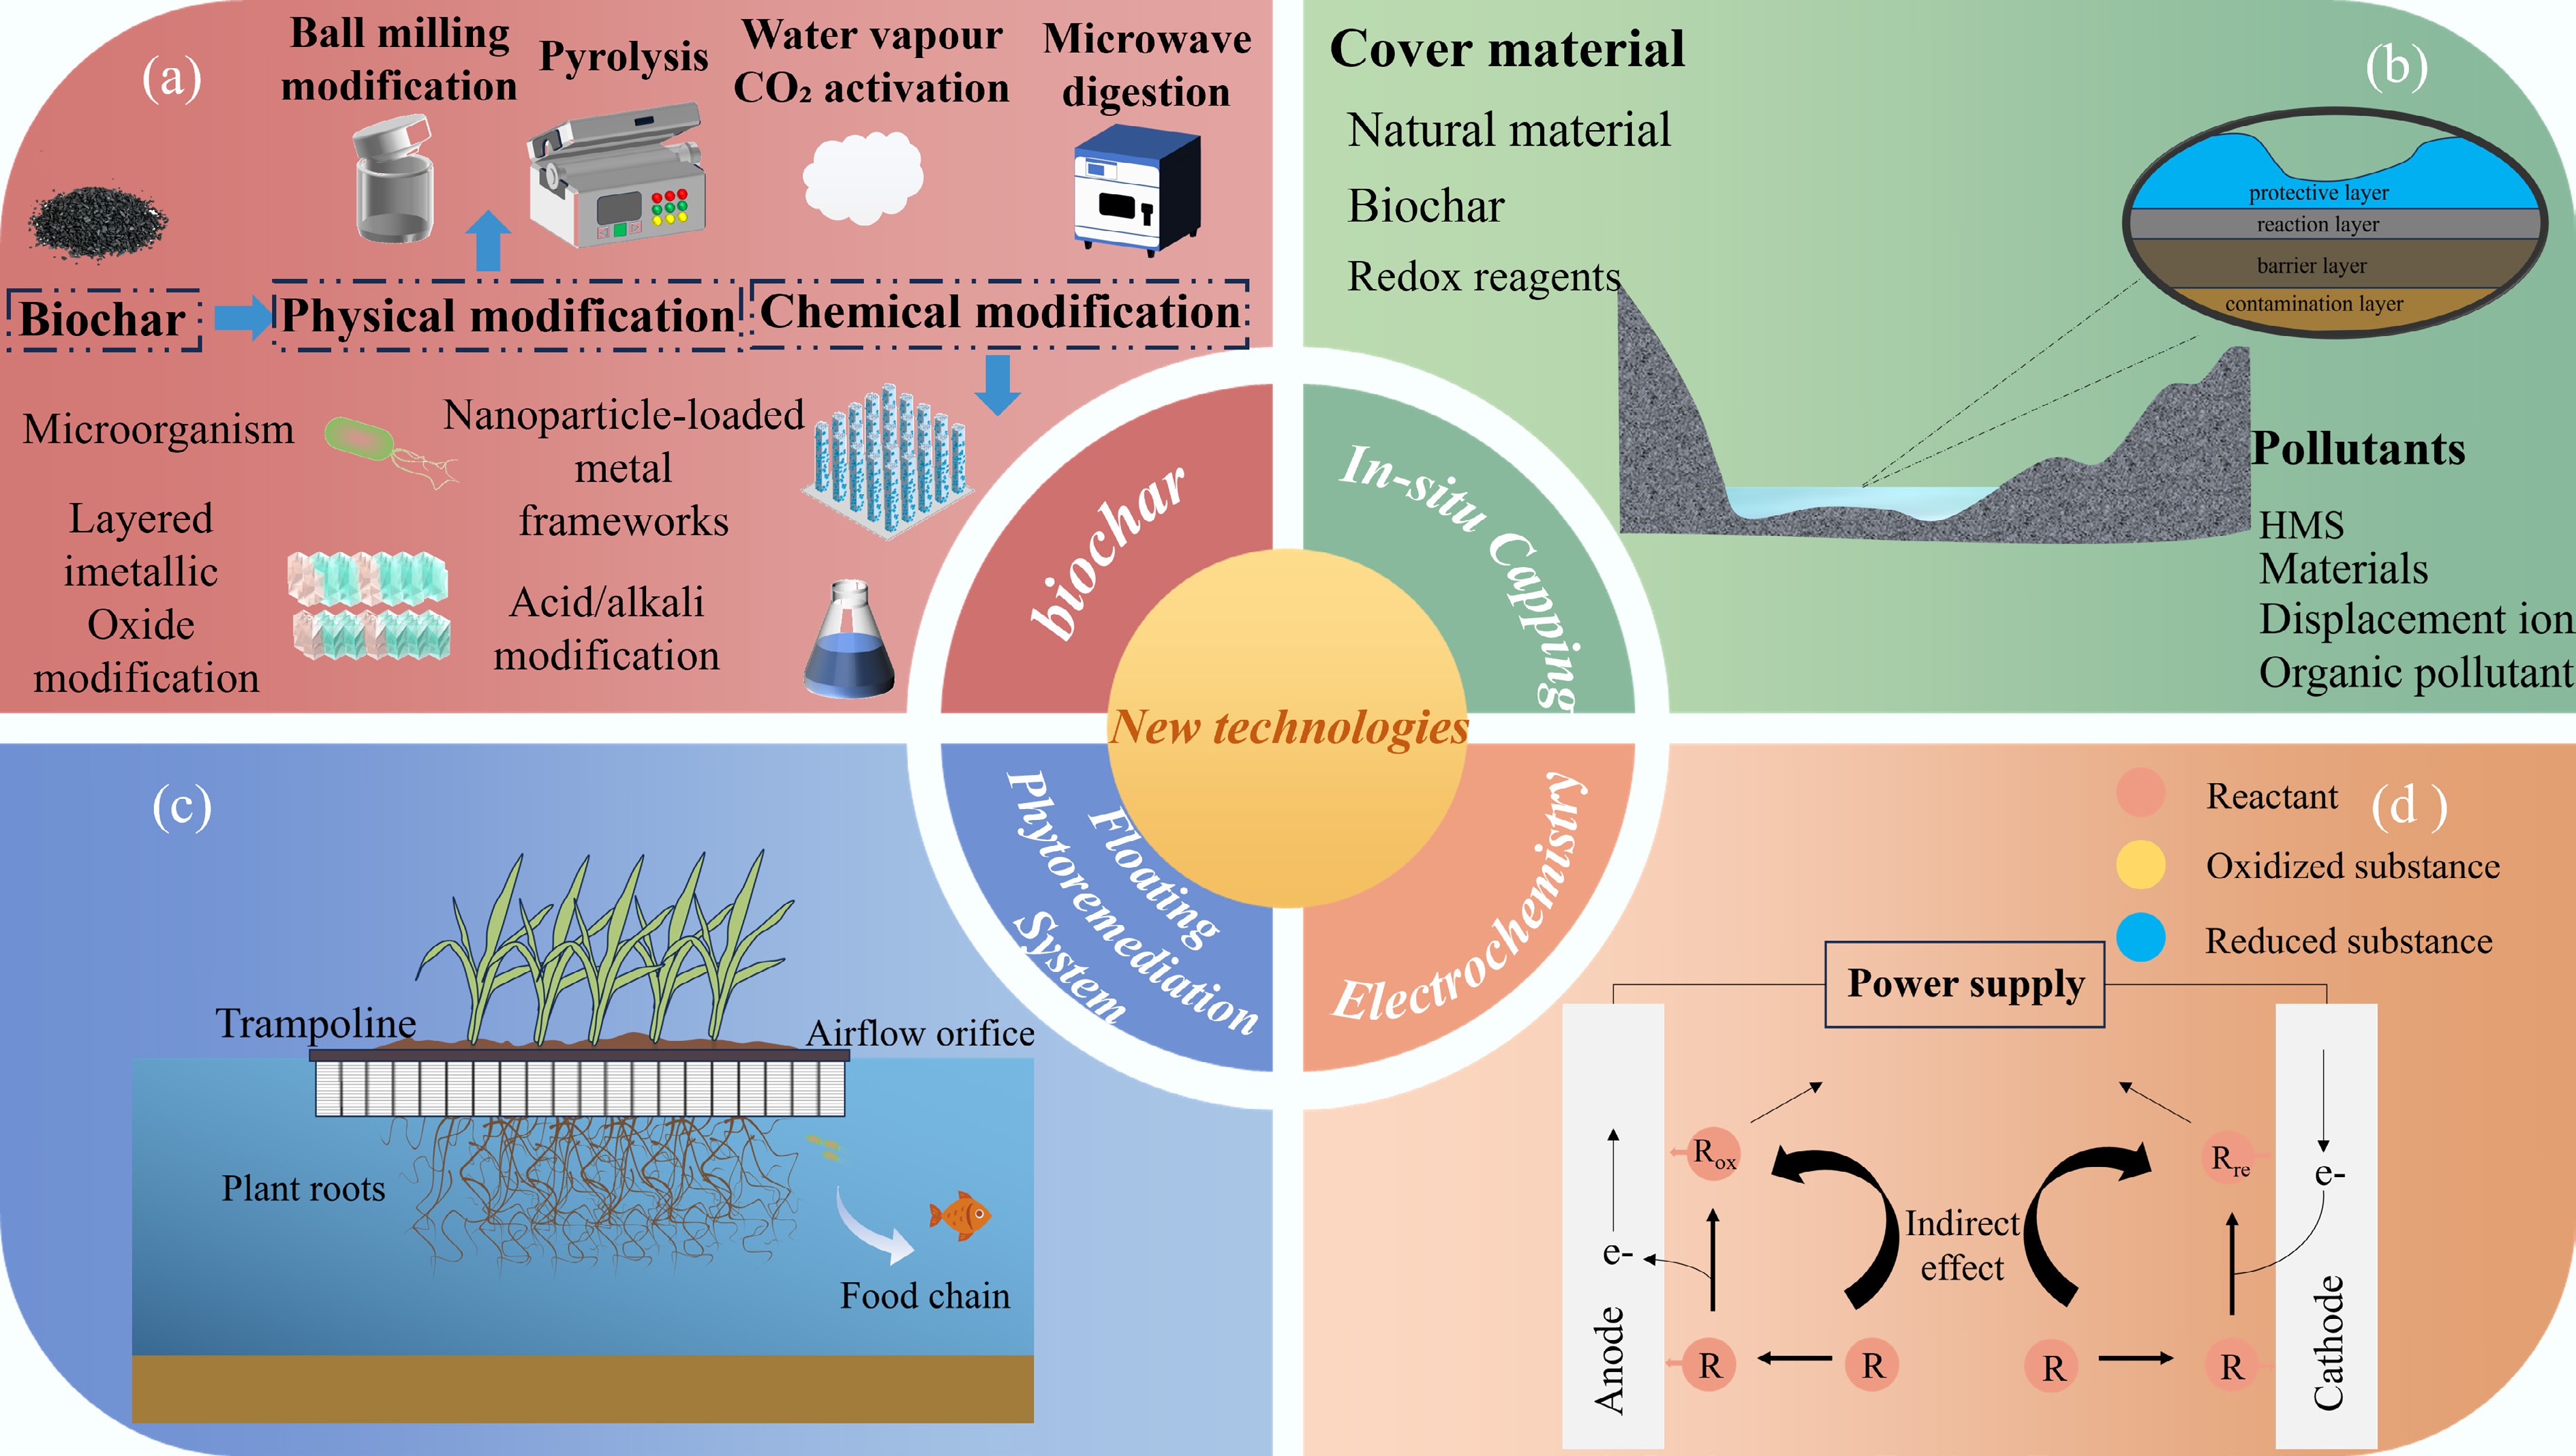
Figure 5.
The four HMs remediation methods introduced in this section are as follows: (a) Illustrates biochar modification approaches, including chemical modification and physical modification; (b) represents in situ capping technology; (c) stands for the Floating Phytoremediation System, also known as the Biological Floating Island; (d) denotes the electrochemical remediation method.
-
Model name Formula Parameter annotation Application scenario Potential ecological risk index (PERI) Eri = Tri × Ci/ $ C_b^{i} $ Tri: Toxicity coefficient; Ci / $ C_b^{i} $ Sediment ecological risk assessment Comprehensive potential ecological risk index (RI) RI = ∑ $ E_r^{i} $ $ E_r^{i} $ Ecological risk assessment of multi-pollutant synergy Bioaccumulation factor (BAF) BAF = Cbiota / Cwater Cbiota: HM concentration in fish/shellfish Cwater: Aqueous concentration Assessment of enrichment effects in aquatic organisms Cwater Fish/shellfish Cwater: Aqueous concentration enrichment effects in aquatic organisms Target hazard quotient (THQ) $ THQ=\dfrac{EF\,\times \,ED\, \times \,FIR\,\times\, C}{RfD\,\times \,BW\,\times\, AT} $ EF: Exposure frequency (d/year); FIR: Ingestion rate (g/day); RfD: Reference dose (mg/kg·d); ED: Exposure duration (years); BW: Body weight (kg); AT: Averaging time (d) Health risk assessment of drinking water/aquatic products Lifetime cancer risk (LCR) LCR = SF × ADD SF: Slope factor (mg/kg·d) ADD: Average daily intake (based on water concentration and ingestion), (mg/kg·d) Long-term risk assessment of carcinogenic HMs Table 1.
Common risk assessment models and applications in reservoir-HMs research
N -
Material Preparation process HMs Performance indicators Features/applications Ref. Fe3O4-CS Plant extract Pb2+ Pb2+: 98.39% Cyclic stability: after three cycles, the adsorption capacity retention rates were 95.81%, 70.65%, 50.50%, and 42.75%, respectively [152] Cu2+ Cu2+: 75.52% Cd2+ Cd2+: 51.54% Ni2+ Ni2+: 45.34 Lignin hybrid NPs Chemical cross-linking method Pb2+ Pb2+: 150.33 mg/g Reaches equilibrium within 30 s, suitable for actual reservoir water treatment [153] Cu2+ Cu2+: 70.69 mg/g Fe3O4/SiO2 Rosemary extract As3+ As3+: 49 mg/g Biological-nano synergistic system achieves simultaneous oxidation and removal of As3+ [154] rGO/Ag NPs Green tea reduction Pb2+ Pb2+: 84.2% In actual AMD treatment, the Pb2+ removal rate increased from 46.4% to 63.2% after five cycles (due to the in situ formation of iron oxide) [155] nFeS@GS Geobacter biohybrid Cu2+ Cu2+: 87.9% The recovery rate of heavy metals after sodium citrate desorption is > 90.7%, which is suitable for acidic mine wastewater [156] Pb2+ Pb2+: 96.2% Cd2+ Cd2+: 95.1% Fly ash-nZVI/Ni Waste-derived Cr6+ Cr6+: 48.31 mg/g The removal rate of Cr6+, Cu2+, etc. in actual industrial wastewater is > 87% [157] Cu2+ Cu2+: 147.06 mg/g MNPs-WSP Walnut shell coprecipitation Cd2+ Cd2+: 1.43 mg/g Recovery rates of 85%–98%, suitable for various water sources such as tap water and groundwater [158] Table 2.
Examples of nanotechnology in remediating HM-contaminated water bodies
-
Method Agricultural waste adsorbent Adsorption capacity/removal efficiency Ref. NaOH treatment Rice straw Cd2+ removal: 61.5% [167] Zn2+ removal: 52.9% H2SO4 Rice husk Zn2+ maximum adsorption capacities: 19.38 mg/g [168] Hg2+ maximum adsorption capacities: 384.62 mg/g Tetraethylenepentamine (TEPA) Ramie fiber Cu²+ maximum adsorption capacities: 0.587 mmol/g [169] Grinding & drying Walnut shell Cr6+ maximum adsorption capacities: 16.73~40.99 mg/g [170] NaOH + citric acid Peanut shell Cu²+ removal: 31% [171] NaOH + epichlorohydrin + N, N-dimethylformamide + TETA Pomelo peel Cr6+ maximum adsorption capacities: 193.17 mg/g [172] NaOH + TEMPO + NaBr + NaClO Luffa sponge Pb²+ maximum adsorption capacities: 96.6 mg/g [173] NaOH treatment Watermelon rind Cu2+ removal: 99.53% [174] Brine sediment Sawdust Zn: 5.59 mg/g [175] Cu 4.33 mg/g Boiling in HCl Coffee grounds Pb: 61.6 mg/g [176] Grinding & drying Pine cone Cr6+ removal: 90.84% [177] Grinding & drying Apple pomace (AP) & beetroot
residue (BR)Max Pb adsorption: 31.7 mg/g (AP), 79.8 mg/g (BR) [178] Grinding & drying Crab shell Pb removal > 97% [179] Cd removal > 90% TEPA + BCTTC Modification Metasequoia sawdust (MS) Pb2+ removal: 24.0% [180] Cd2+ removal: 93.2% Cyclopropylene chloride cross-linked polyethylene imine (PEI) and coconut shell carbon (CSC) Sugarcane bagasse, corn cob, peanut shell, coconut shell carbon (CSC) Complete removal (100%) of Cr6+, Cu2+, Pb2+, Cd2+ in
10 min[181] Polydopamine (PDA) functionalization Juncus effusus (JE) fiber Cr6+ maximum adsorption capacities: 145.8 mg/g [182] Table 3.
Comparative performance of agricultural waste-derived adsorbents for HM removal: methods, materials, and efficiency
-
Species Remediation site Remediation effect Target part Ref. Eichhornia crassipes Textile wastewater, mining wastewater Textile wastewater: Cr: 94.78%, Zn: 96.88%,
Mining wastewater: Fe: 70.5%, Cr: 69.1%Roots [185] Black algae Nutrient solution Cu2+: 61.4% Leaves [186] Cattail and vetiver Mensin gold bibiani Limited mining soil Hg: > 80%, As: > 80%, Cu: > 80%, Zn: > 80% Roots [187] Arundo donax and Phragmites australis Cartagena-La Unión mining area, Spain Phragmites australis: Pb: 480 mg/kg Stems and leaves [188] Arundo donax: Zn: 406 mg/kg Apium nodiflorum Nestos river, Greece The maximum daily removal capacity:
Cd: 0.208 kg, Cr: 0.45 kg, Cu: 0.368 kg, Pb: 0.113 kg,
Mn: 0.425 kg, As: 0.312 kg, Ni: 0.398 kg, Hg: 0.116 kg,
Zn: 0.357 kg, Sn: 0.197 kgWhole plant [189] Chlorella vulgaris Copper mine tailings water, northern Chile Cu: 64.7%, Mo: 99.9% Cell surface (adsorption) and intracellular (absorption) [190] Pistia stratiotes Steel mill wastewater Cd: 82.8%, Cu: 78.6%, Pb: 73% Roots [191] Salvinia natans Electroplating plant wastewater Zn: 84.8%, Cu: 73.8%, Ni: 56.8%, Cr: 41.4% Leaves [192] Azolla Polluted water bodies Al3+: 96%, Fe3+: 92%, Au3+: 100% Whole plant [193] Lythrum salicaria L Aquatic systems pH: 7 and Ni2+: 10 mg/L, Roots: 3,737.8 mg/kg,
Stems: 697 mg/kg, Leaves: 418.4 mg/kgRoots, stems and leaves [194] Stachys inflata Bama Pb-zinc mining area AMF + PGPR + earthworms: Pb availability increased:
25 mg/kg, Zn availability increased: 102 mg/kgWhole plant [195] Lemna gibba Hayatabad Industrial Estate (HIE) wastewater Cd: 95%, Cu: 93%, Pb: 82%, Ni: 88%, Cr: 92% Roots and shoots [196] Nymphaea aurora Hydroponic experiment pH: 5.5, Cd: 140 mg/g, Cd: 140 mg/g Shoots and leaves [197] Table 4.
Phytoremediation performance of various plant and algal species for HM removal from contaminated aquatic systems
Figures
(5)
Tables
(4)