-
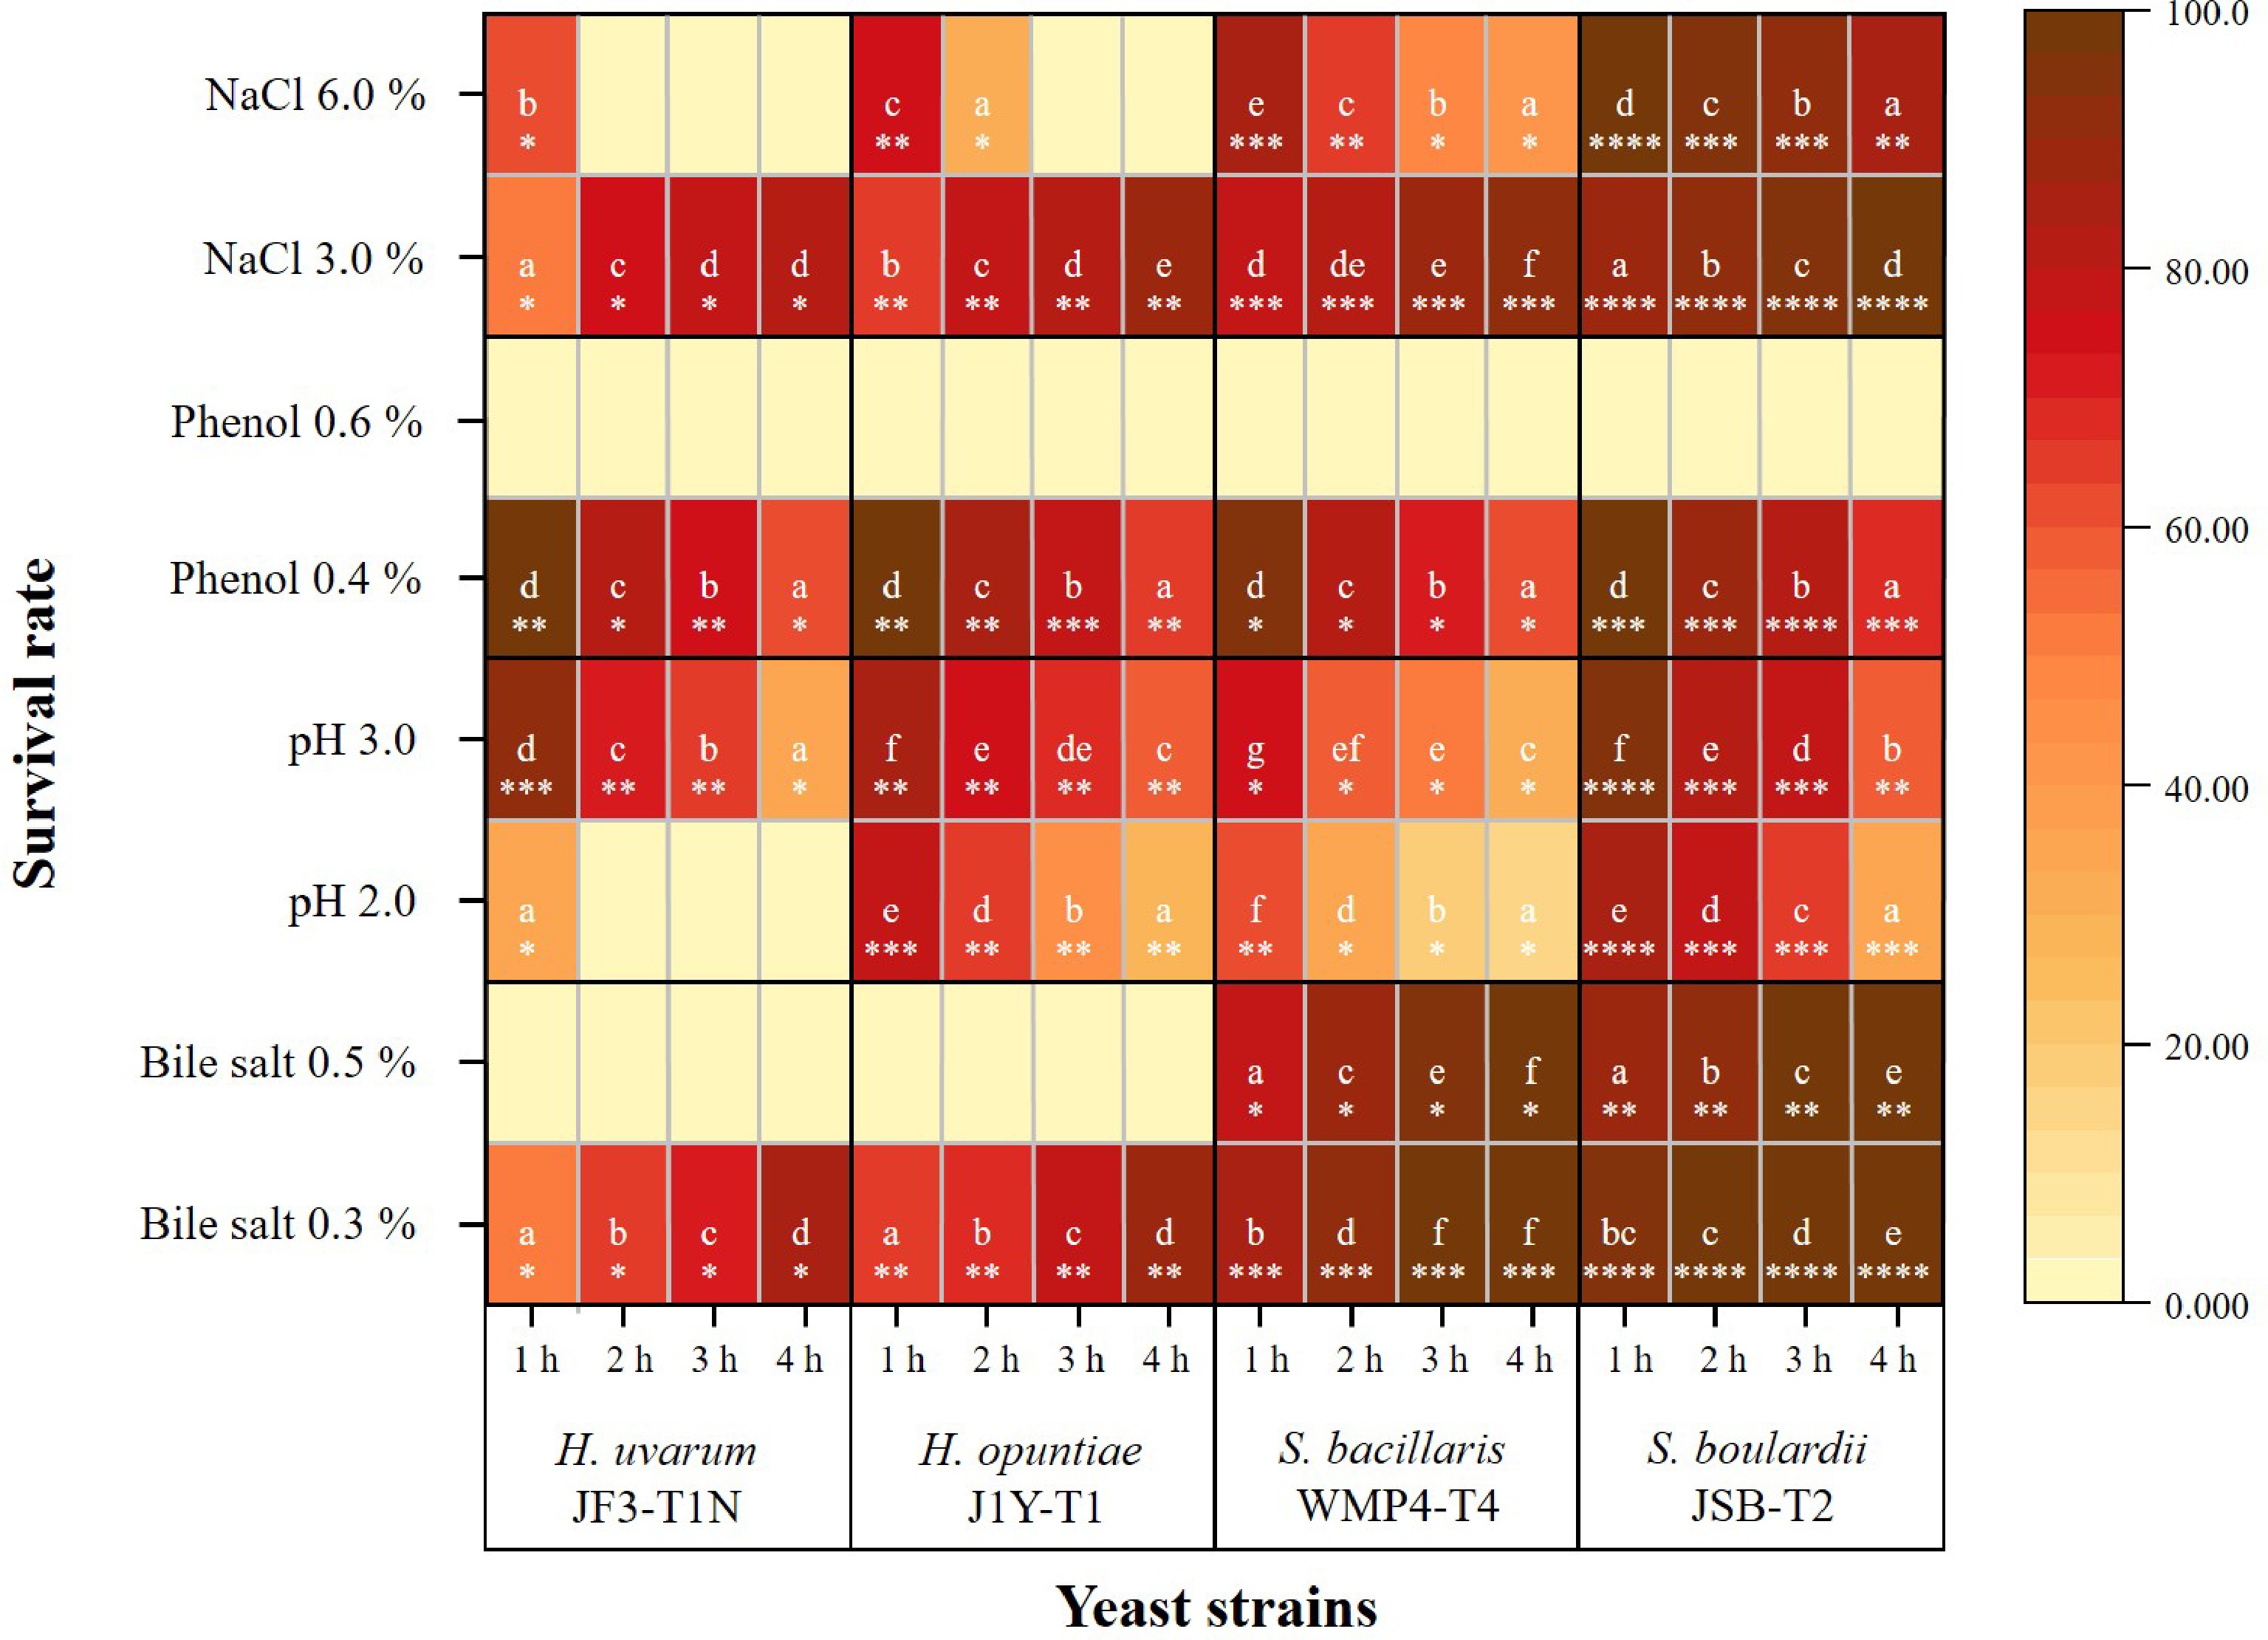
Figure 1.
Heatmap of the survival rates of selected yeast strains under various in vitro gastrointestinal conditions (including different concentrations of bile salts, pH levels, phenol, and NaCl). Color intensity ranges from light yellow (low survival) to dark brown (high survival). Distinct alphabetical letters indicate statistically significant differences within a strain across different concentrations or treatment levels over a 1–4 h period. The different counts of asterisks (*) indicate statistically significant differences between strains exposed to the same condition at a given time point, based on a 95% confidence level.
-
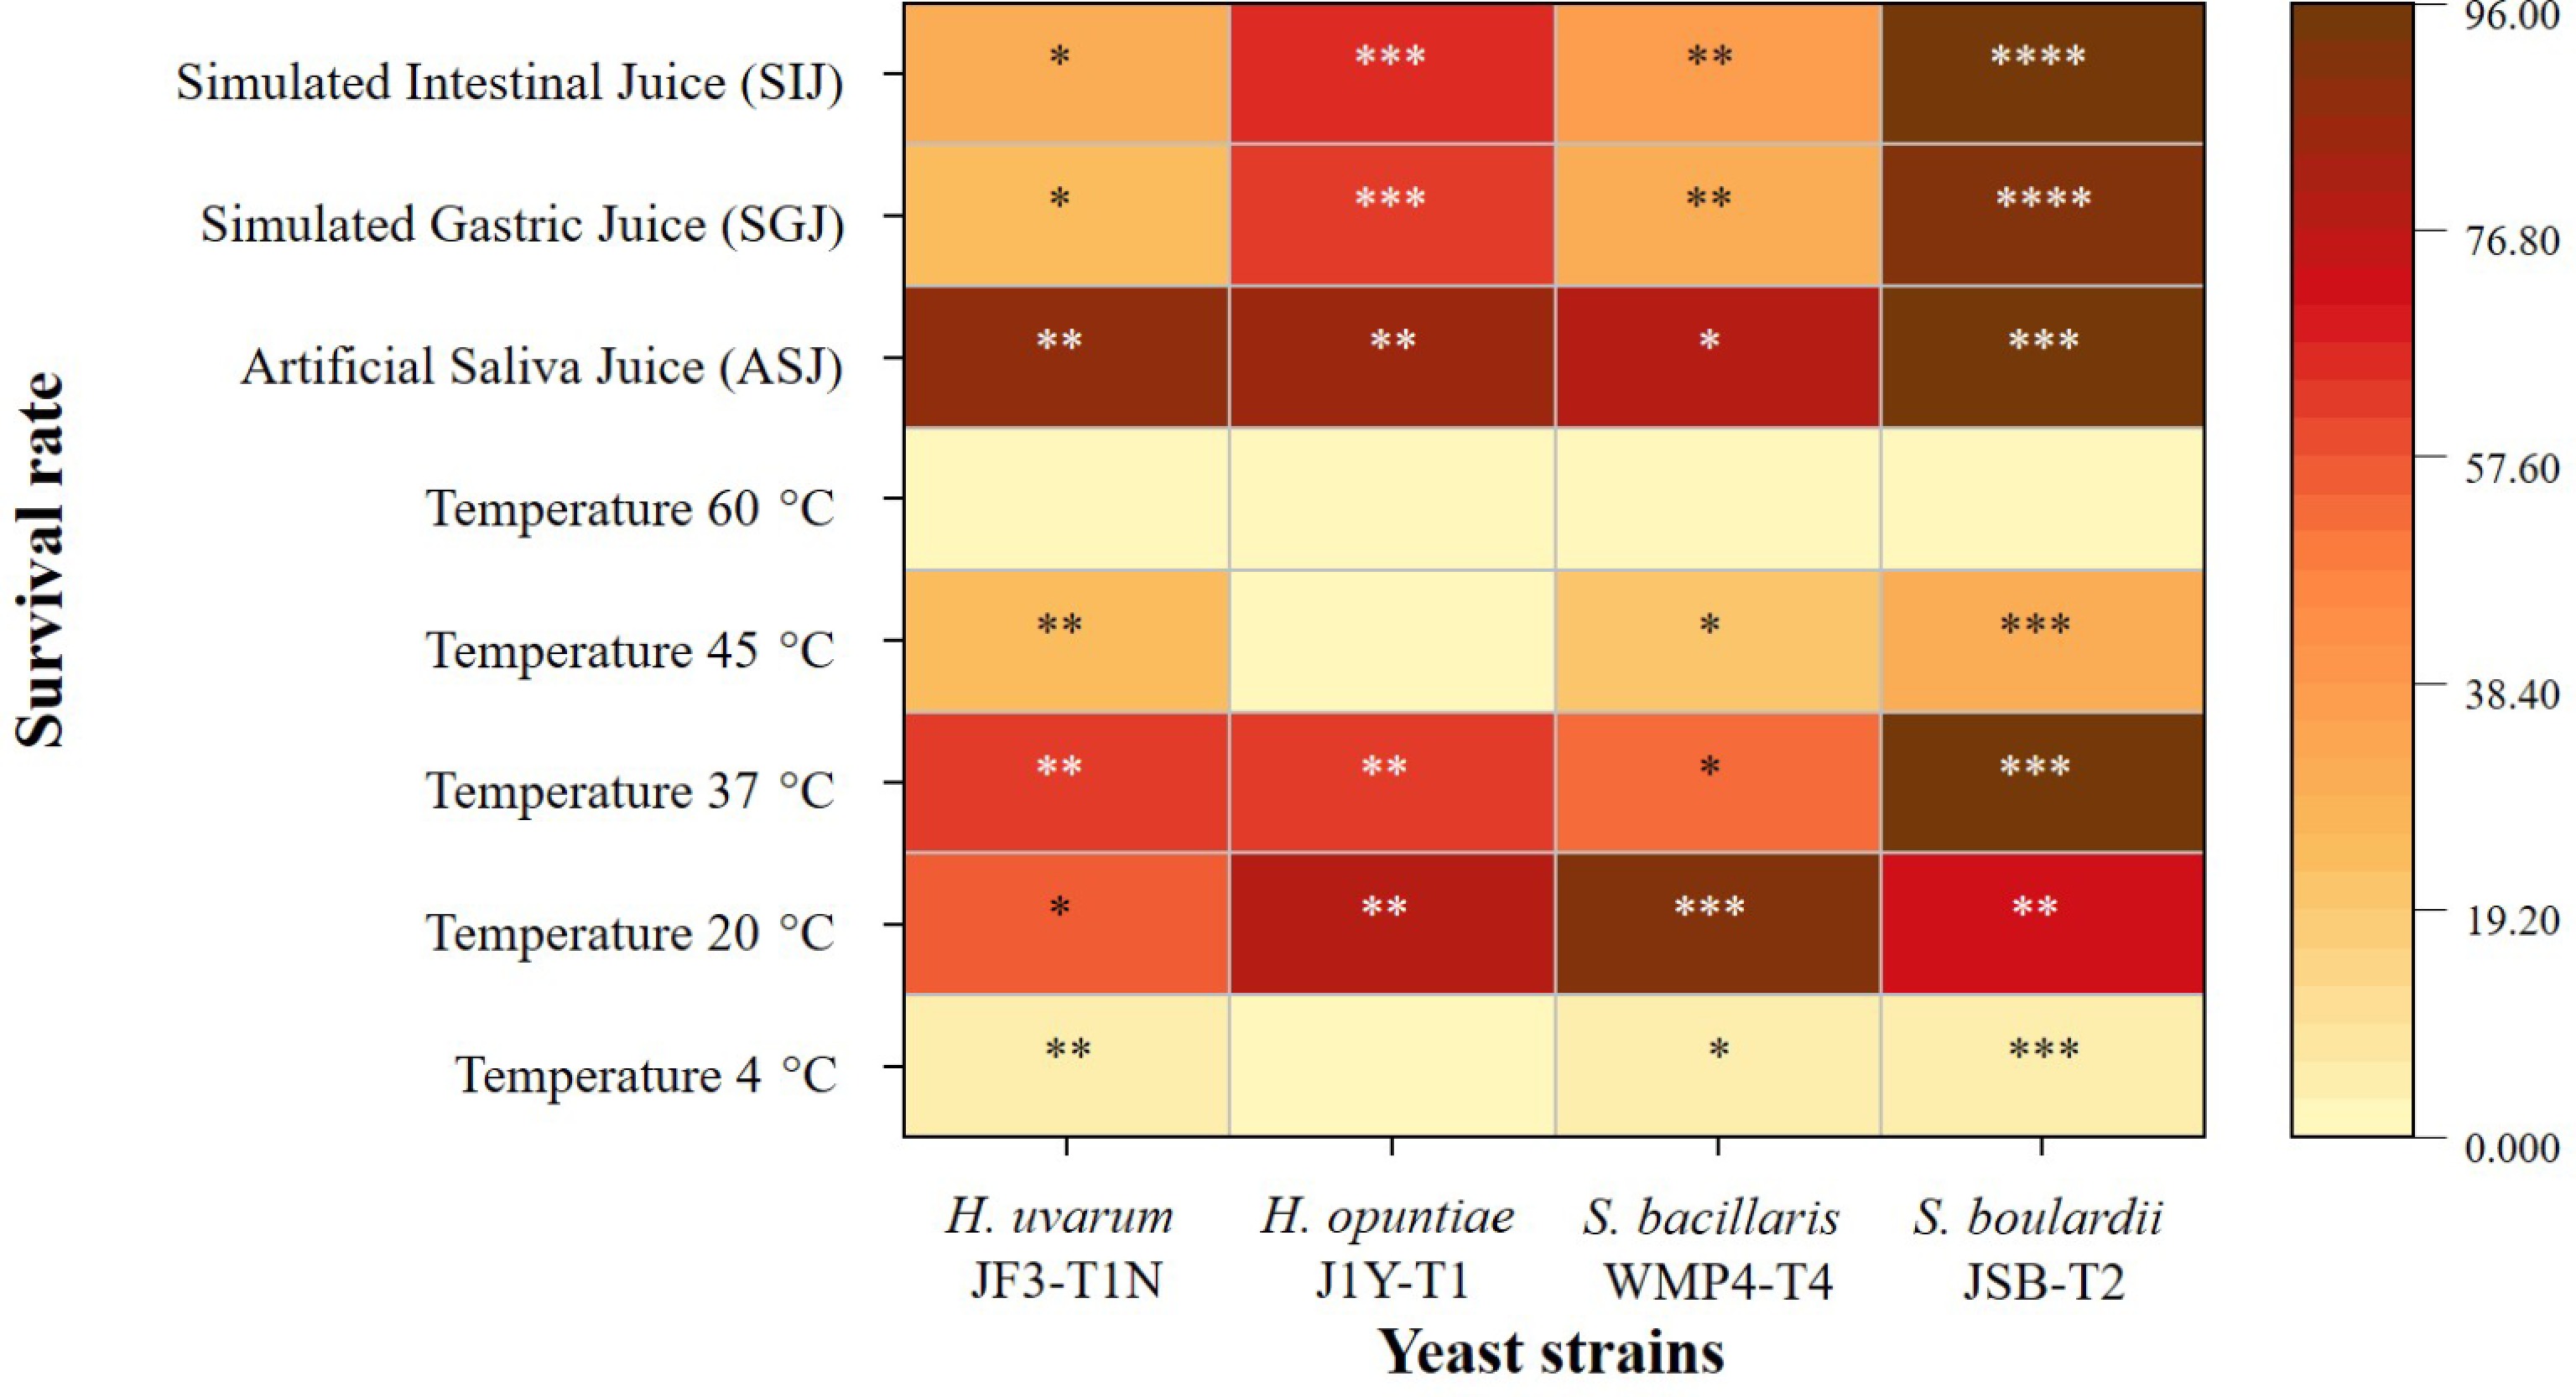
Figure 2.
Heatmap of the survival rates of selected yeast strains under various temperatures and simulated gastrointestinal conditions. Color intensity ranges from light yellow (low survival) to dark brown (high survival). The different counts of asterisks (*) indicate statistically significant differences between strains exposed to the same condition at a given time point, based on a 95% confidence level.
-
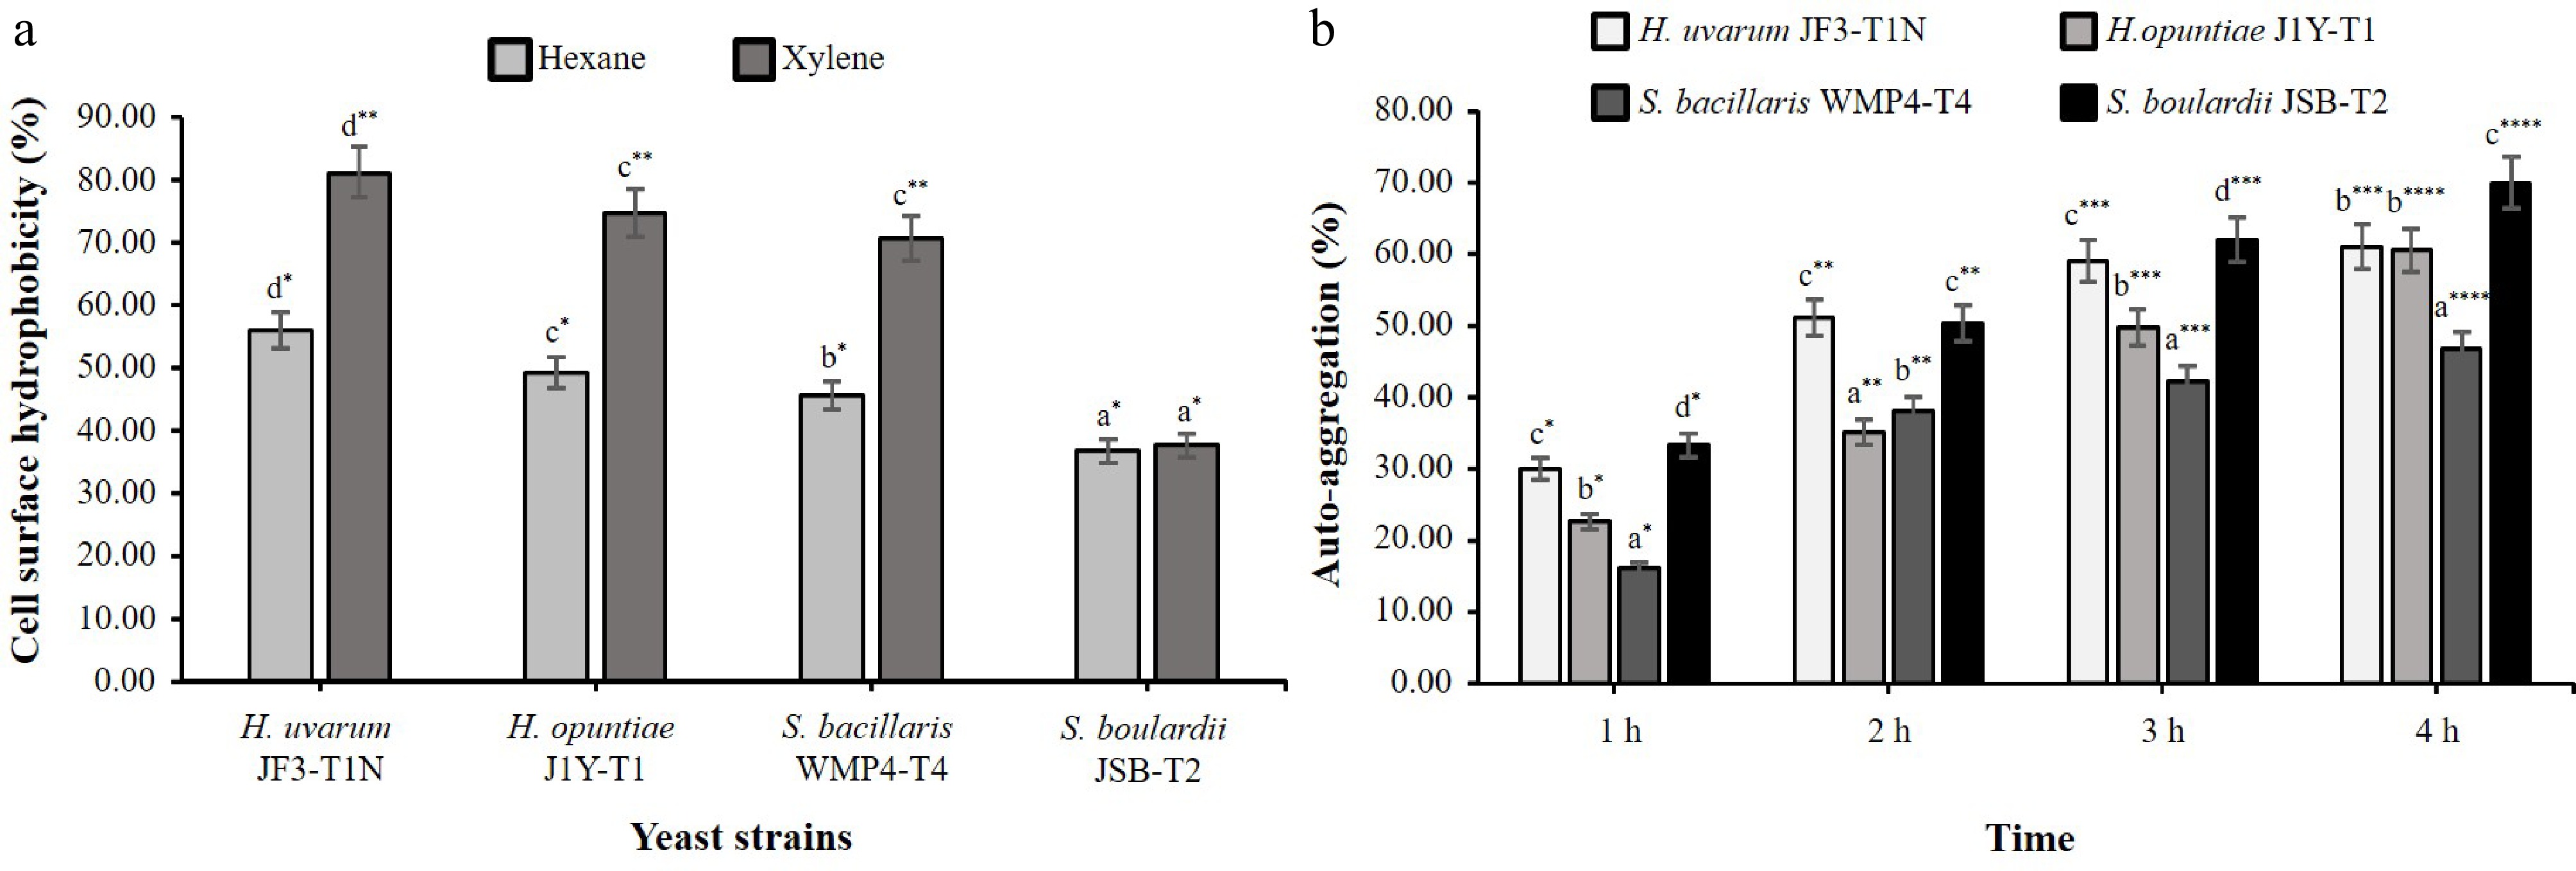
Figure 3.
Cell surface characteristics of selected yeast strains. (a) Hydrophobicity with different organic solvents. (b) Auto-aggregation ability over a 1–4 h period. Different alphabetical letters indicate statistically significant differences between strains and different counts of asterisks (*) denote significant differences between tested conditions within the same strain at a 95% confidence interval.
-
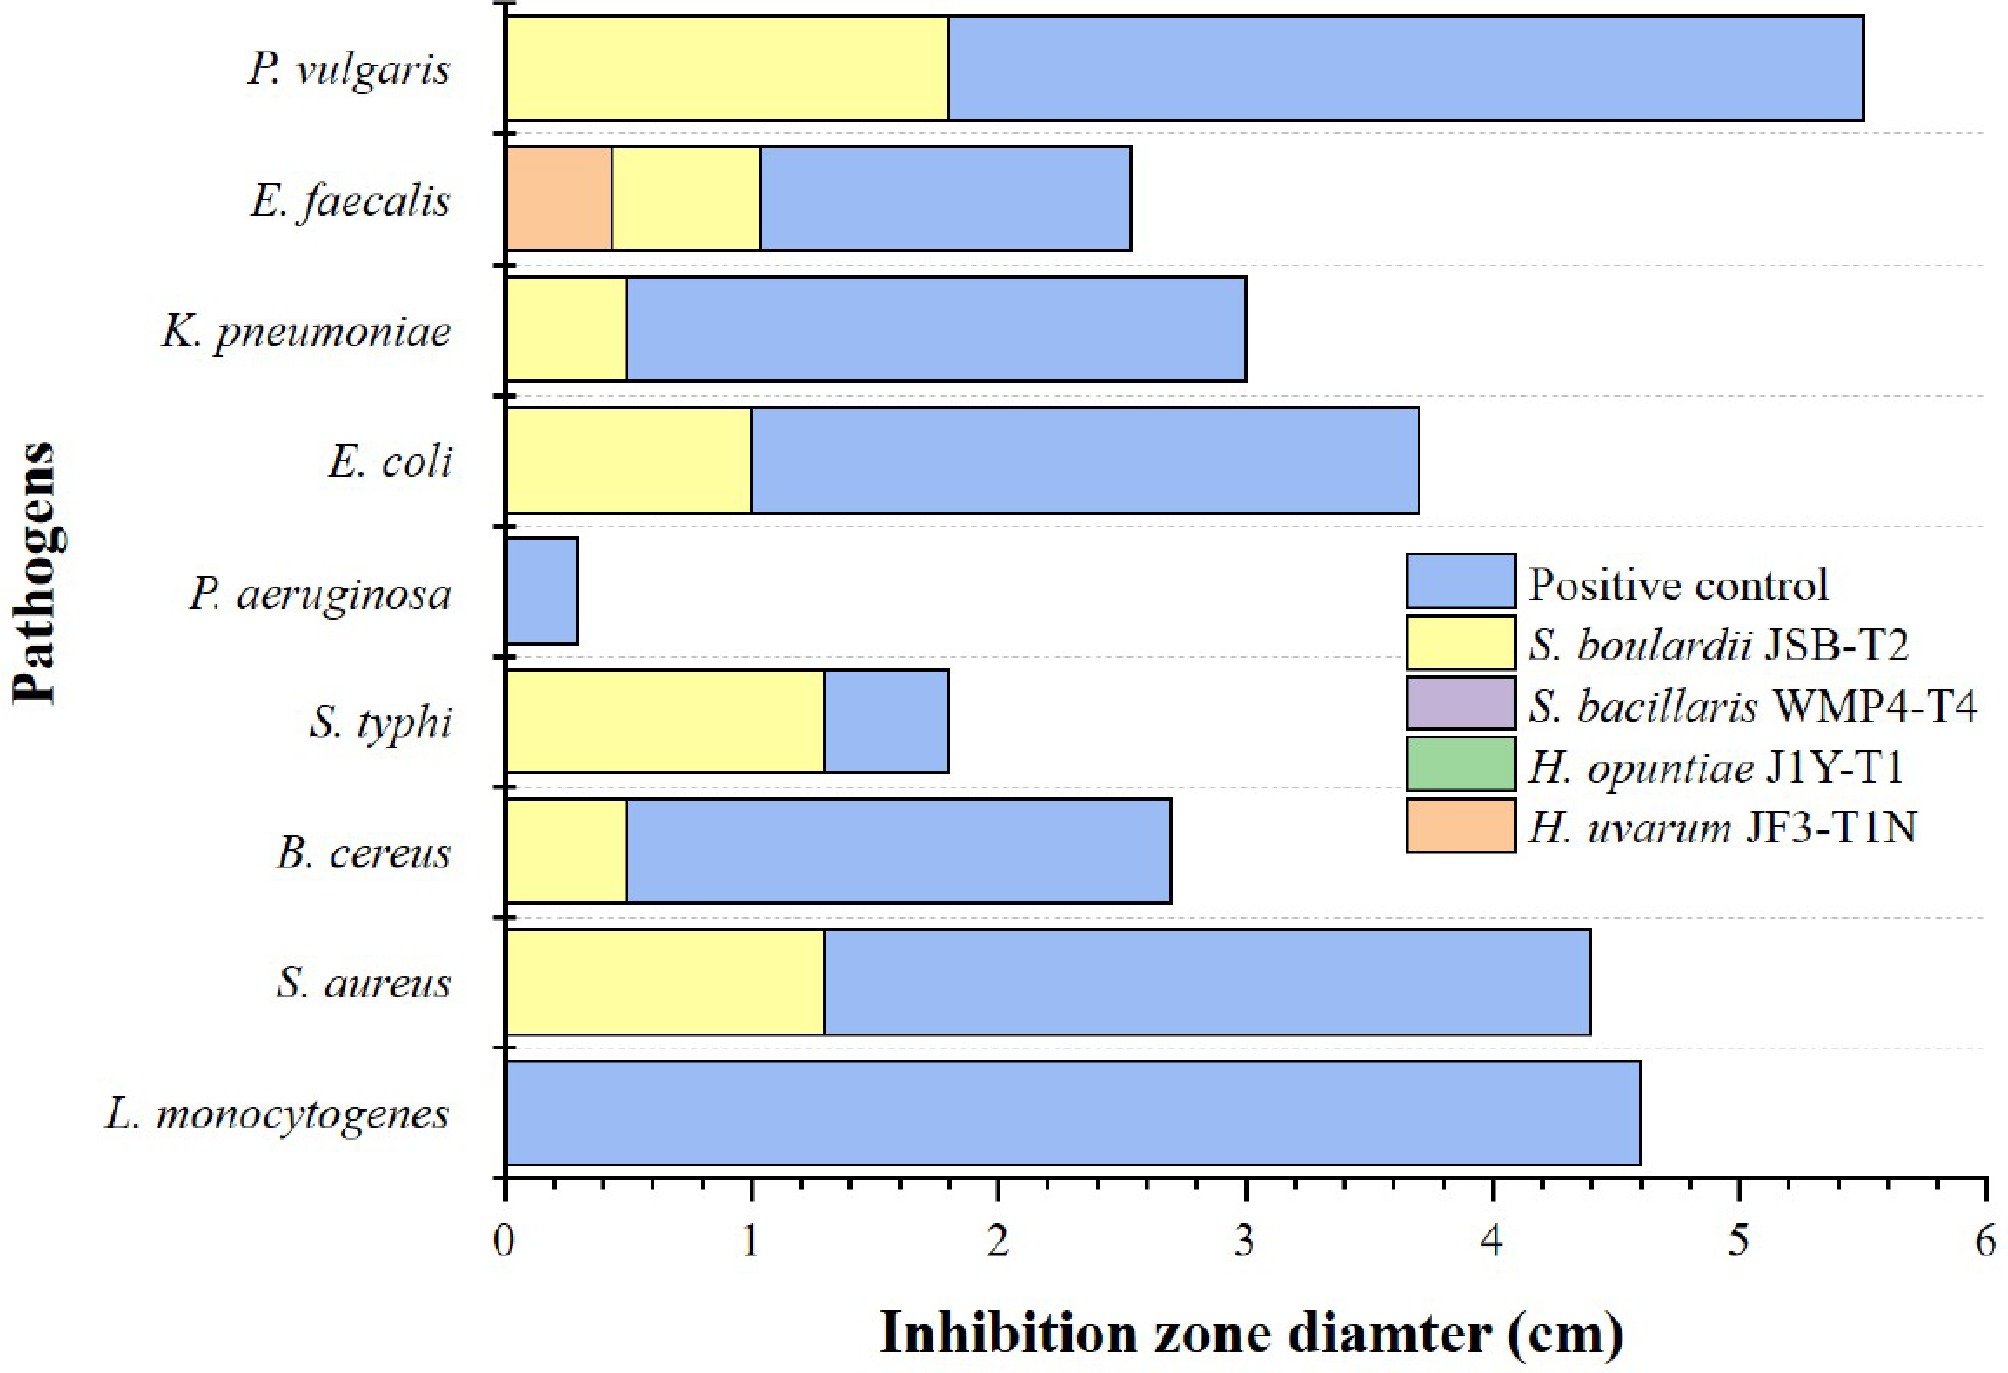
Figure 4.
Antibacterial activity of selected yeast strains against different foodborne pathogens. Different colours indicate the tested yeast strains. Ampicillin was used as the positive control.
-
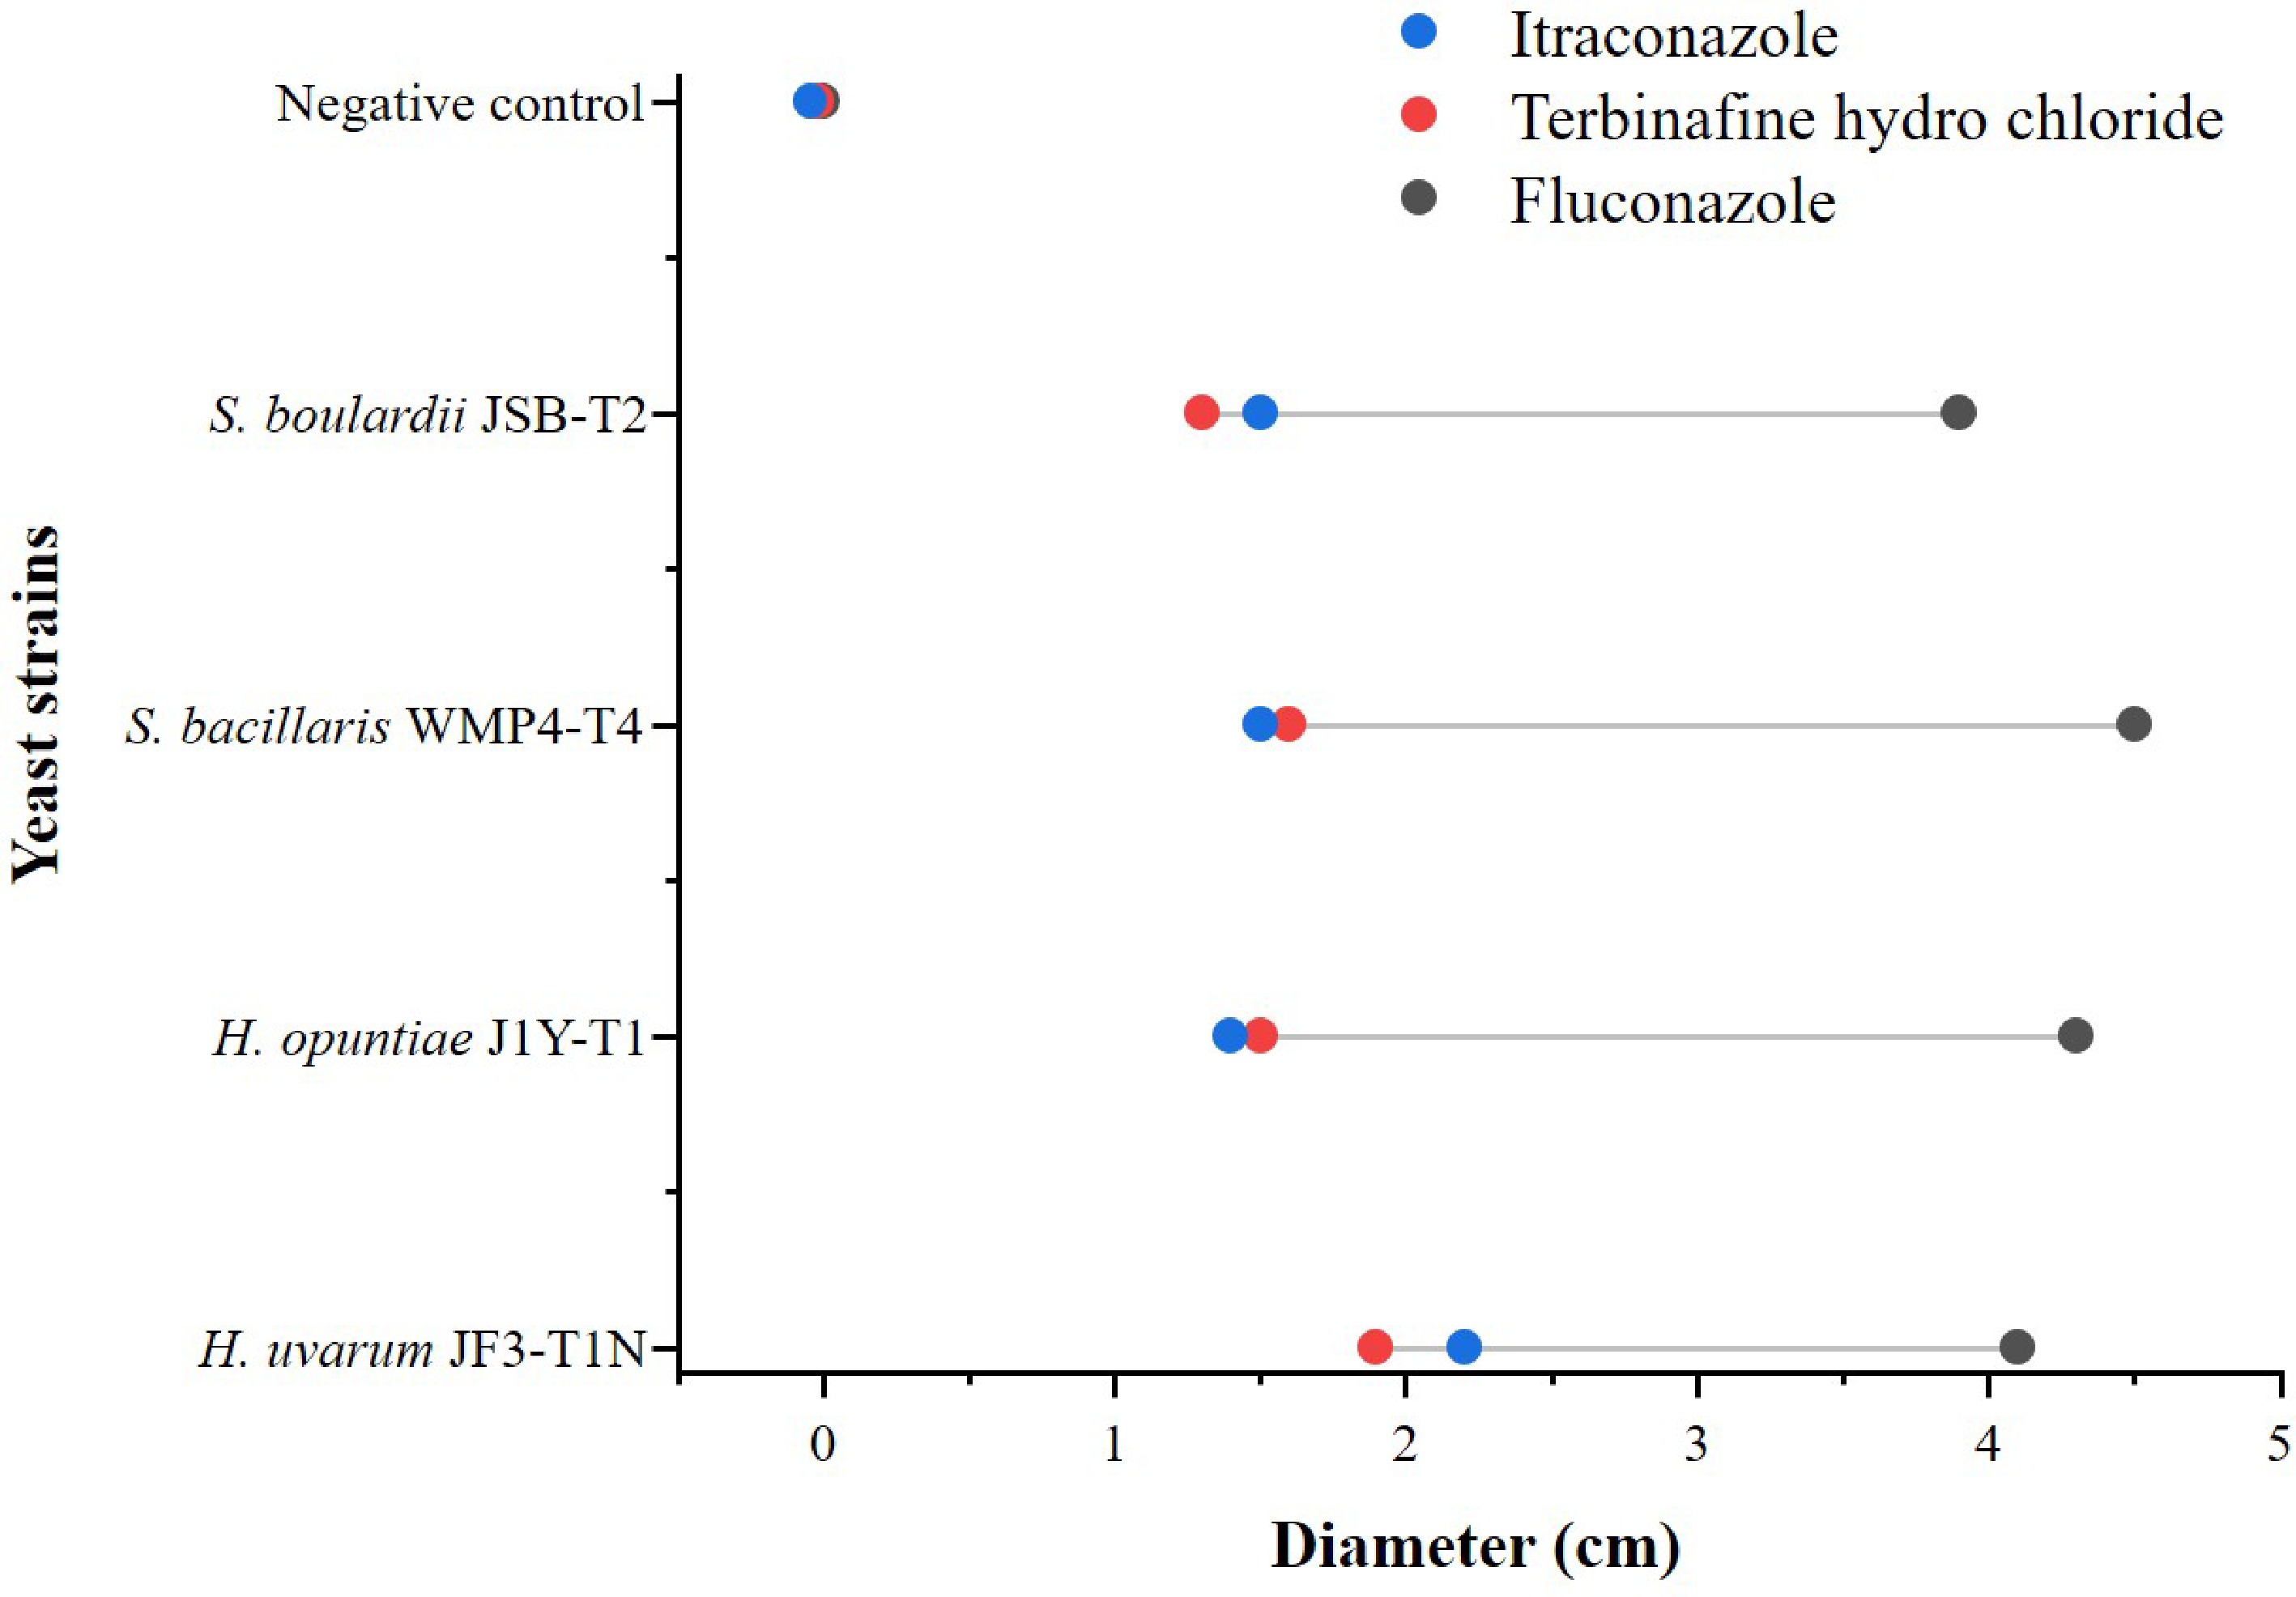
Figure 5.
Antifungal sensitivity of selected yeast strains. Different colours indicate different antifungal agents.
-
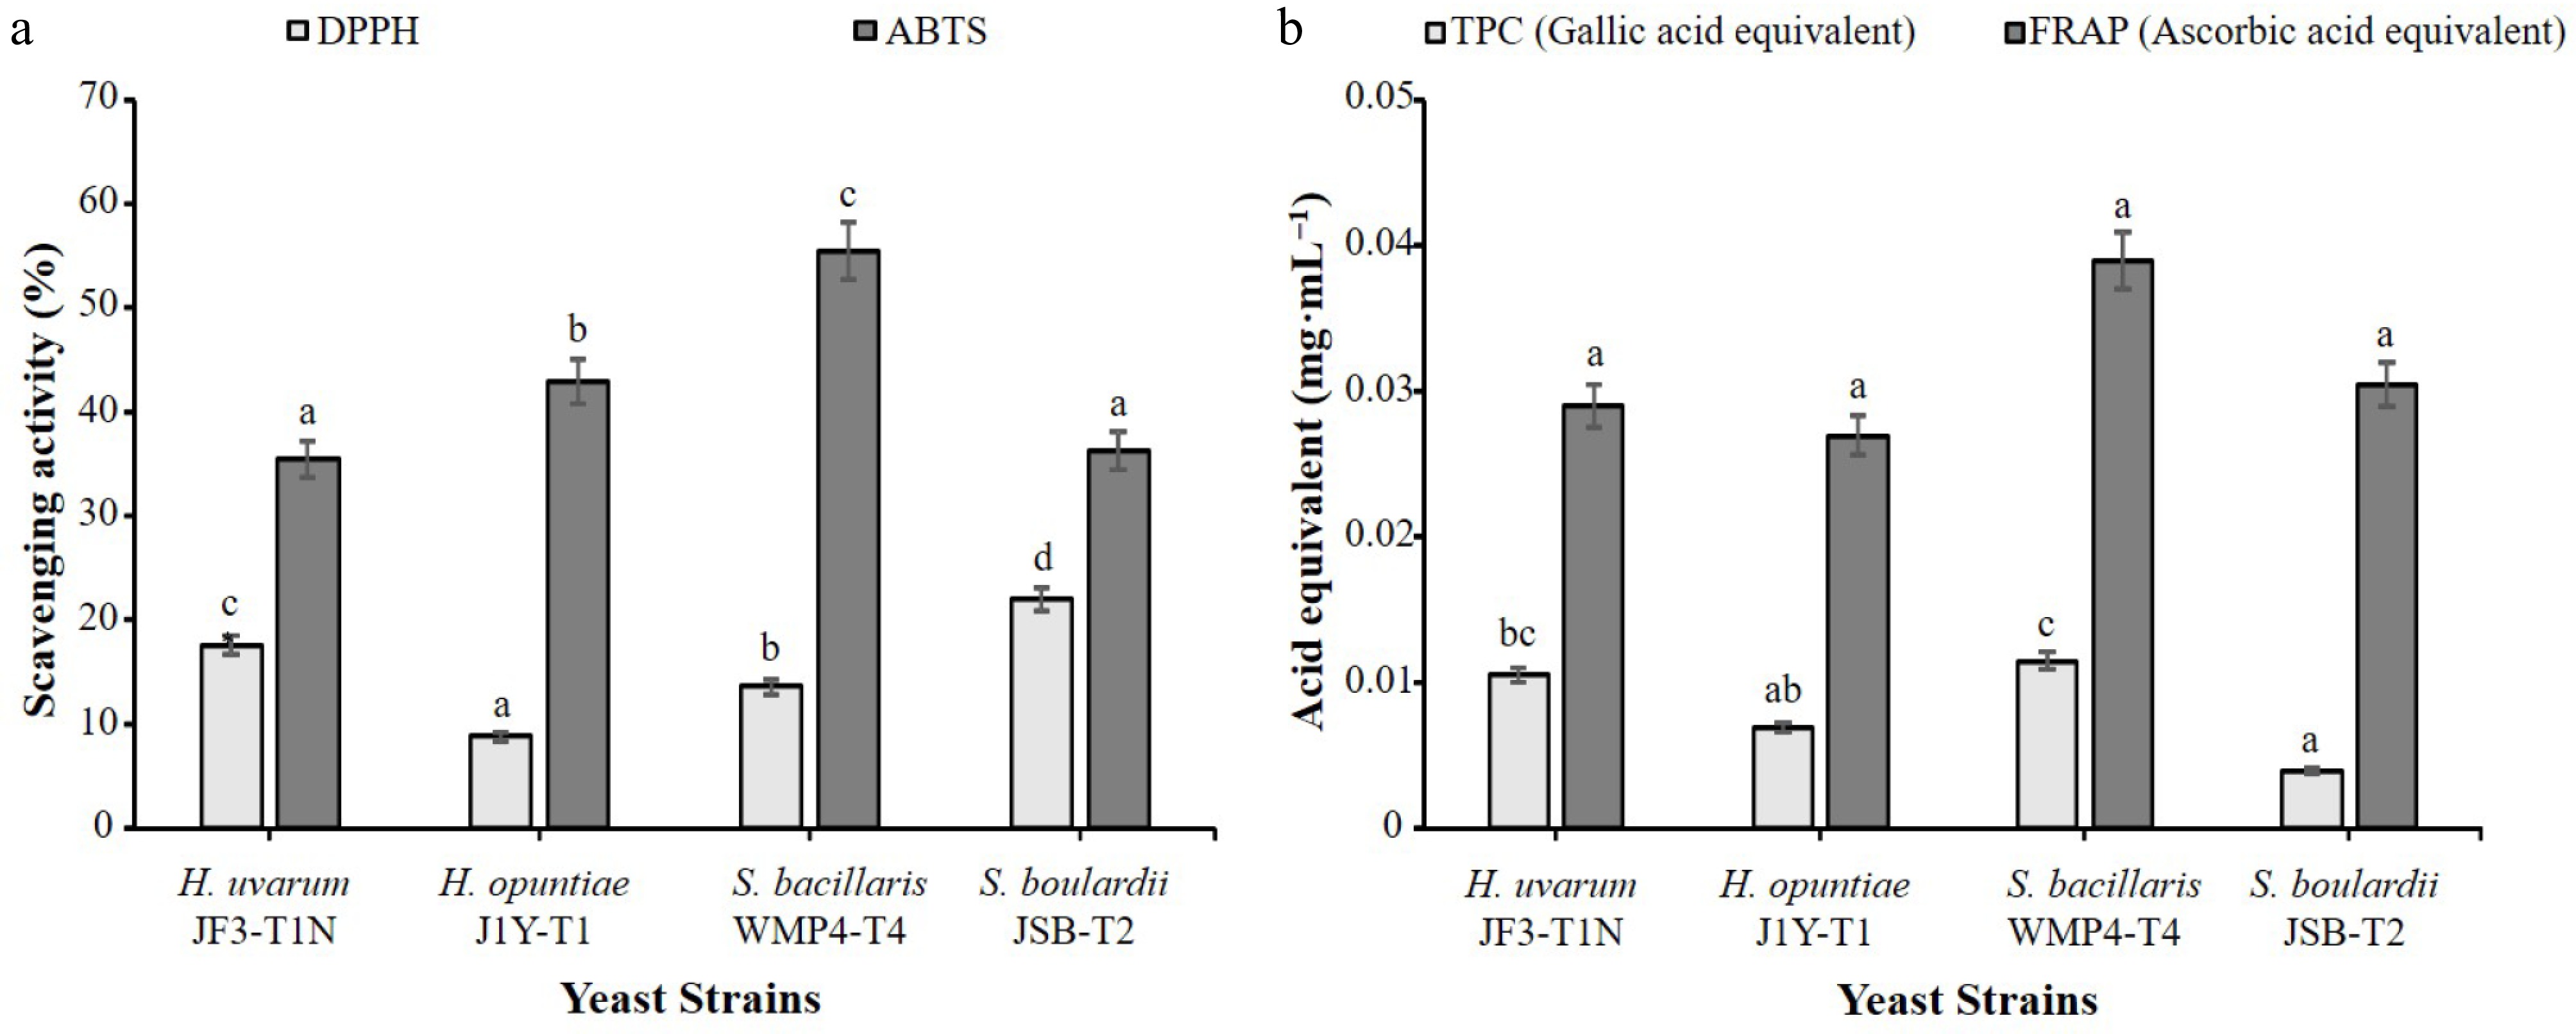
Figure 6.
Antioxidant properties of selected yeast strains. (a) Free radical scavenging activity shown as the percentage of scavenging in DPPH and ABTS assays. (b) Antioxidant capacity expressed as ascorbic acid equivalents in the FRAP assay and gallic acid equivalents in the TPC assay. Results are presented as mean ± standard deviation (n = 3). Different alphabetical letters indicate statistically significant differences among strains at a 95% confidence interval for the specific test.
Figures
(6)
Tables
(0)