-
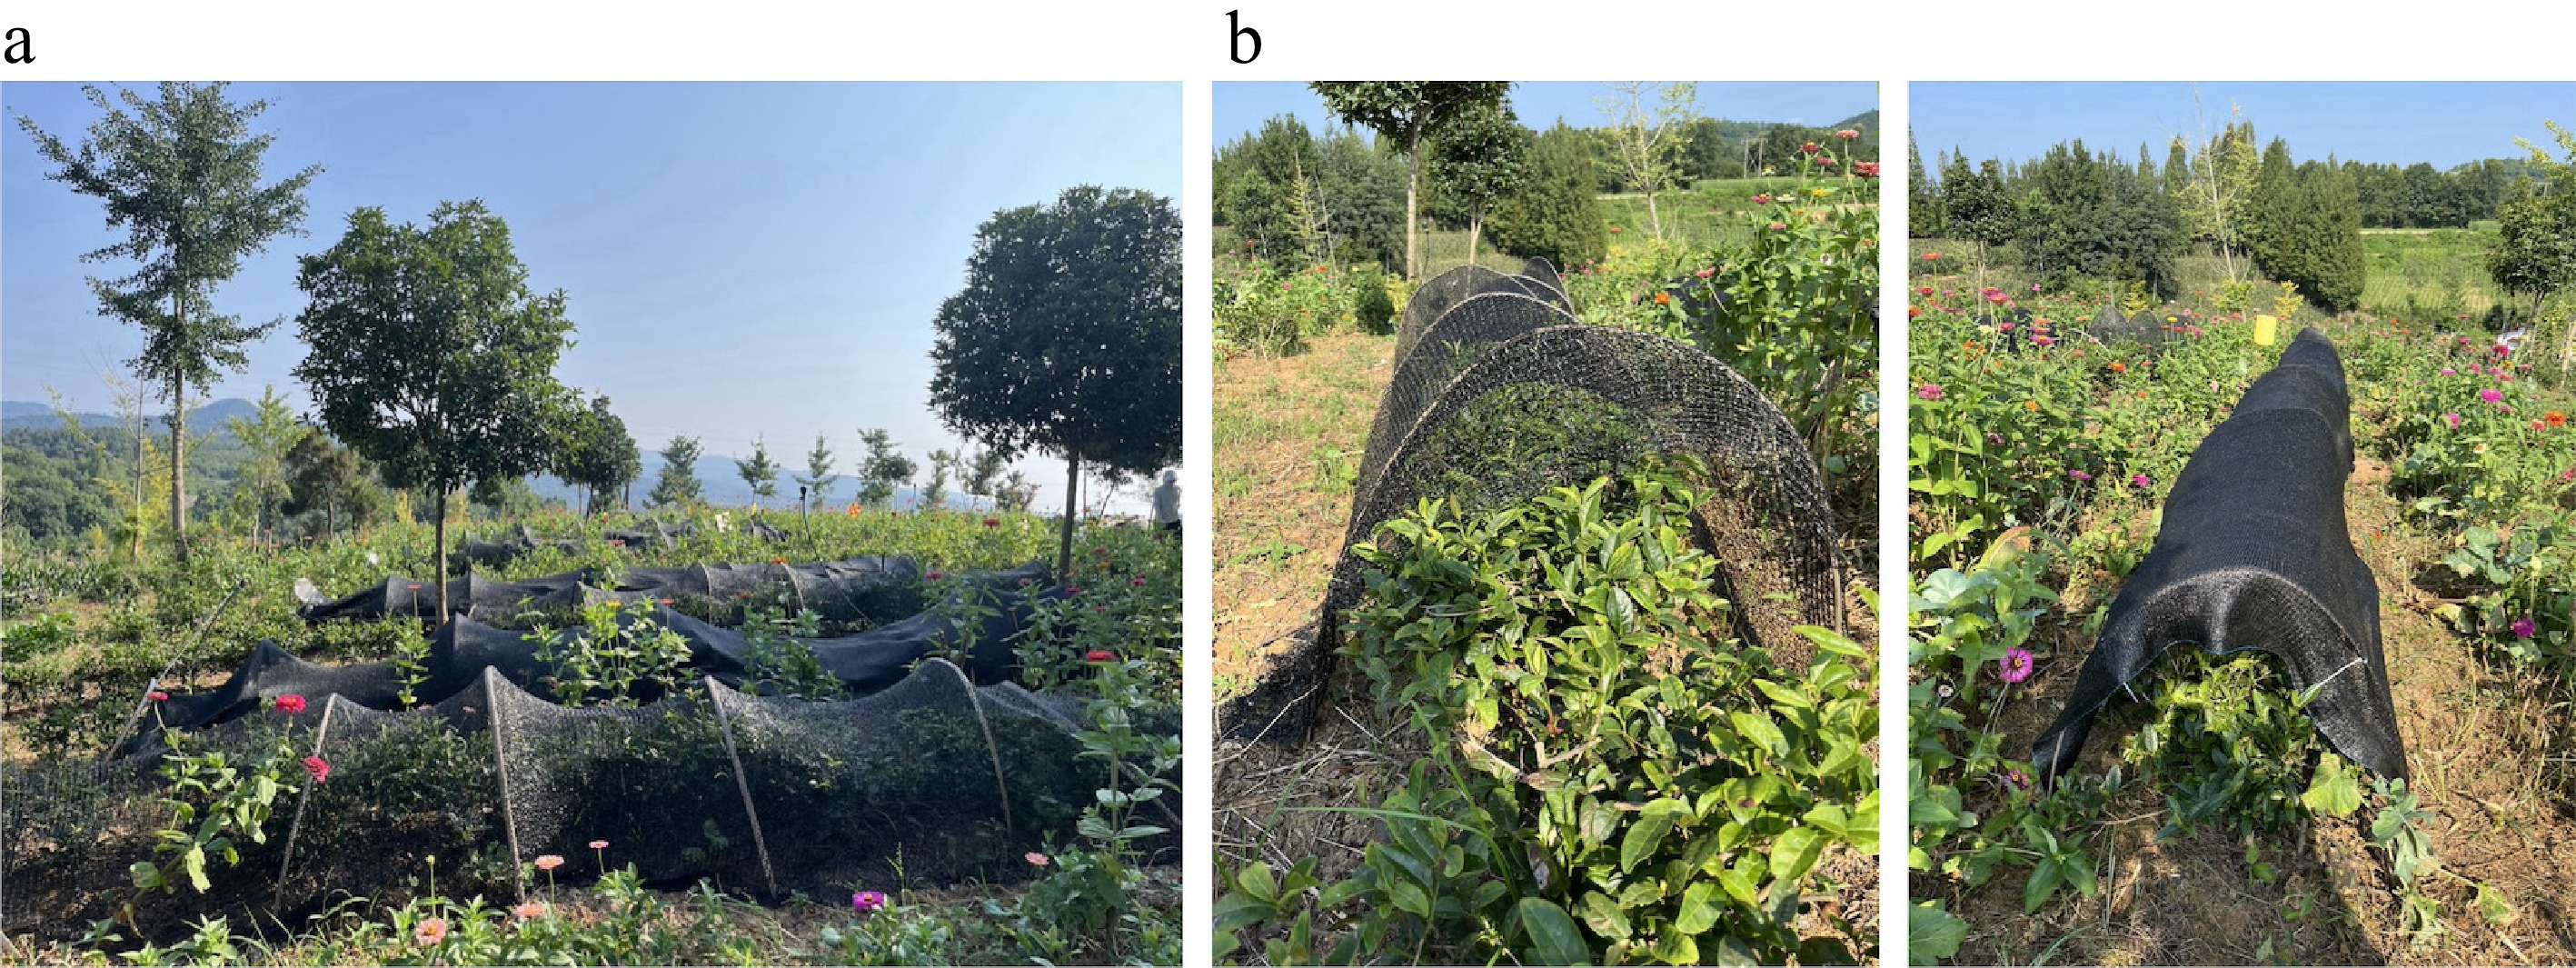
Figure 1.
(a) Panoramic view of the tea plantation, and (b) treatments with 40% and 70% shade levels.
-
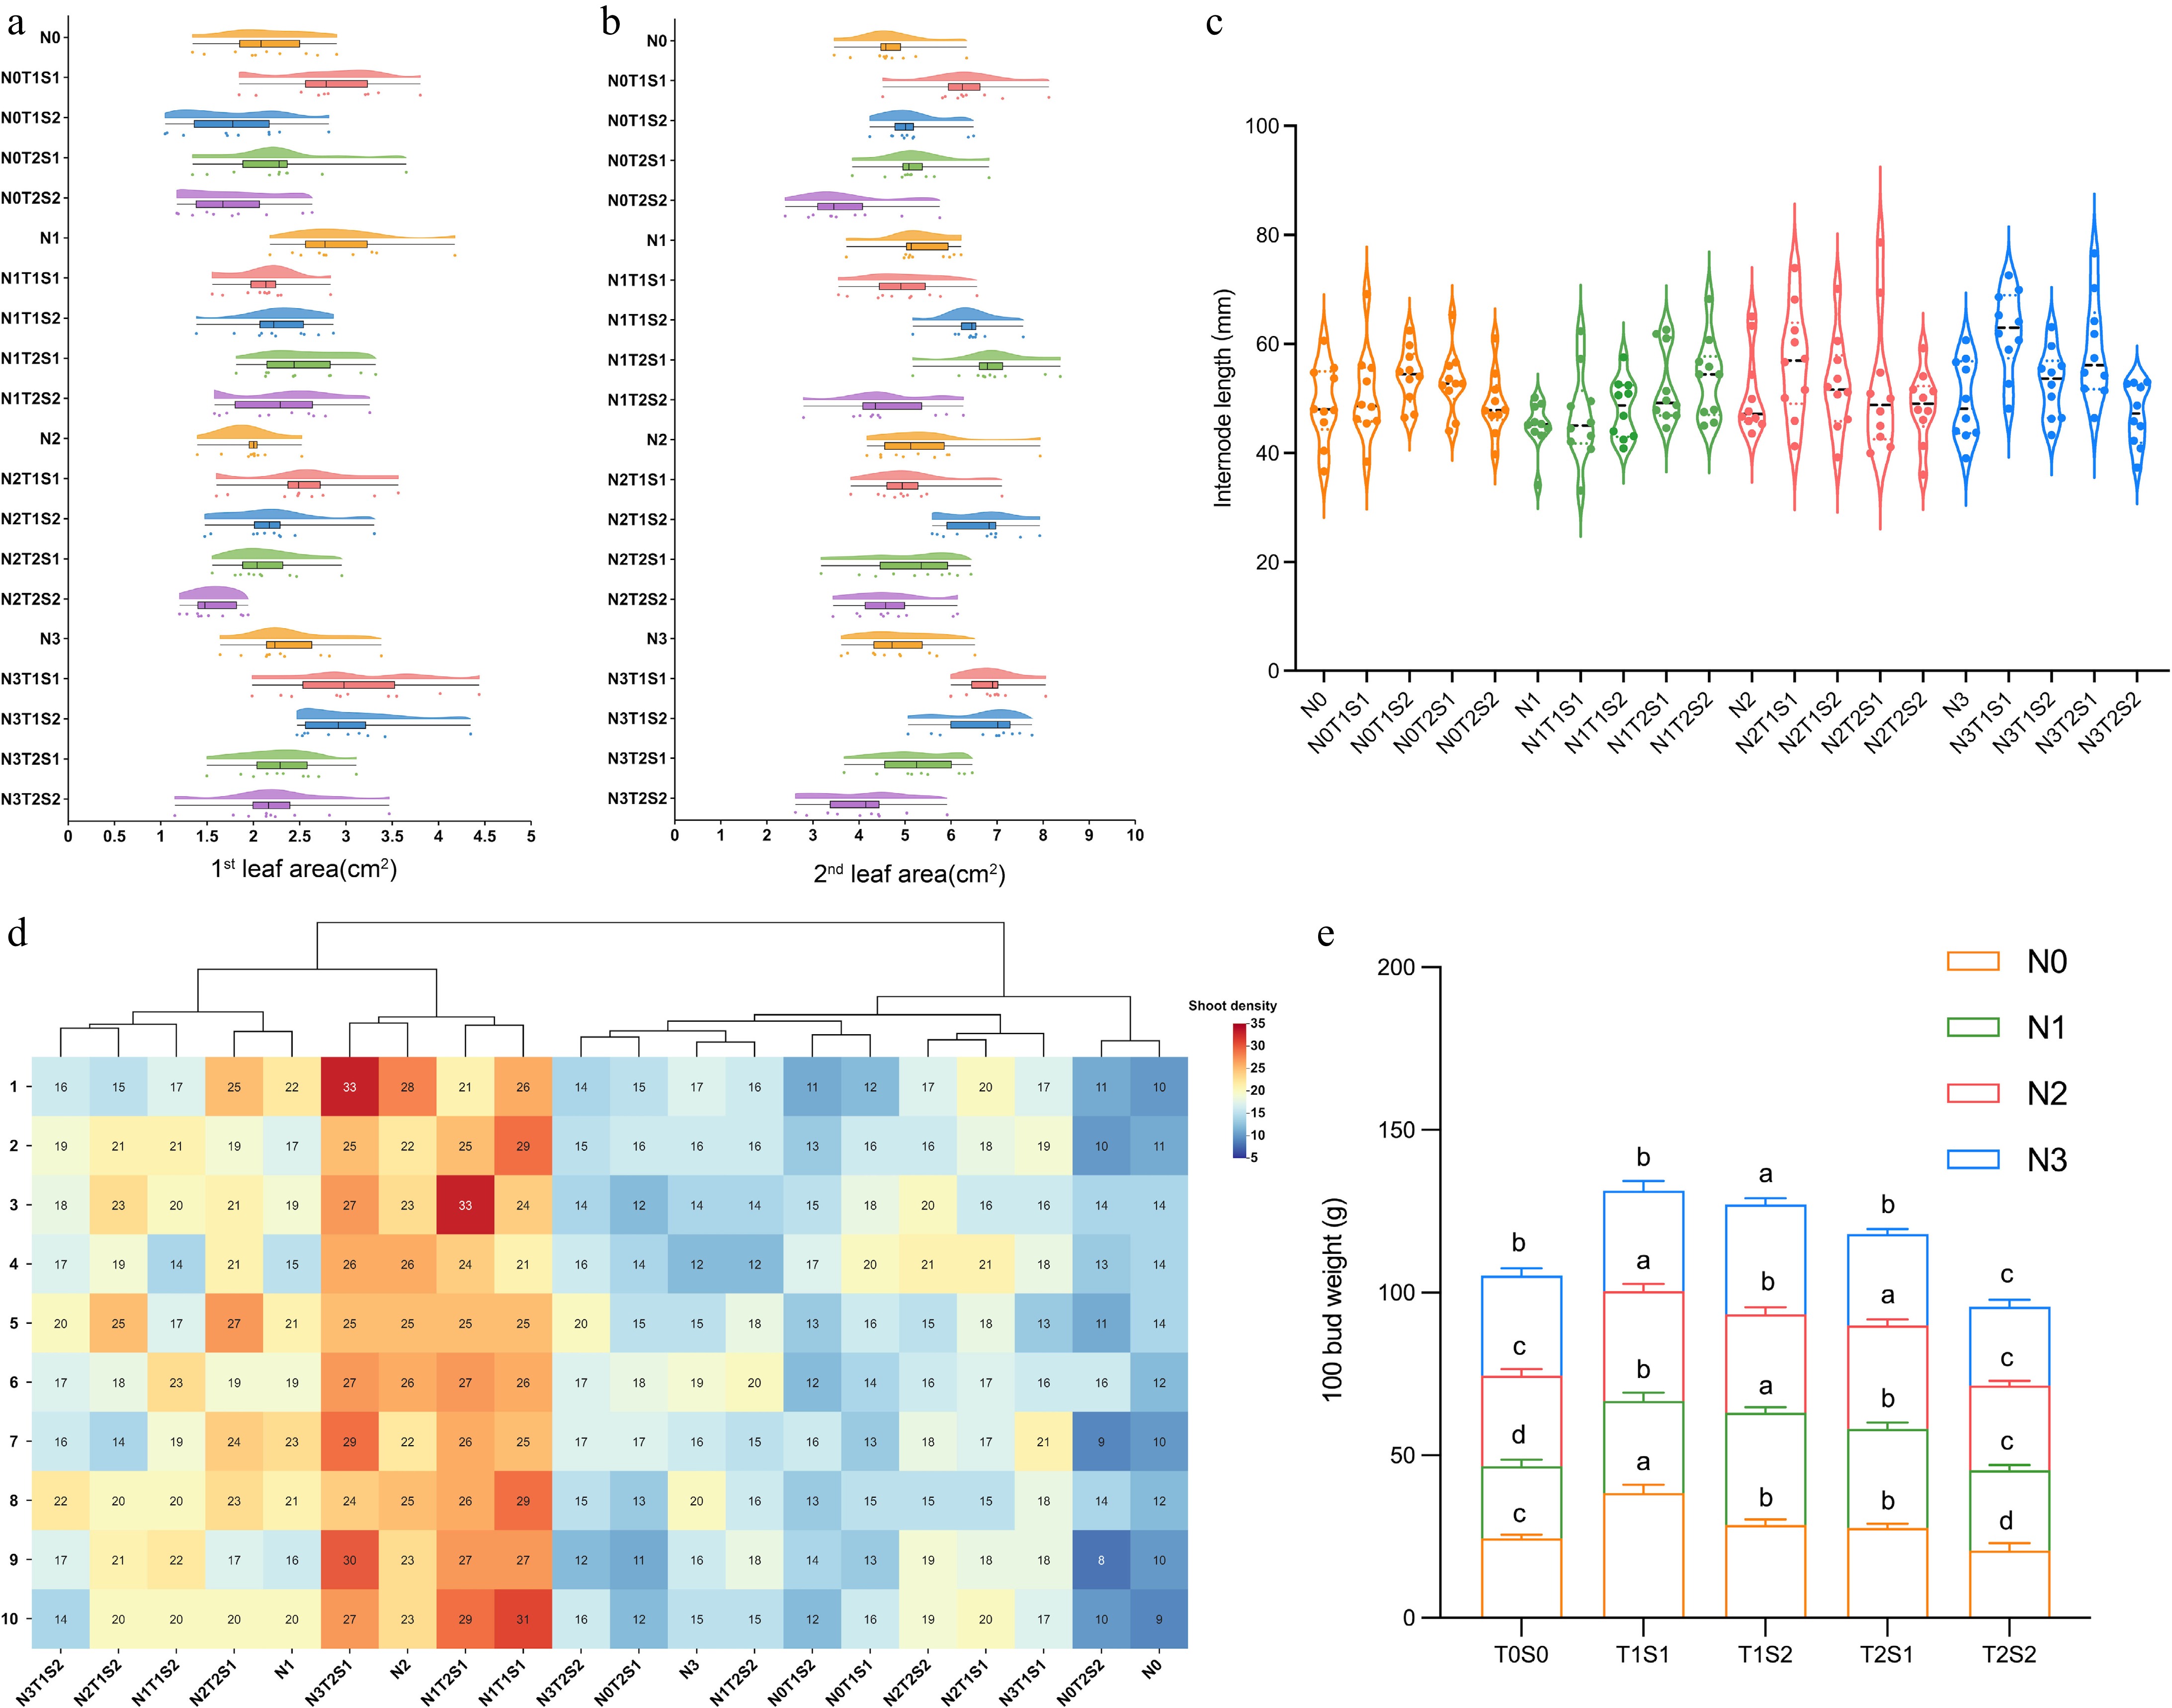
Figure 2.
Effect of different nitrogen fertilizers and shade conditions on the growth of tea plant. (a) 1st leaf area, (b) 2nd leaf area, (c) internode length, (d) shoots density, (e) 100 bud weight. Lowercase letters above the error bars indicate significant differences (p < 0.05).
-
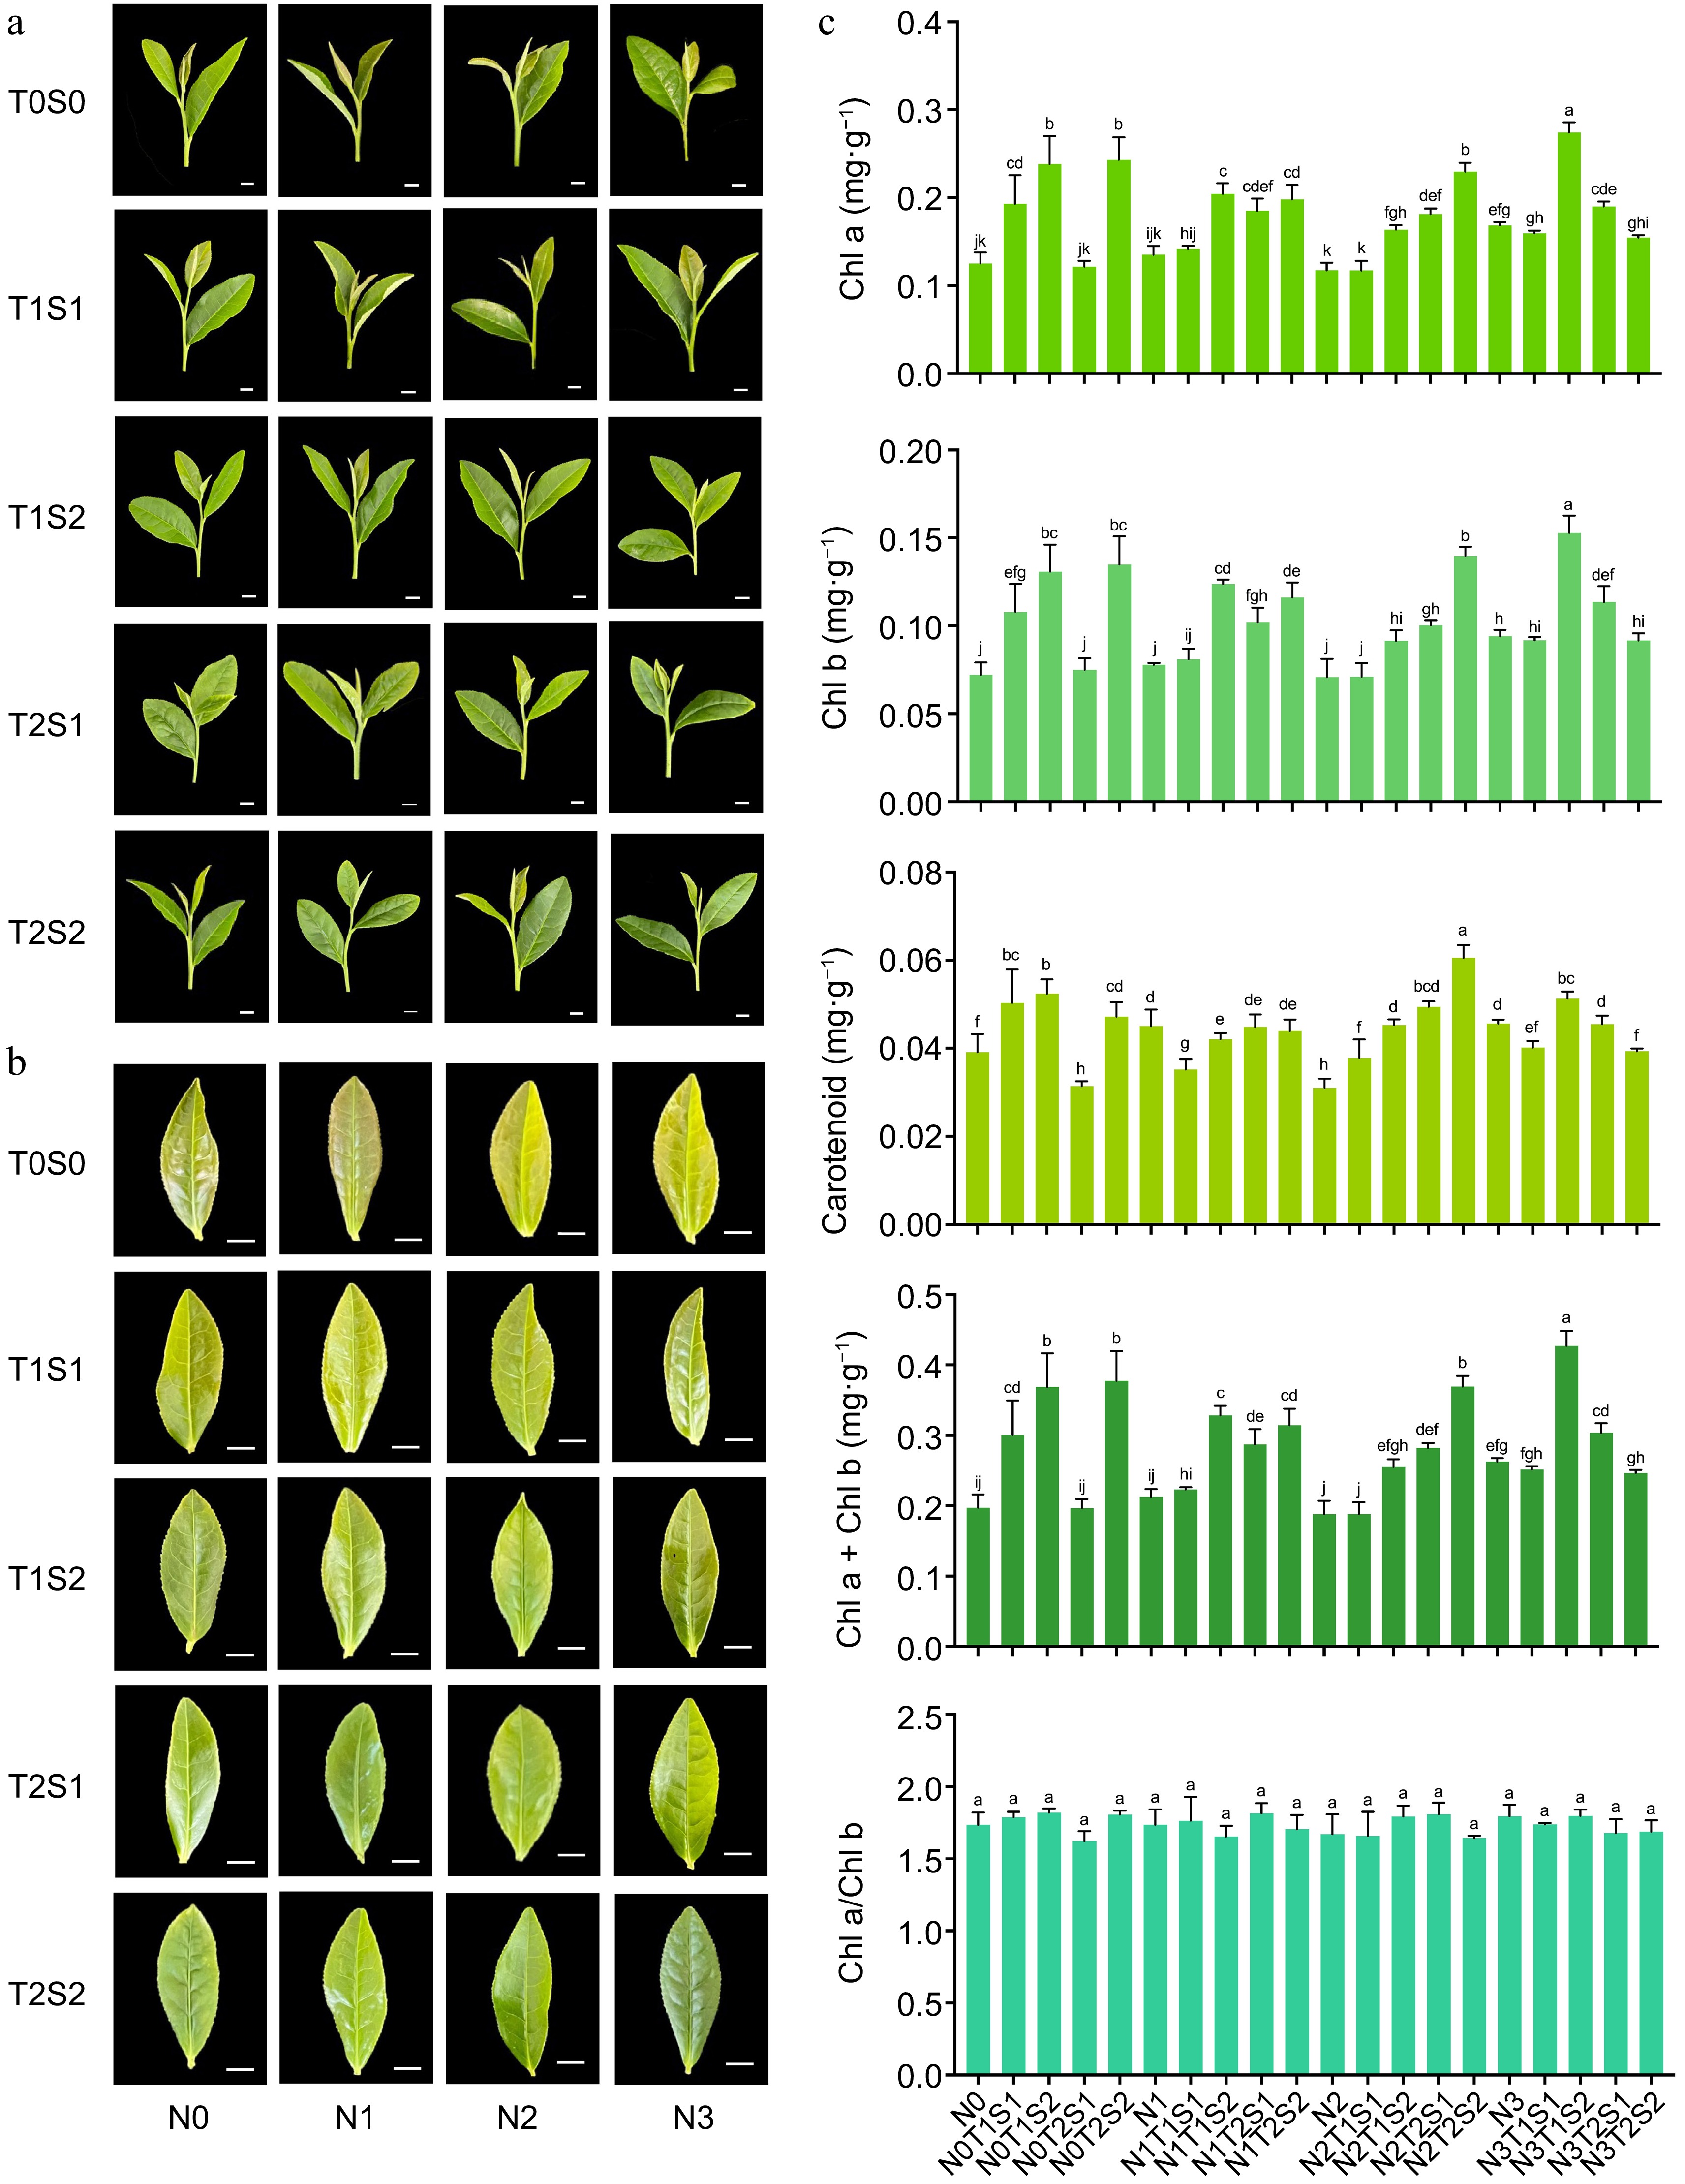
Figure 3.
Effect of different nitrogen fertilizers and shade conditions on the leaf color of the tea plant. (a) Comparison of the growth of one bud and three leaves of tea plant new shoots. (b) Comparison of leaf color of the second leaf of tea plant. (c) Chlorophyll content of the one bud and two leaves of the tea plant. Lowercase letters above the error bars indicate significant differences (p < 0.05).
-
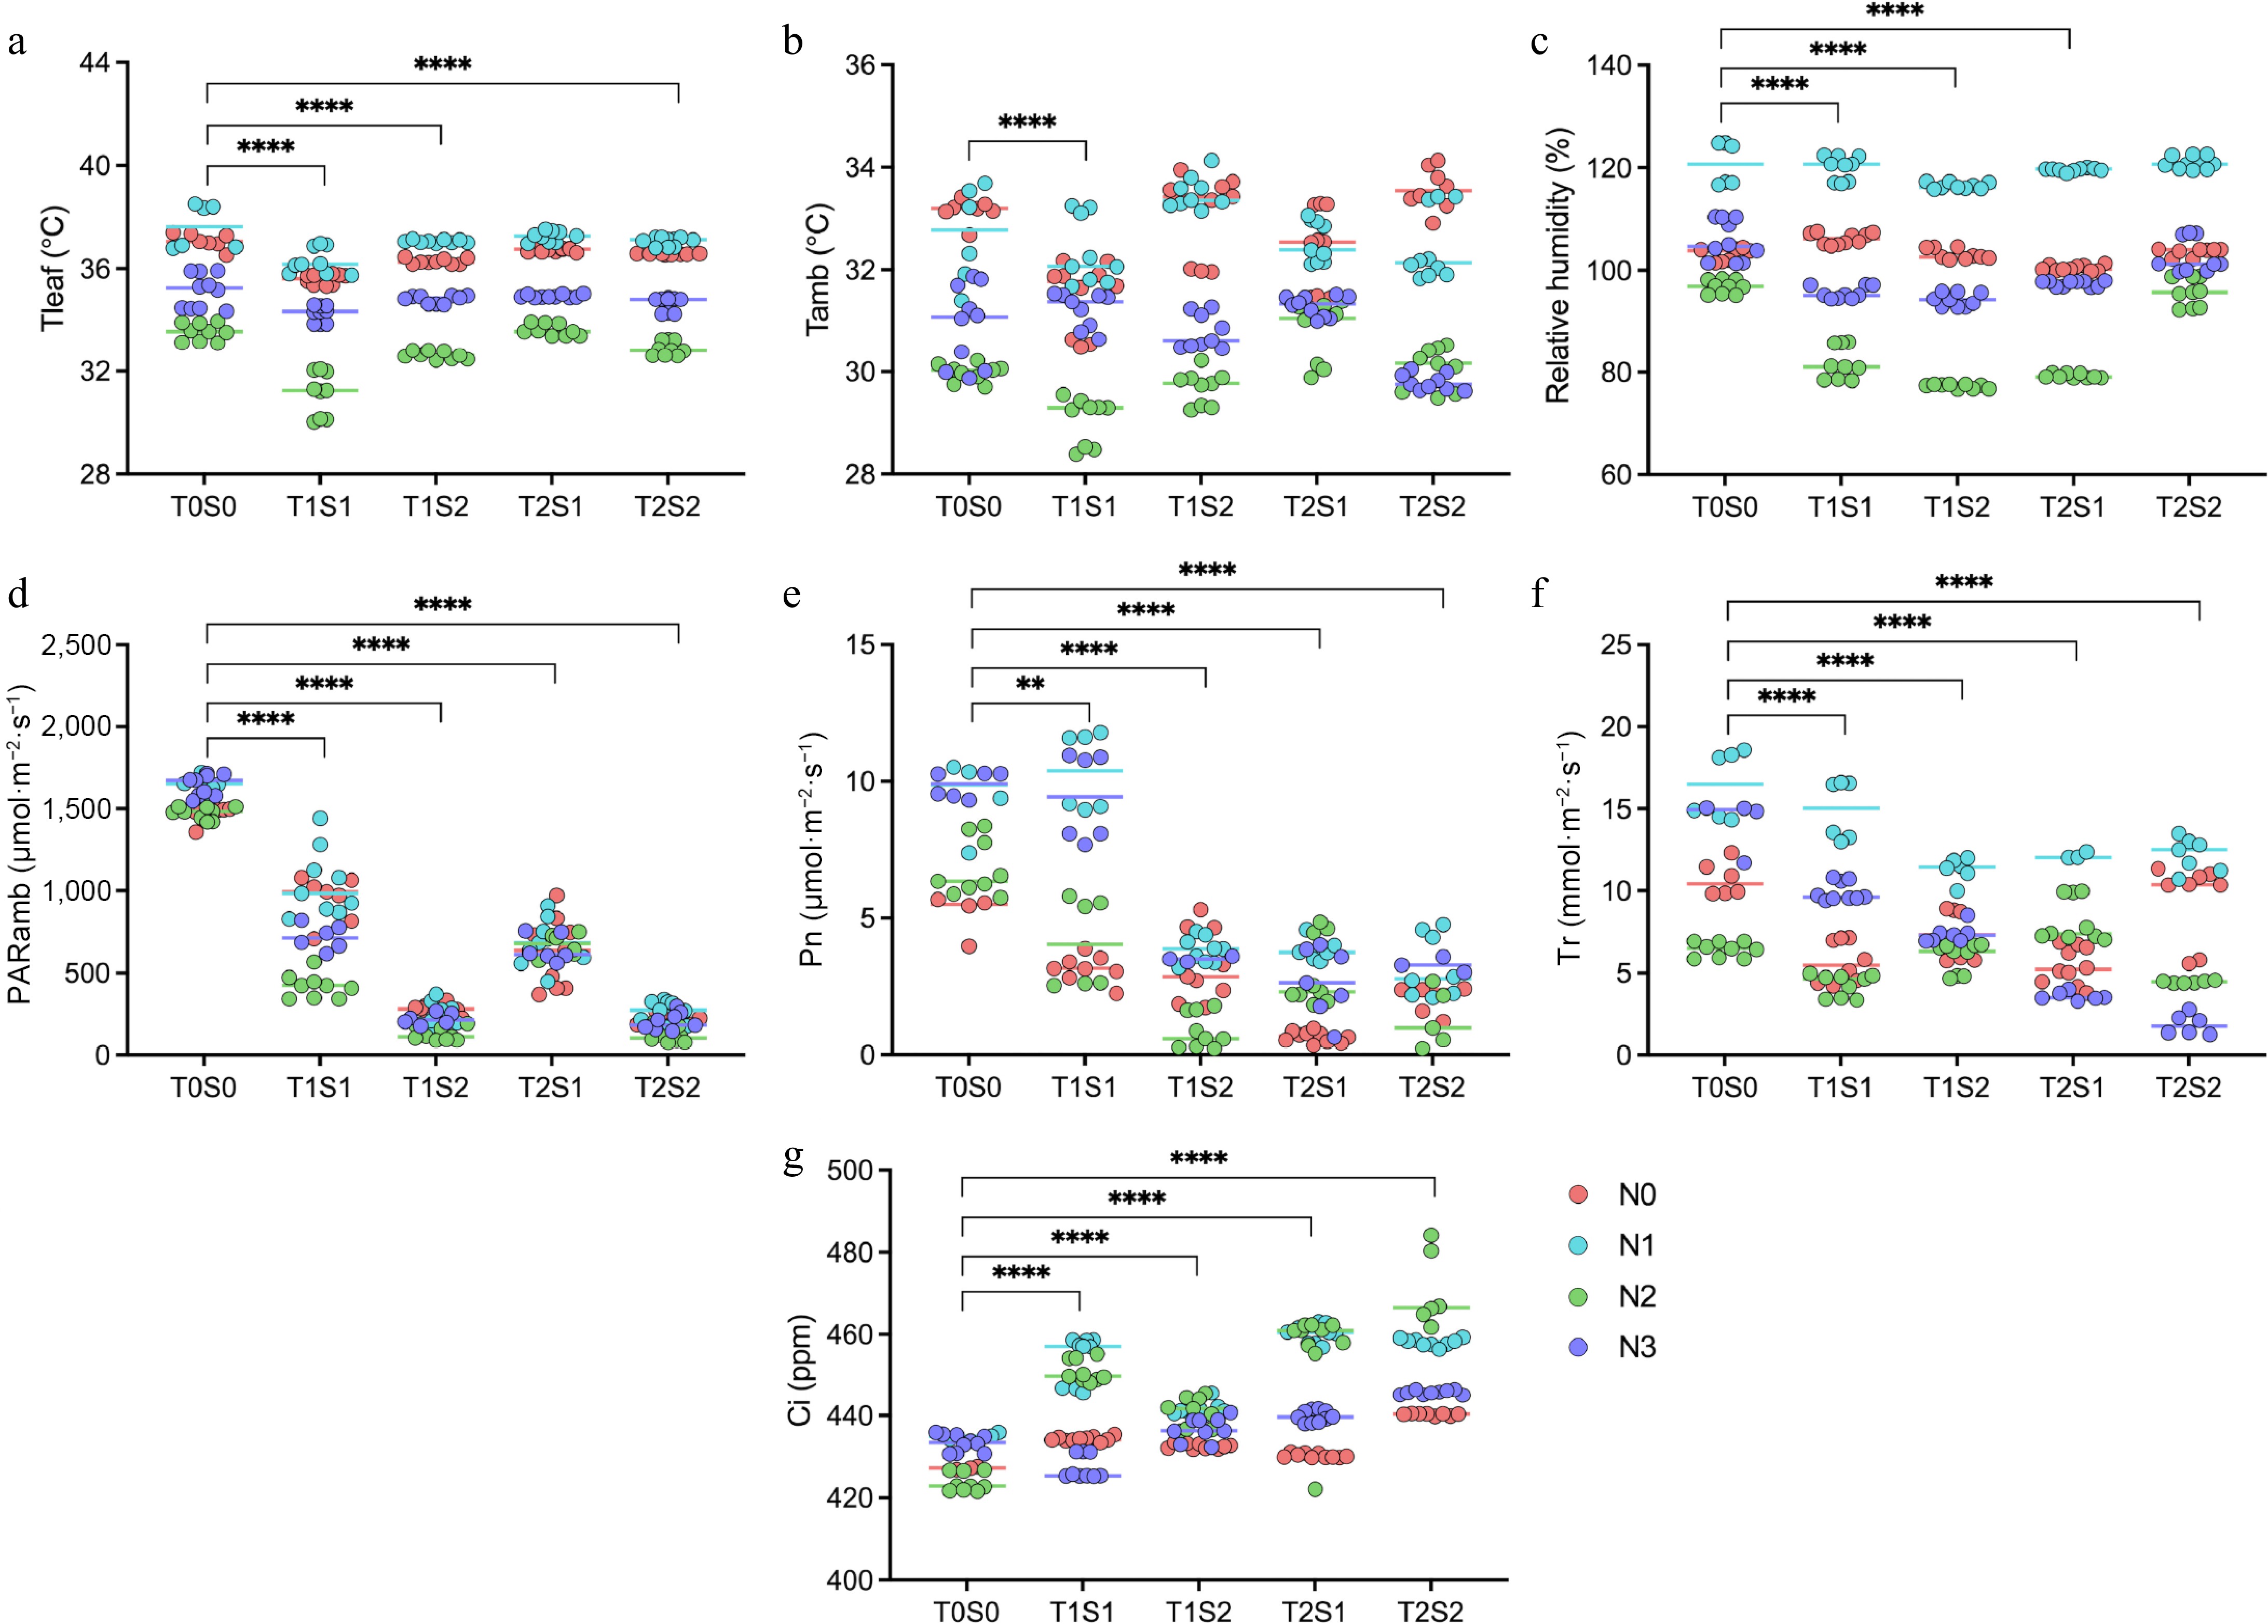
Figure 4.
Effects of different nitrogen fertilizers and shade conditions on tea plantation environment and photosynthetic rate of tea plant. (a) Leaf temperature, (b) ambient temperature, (c) air relative humidity, (d) photosynthetically active radiation, (e) net photosynthetic rate, (f) transpiration rate, (g) intercellular CO2 concentration. ** and **** represent significant at p < 0.01 and p < 0.0001, respectively.
-
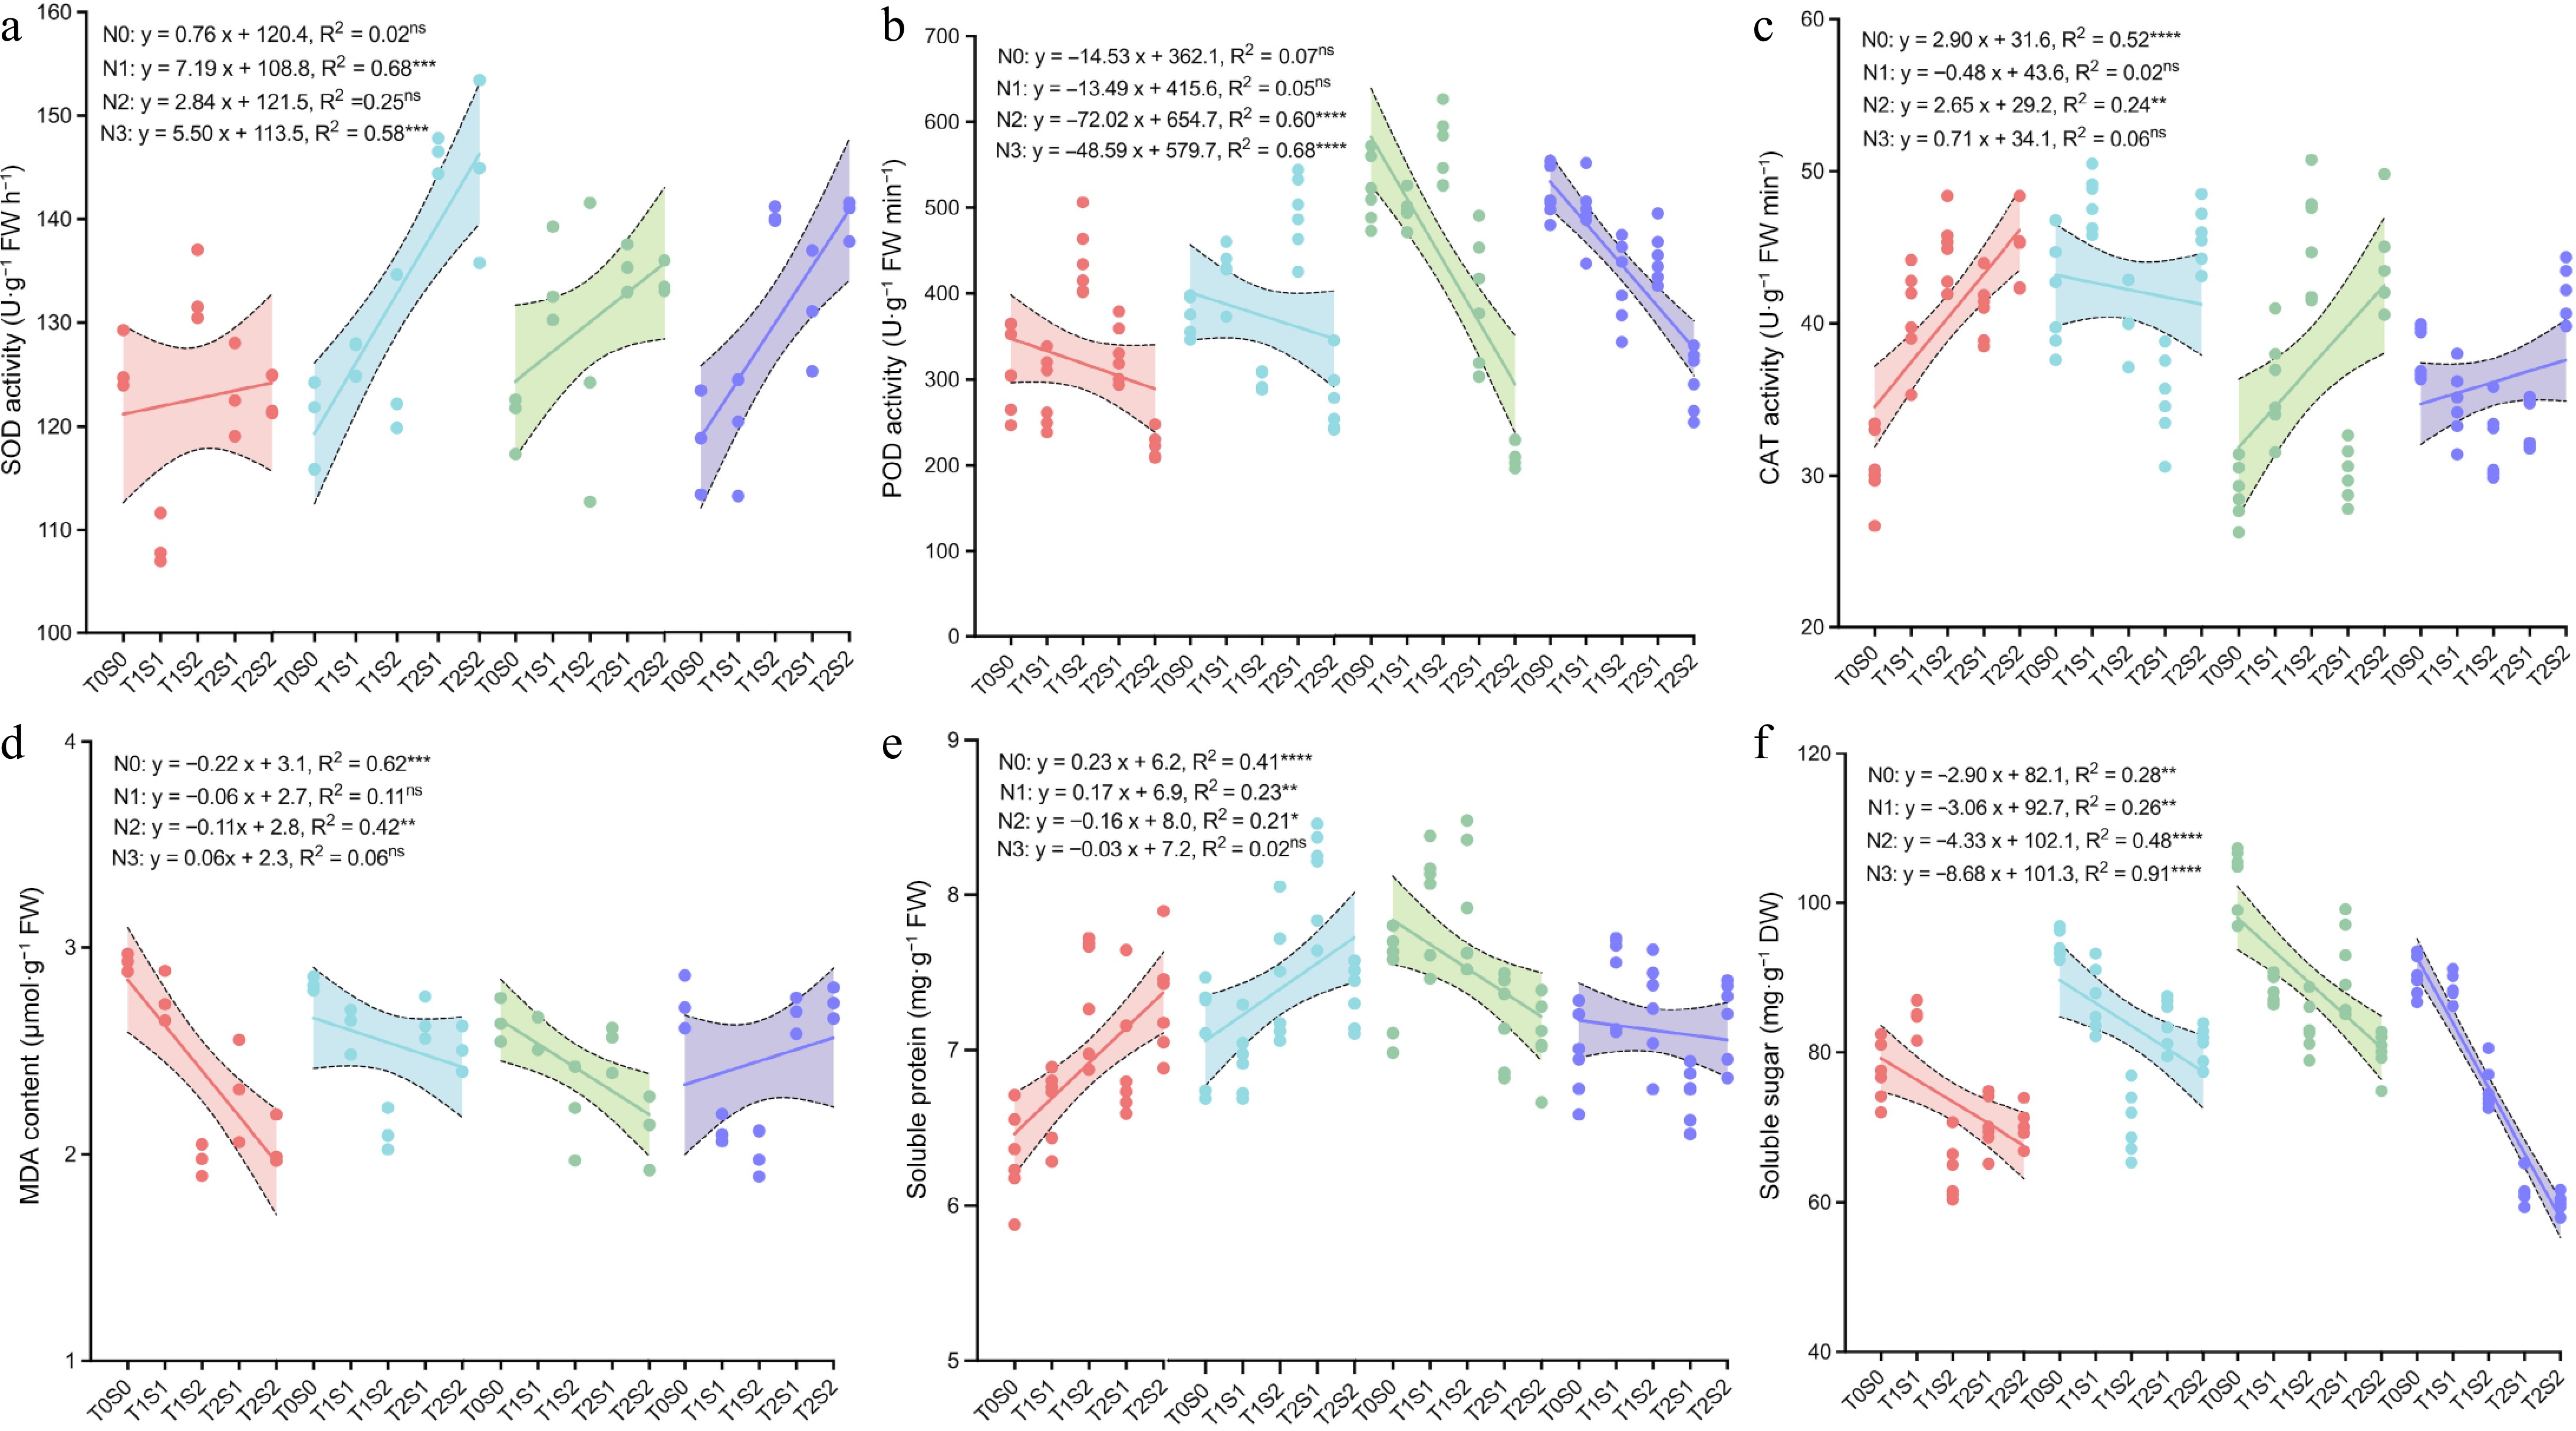
Figure 5.
Effect of different nitrogen fertilizers and shade conditions on tea plant resistance. (a) Superoxide dismutase activity, (b) peroxidase activity, (c) catalase activity, (d) calondialdehyde content, (e) soluble protein content, (f) soluble sugar content. ns means no significance; *, **, ***, and **** represent significance at p < 0.05, p < 0.01, p < 0.001, and p < 0.0001, respectively.
-
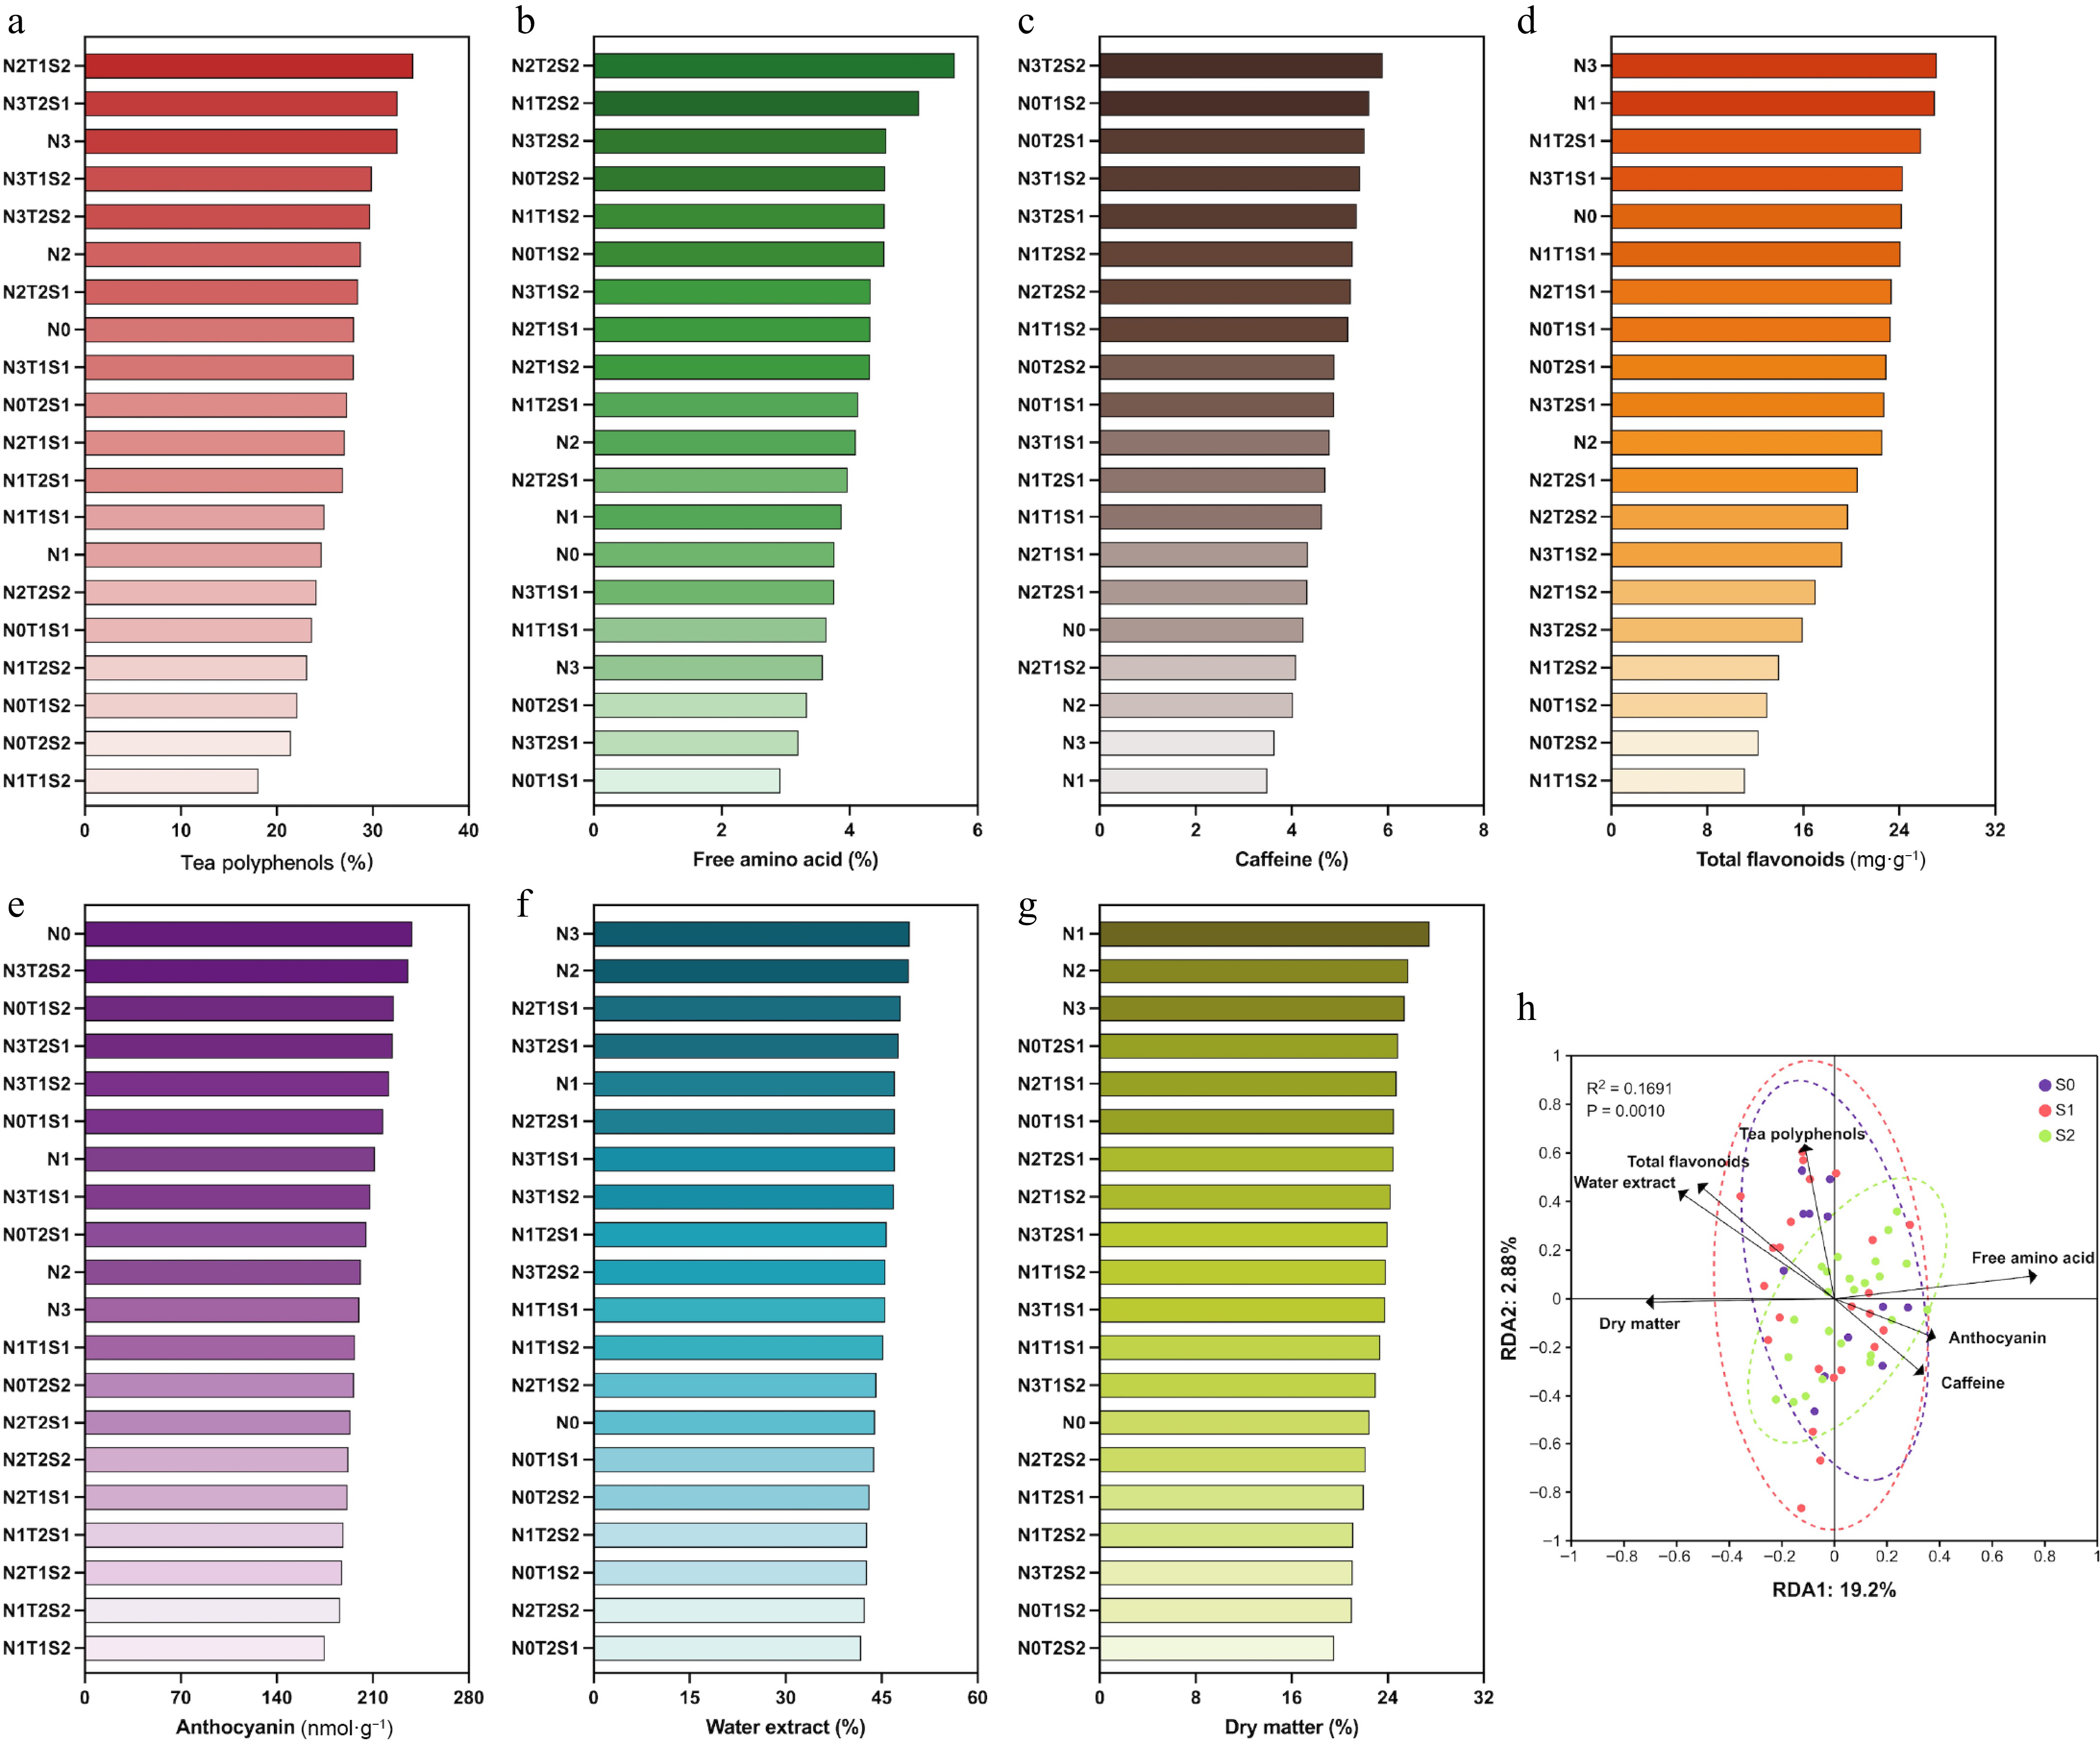
Figure 6.
Effect of different nitrogen fertilizers and shade conditions on the quality of tea plant. (a) Tea polyphenol content, (b) free amino acid content, (c) caffeine content, (d) dry matter content, (e) water extract content, (f) anthocyanin content, (g) total flavonoid content, (h) RDA analysis between each quality component and tea plant growth index.
-
Treatment Total N
(kg N ha−1)Base fertilizer
(kg N ha−1)Additional fertilizer
(kg N ha−1)Duration of shading
(d)Shading rates (%) N0 0 0 0 0 0 N0T1S1 7 40 N0T1S2 70 N0T2S1 38 40 N0T2S2 70 N1 90 75 15 0 0 N1T1S1 7 40 N1T1S2 70 N1T2S1 38 40 N1T2S2 70 N2 180 75 105 0 0 N2T1S1 7 40 N2T1S2 70 N2T2S1 38 40 N2T2S2 70 N3 360 75 285 0 0 N3T1S1 7 40 N3T1S2 70 N3T2S1 38 40 N3T2S2 70 Table 1.
Shading system based on nitrogen fertilizer reduction.
Figures
(6)
Tables
(1)