-
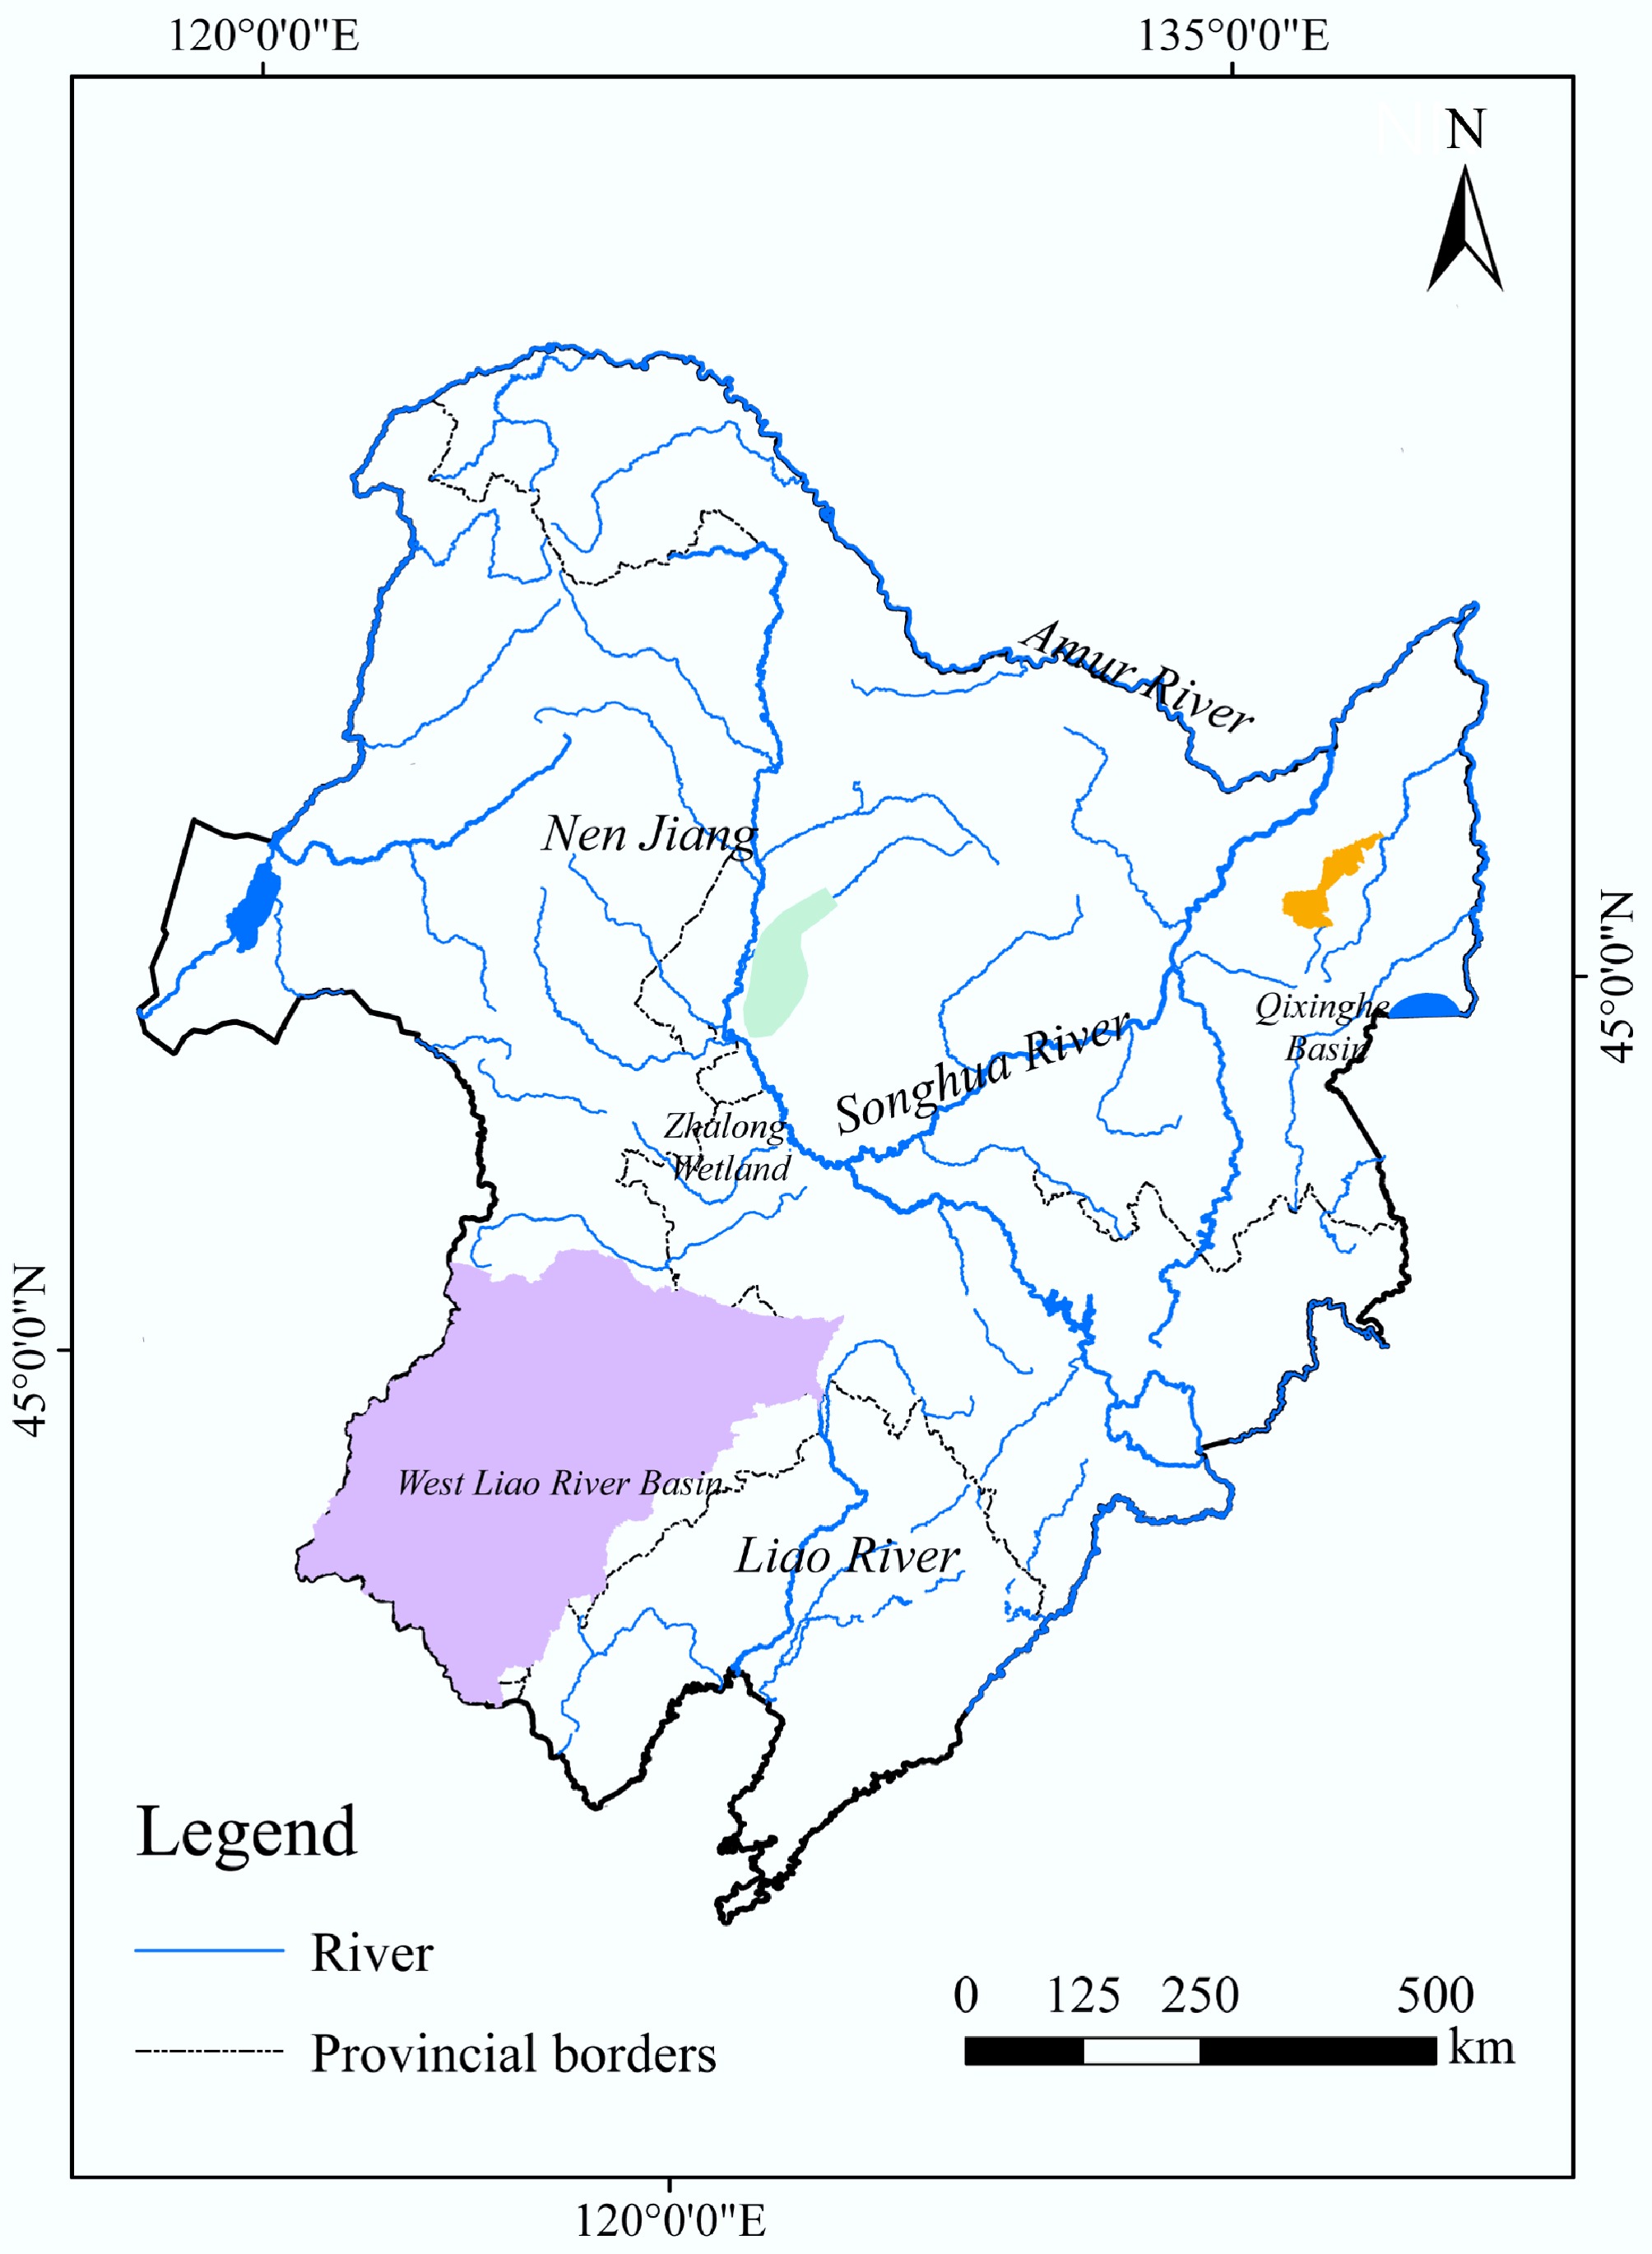
Figure 1.
Major rivers in Northeast China and key areas covered in this study.
-
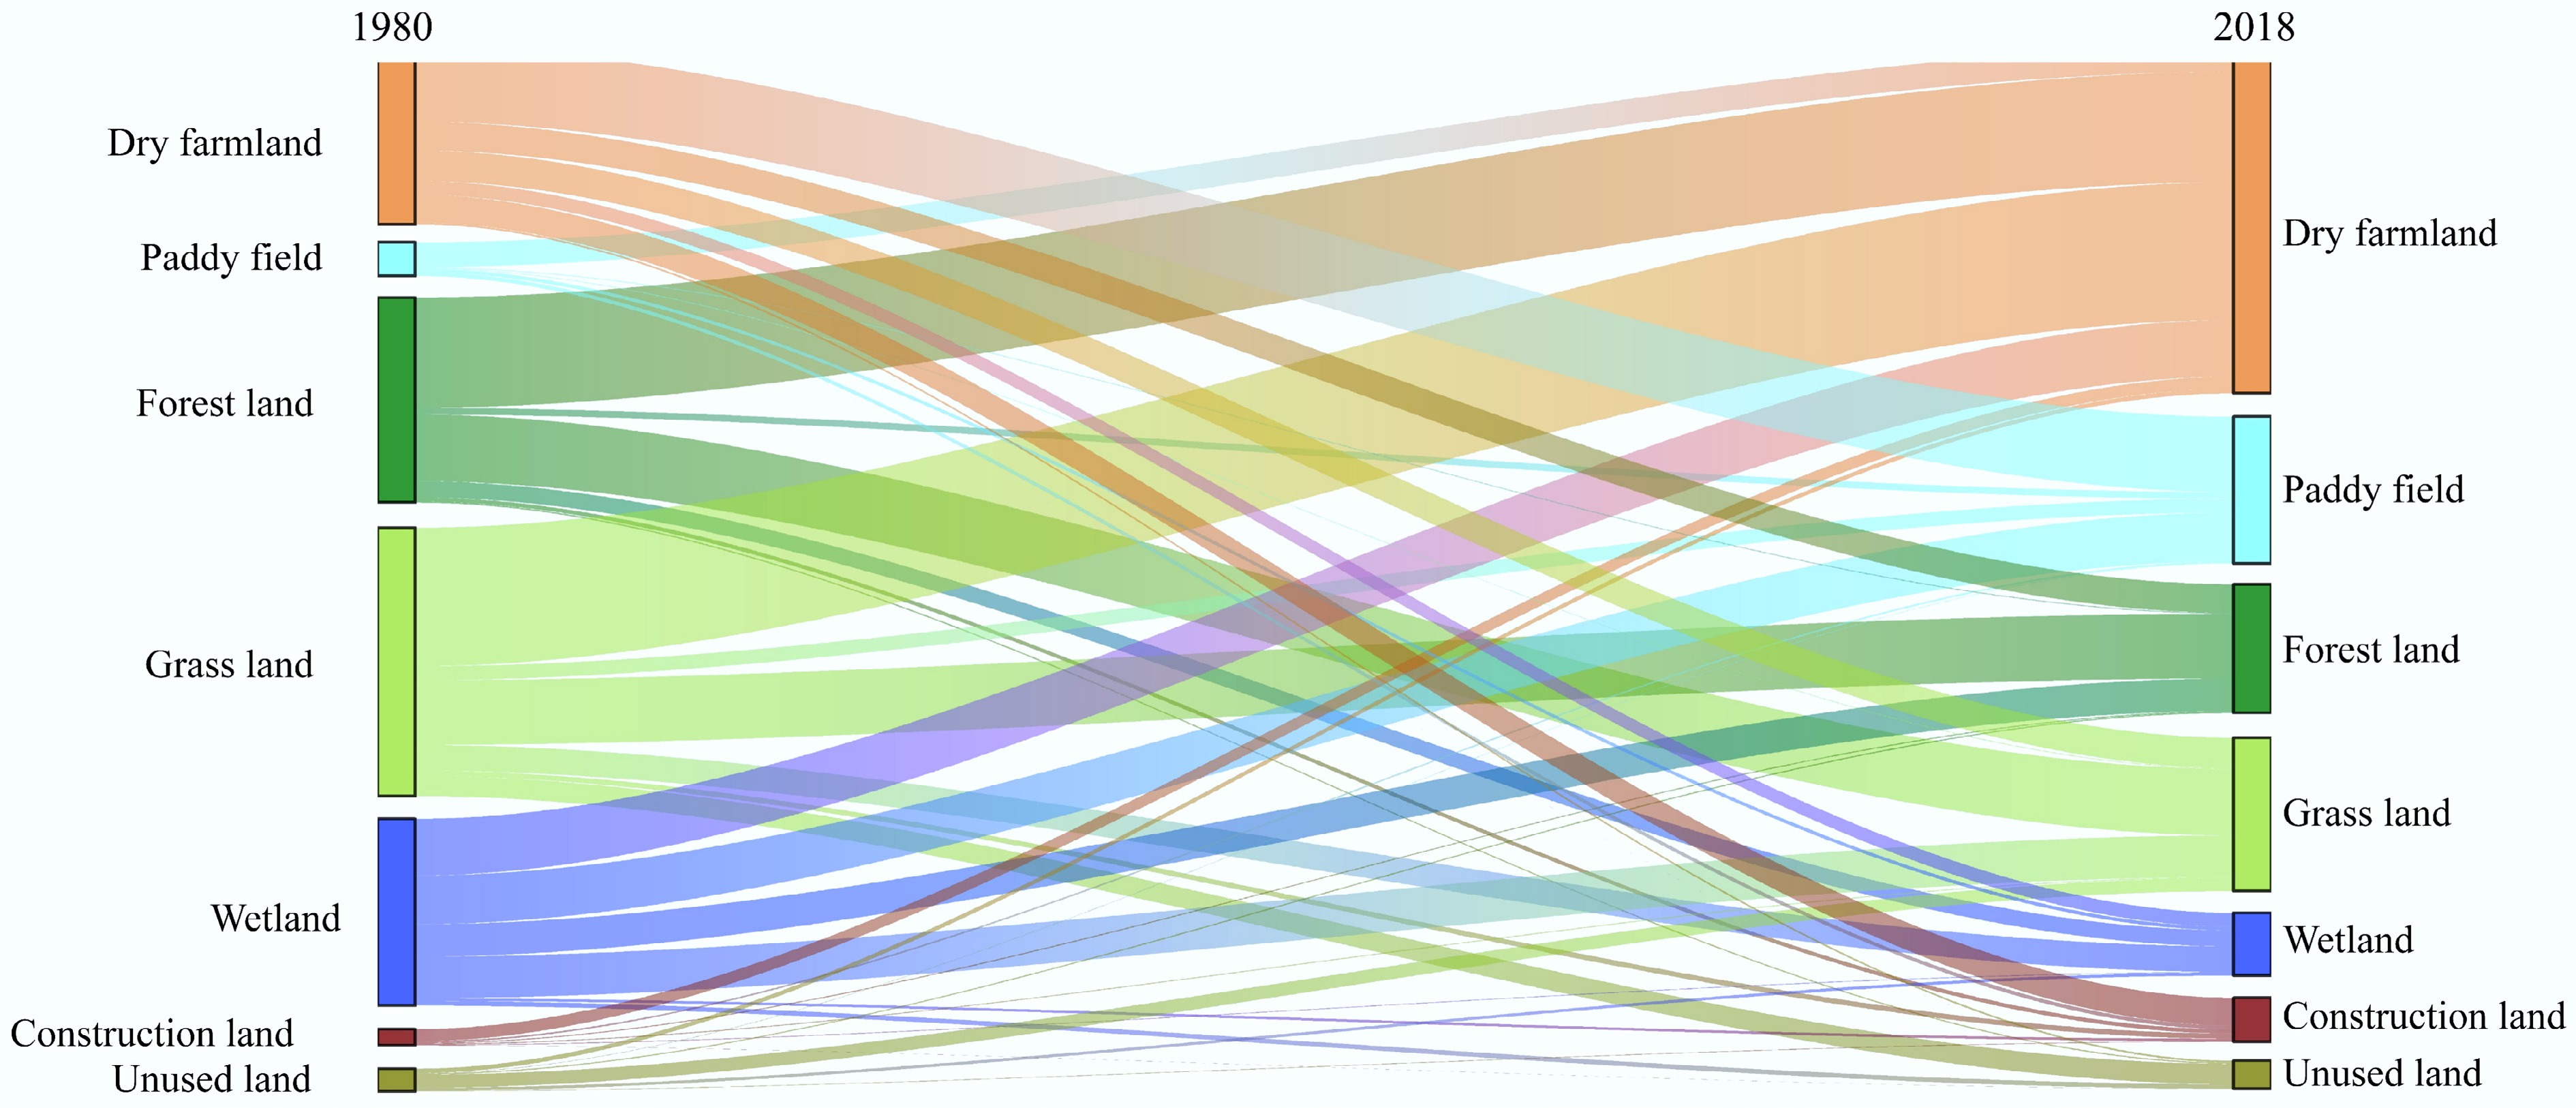
Figure 2.
Land use conversion in Northeast China over the past 40 years.
-
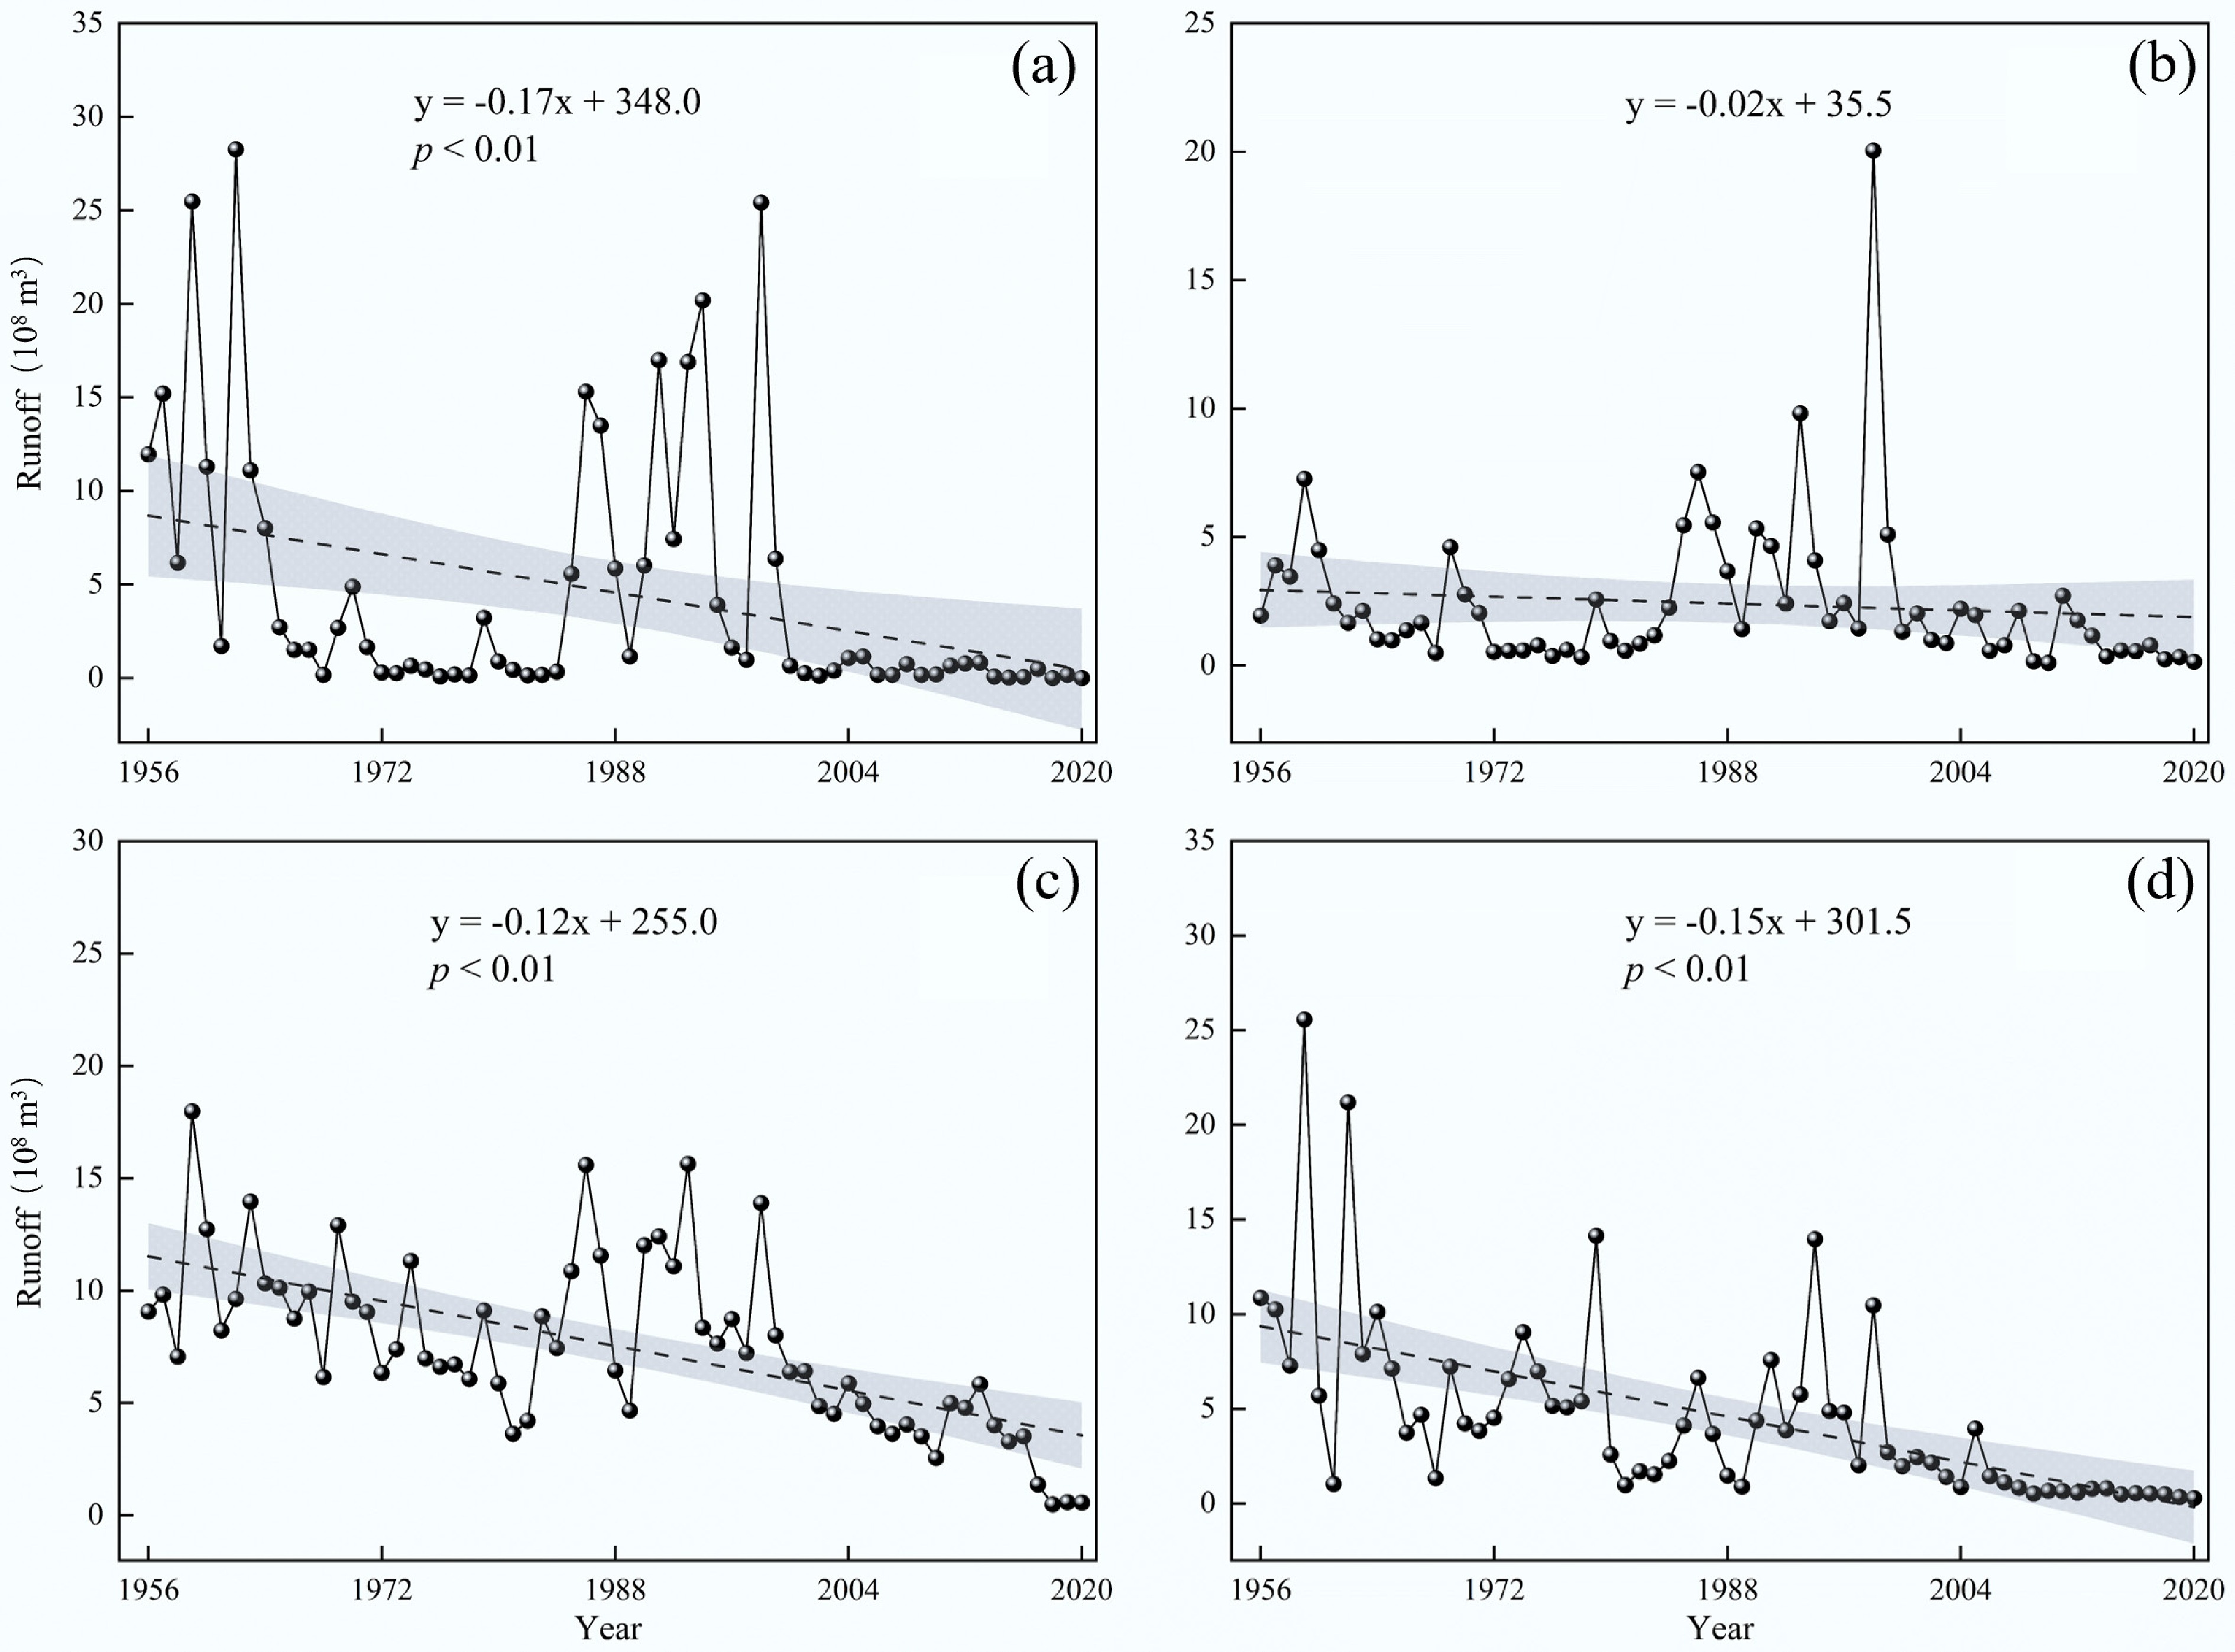
Figure 3.
Trends in runoff changes for the main stream and its tributaries of the XRB from 1956 to 2020. (a) Represents the mainstream; (b), (c), and (d) represent the three major tributaries: the Wulijimuren River, the Xar Moron River, and the Laoha River, respectively.
-
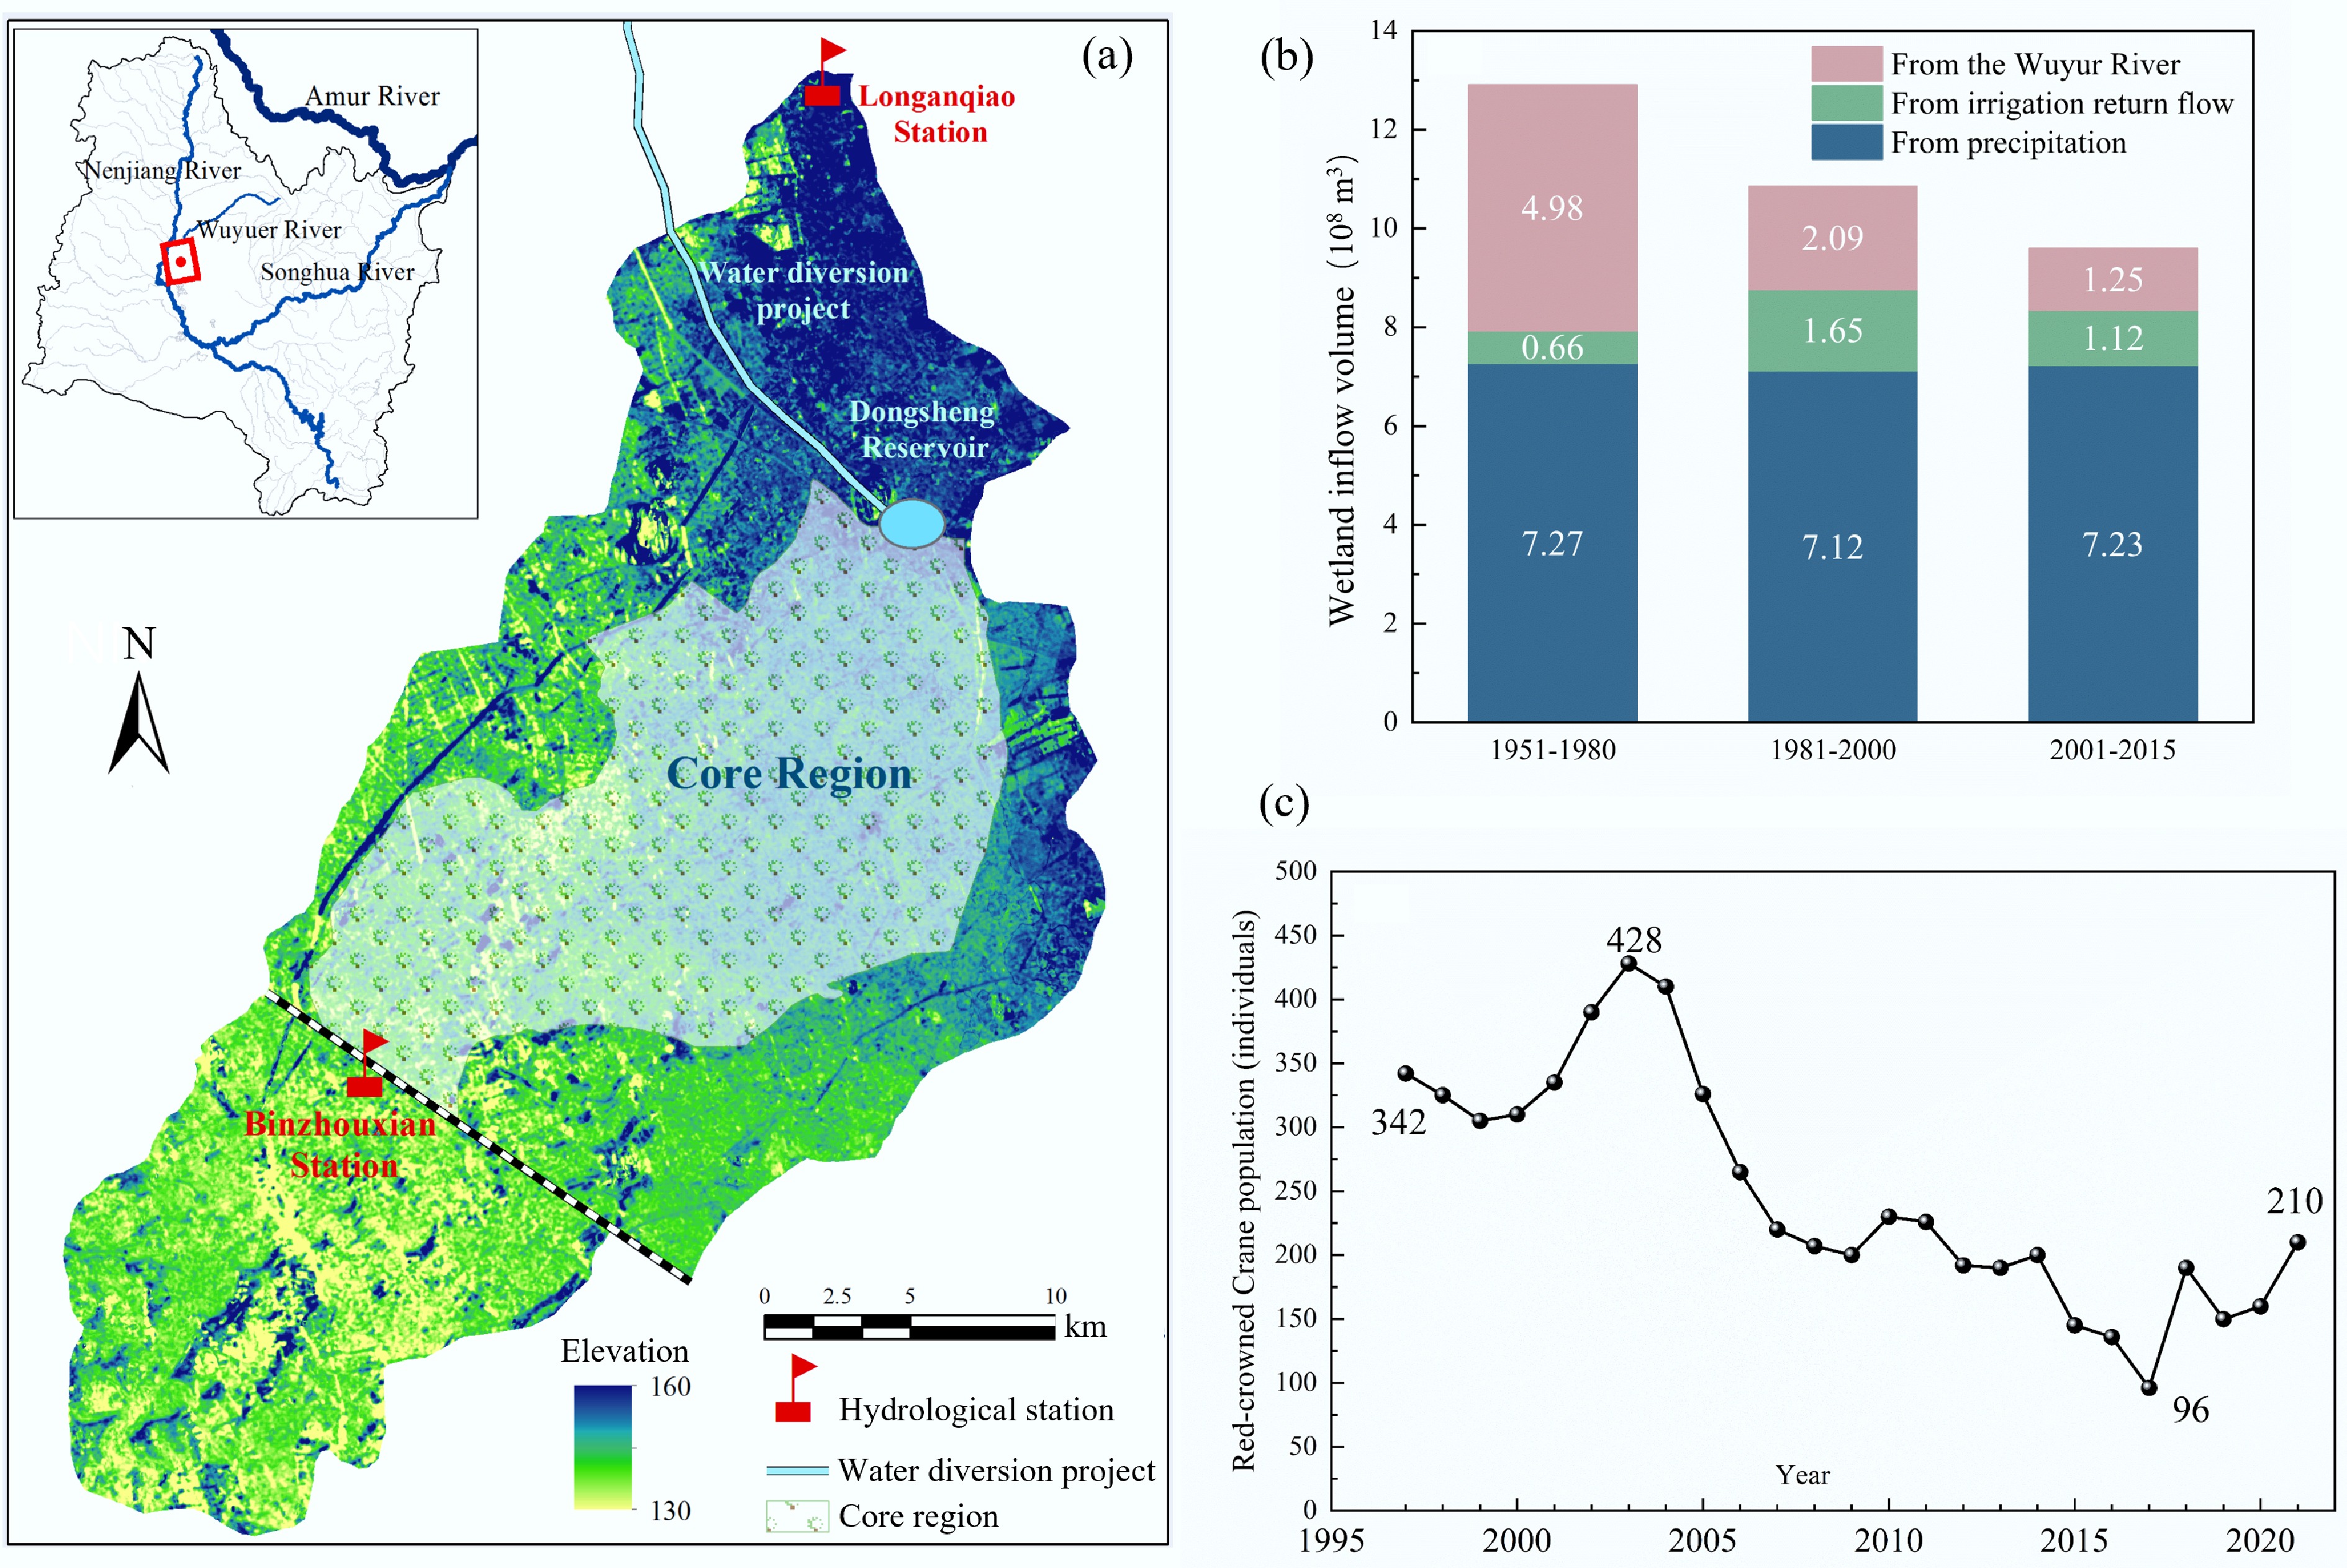
Figure 4.
(a) Location of Zhalong Wetland. (b) Changes in water source recharge characteristics, and (c) population of wild red-crowned cranes.
-
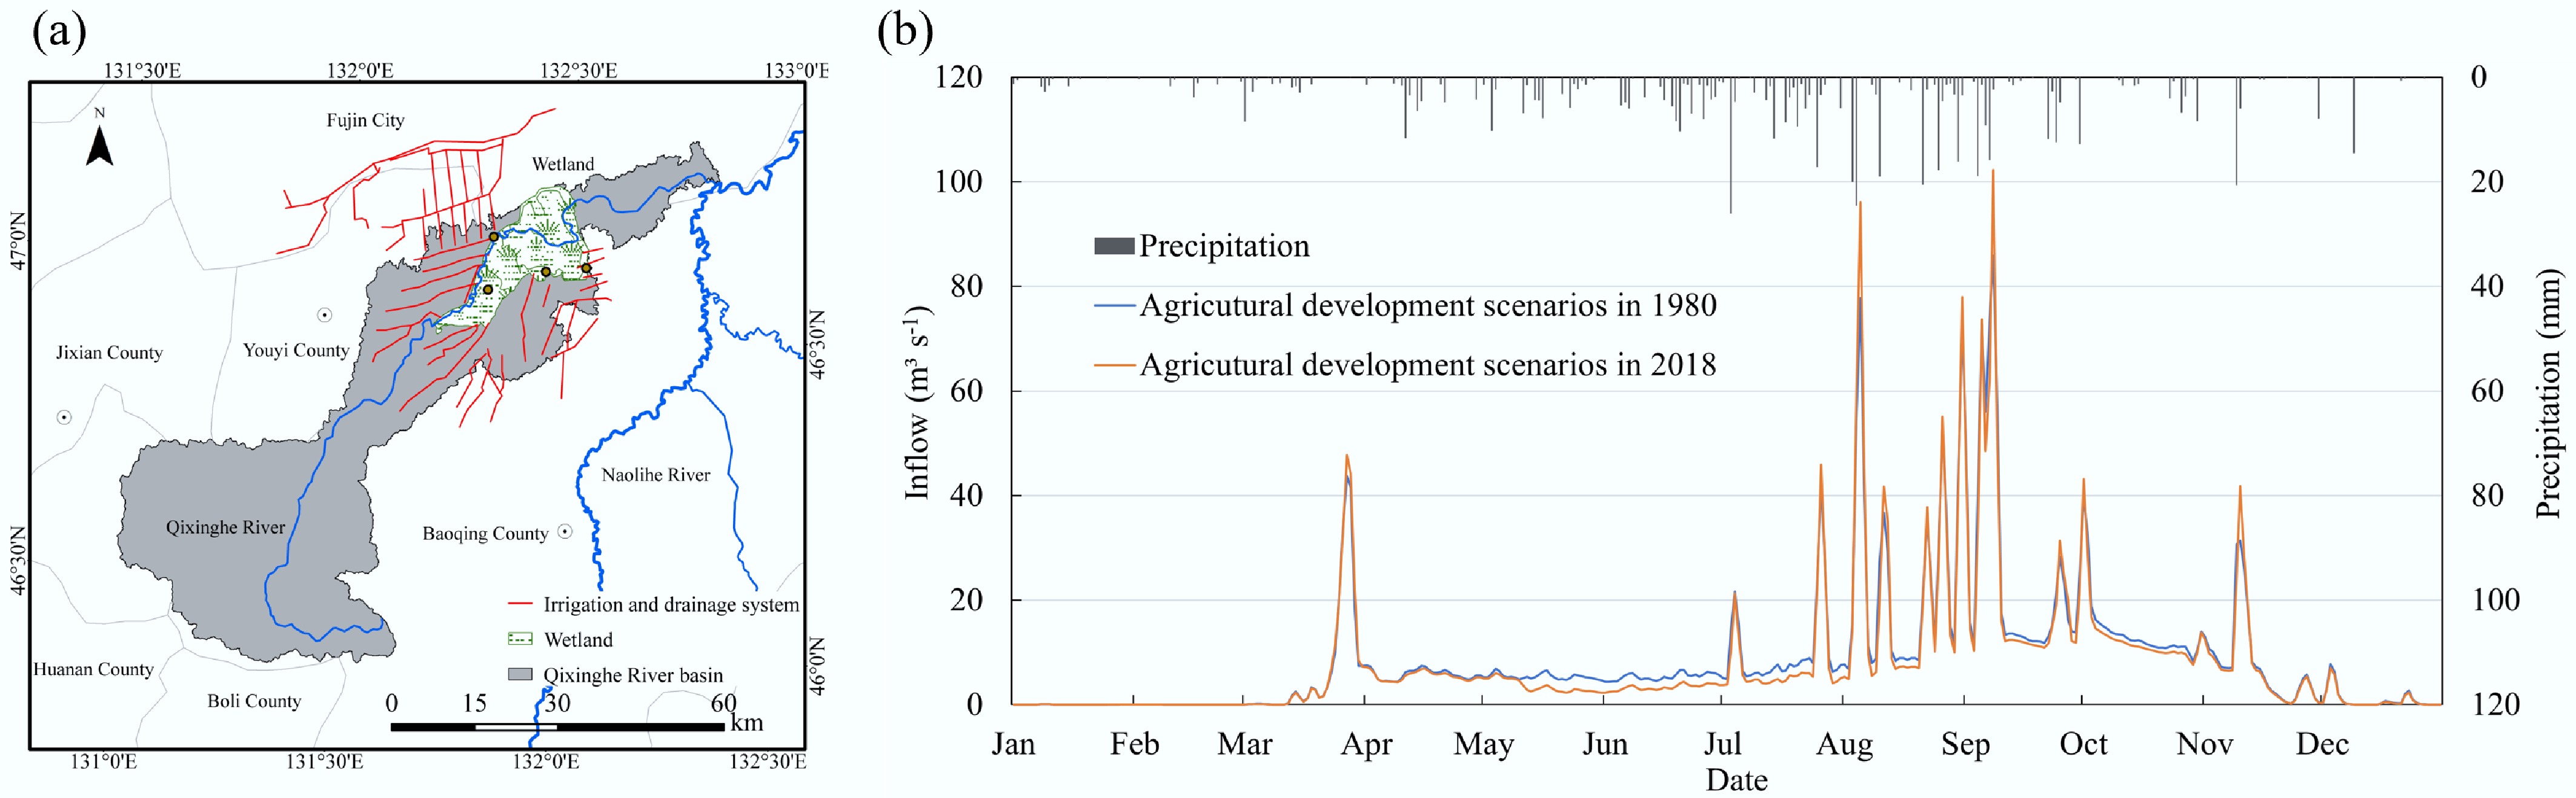
Figure 5.
(a) The irrigation and drainage systems of QRB. (b) The daily flow into wetlands under different agricultural development scenarios.
-
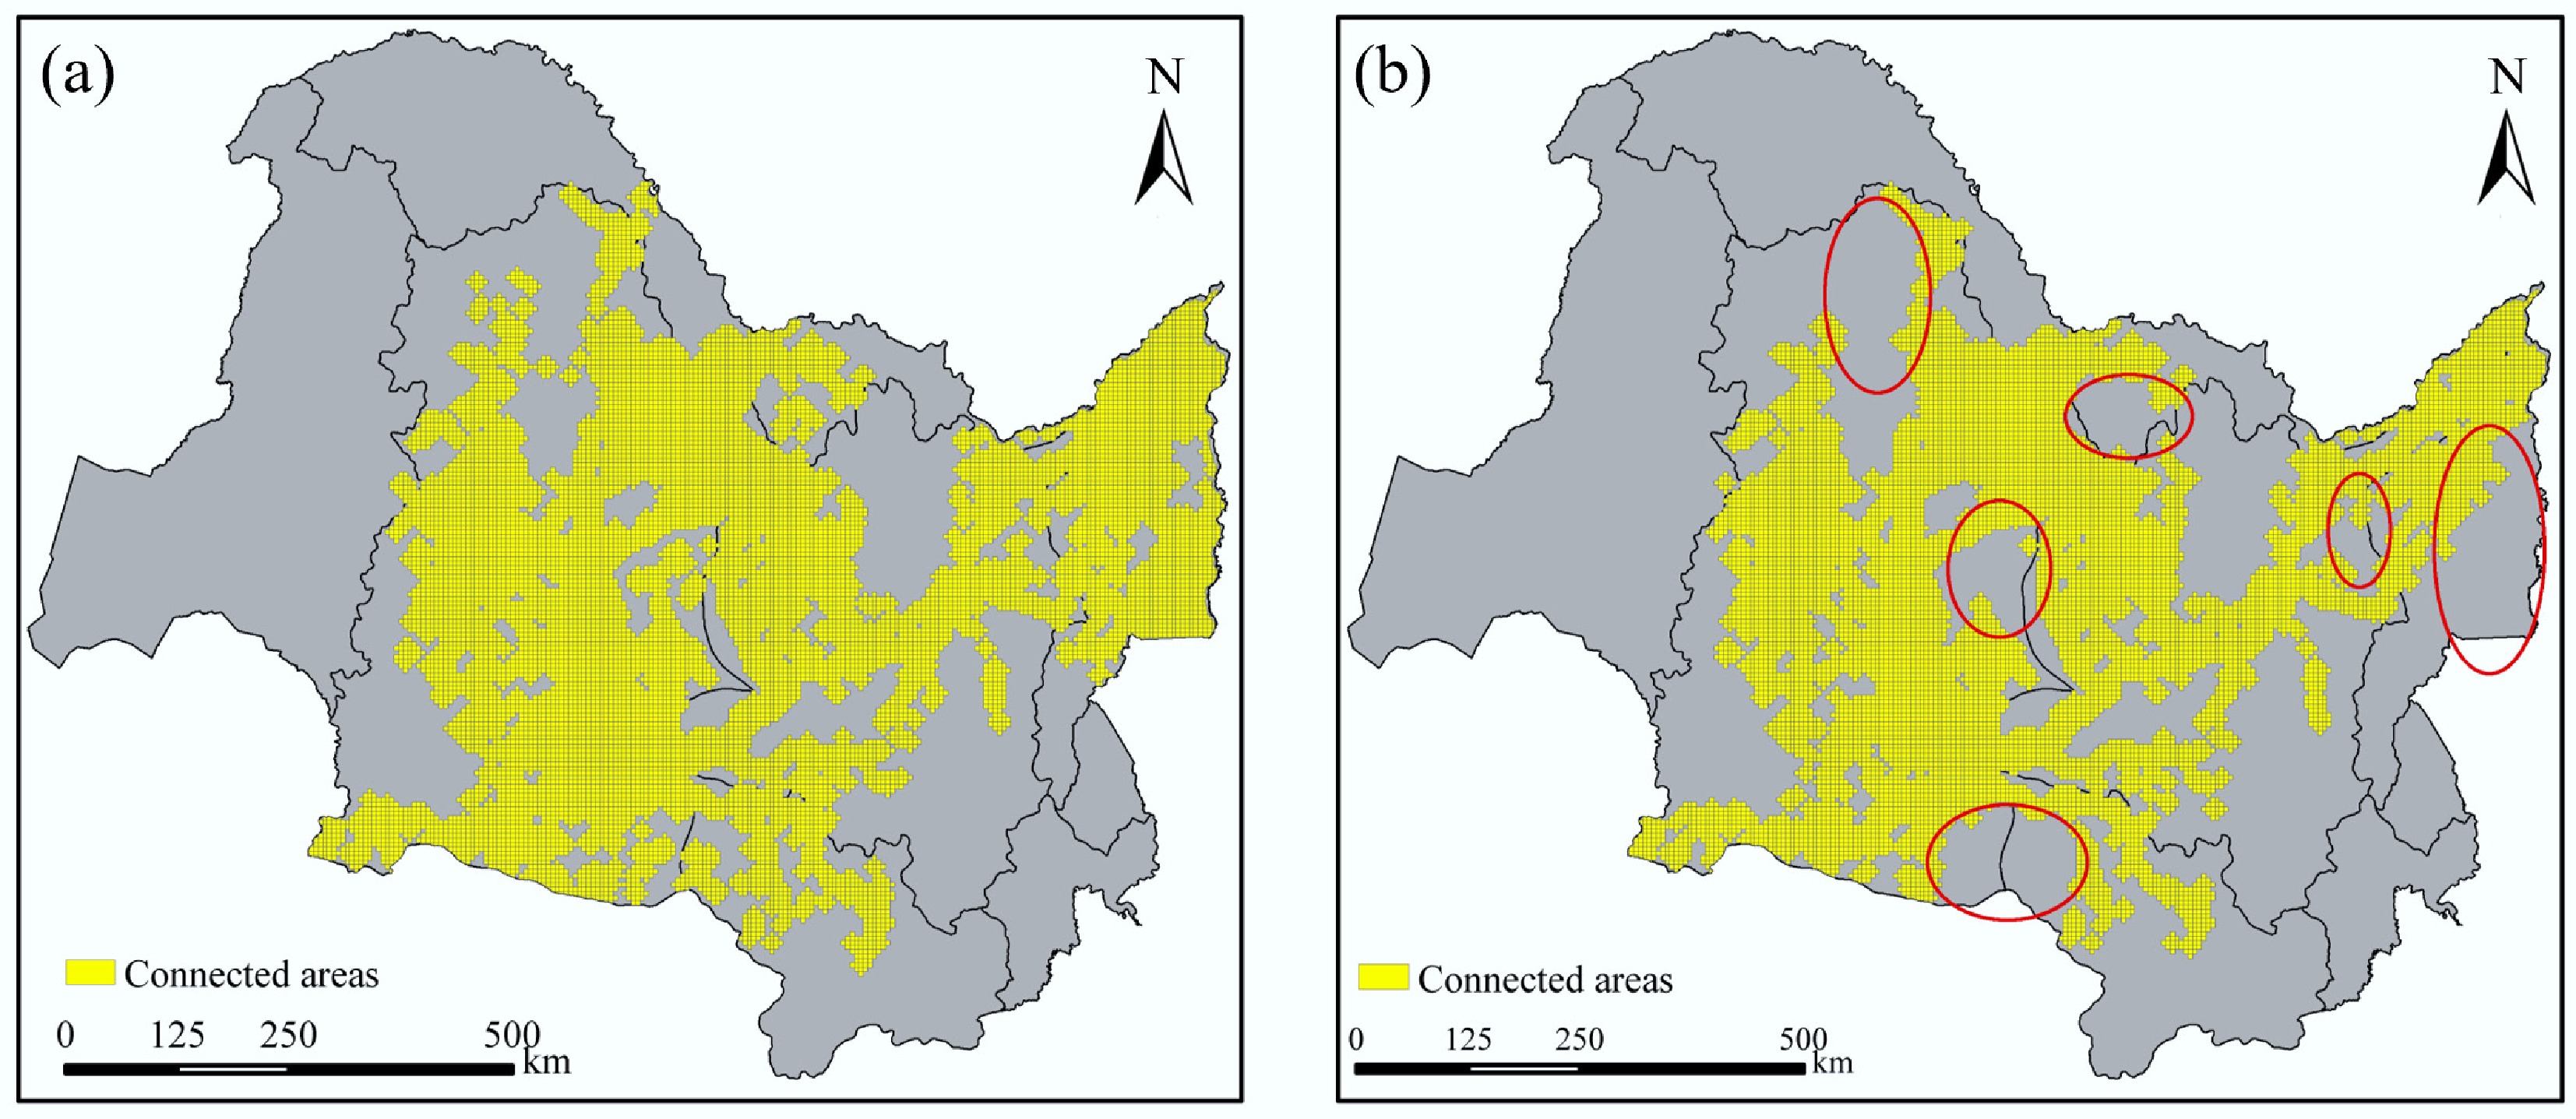
Figure 6.
The area of SSC in the SHJR has significantly decreased over the past 40 years. (a) 1980; (b) 2018.
-
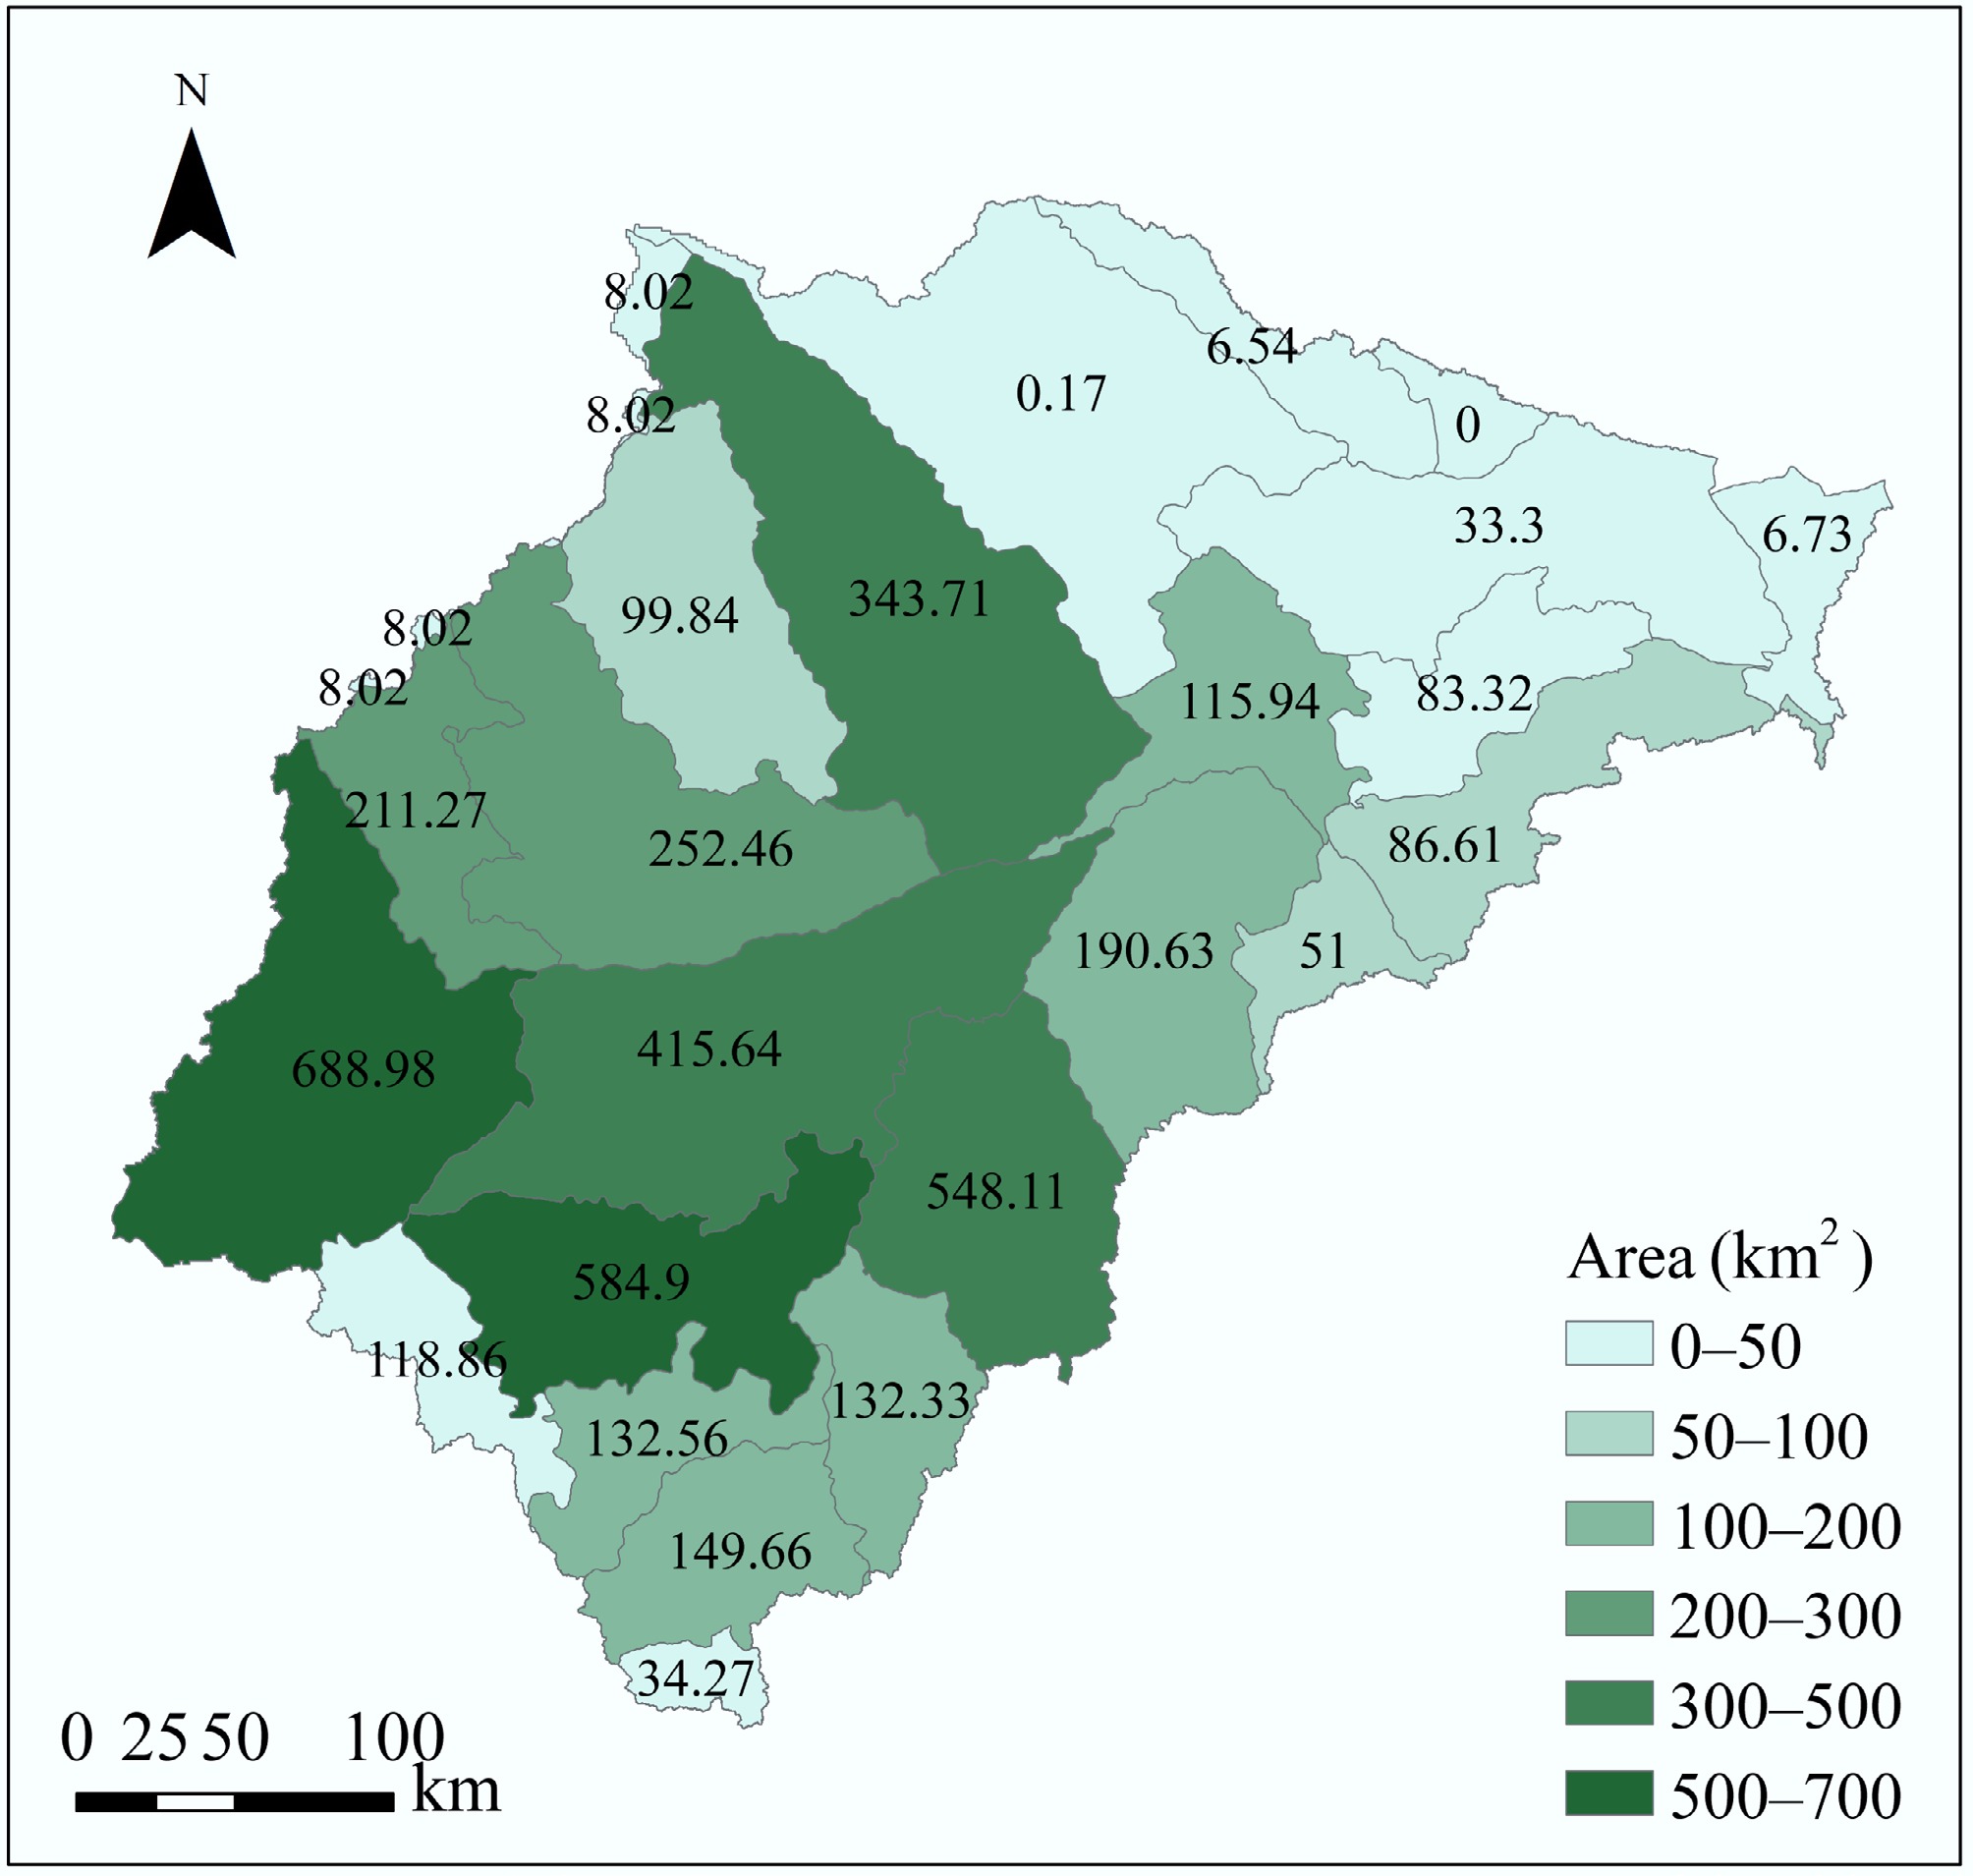
Figure 7.
Area of cropland requiring conversion to grassland in each county/district of the XRB.
-
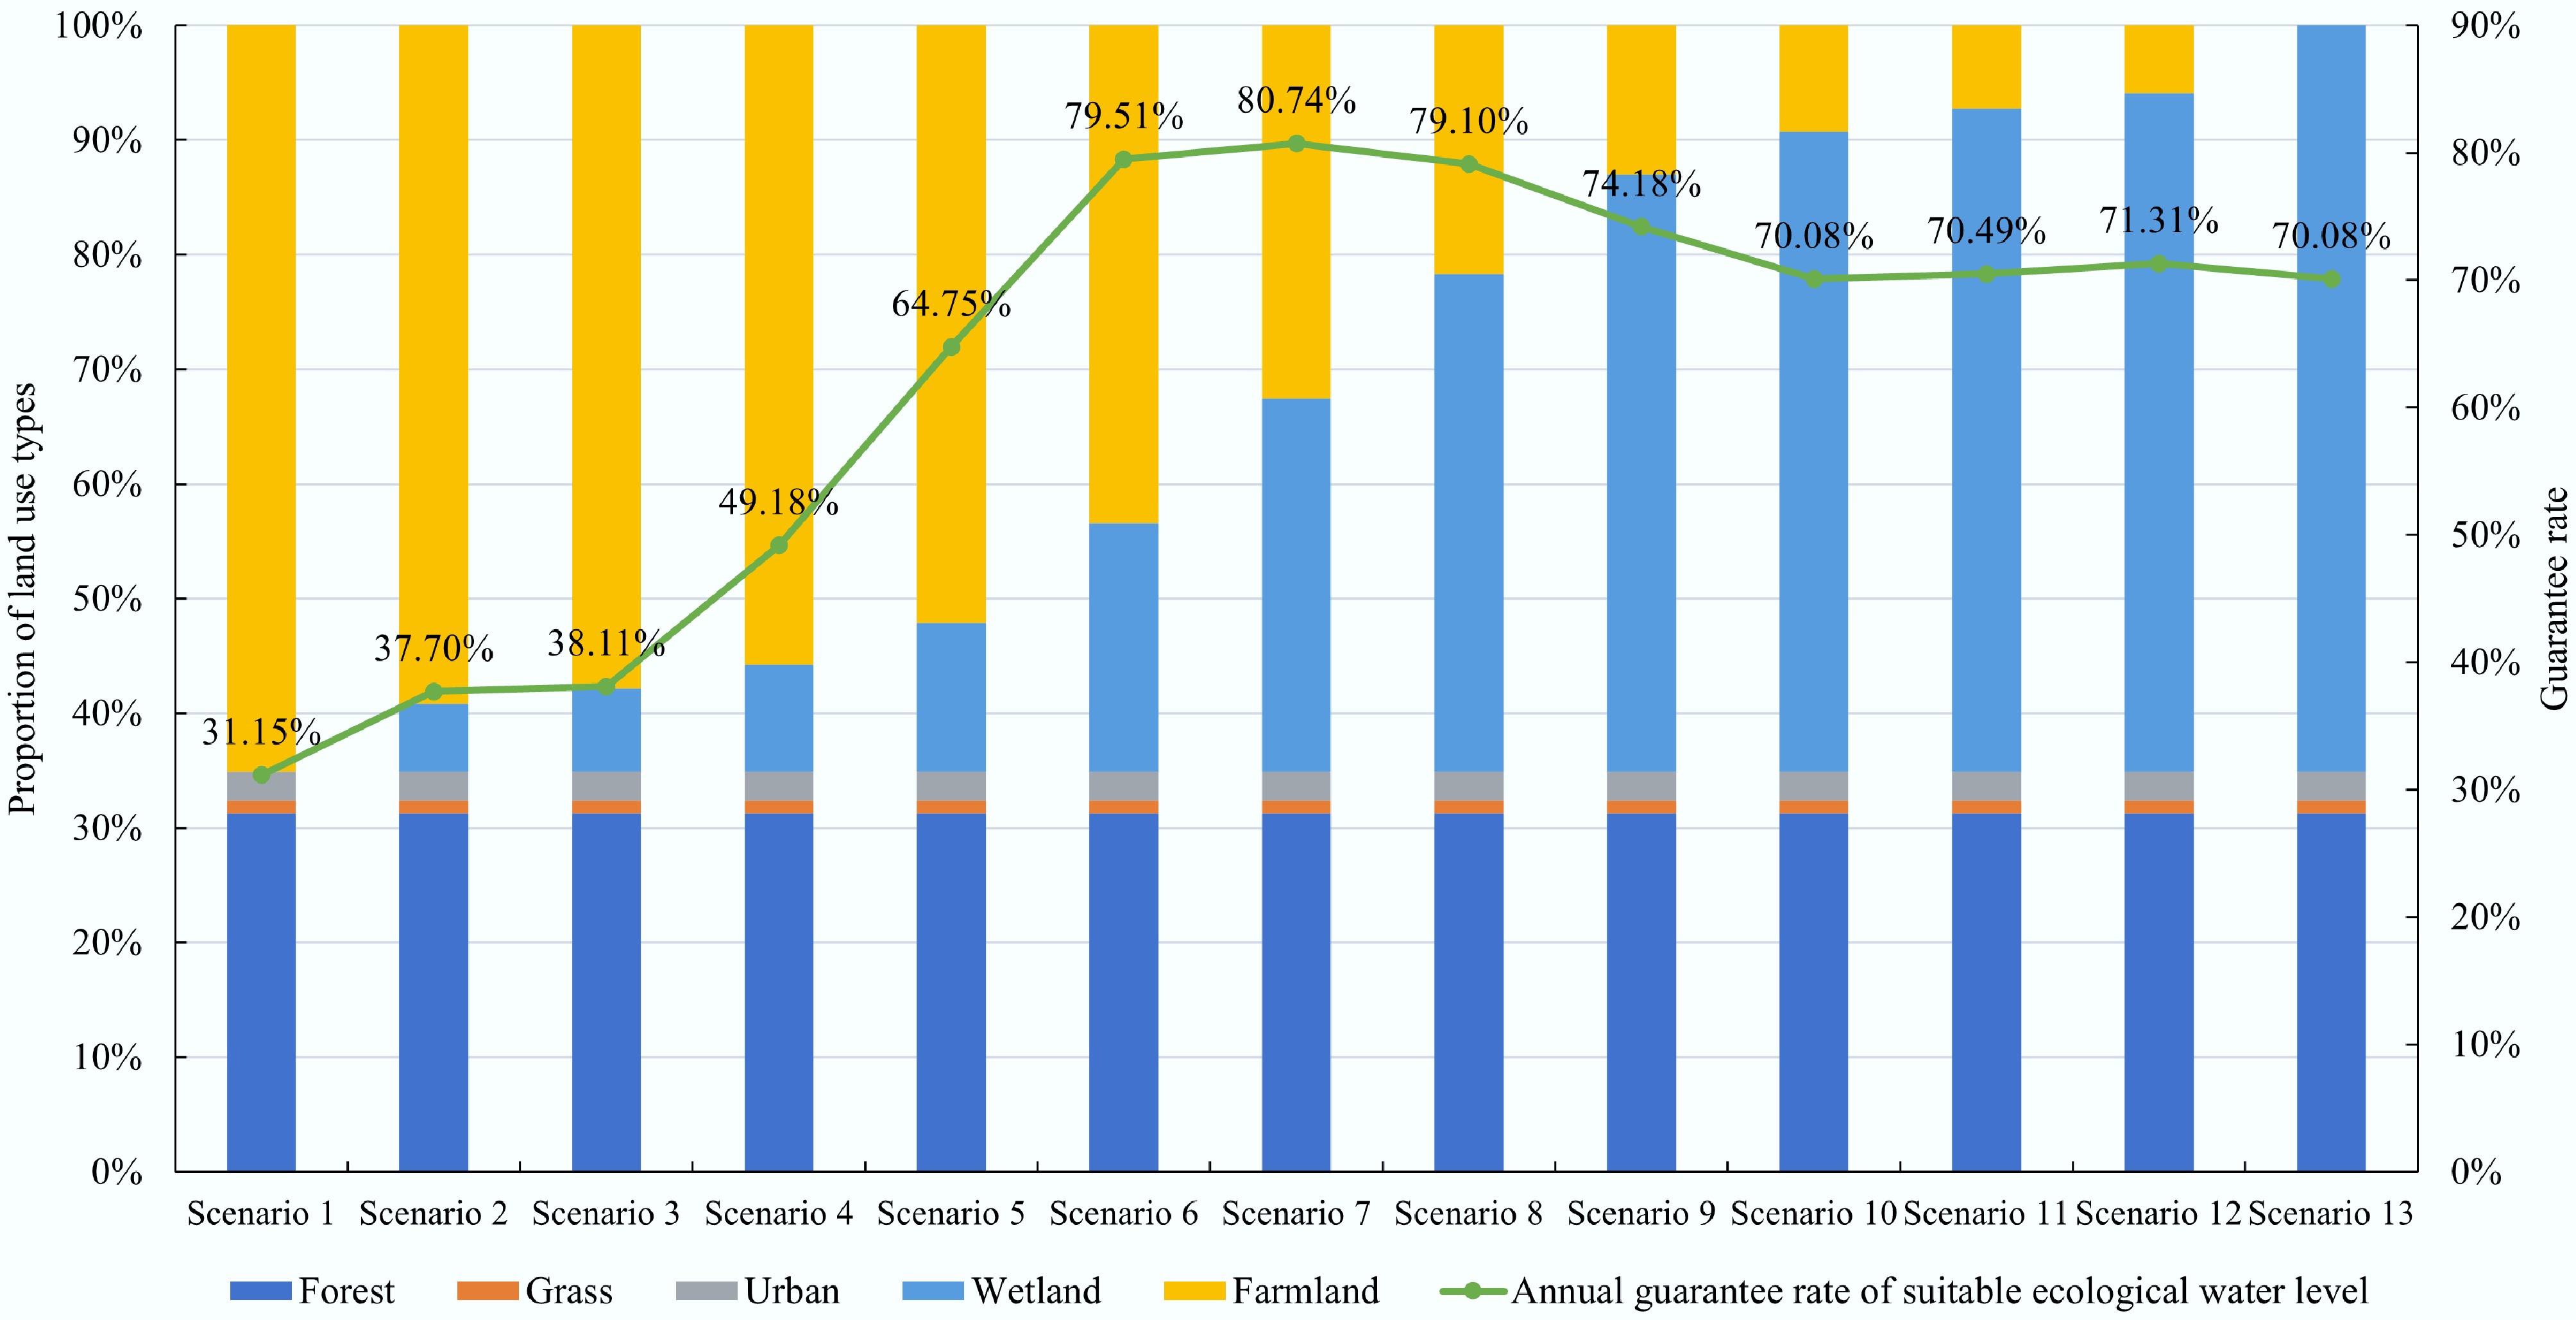
Figure 8.
The relationship between the proportion of land use types and the guarantee rate of suitable ecological water level.
-
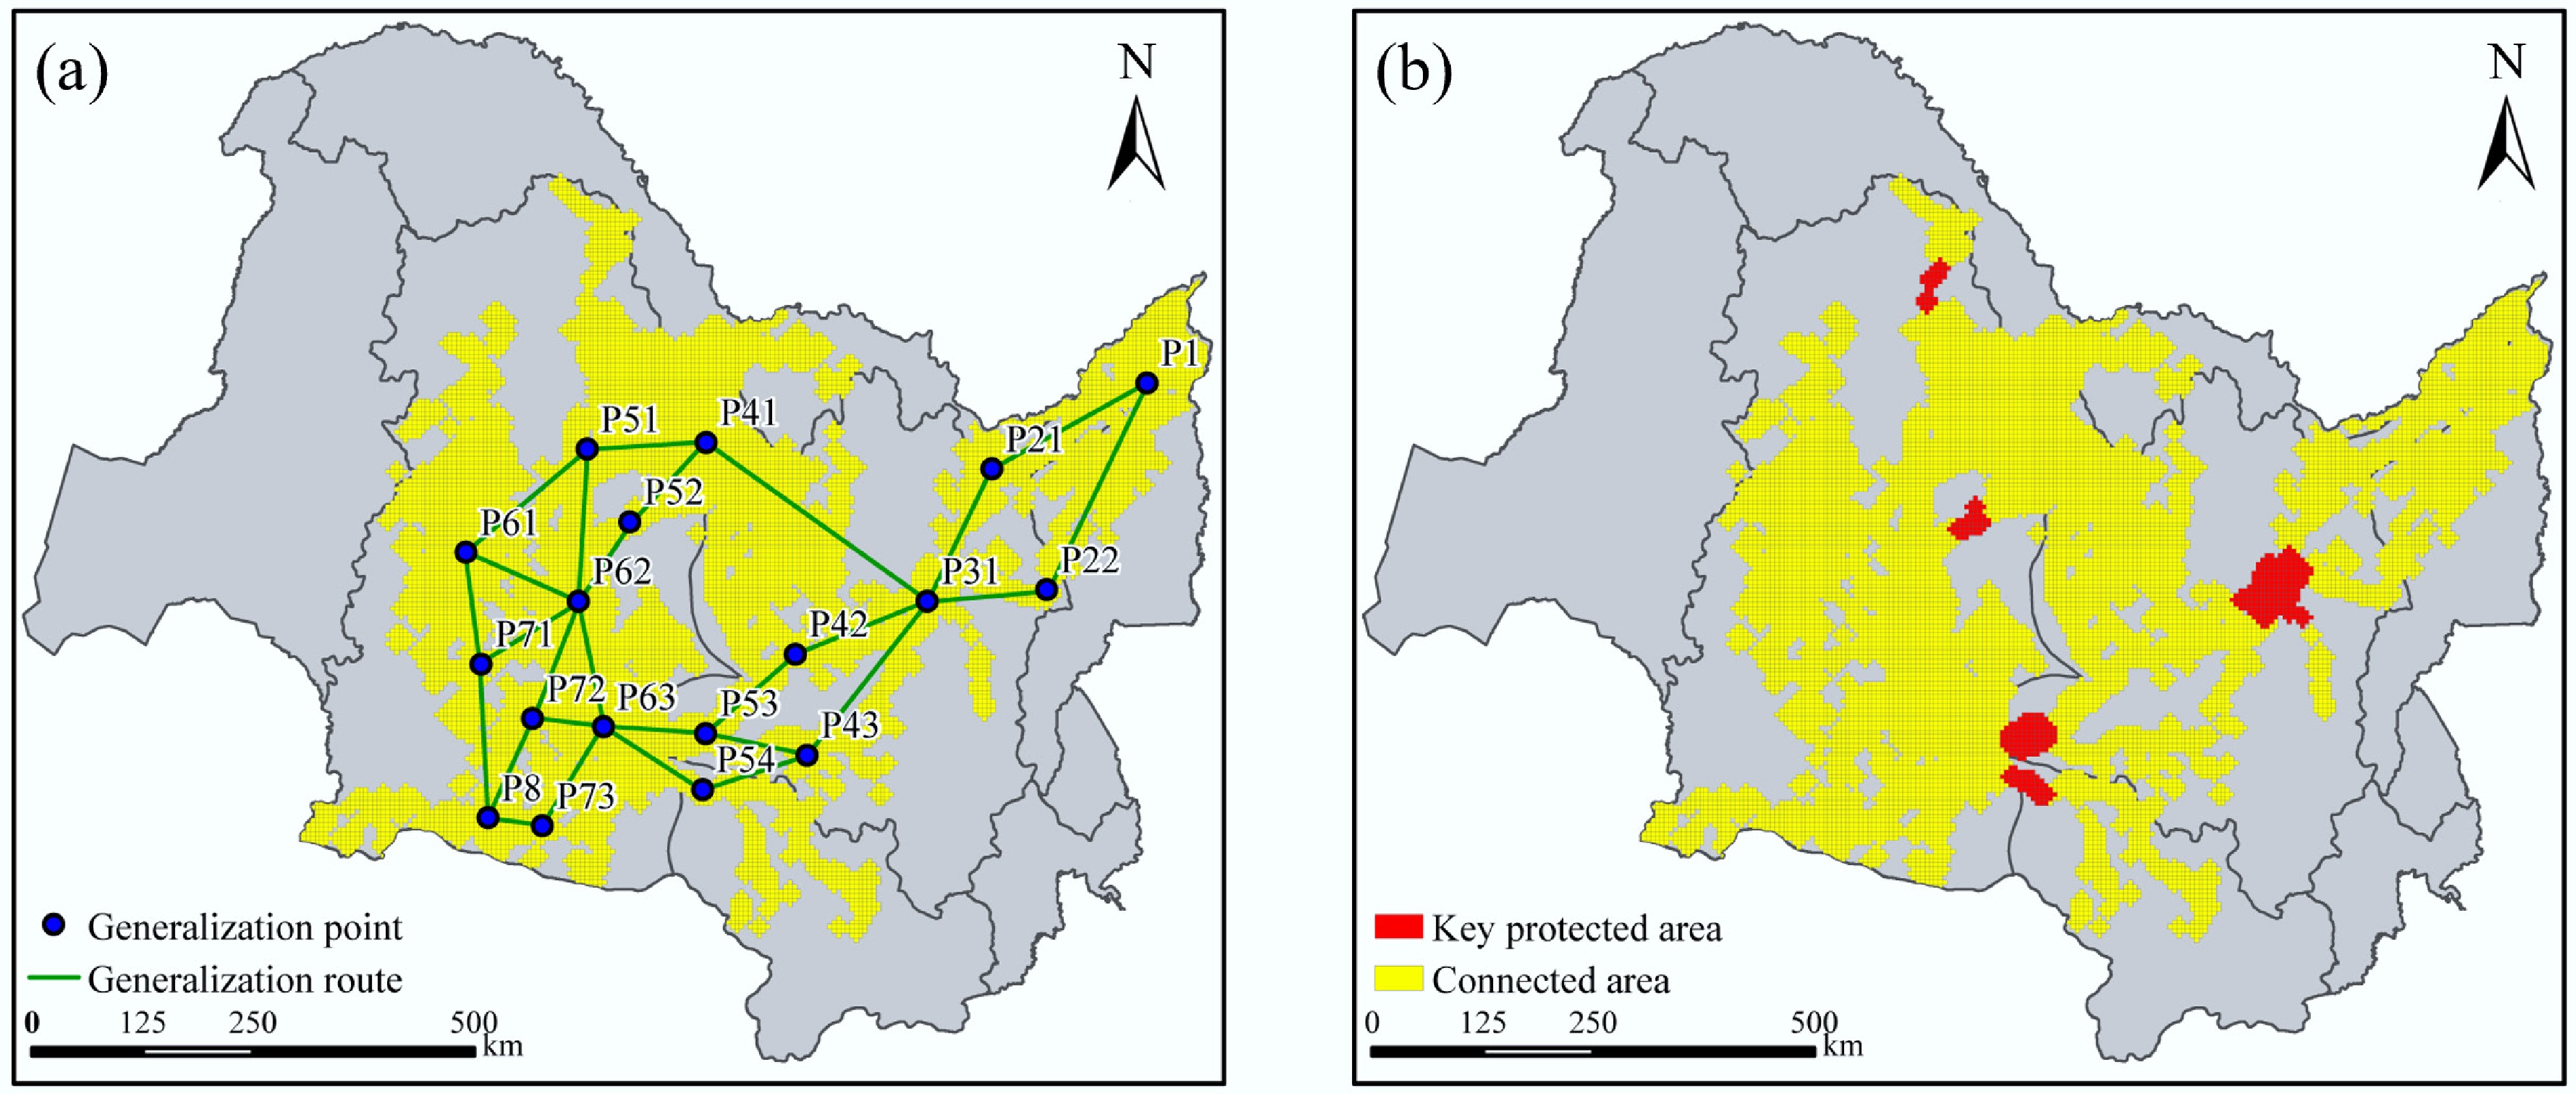
Figure 9.
Spatial distribution of (a) GR, and (b) key protected areas under current conditions.
-
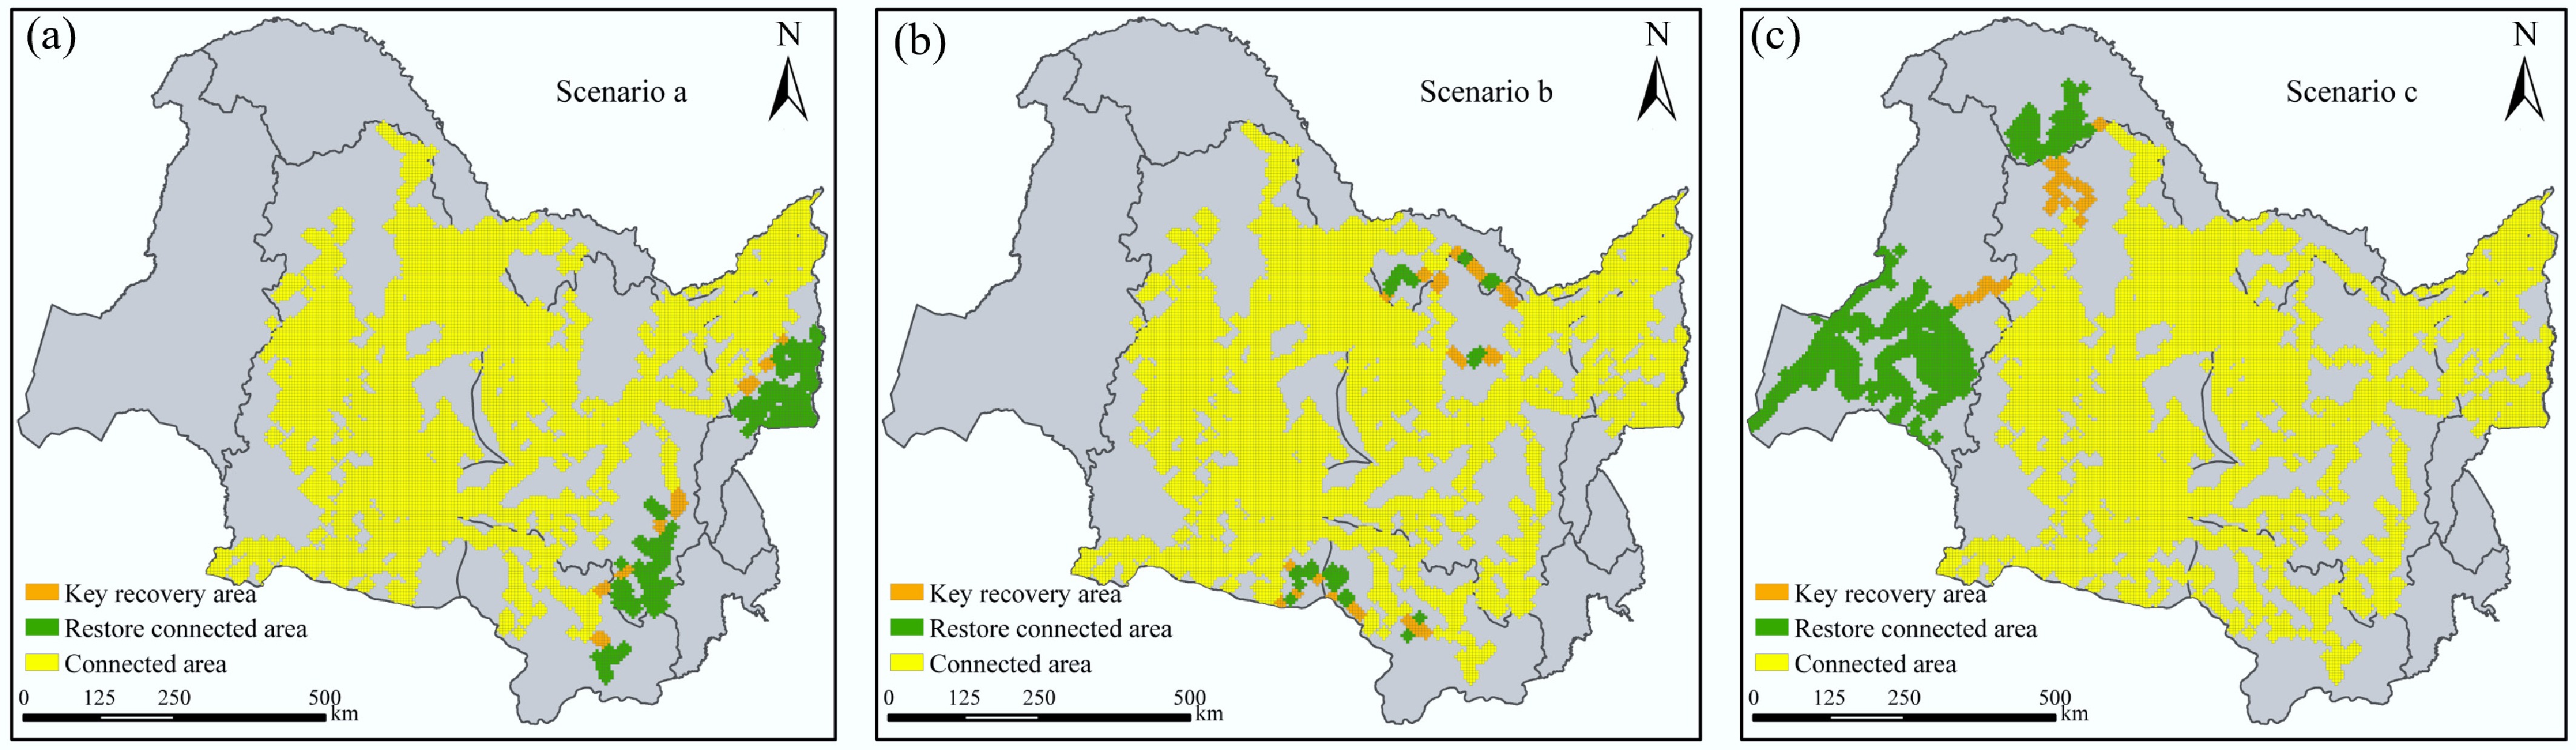
Figure 10.
(a)–(c) Spatial distribution of critical wetlands areas under different regulation scenarios.
-
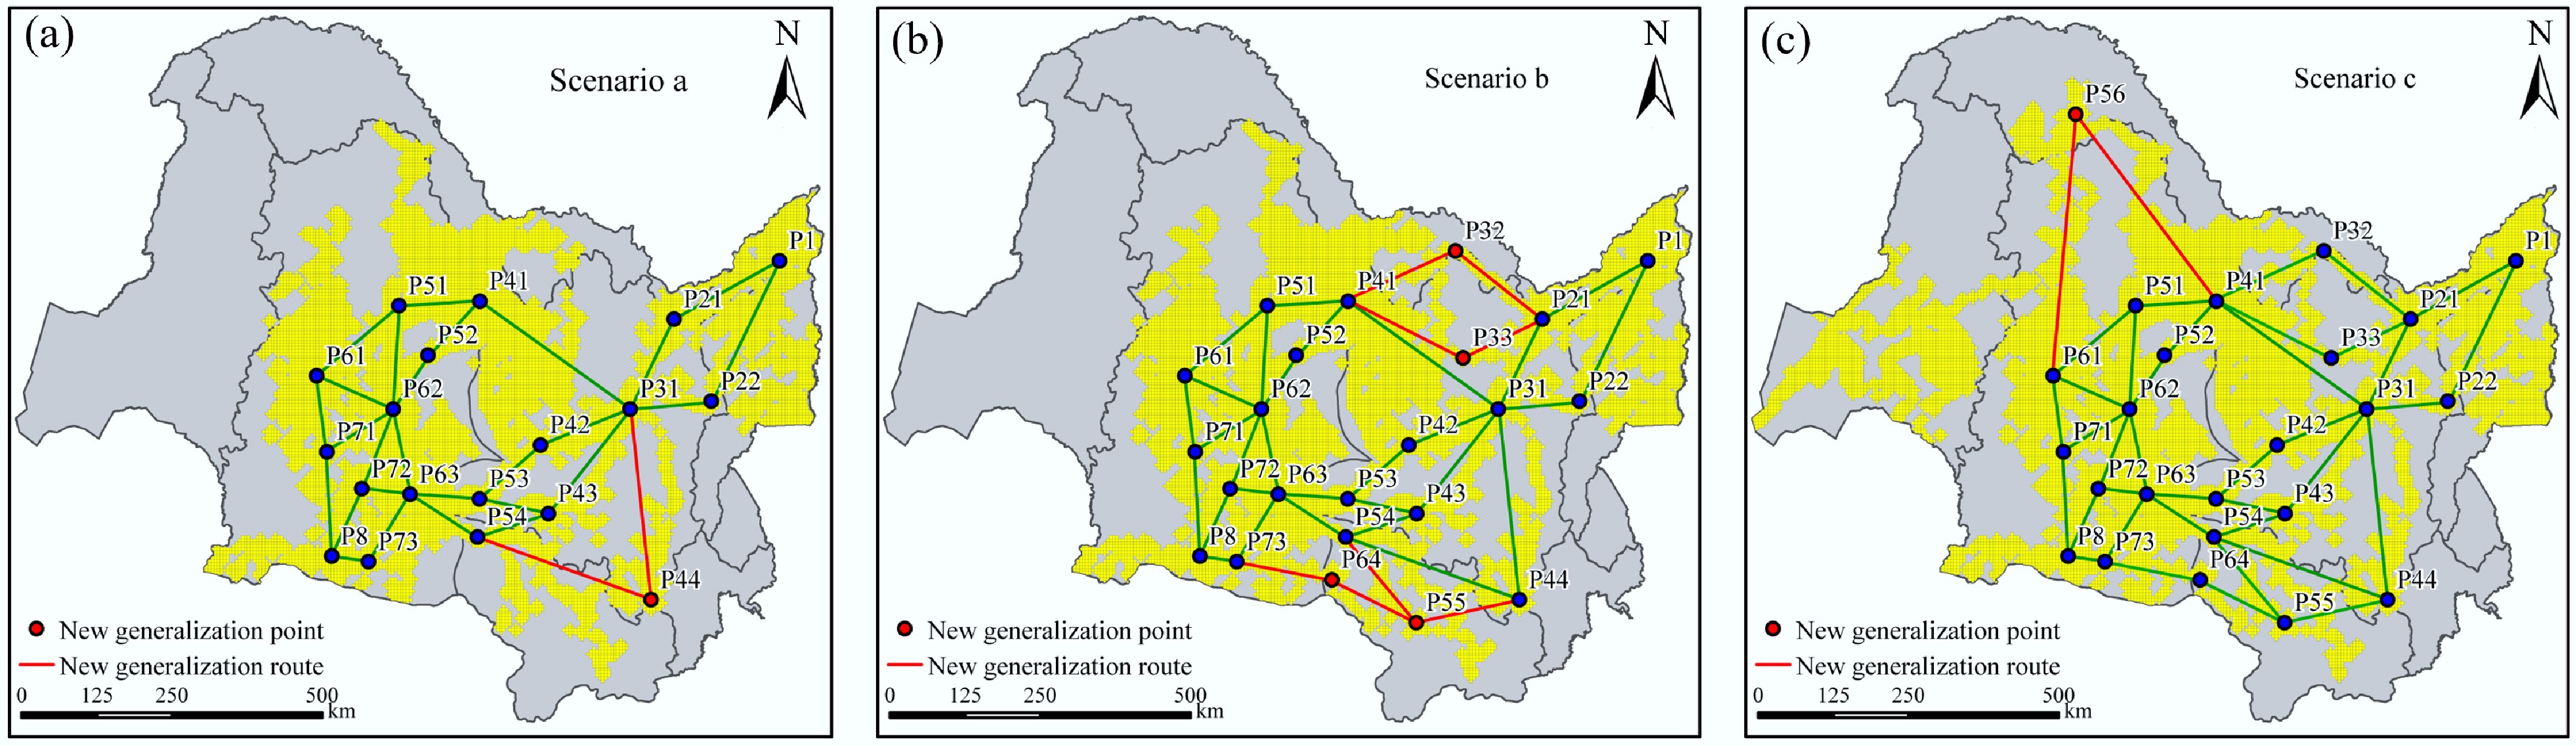
Figure 11.
(a)–(c) Spatial distribution of GRs under different regulation scenarios.
-
Scenario Farmland Forest land Grassland Townland Wetland Farmland/
wetland1 65.08% 31.26% 1.12% 2.54% 0.00 All farmland 2 59.16% 31.26% 1.12% 2.54% 5.92% 10:1 3 57.85% 31.26% 1.12% 2.54% 7.23% 8:1 4 55.78% 31.26% 1.12% 2.54% 9.30% 6:1 5 52.06% 31.26% 1.12% 2.54% 13.02% 4:1 6 43.39% 31.26% 1.12% 2.54% 21.69% 2:1 7 32.54% 31.26% 1.12% 2.54% 32.54% 1:1 8 21.69% 31.26% 1.12% 2.54% 43.39% 1:2 9 13.02% 31.26% 1.12% 2.54% 52.06% 1:4 10 9.30% 31.26% 1.12% 2.54% 55.78% 1:6 11 7.23% 31.26% 1.12% 2.54% 57.85% 1:8 12 5.92% 31.26% 1.12% 2.54% 59.16% 1:10 13 0.00 31.26% 1.12% 2.54% 65.08% All wetland Table 1.
Proportion of land use types under different scenarios in the QRB
Figures
(11)
Tables
(1)