-
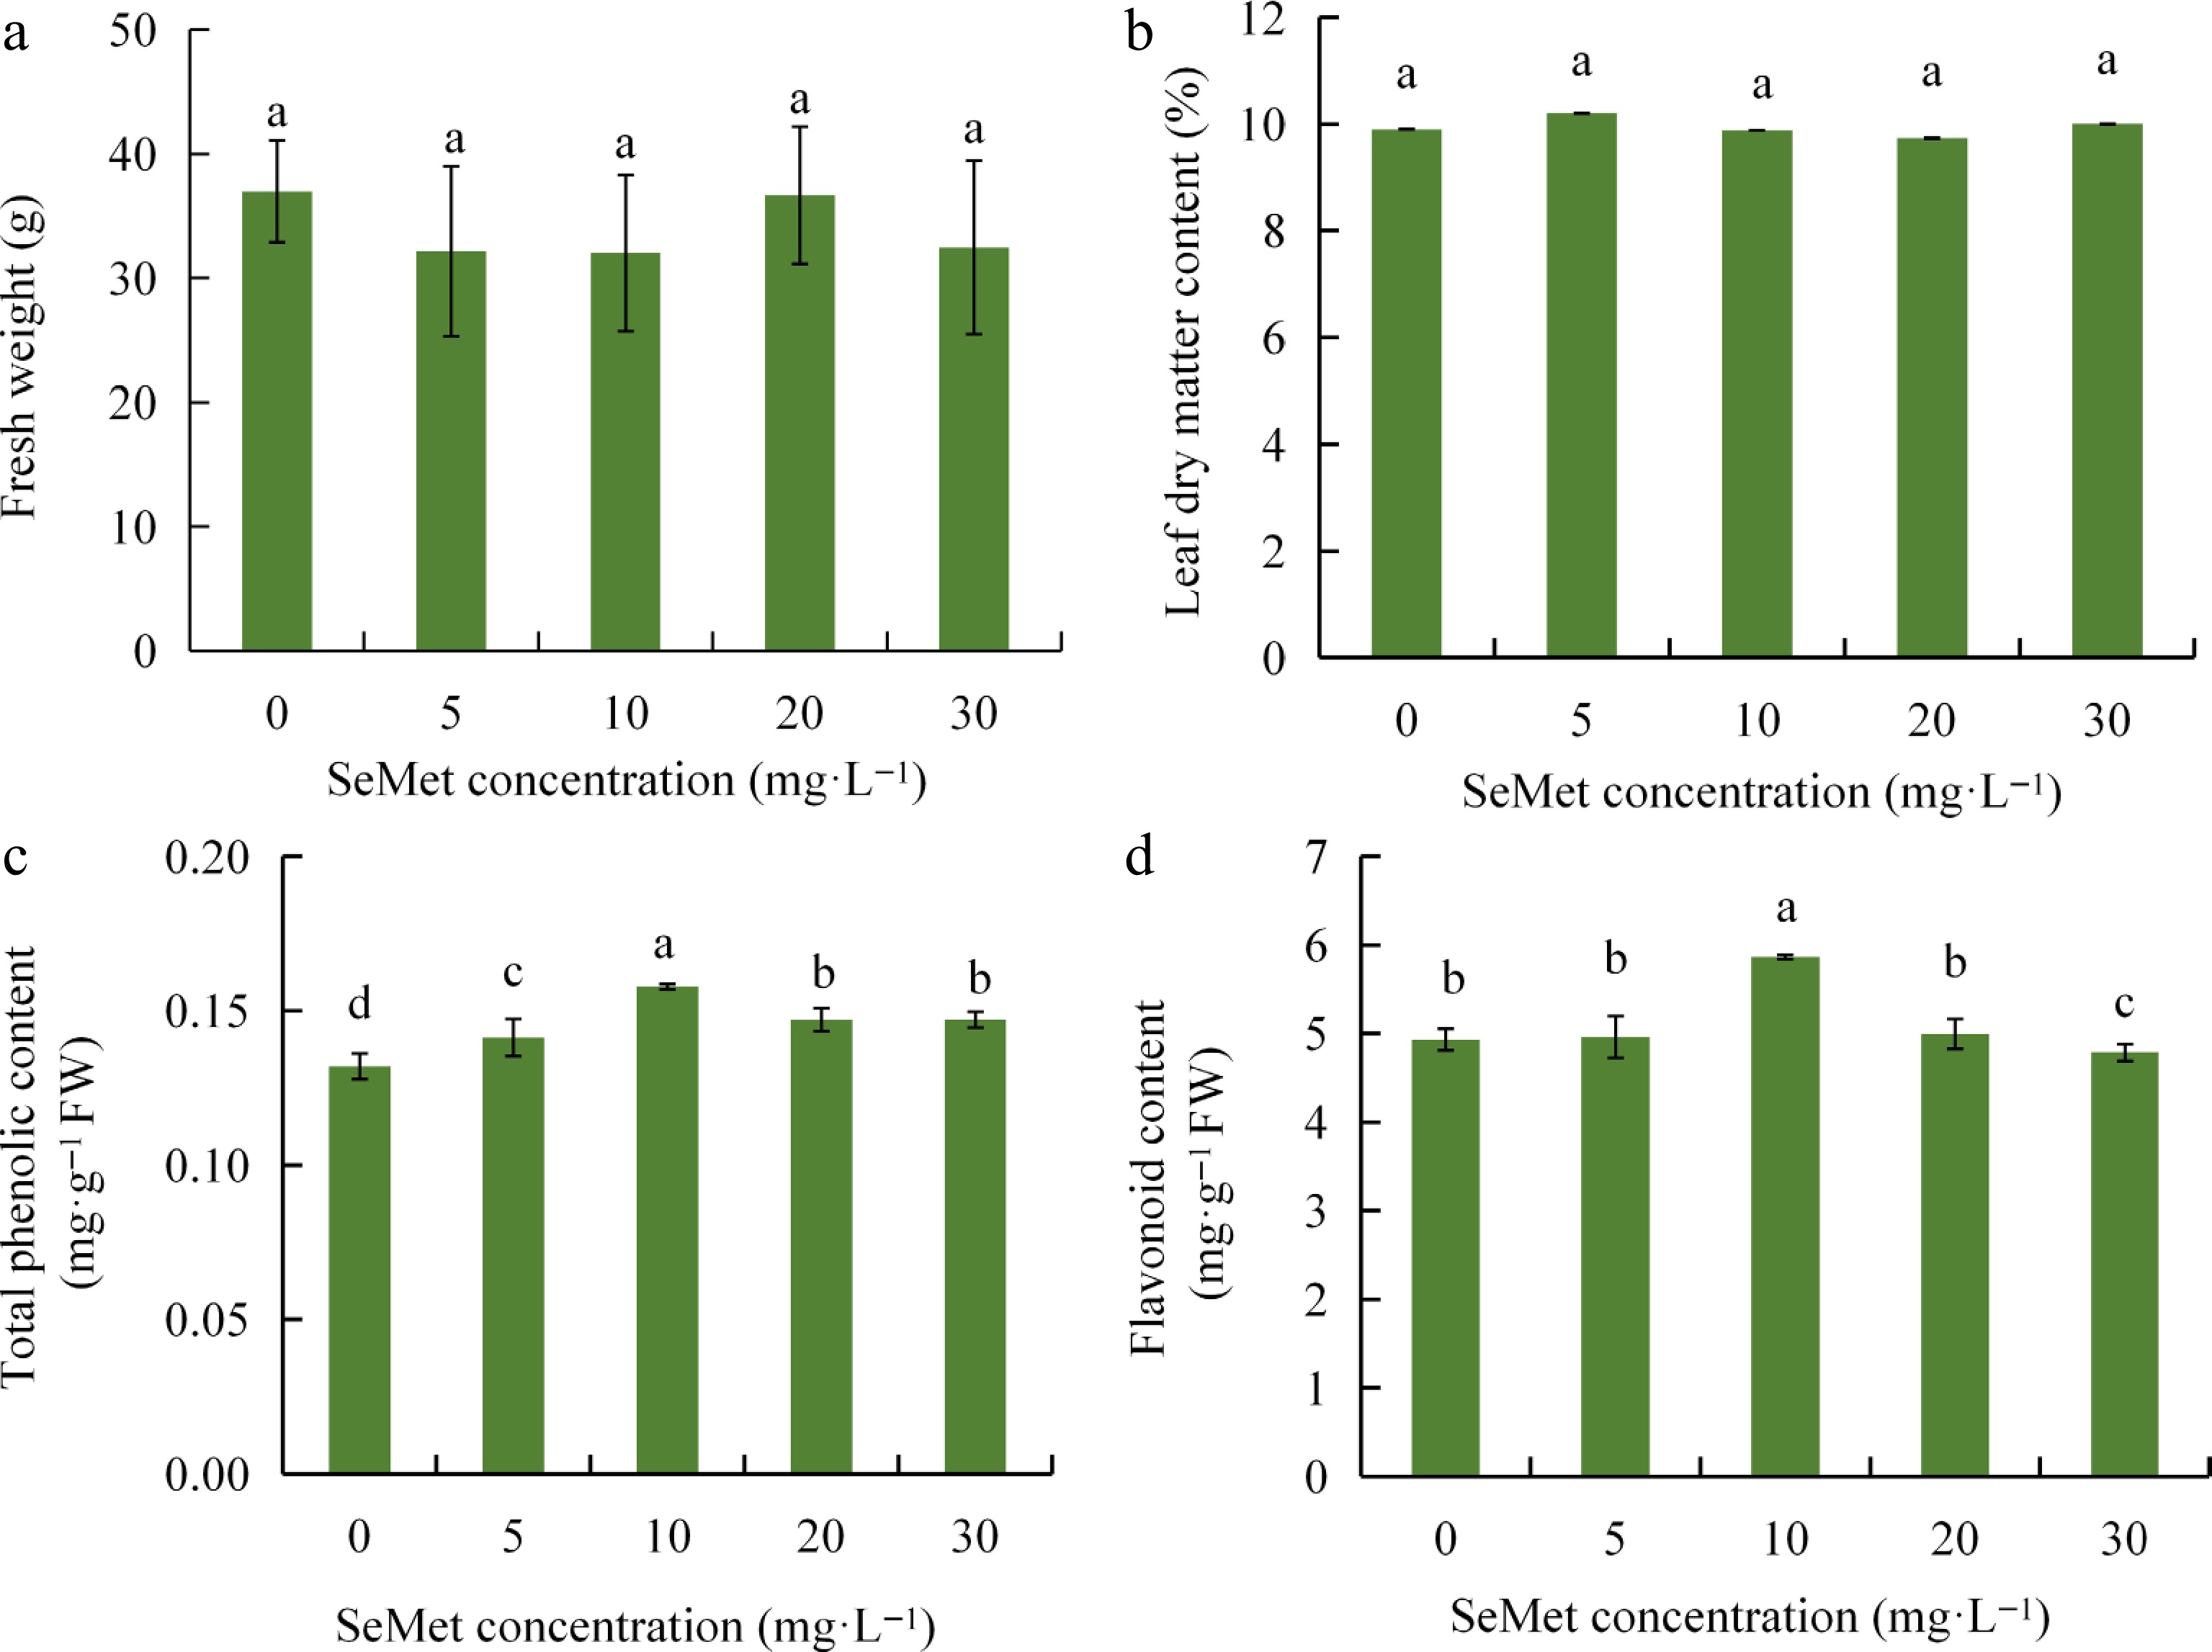
Figure 1.
Effects of different exogenous concentrations of SeMet on the growth and quality of kale seedlings. (a) Effect of SeMet on fresh weight of kale seedlings. (b) Effect of SeMet on leaf dry matter of kale seedlings. (c) Effect of SeMet on total phenolic content of kale seedlings. (d) Effect of SeMet on the flavonoid content of kale seedlings. Data shown as mean ± SD (n = 3). Means with different letters differ significantly (Duncan's test, p < 0.05).
-
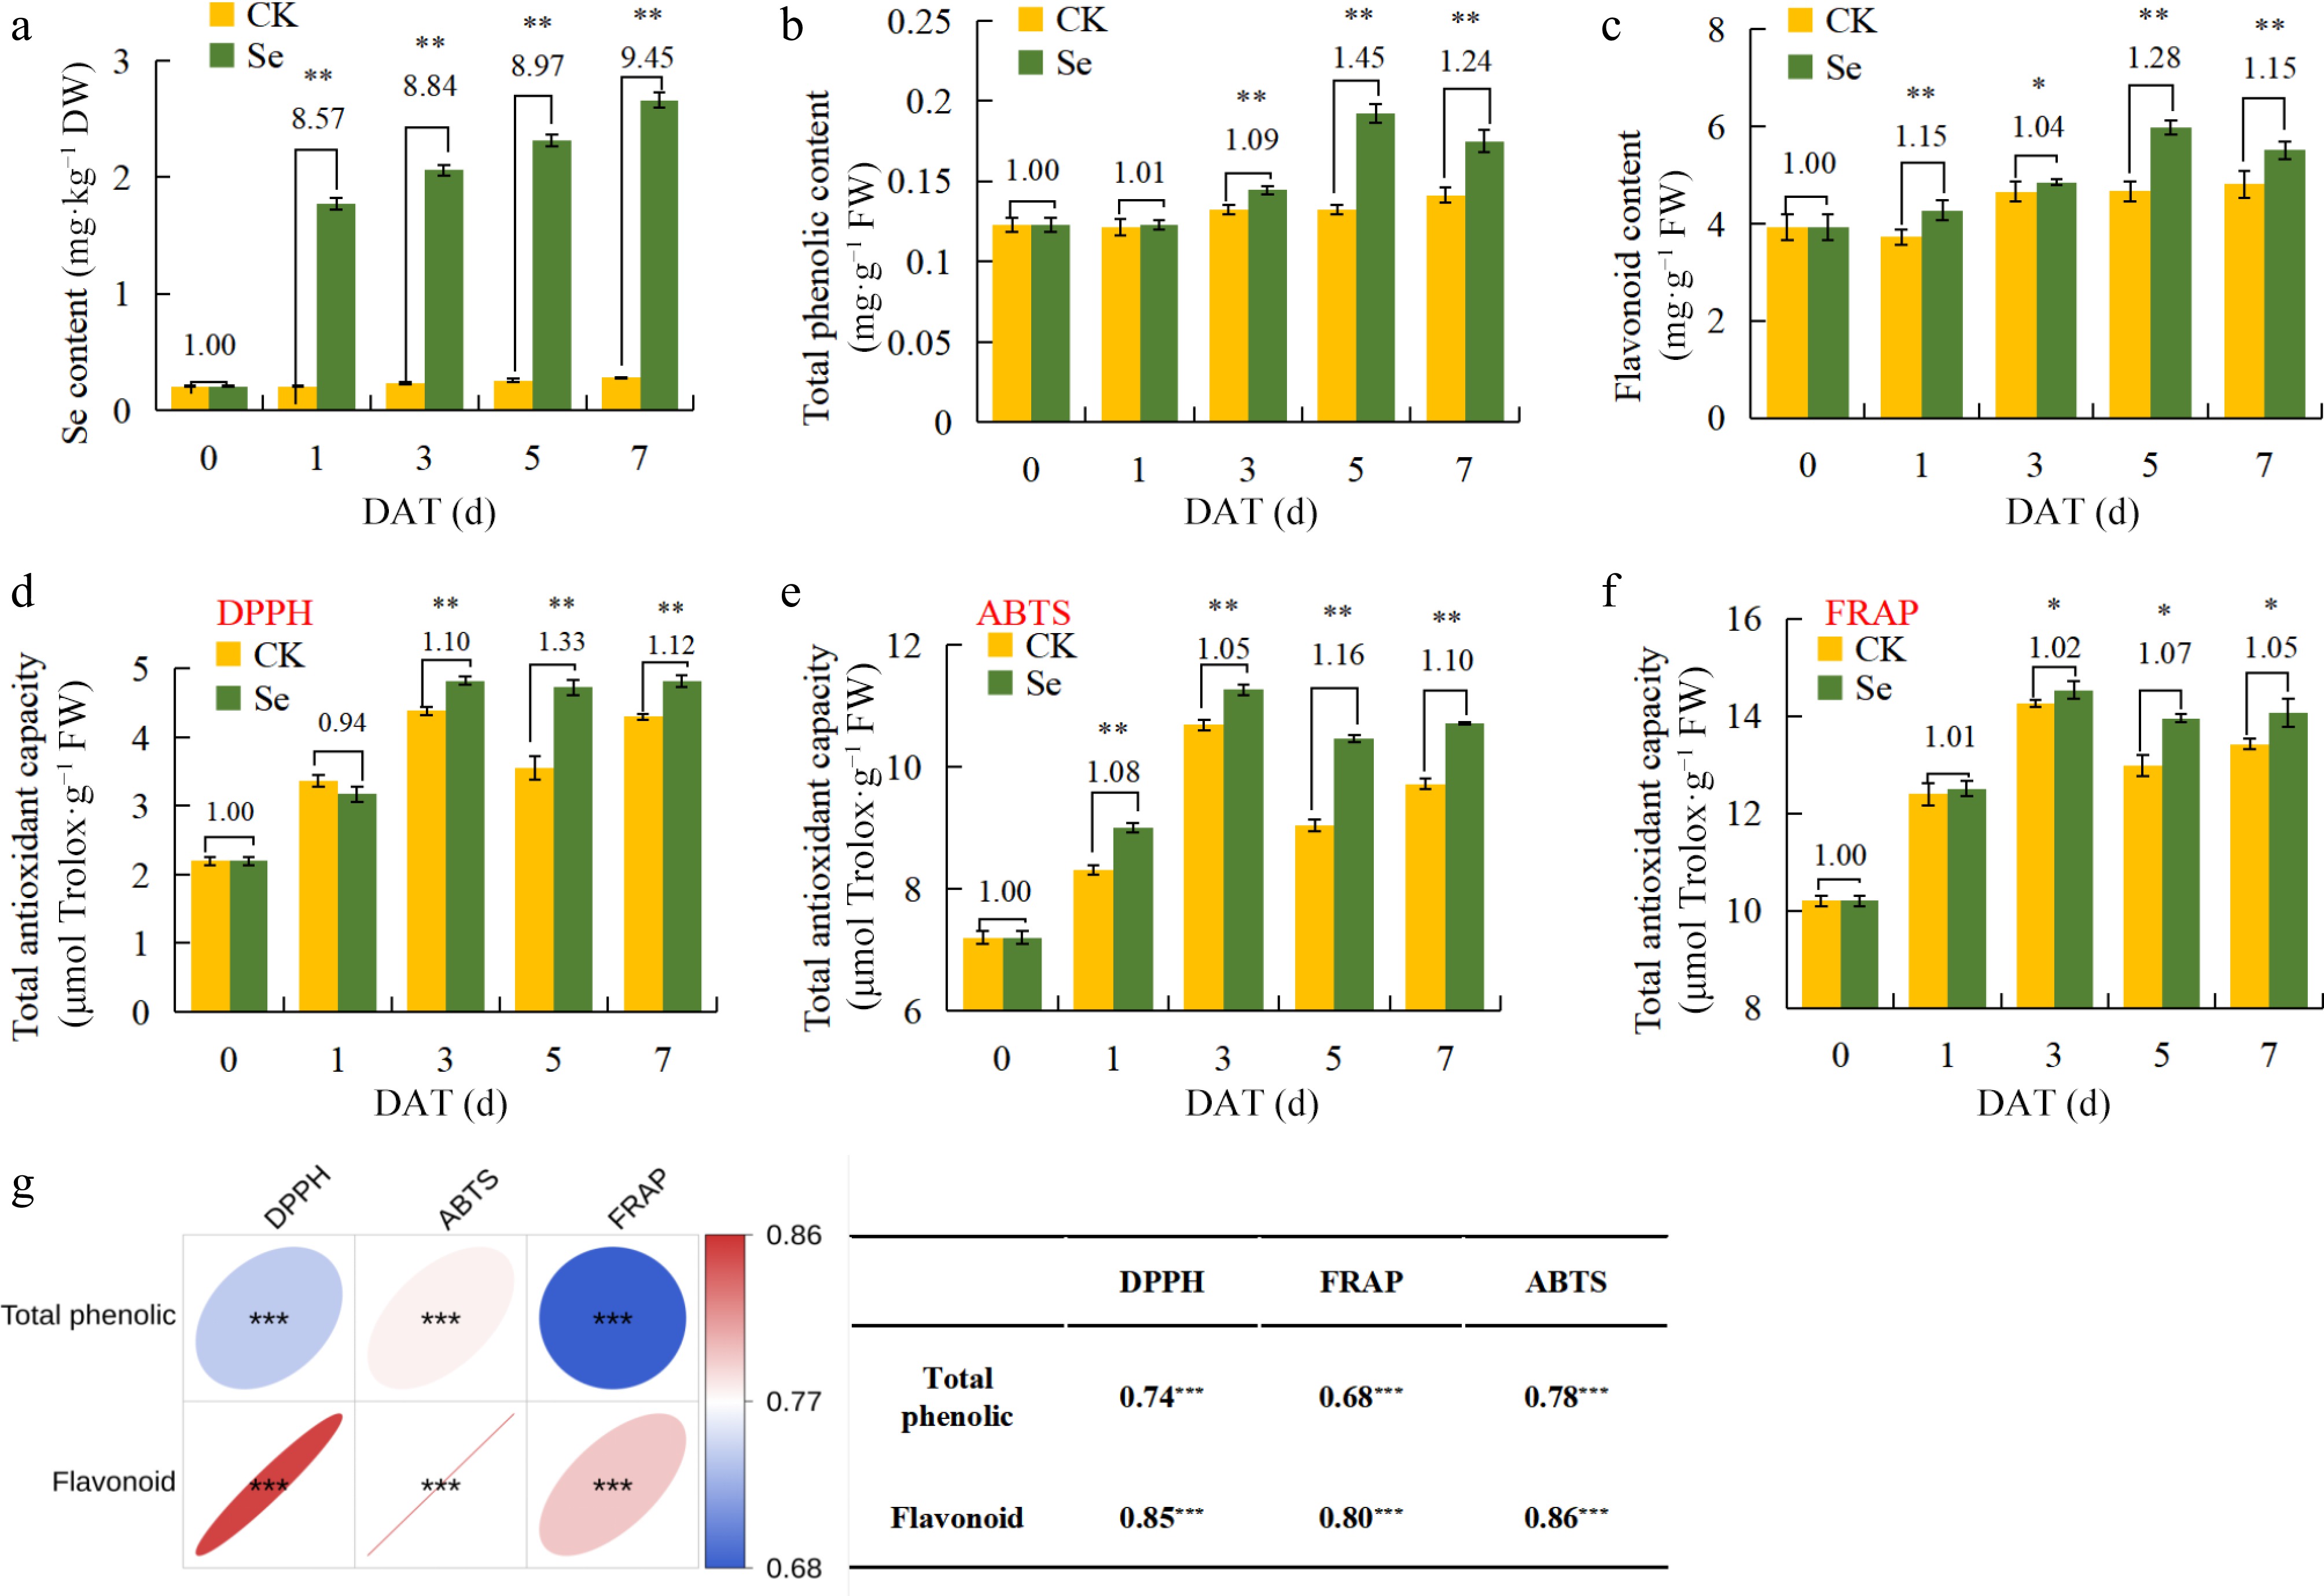
Figure 2.
Effects of kale seedlings after exogenous SeMet treatment on different sampling days. (a) Changes in Se content in kale seedlings with different sampling days. (b) Changes in total phenolic content in kale seedlings with different sampling days. (c) Changes in flavonoid content in kale seedlings with different sampling days. (d) Changes of DPPH radical scavenging capacity in kale seedlings with different sampling days. (e) Changes of FRAP radical scavenging capacity in kale seedlings with different sampling days. (f) Changes of ABTS radical scavenging capacity in kale seedlings with different sampling days. (g) The correlation between flavonoids and antioxidant capacity. The kale seedlings were treated with 10 mg·L−1 for 0 d and 5 d, and the H2O treatment was the CK. Statistical analysis was performed using Student's t-test on triplicate measurements (mean ± SD), with significance levels denoted as follows: * p < 0.05; ** p < 0.01. The DAT means day after treatment.
-
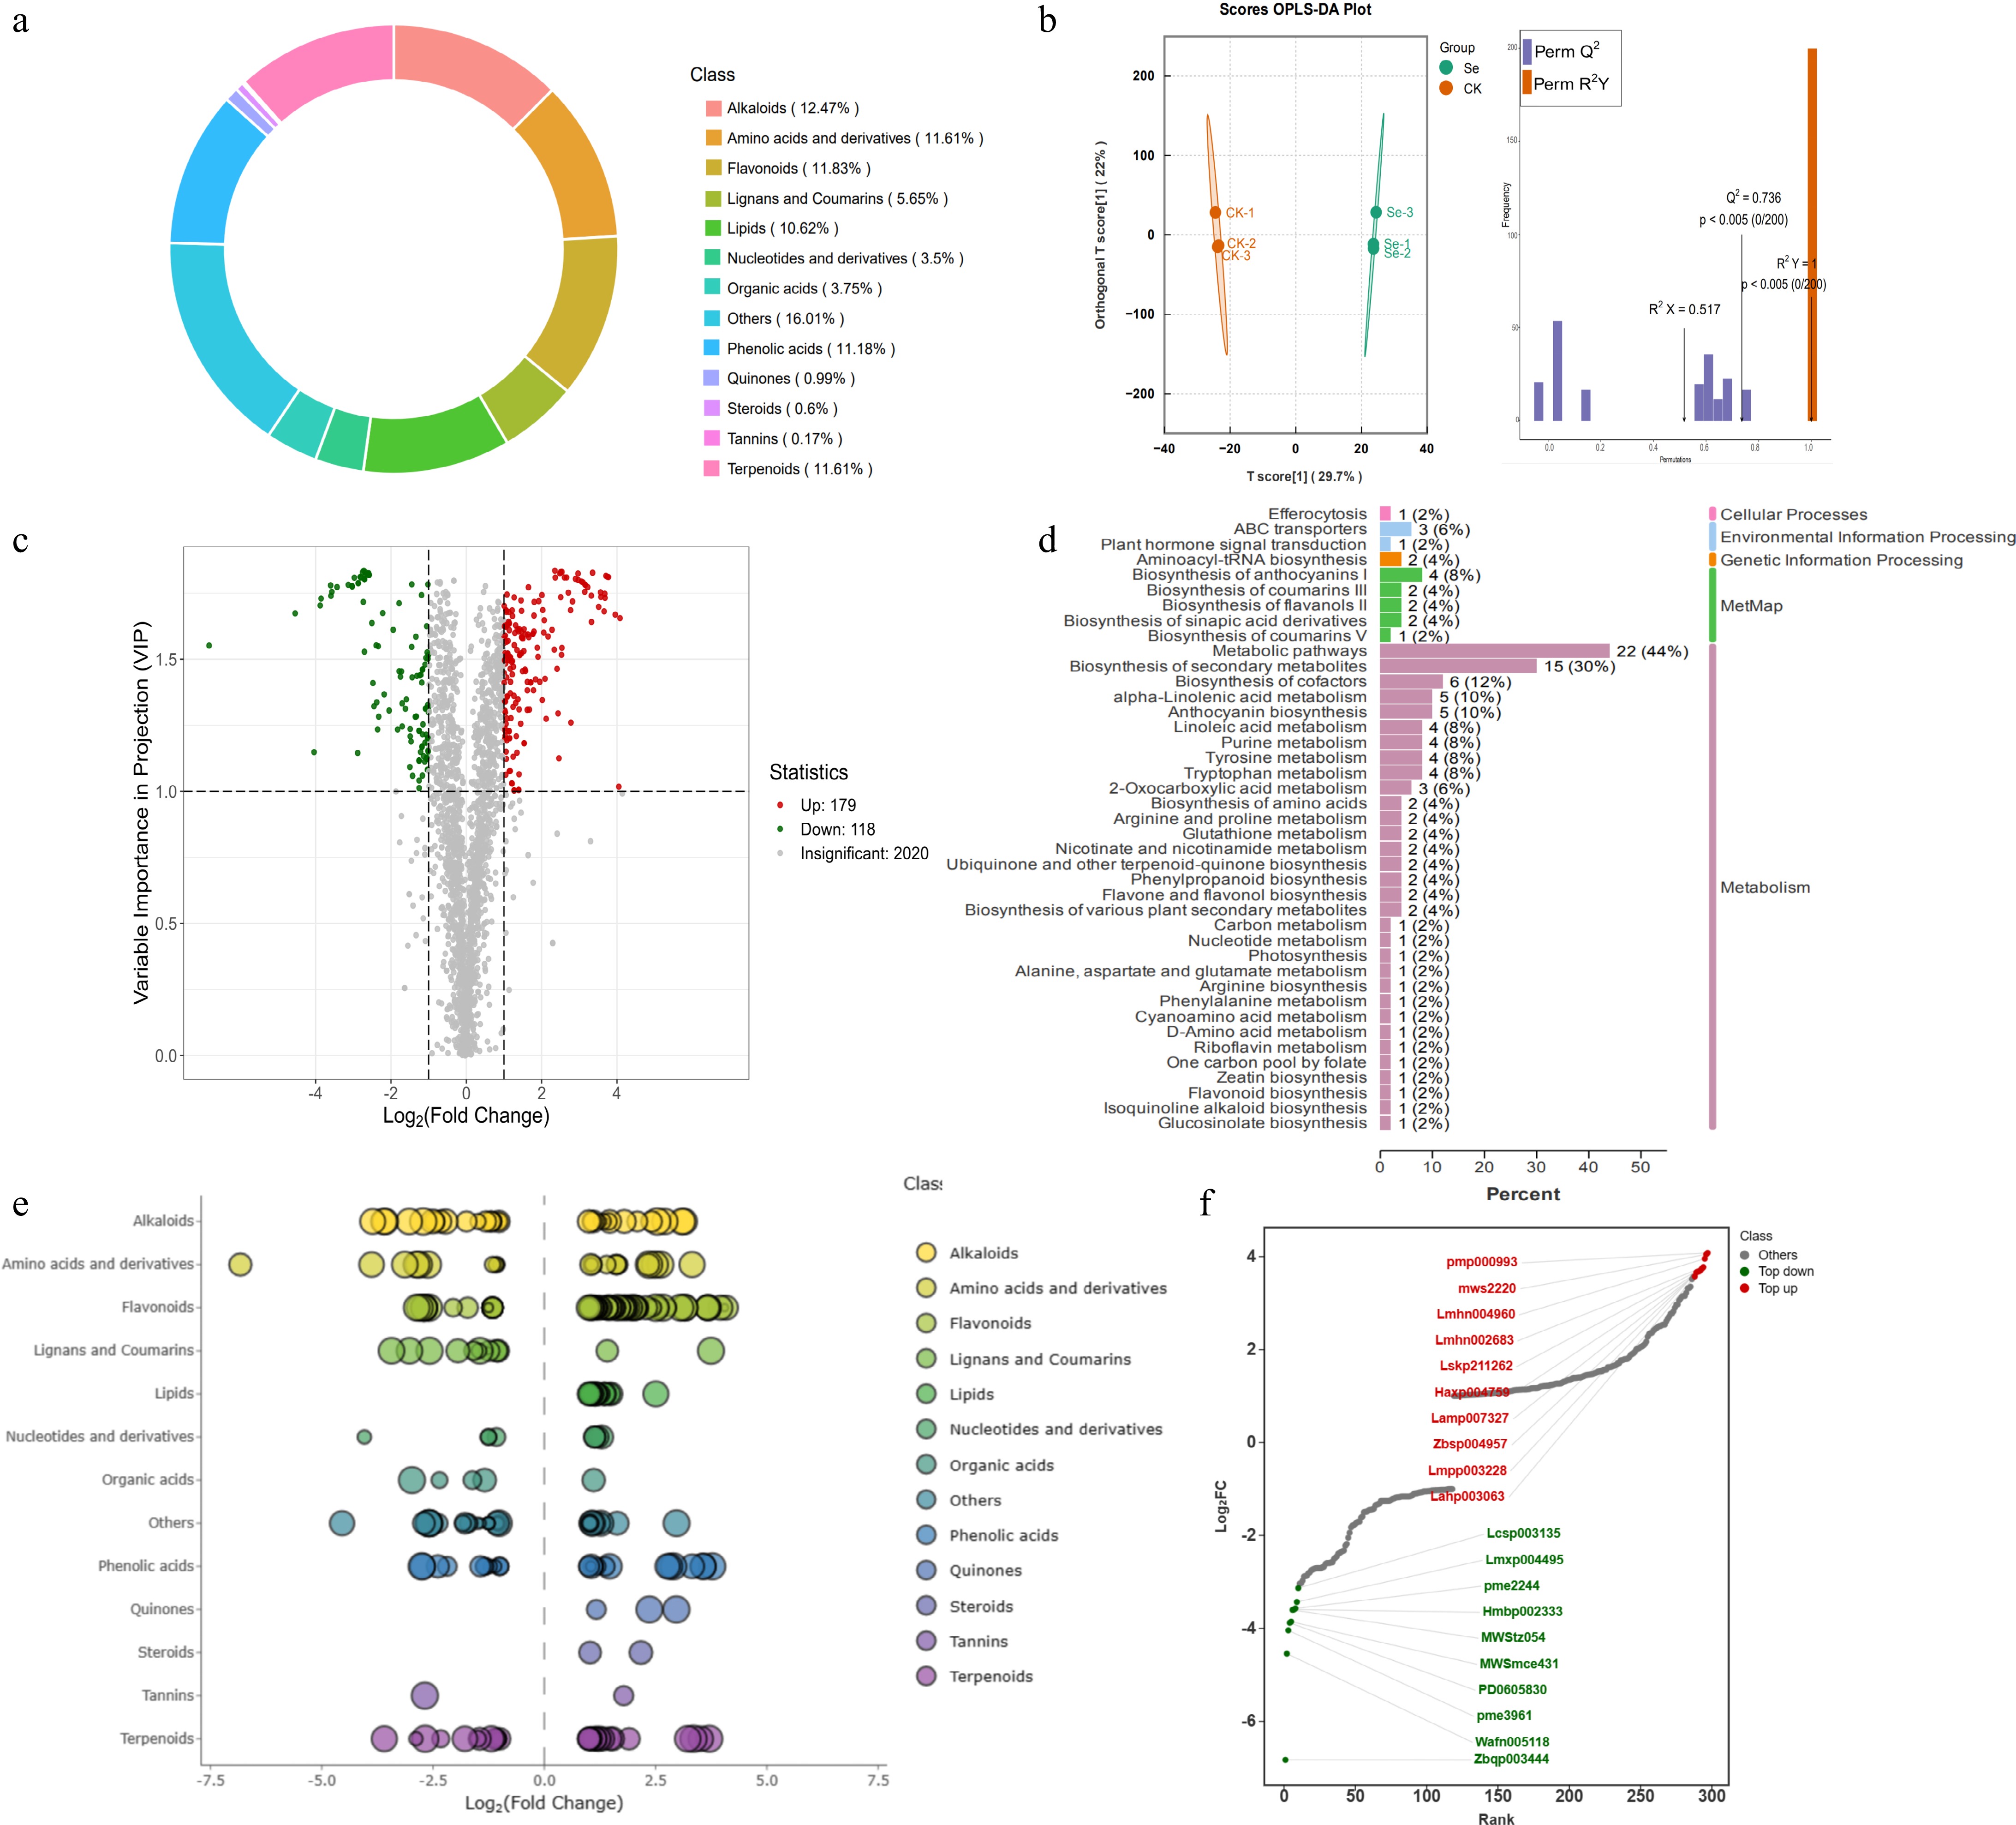
Figure 3.
Metabolome analysis of kale seedlings in response to exogenous SeMet. (a) Classification of metabolites in the metabolome. (b) OPLS-DA analysis of metabolites between the Se and CK groups. (c) Volcano plots for DEMs between the Se and CK groups. Metabolite up-regulation is color-coded in red, while down-regulation is shown in green. (d) KEGG pathway enrichment analysis of DEMs. (e) Scatter plots visualization of DEMs showing log2FC values on the x-axis and variable importance in projection (VIP) scores represented by dot size. (f) Dynamic distribution of the top 10 up-regulated and down-regulated DEMs with Log2FC. Metabolite up-regulation is color-coded in red, while down-regulation is shown in green.
-
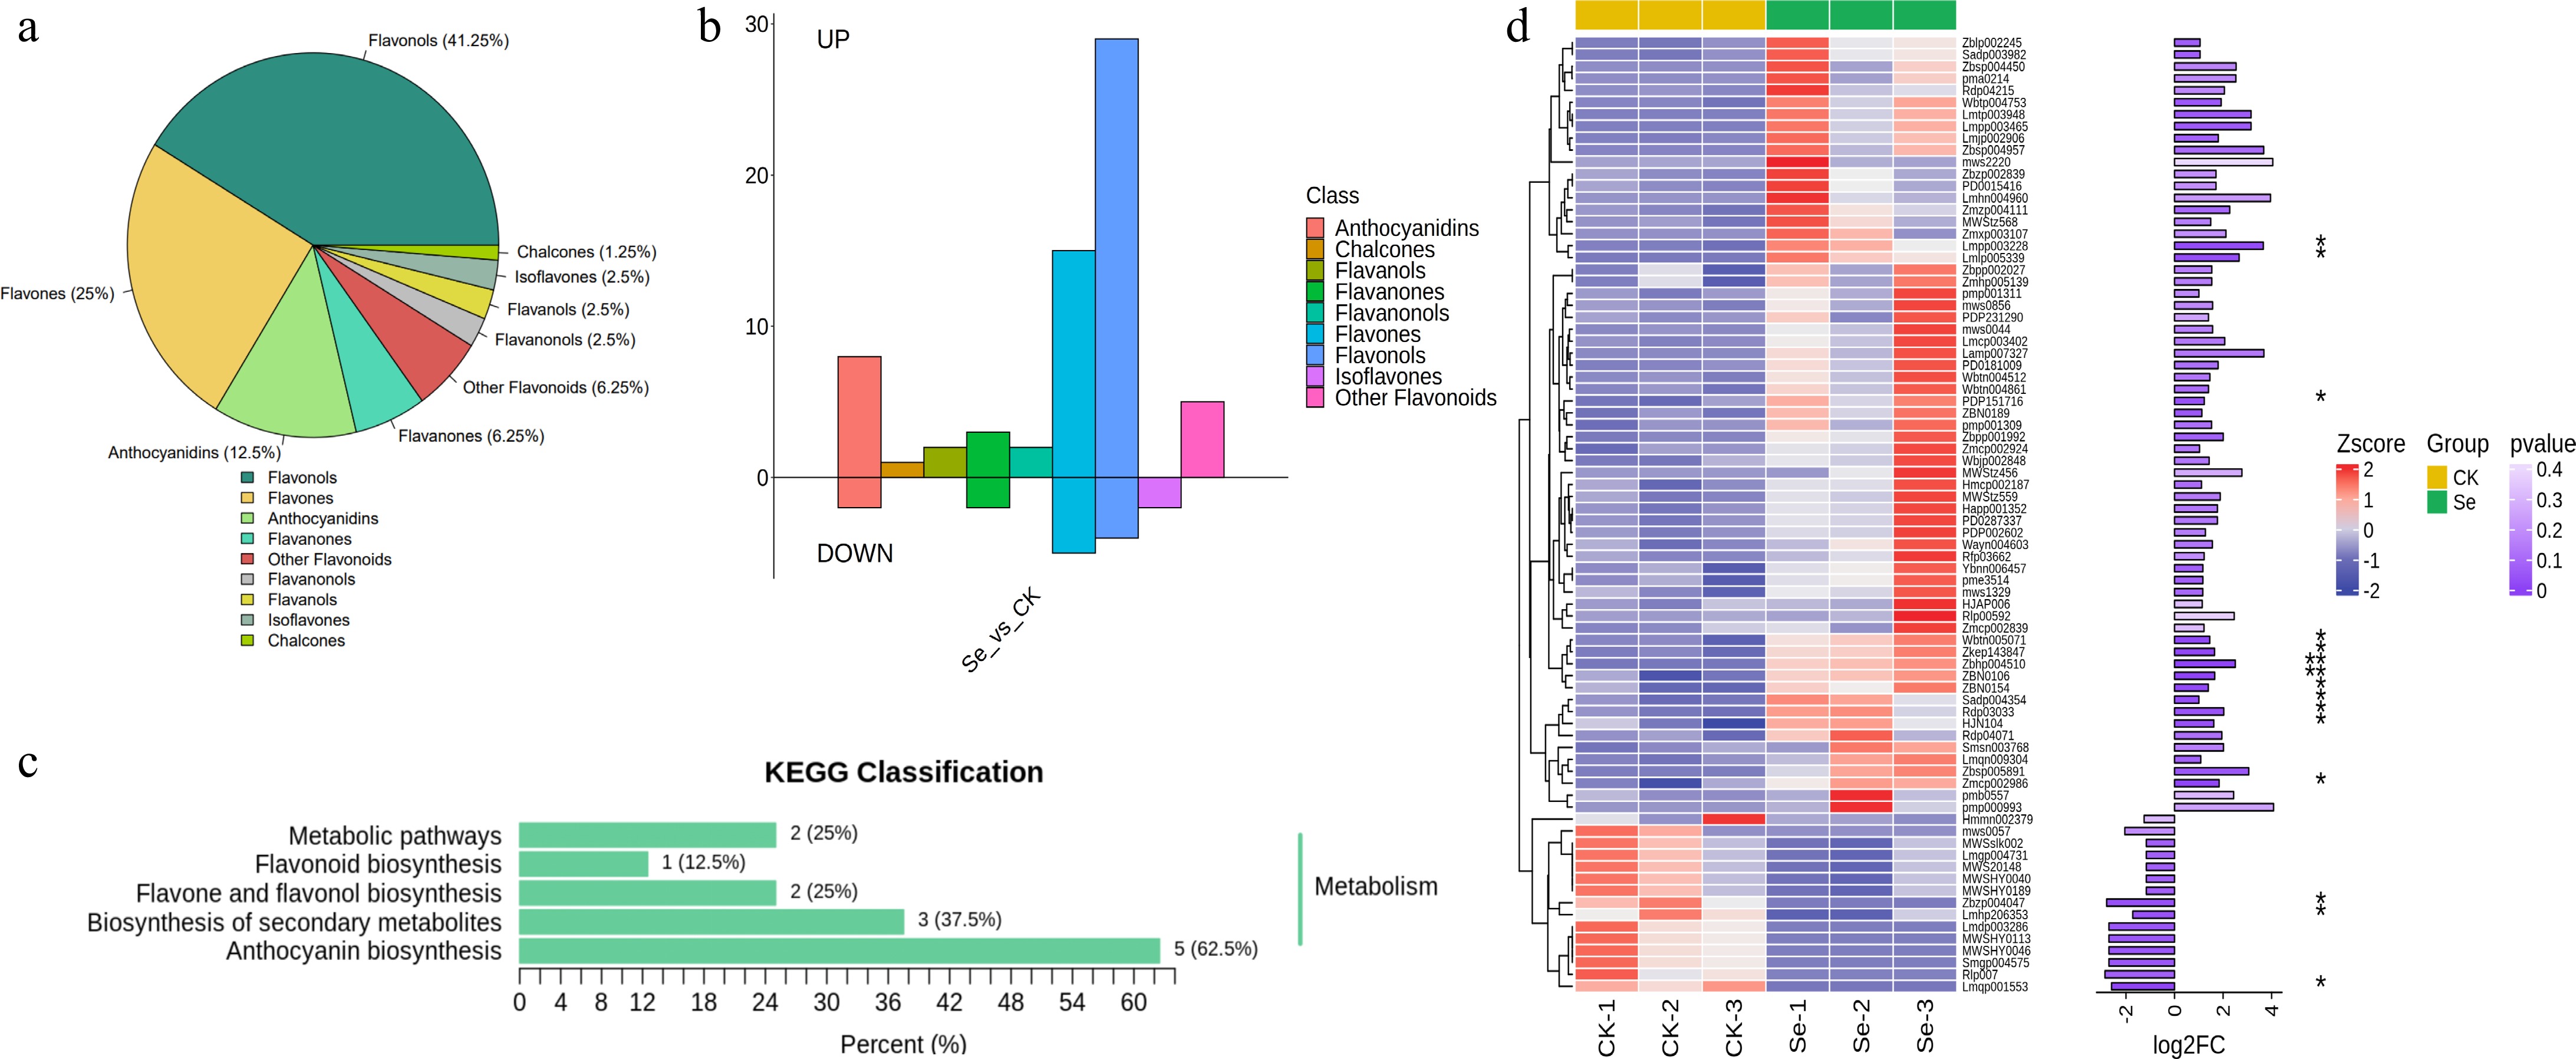
Figure 4.
Analysis of flavonoid substances in the metabolome. (a) Classification of flavonoid substances in DEMs. (b) Statistics of up-regulated and down-regulated flavonoid substances. (c) KEGG annotation of flavonoids in DEMs. (d) The cluster heat map of flavonoid substances in DEMs between the Se and CK groups. The length of the column on the right column represents the log2FC value of the substance, with significance levels denoted as follows: * p < 0.05; ** p < 0.01.
-
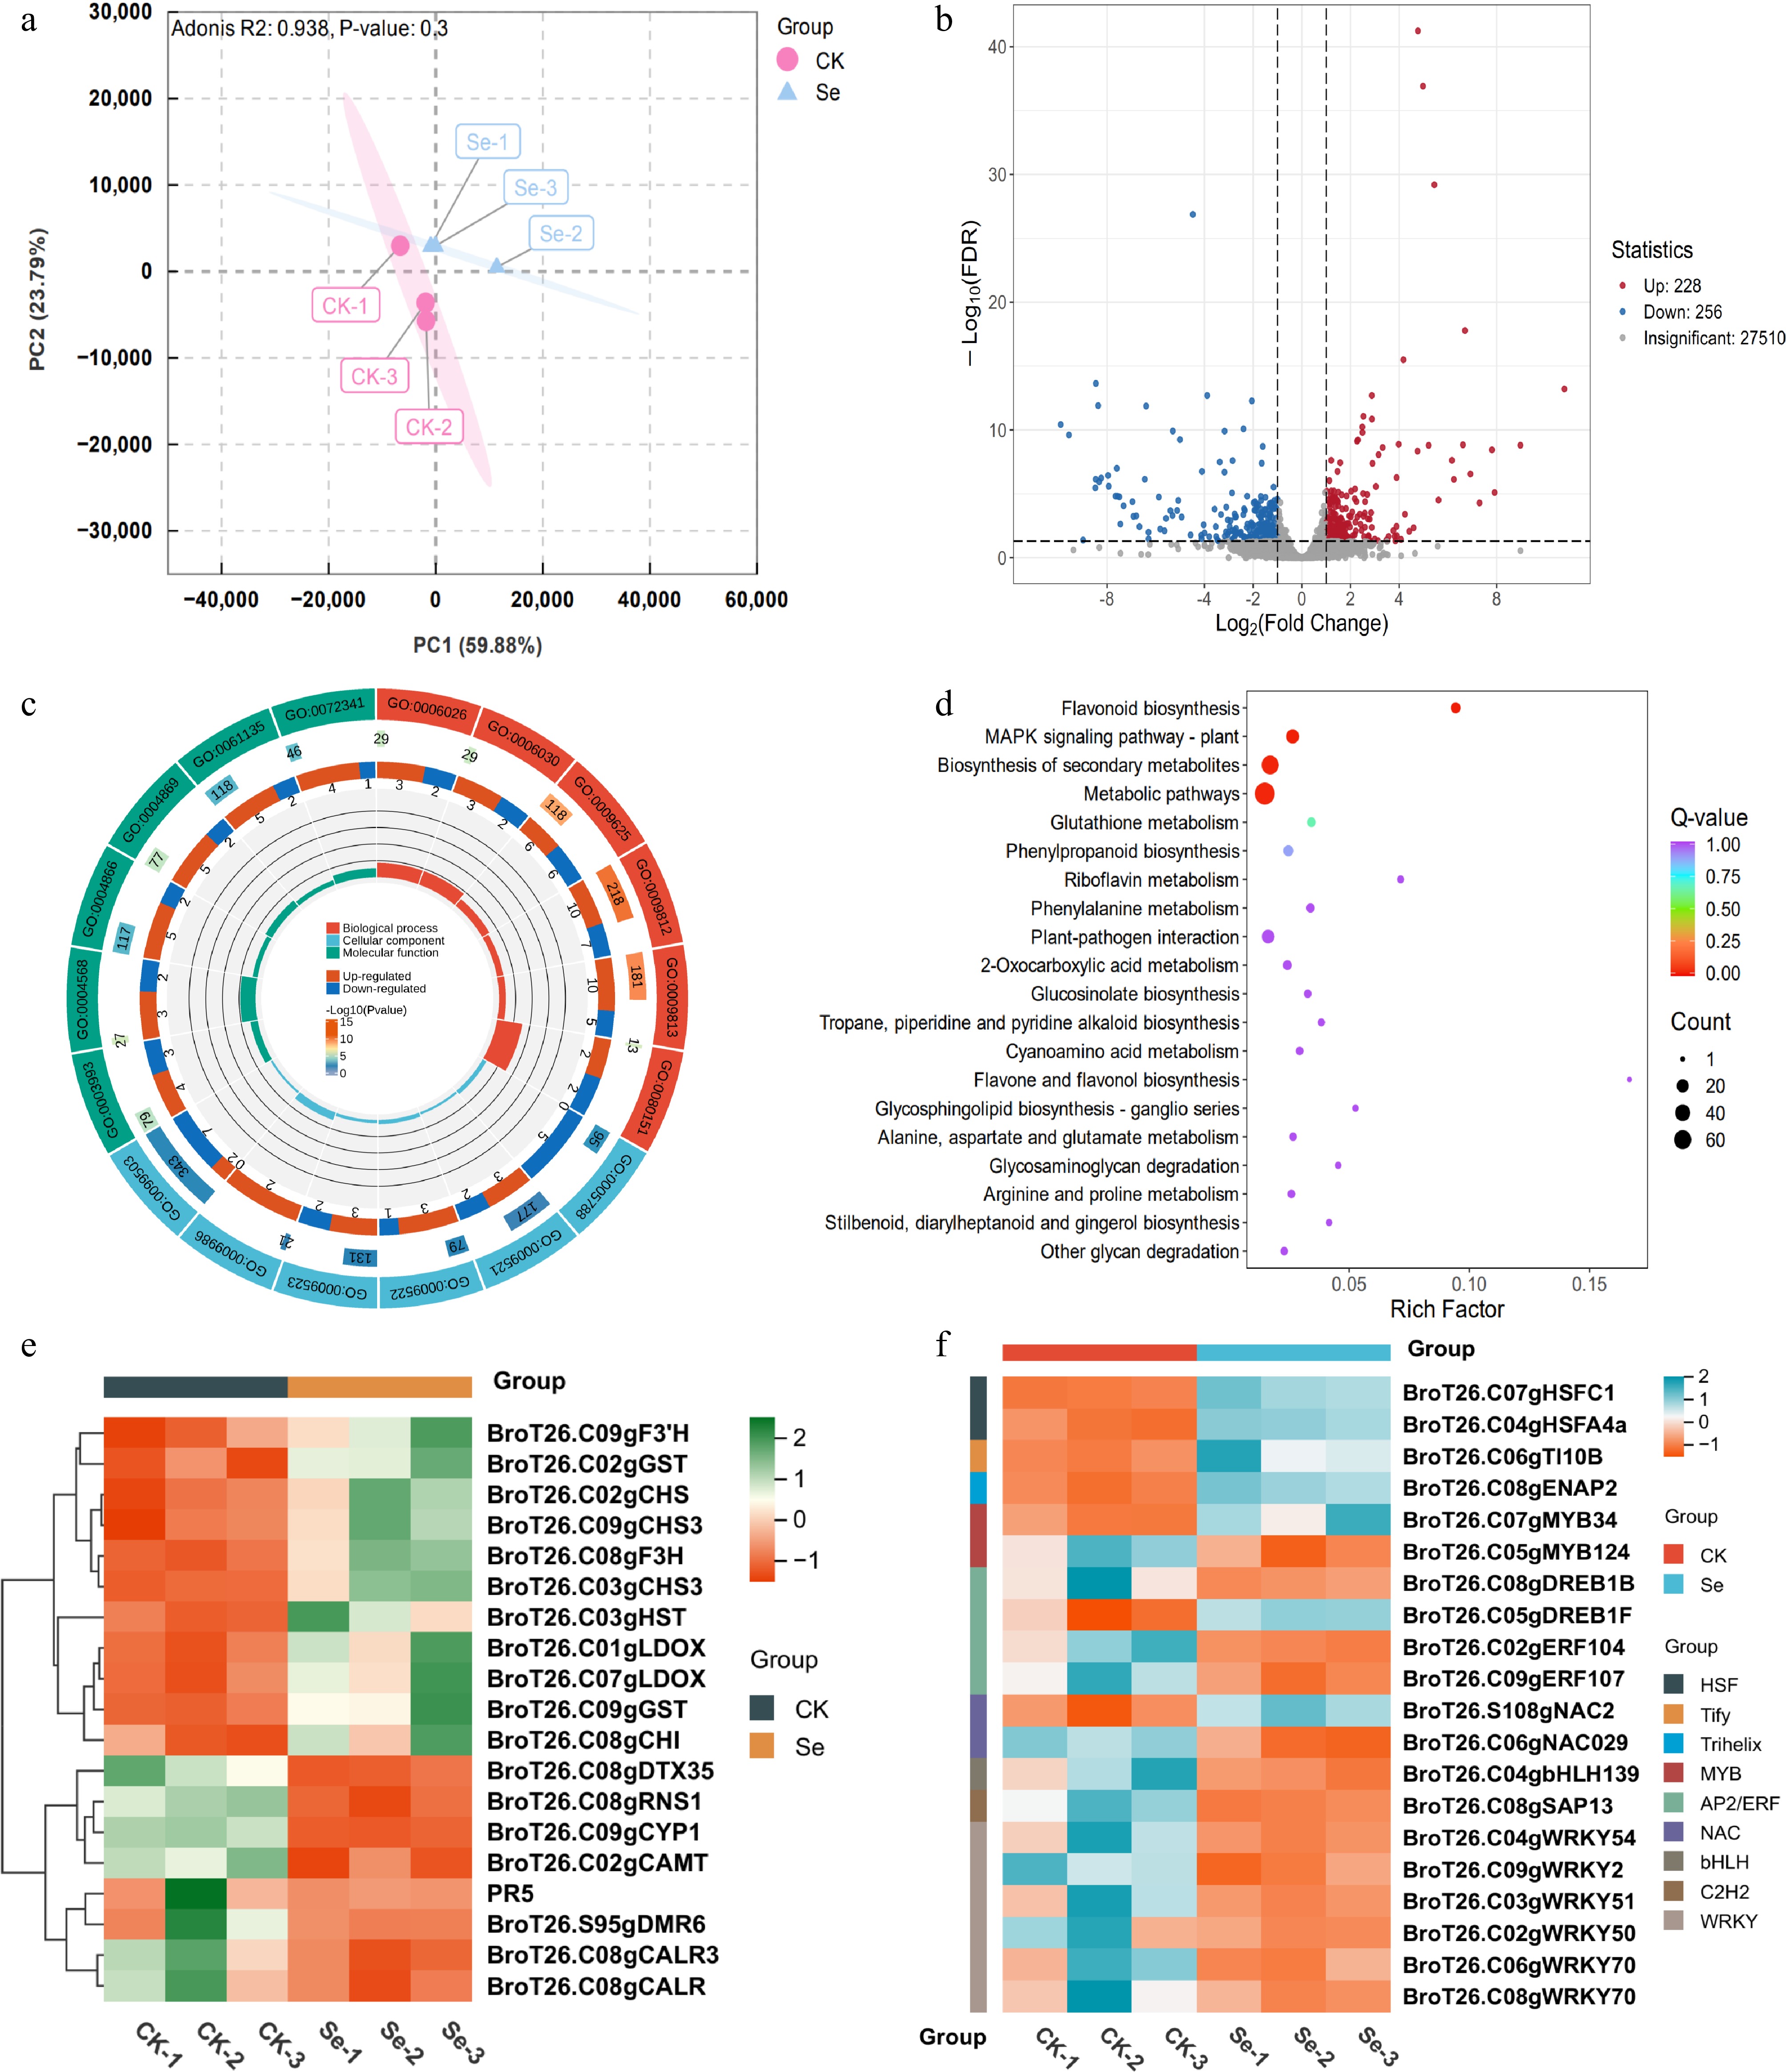
Figure 5.
Transcriptome analysis of kale seedlings in response to exogenous SeMet. (a) PCA plot of DEGs between SeMet-treated and control (CK) groups. (b) Volcano plot visualization of DEGs between SeMet-treated and CK groups. DEGs are color-coded with red indicating up-regulation and blue representing down-regulation. (c) GO enrichment analysis of DEGs. The first circle is KEGG_level_1 entries, with different colors representing different KEGG categories. The second circle is the pathway-specific gene counts and corresponding p-values of this category. The third circle is stacked bar plots showing up- (red) and down-regulated (blue) gene proportions. The fourth circle is the percentage of DEGs relative to total genes in each pathway category. (d) KEGG pathway enrichment analysis of DEGs. (e) Clustered heatmap of flavonoid-related DEGs. (f) Clustered heatmap of transcription factor DEGs.
-
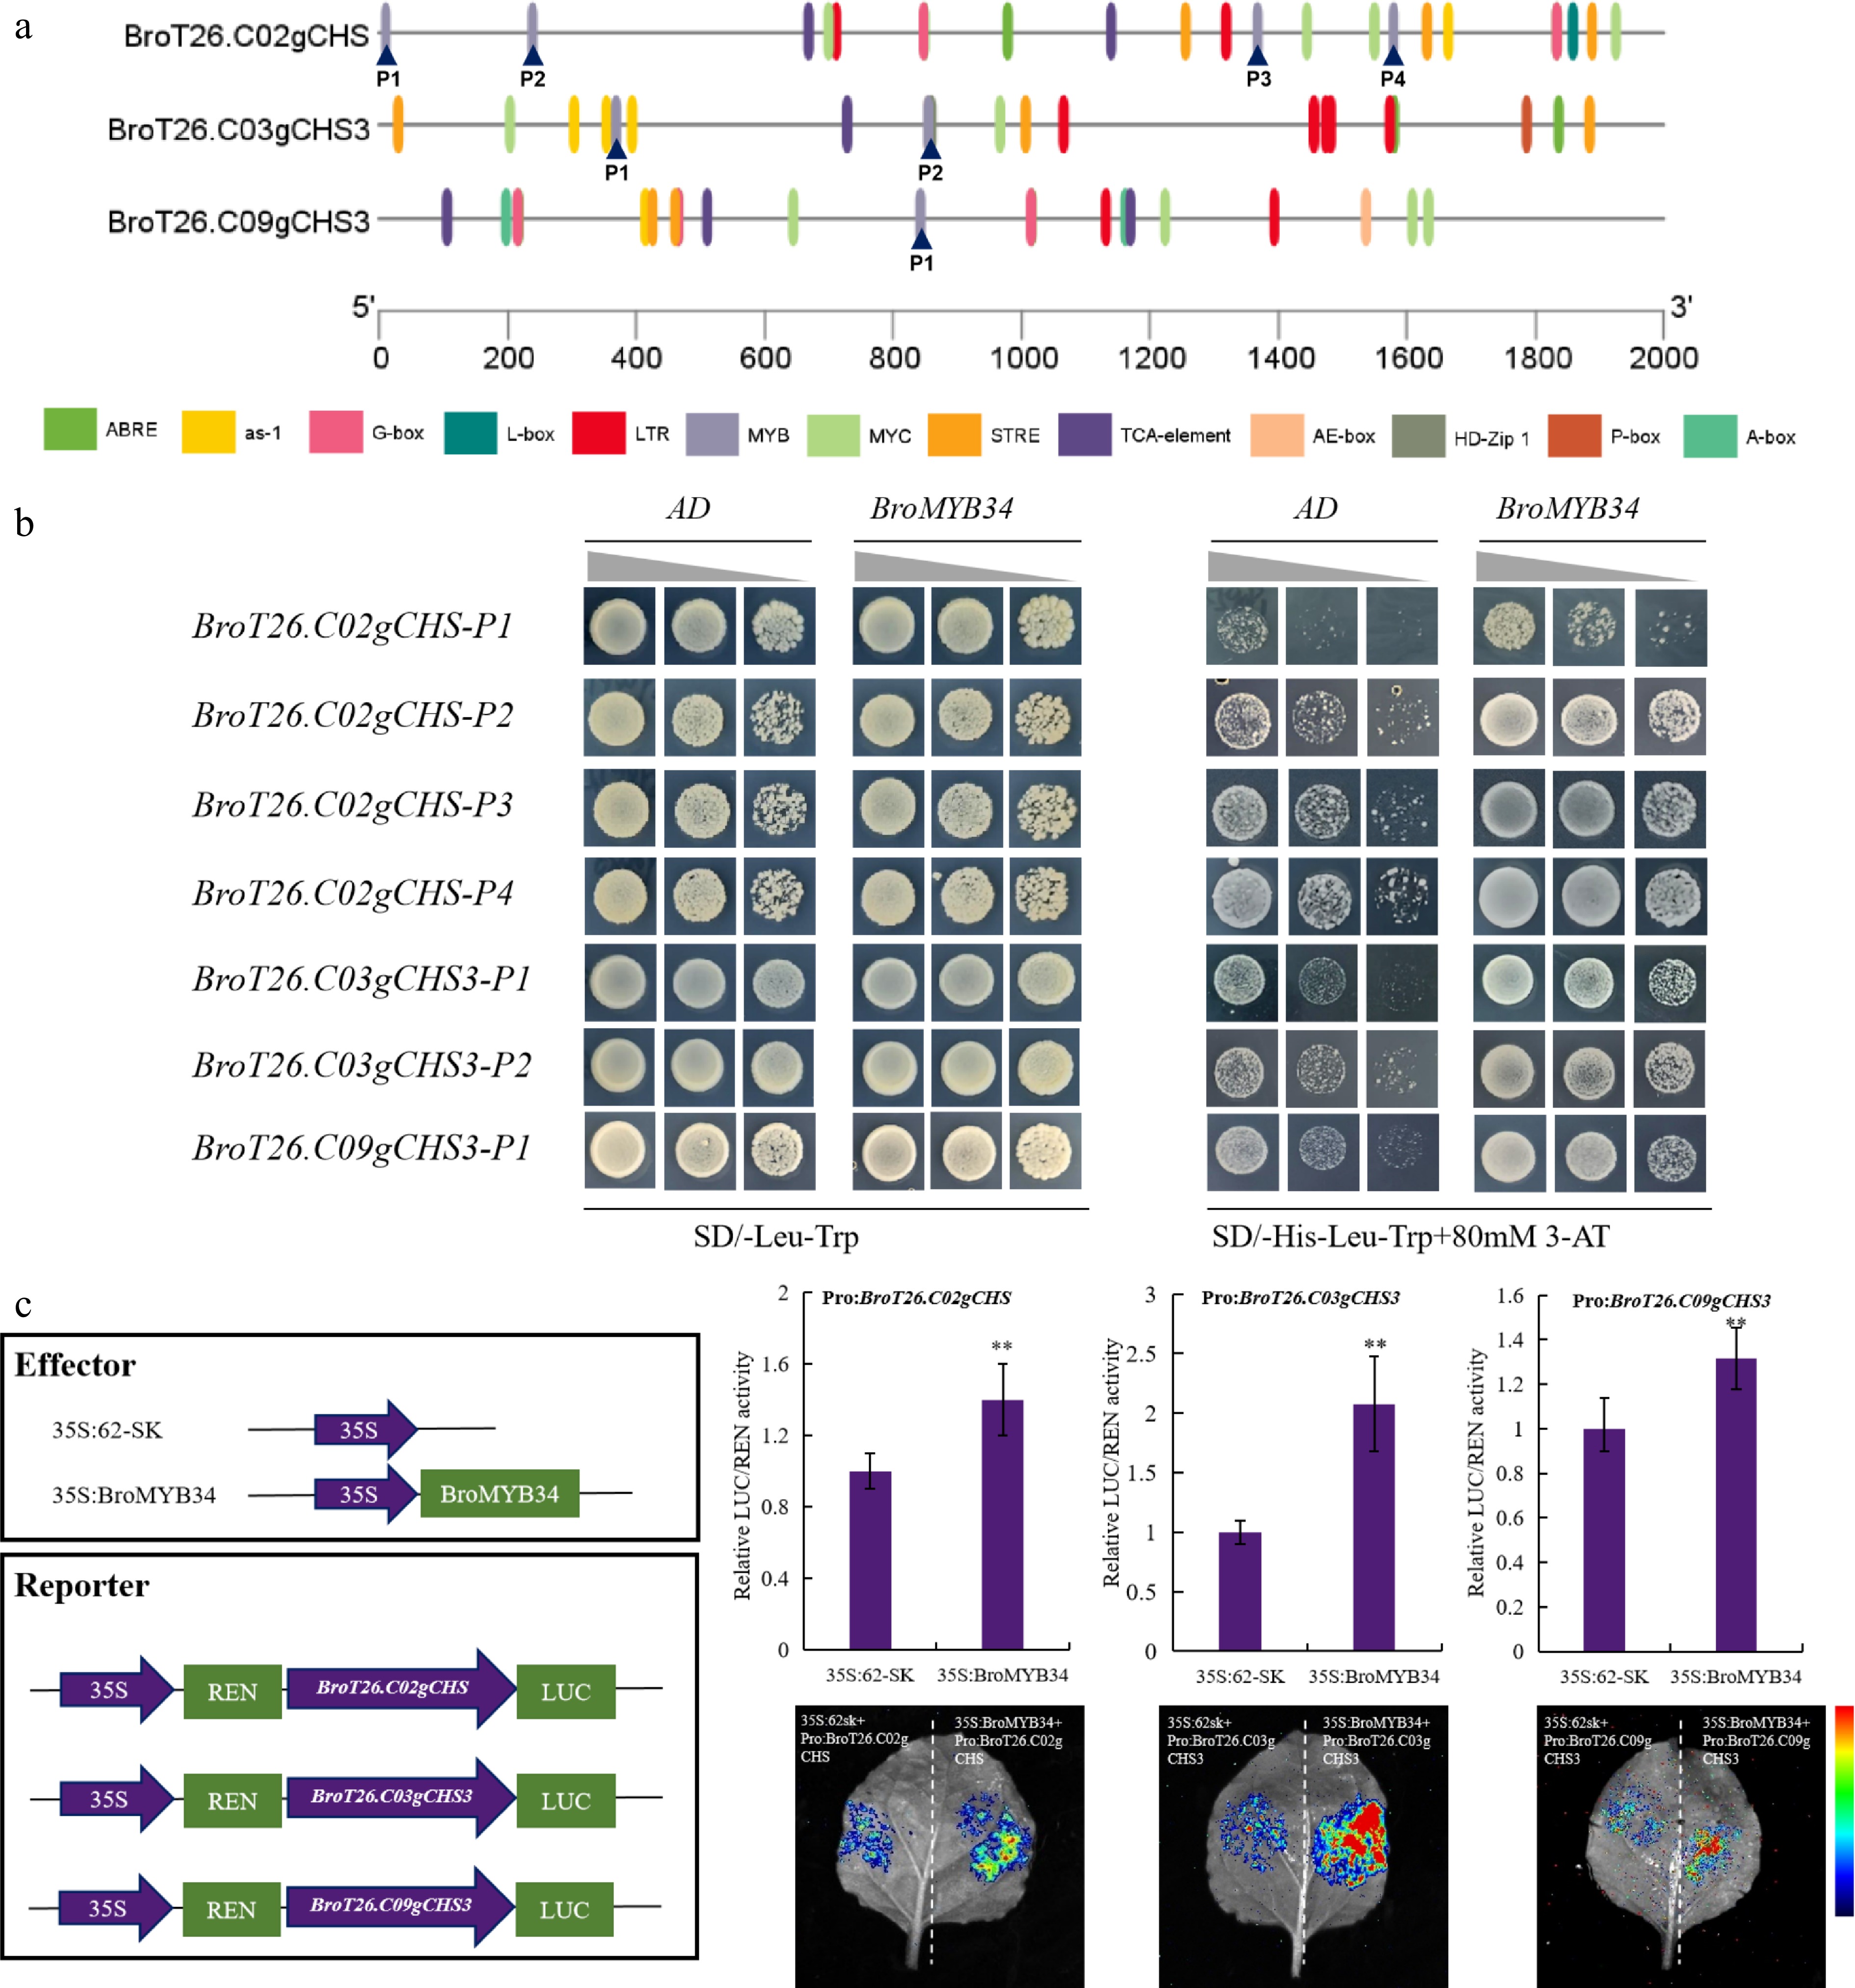
Figure 6.
BroMYB34 could bind with the promoter of BroCHSs to activate its expression. (a) The cis-elements analysis of BroCHSs promoters. The PlantCare was used for analysis, and TBtools was used for mapping. (b) The Y1H experiment is used to determine the binding between BroMYB34 and BroCHSs' promoters. (c) Dual luciferase reporter experiments demonstrated that BroMYB34 is the upstream activator of BroCHSs. The relative LUC/REN activity was performed using Student's t-test on triplicate measurements (mean ± SD), with significance levels denoted as follows: * p < 0.05; ** p < 0.01. An empty vector was used as the reference and set to 1.
-
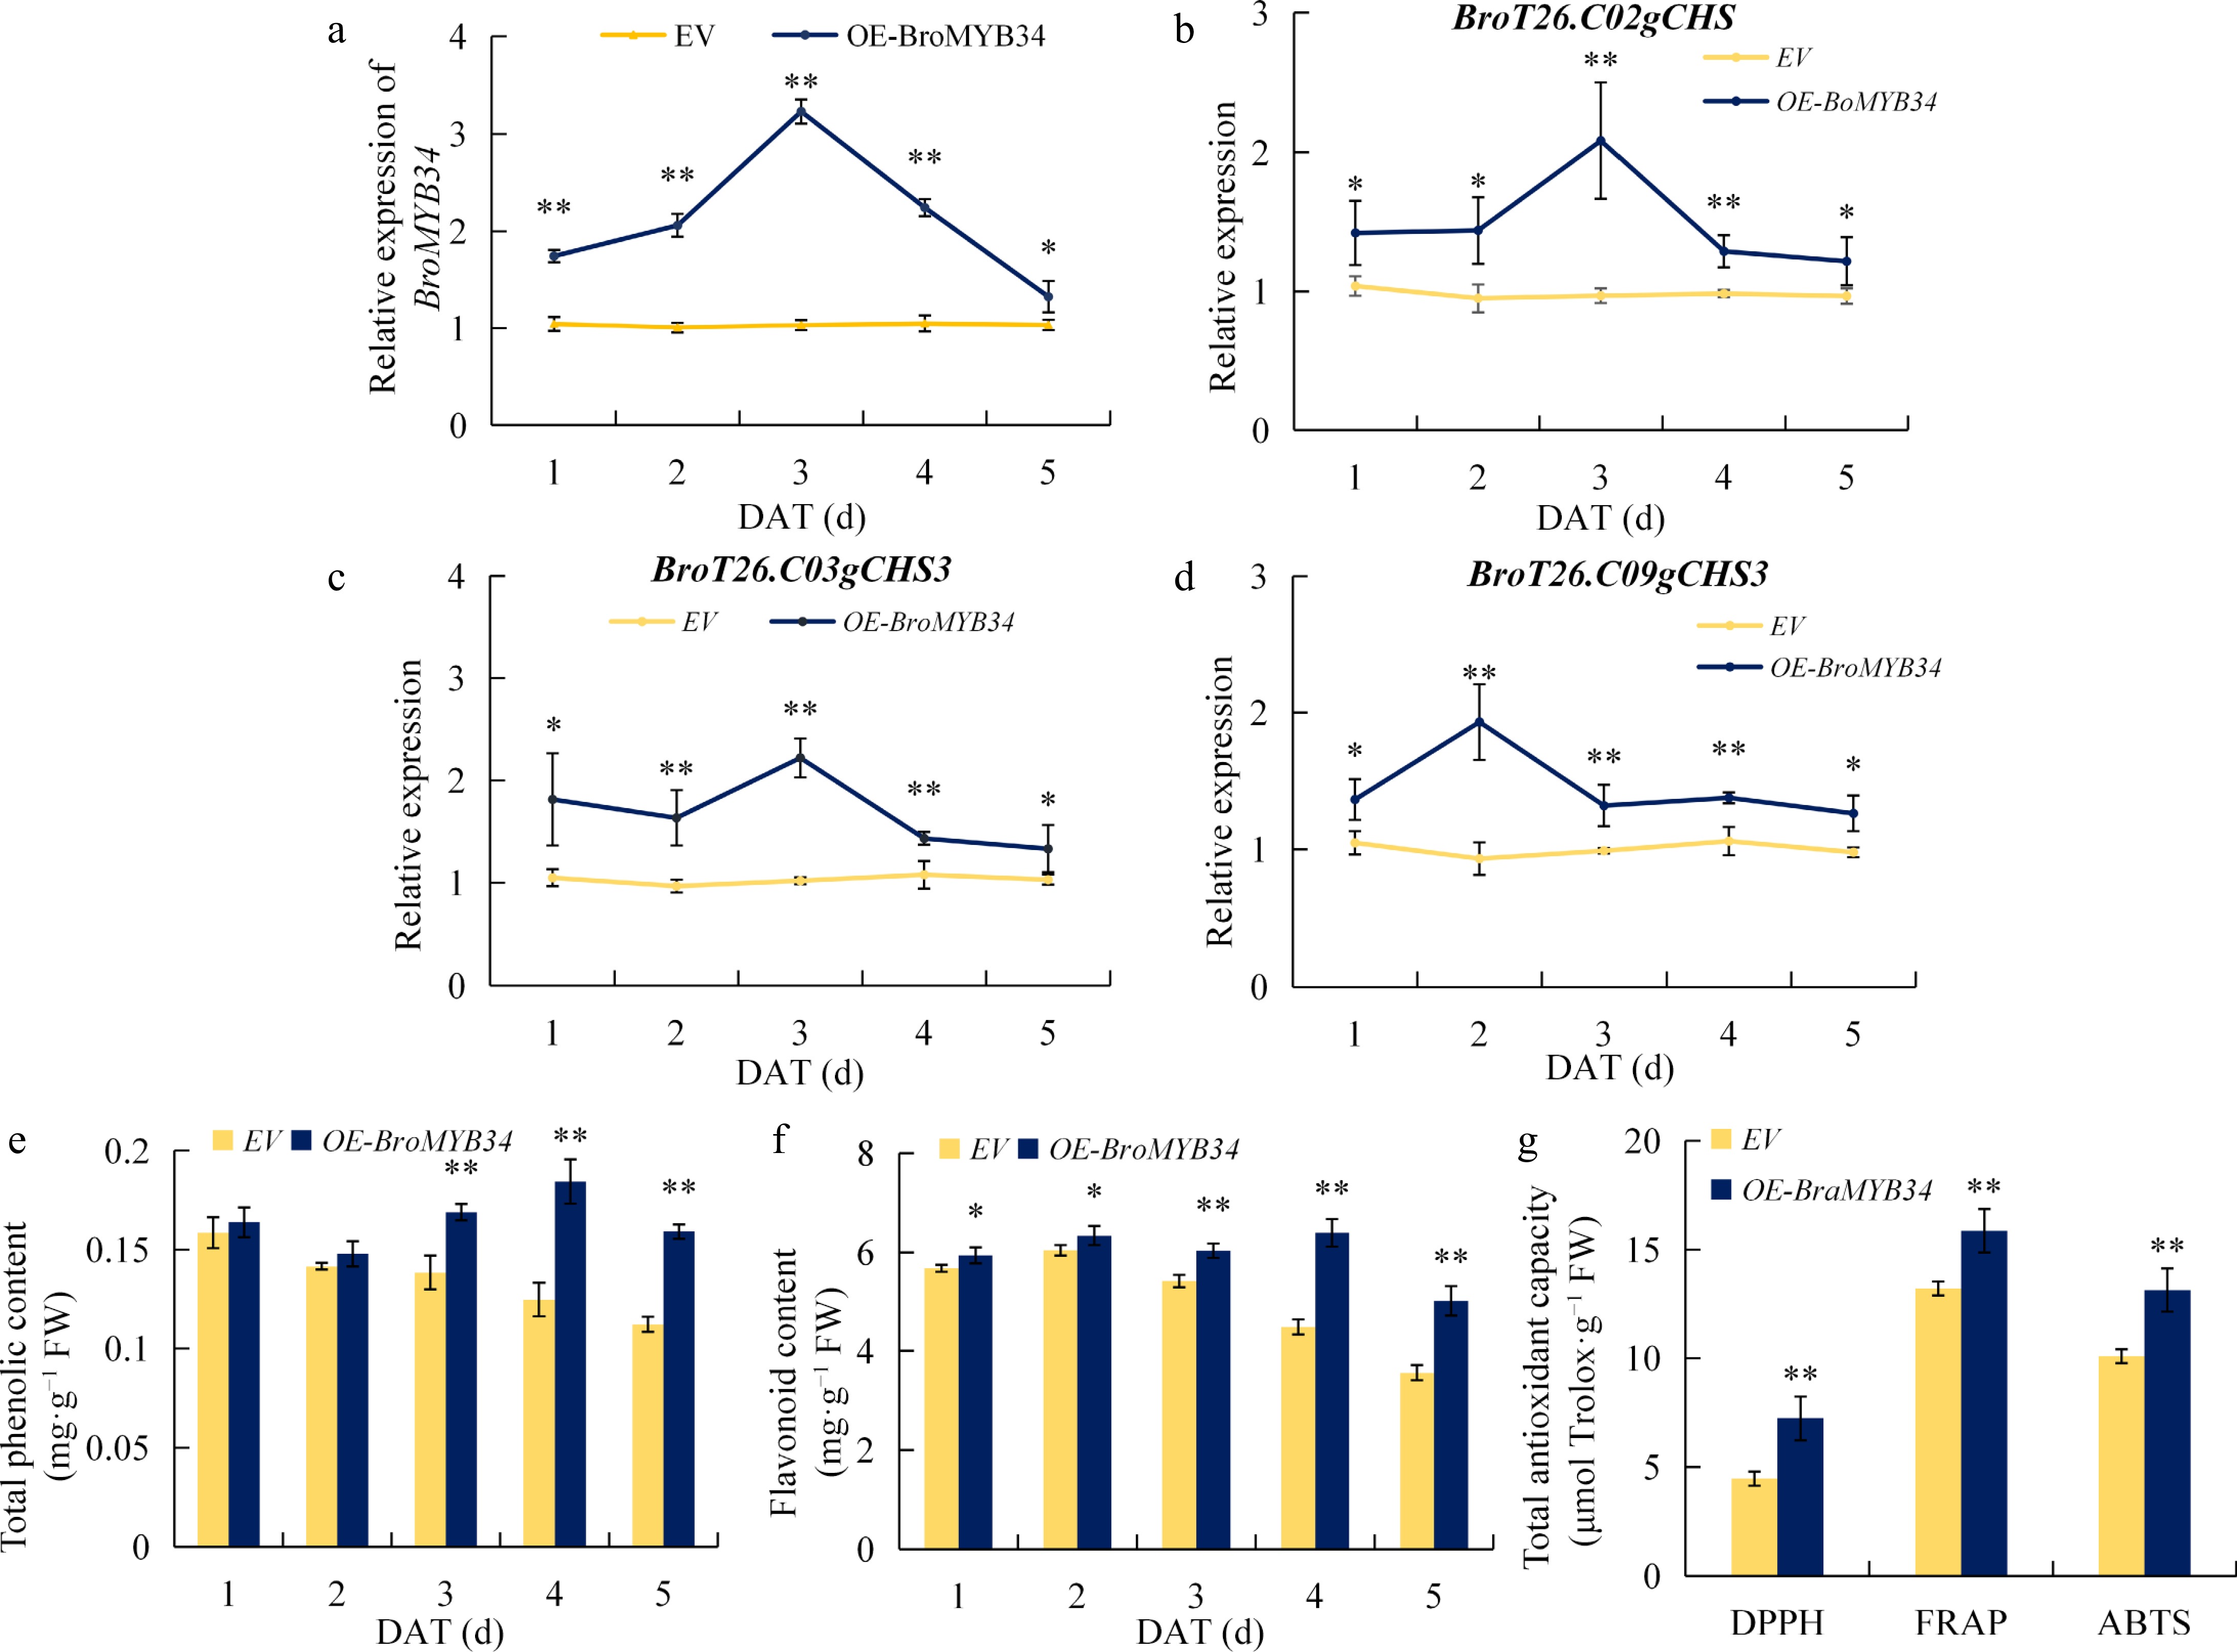
Figure 7.
Overexpression of BroMYB34 improves the flavonoid biosynthesis of kale. (a) BroMYB34 expression in EV and OE-BroMYB34 kales. (b)−(d) BroT26.C02gCHS, BroT26.C03gCHS3, and BroT26.C09gCHS3 expression in EV and OE-BroMYB34 kales. (e) Total phenolic contents in EV and OE-BroMYB34 kales. (f) Favonoid content in EV and OE-BroMYB34 kales. (g) Total antioxidant capacity in EV and OE-BroMYB34 kales. Empty vector (EV) and OE-BroMYB34 transient transgenic kales were sampled for 1−5 d. Statistical analysis was performed using Student's t-test on triplicate measurements (mean ± SD), with significance levels denoted as follows: * p < 0.05; ** p < 0.01. The DAT means day after treatment.
-
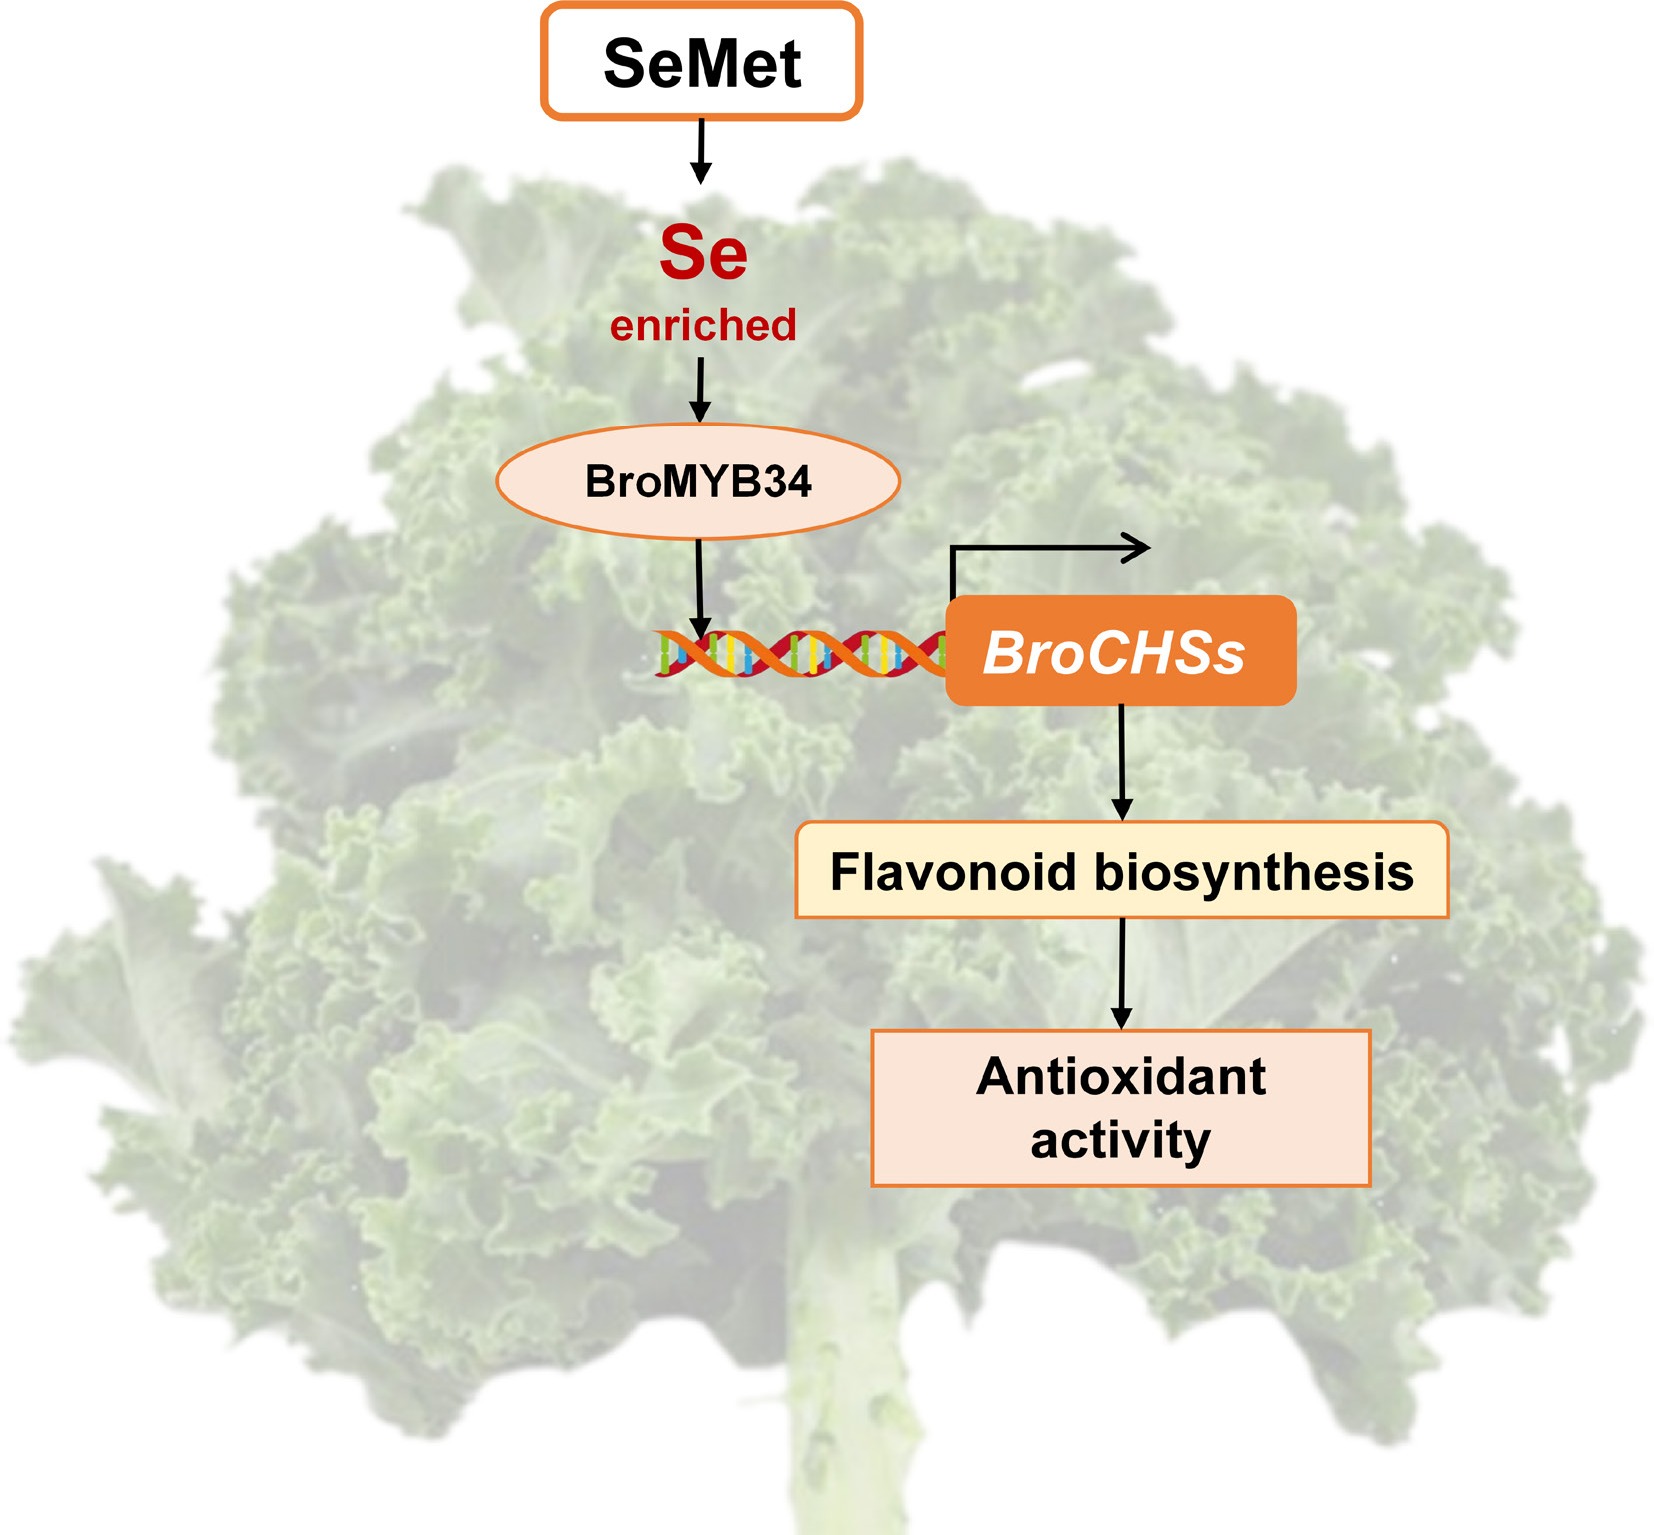
Figure 8.
Schematic diagram of the mechanism of exogenous SeMet regulating flavonoid accumulation to improve antioxidant activity in kale seedlings.
Figures
(8)
Tables
(0)