-
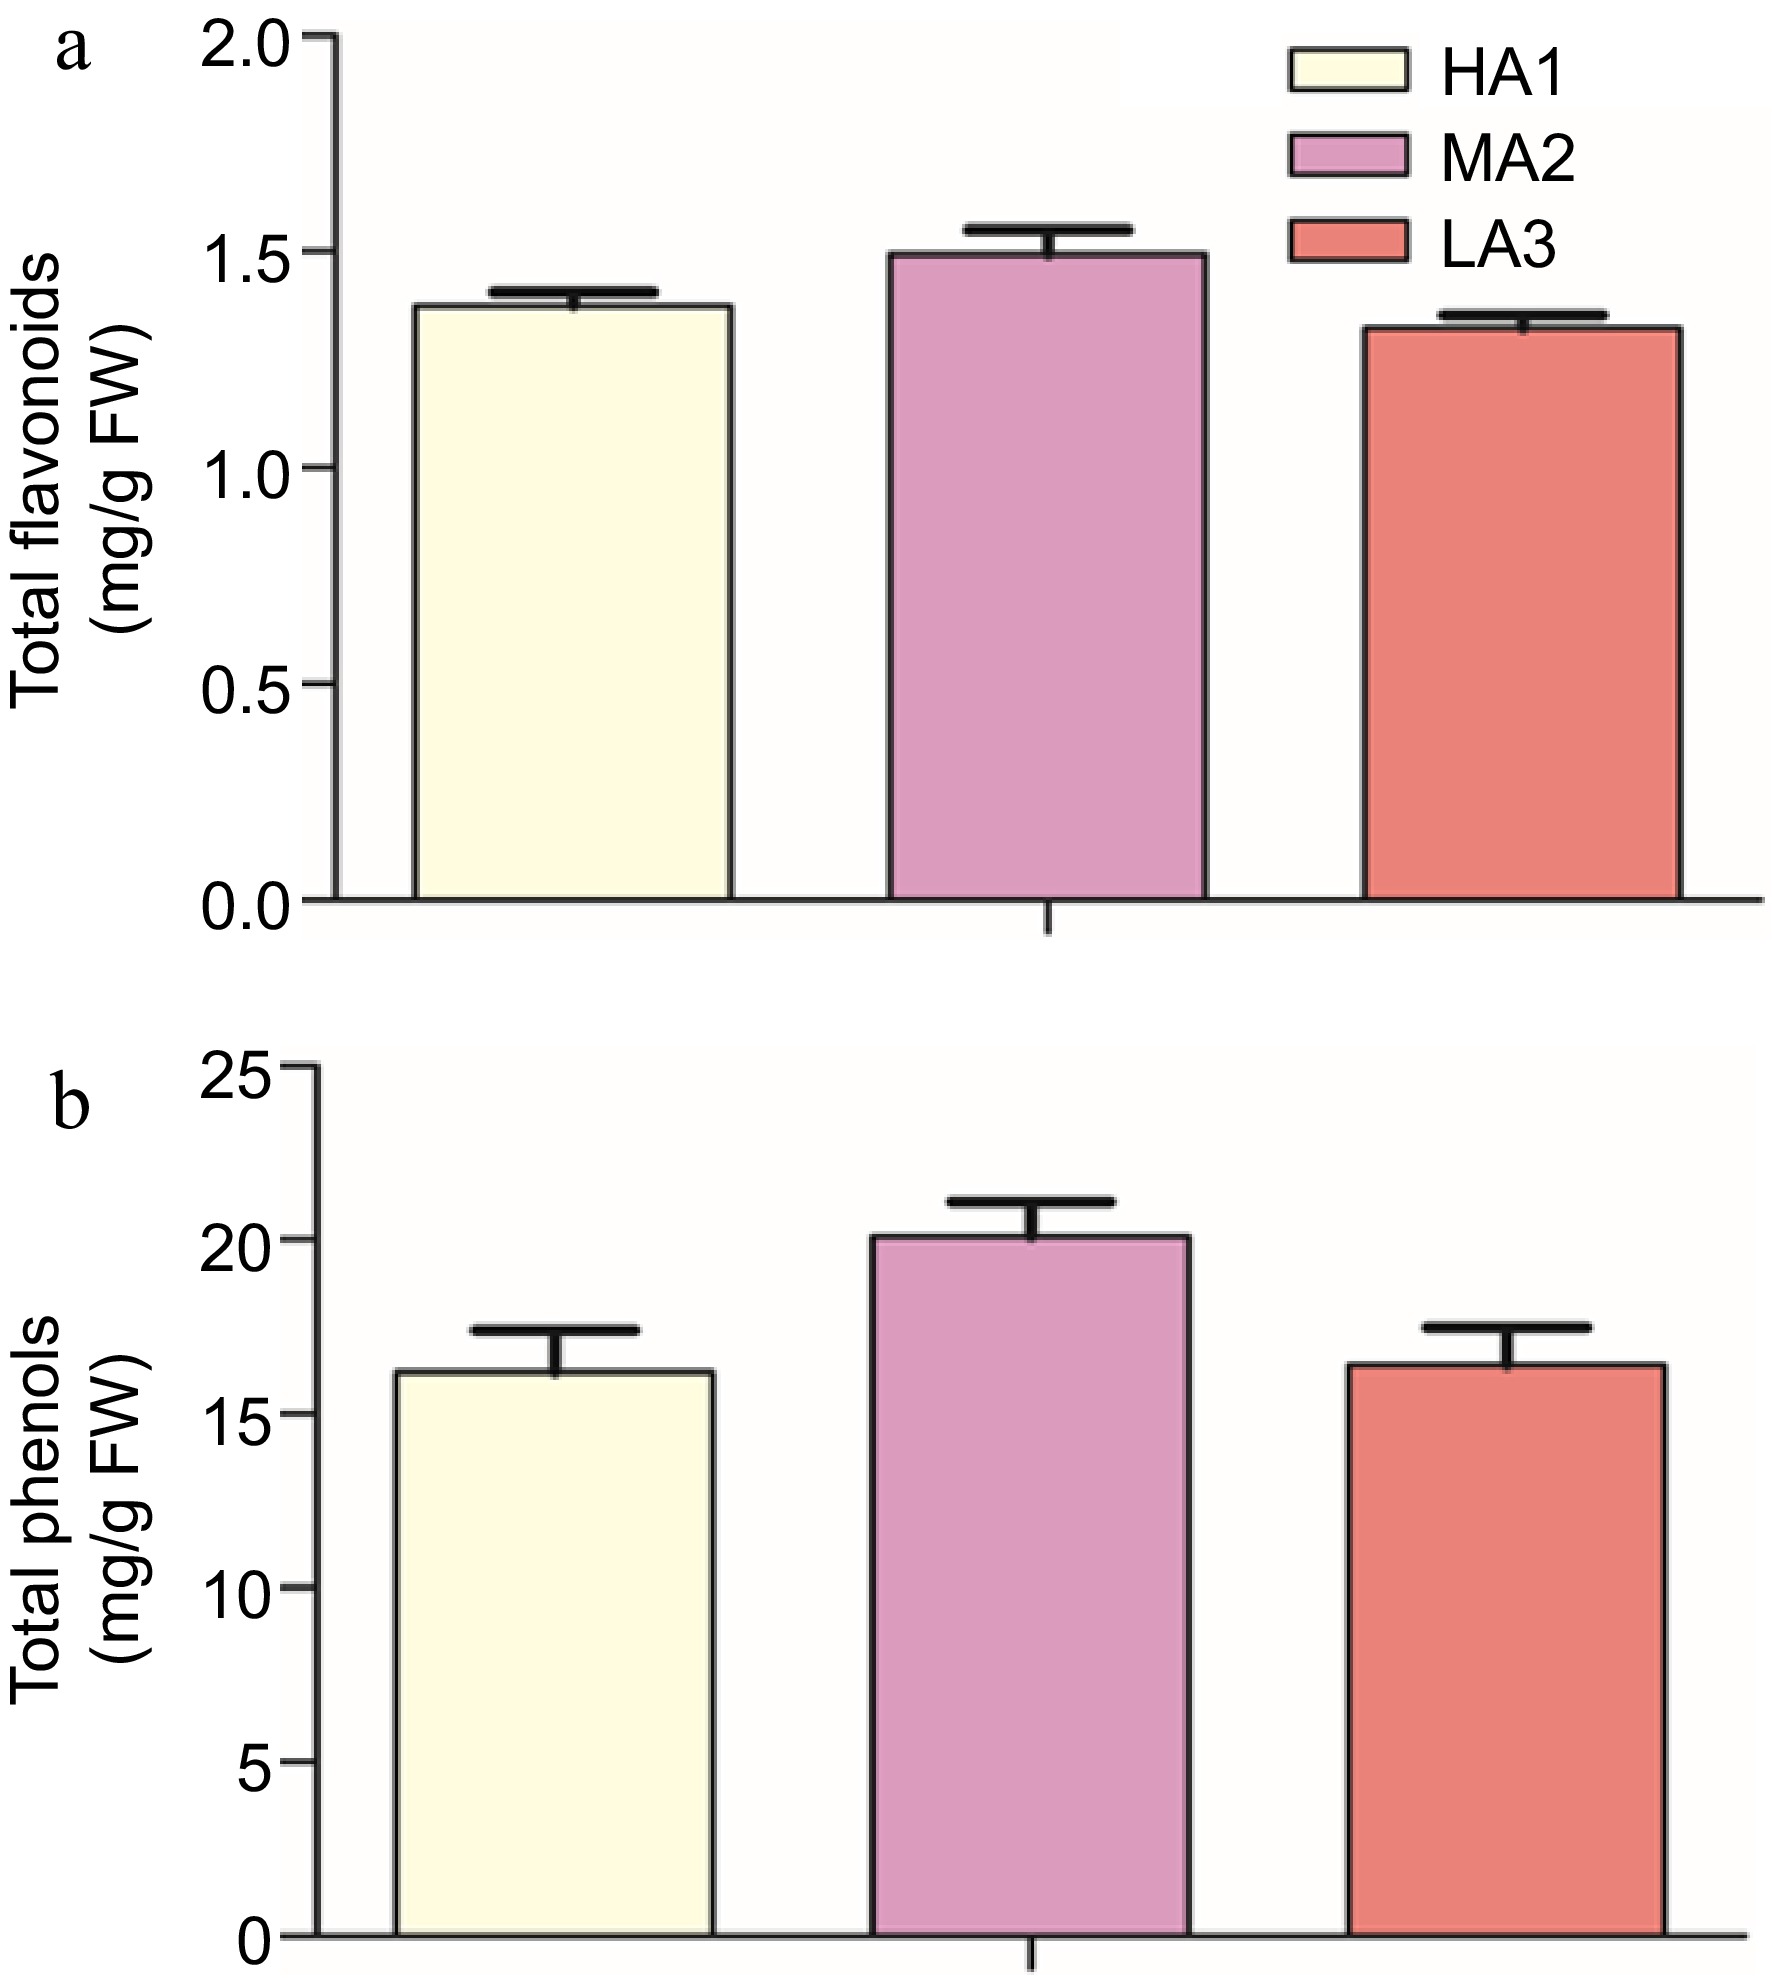
Figure 1.
Biochemical analysis of green coffee beans (a) Total flavonoid contents (TFC) at HA1, MA2, and LA3 altitudes. (b) Total phenol contents (TPC) at HA1, MA2 and LA3 altitudes. HA1 stands for HA1-1600 high altitude, MA2 stands for MA2-1400 medium altitude, LA3 stands for LA3-1200 low altitude.
-
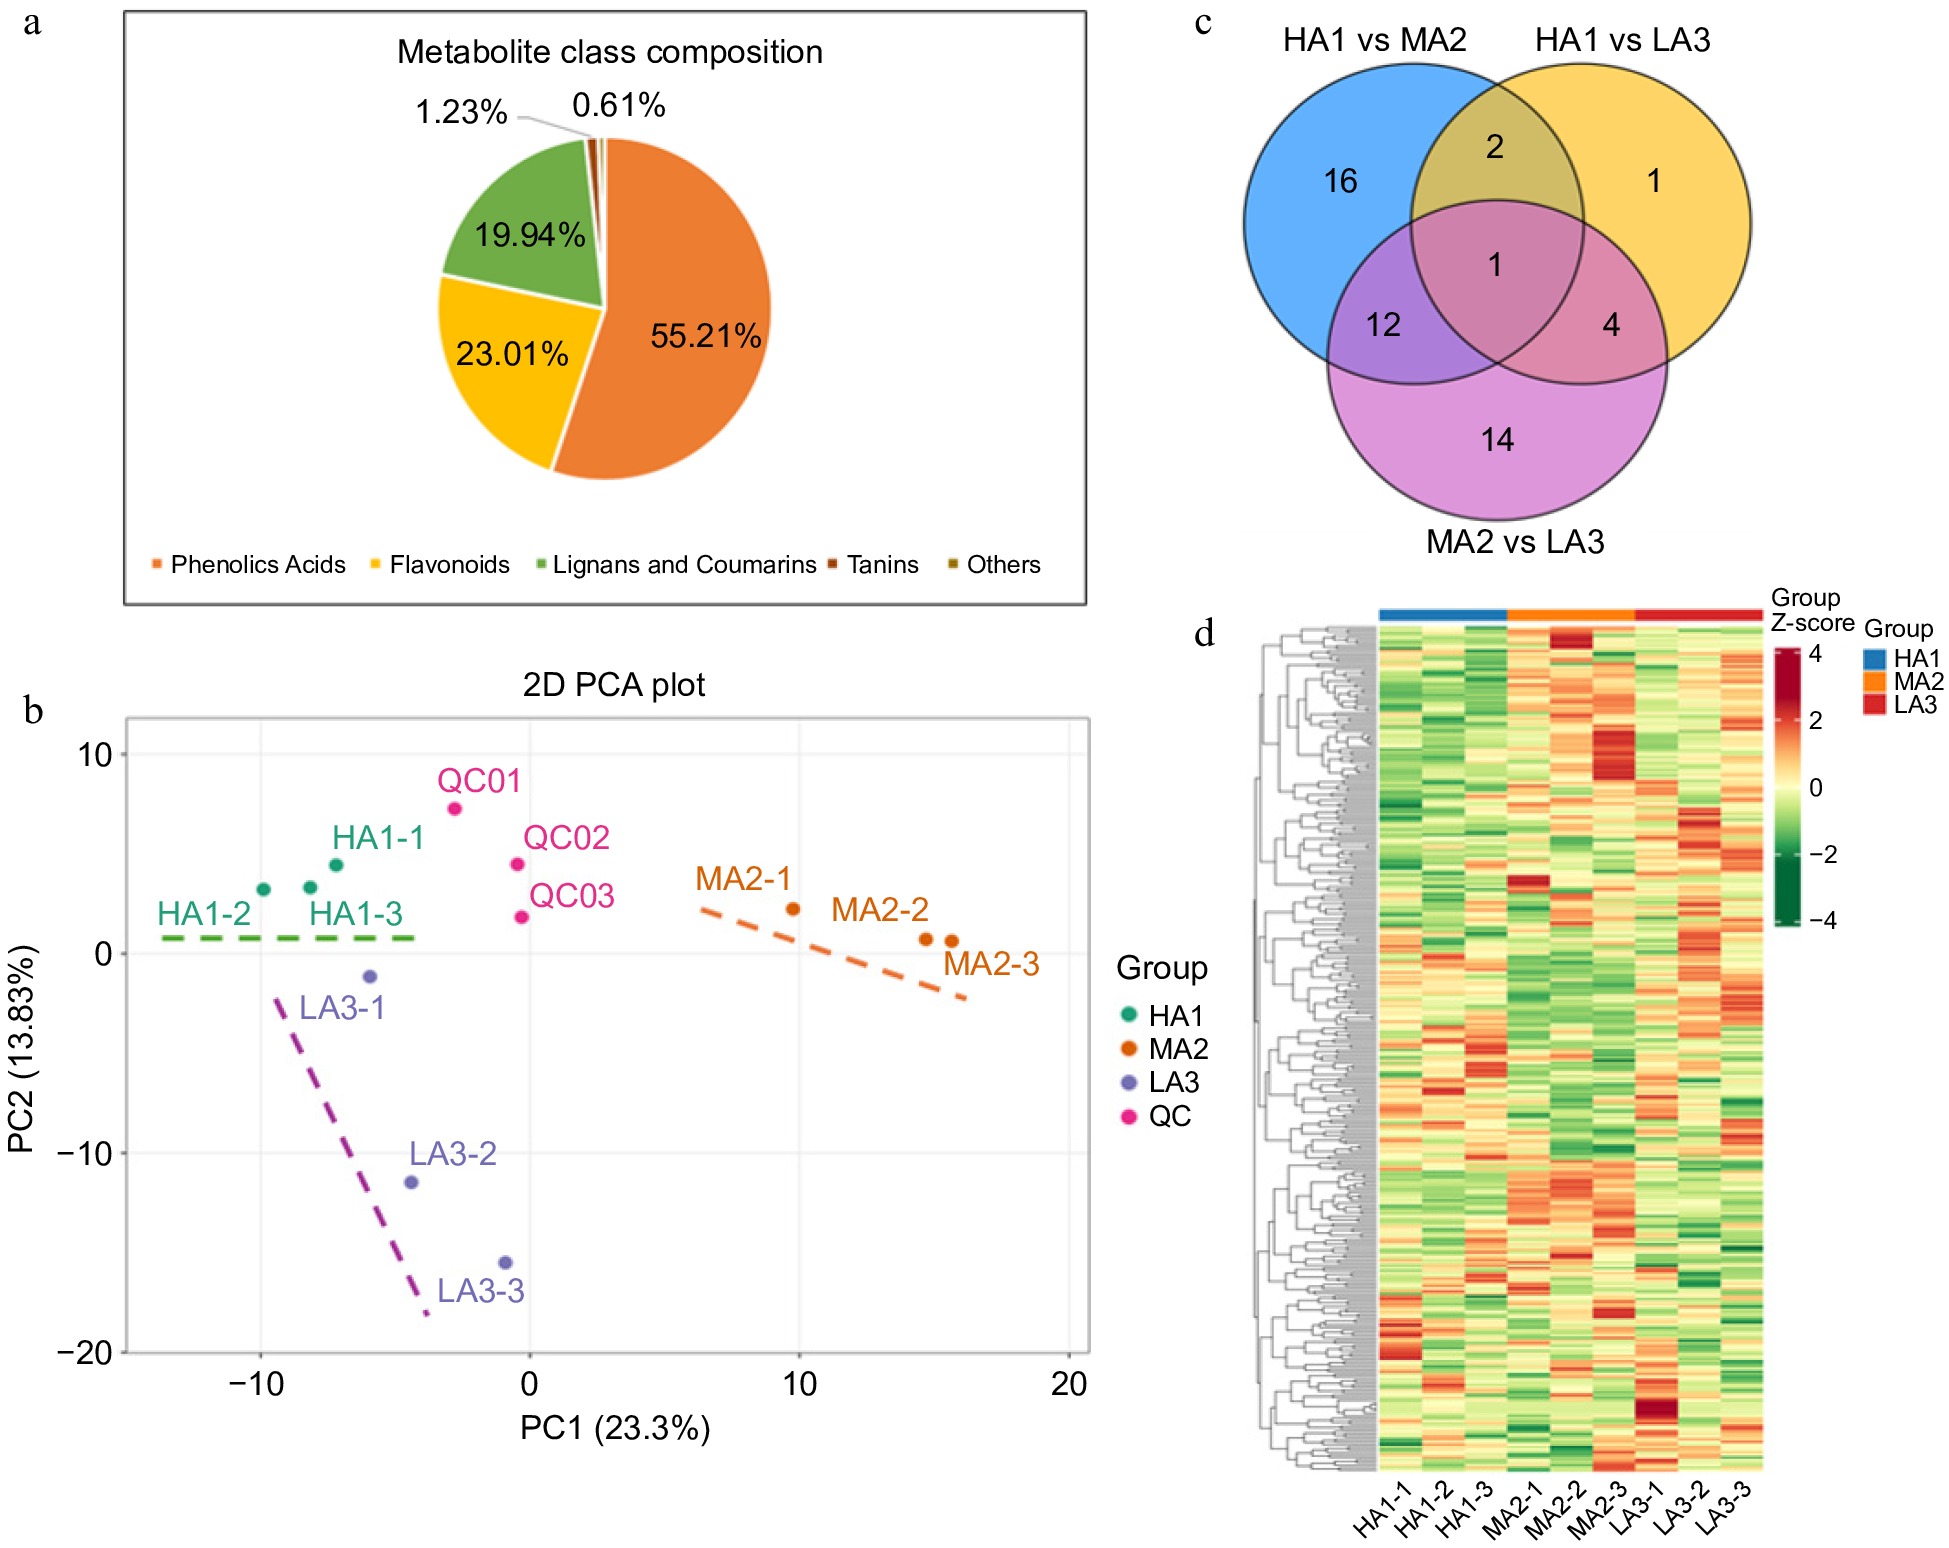
Figure 2.
Polyphenols metabolites of green coffee beans. (a) The classification of metabolites. (b) Venn diagram of detected metabolites. (c) PCA of metabolites. (d) Heat map of differential expression of metabolites. HA1 stands for HA1-1600 high altitude, MA2 stands for MA2-1400 medium altitude, LA3 stands for LA3-1200 low altitude.
-
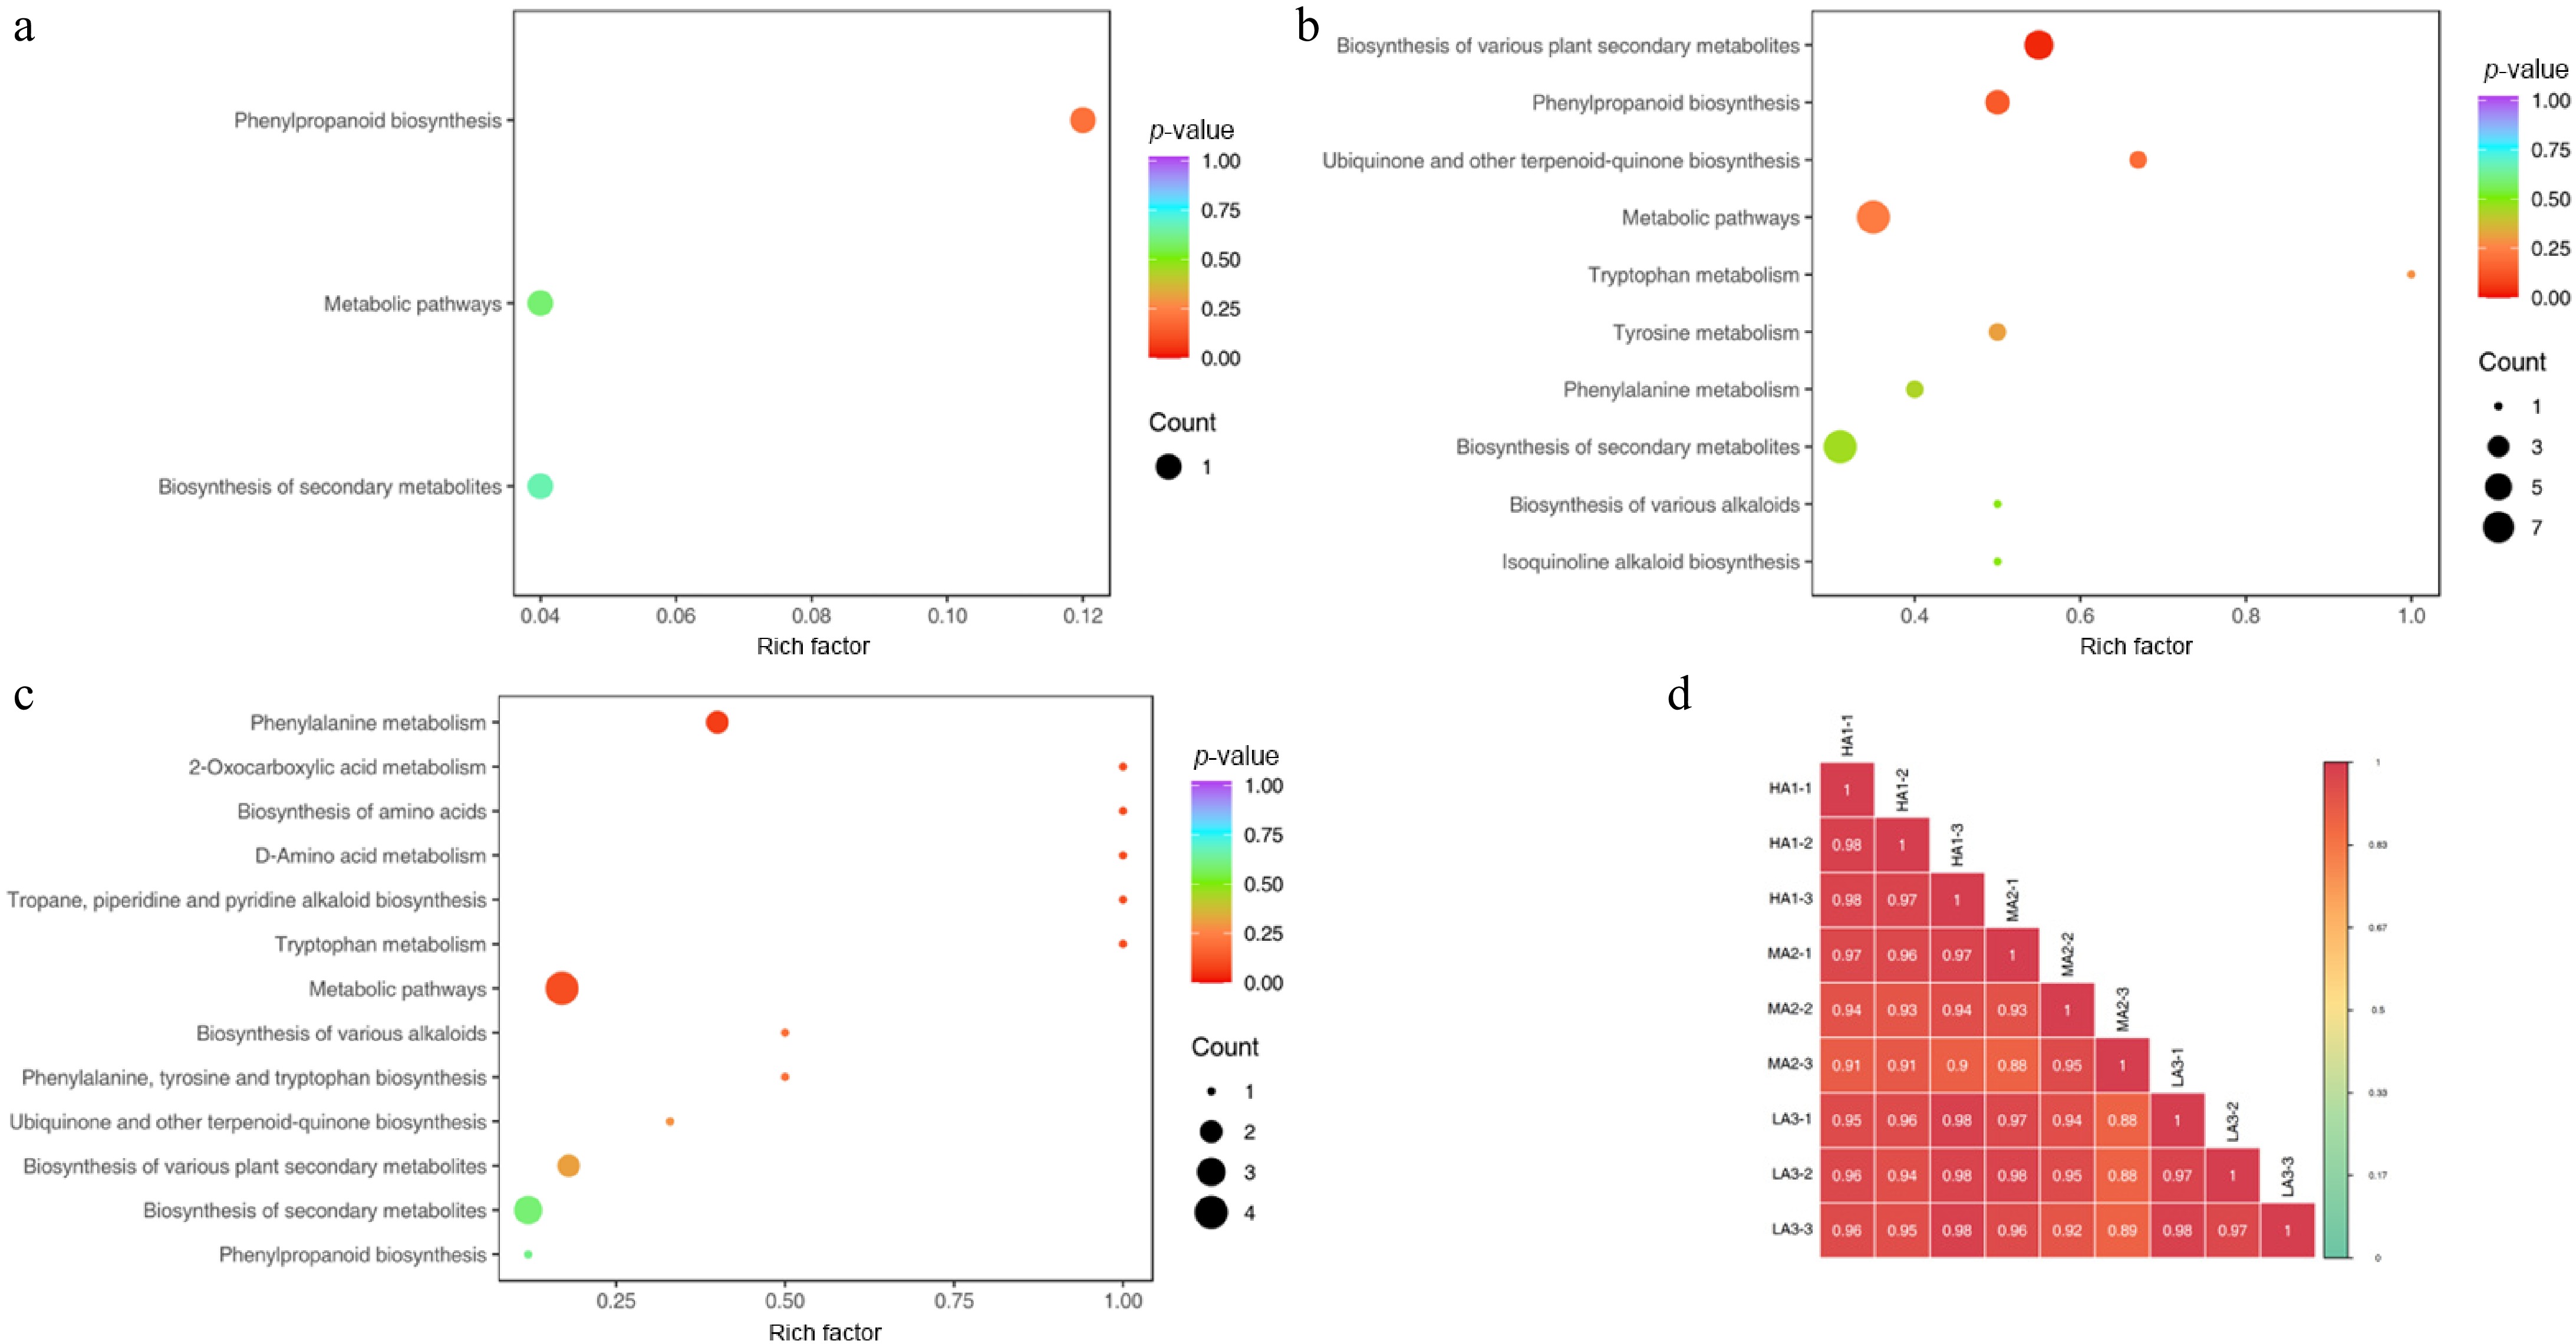
Figure 3.
The top 20 metabolic pathways were enriched. (a) Enrichment of metabolic pathways between HA1 vs LA3. (b) Enrichment of metabolic pathways between HA1 vs MA2. (c) Enrichment of metabolic pathways between MA2 vs LA3. (d) Correlative relationship between samples and within group samples. HA1 stands for HA1-1600 high altitude, MA2 stands for MA2-1400 medium altitude, LA3 stands for LA3-1200 low altitude. A color-coded scale grading from purple to red corresponds to the content of metabolite shifting from high to low.
-
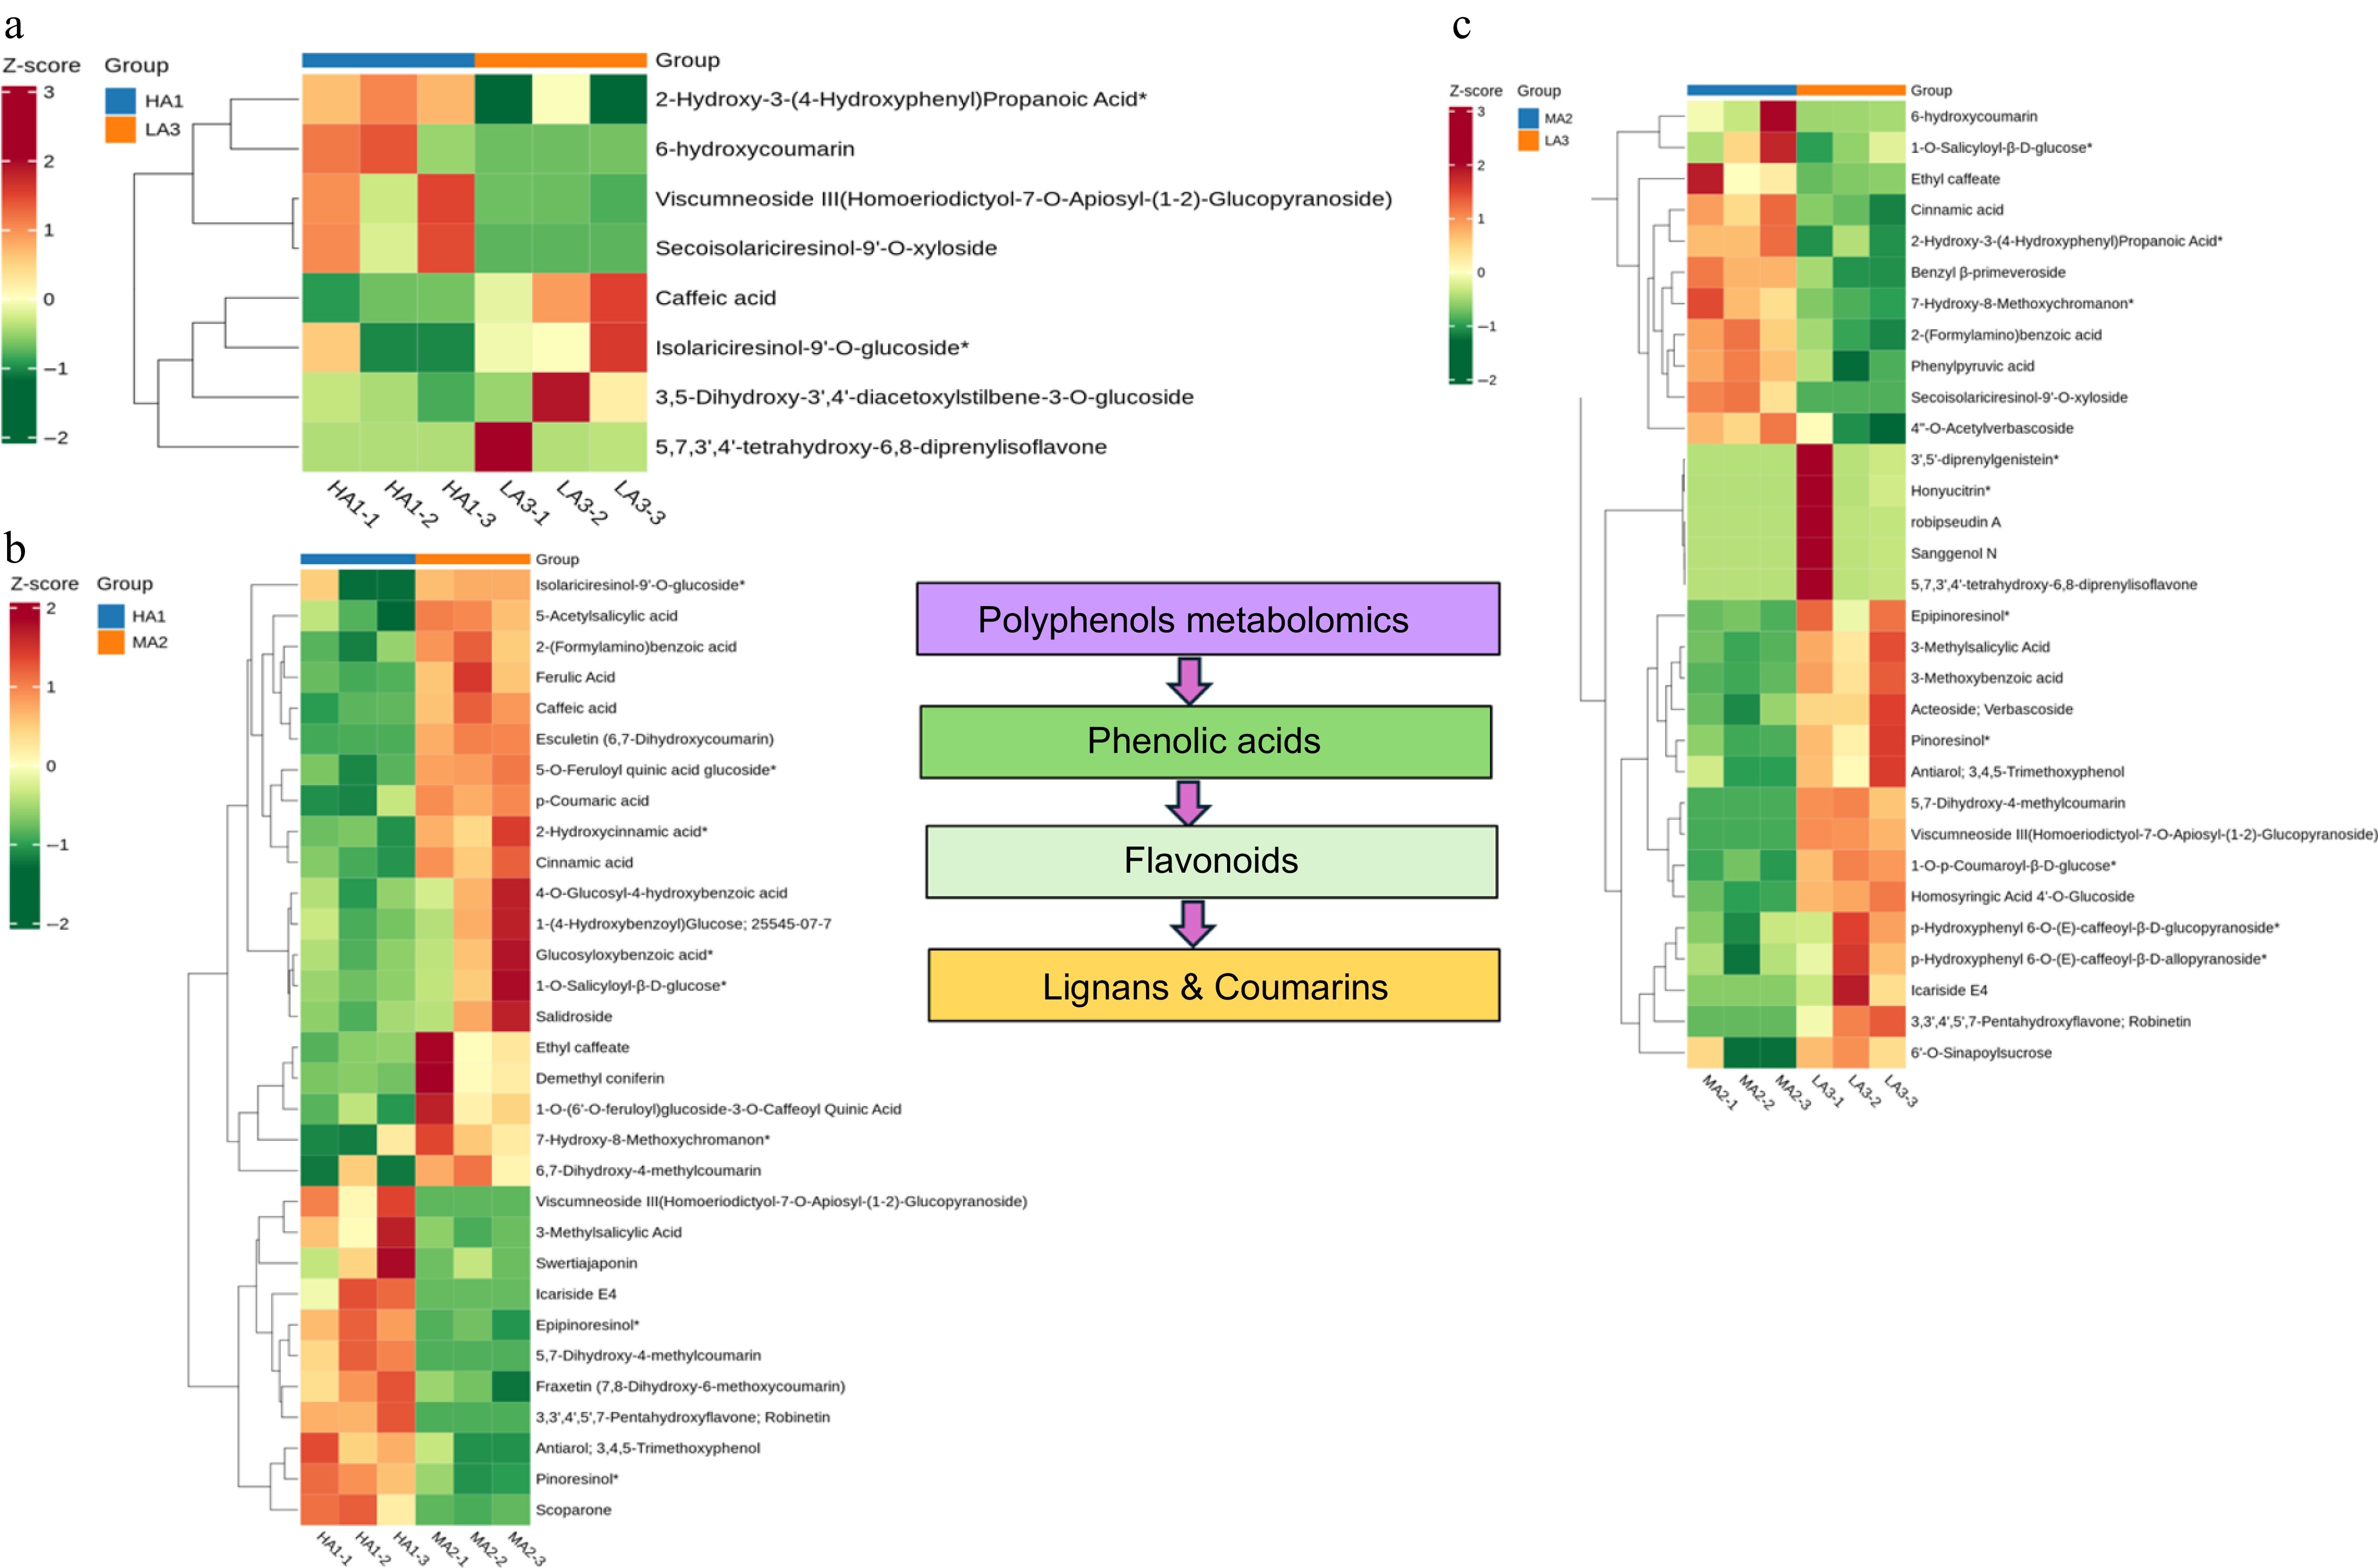
Figure 4.
Polyphenols metabolomics and its classes of green coffee beans. (a) The differential expression classification of metabolites regulated at HAI vs LA3. (b) The differential expression classification of metabolites regulated at HAI vs MA2. (c) The differential expression classification of metabolites regulated at MA2 vs LA3. HA1 stands for HA1-1600 high altitude, MA2 stands for MA2-1400 medium altitude, LA3 stands for LA3-1200 low altitude. A color-coded scale grading from dark maroon to dark green corresponds to the content of metabolite shifting from high to low.
-
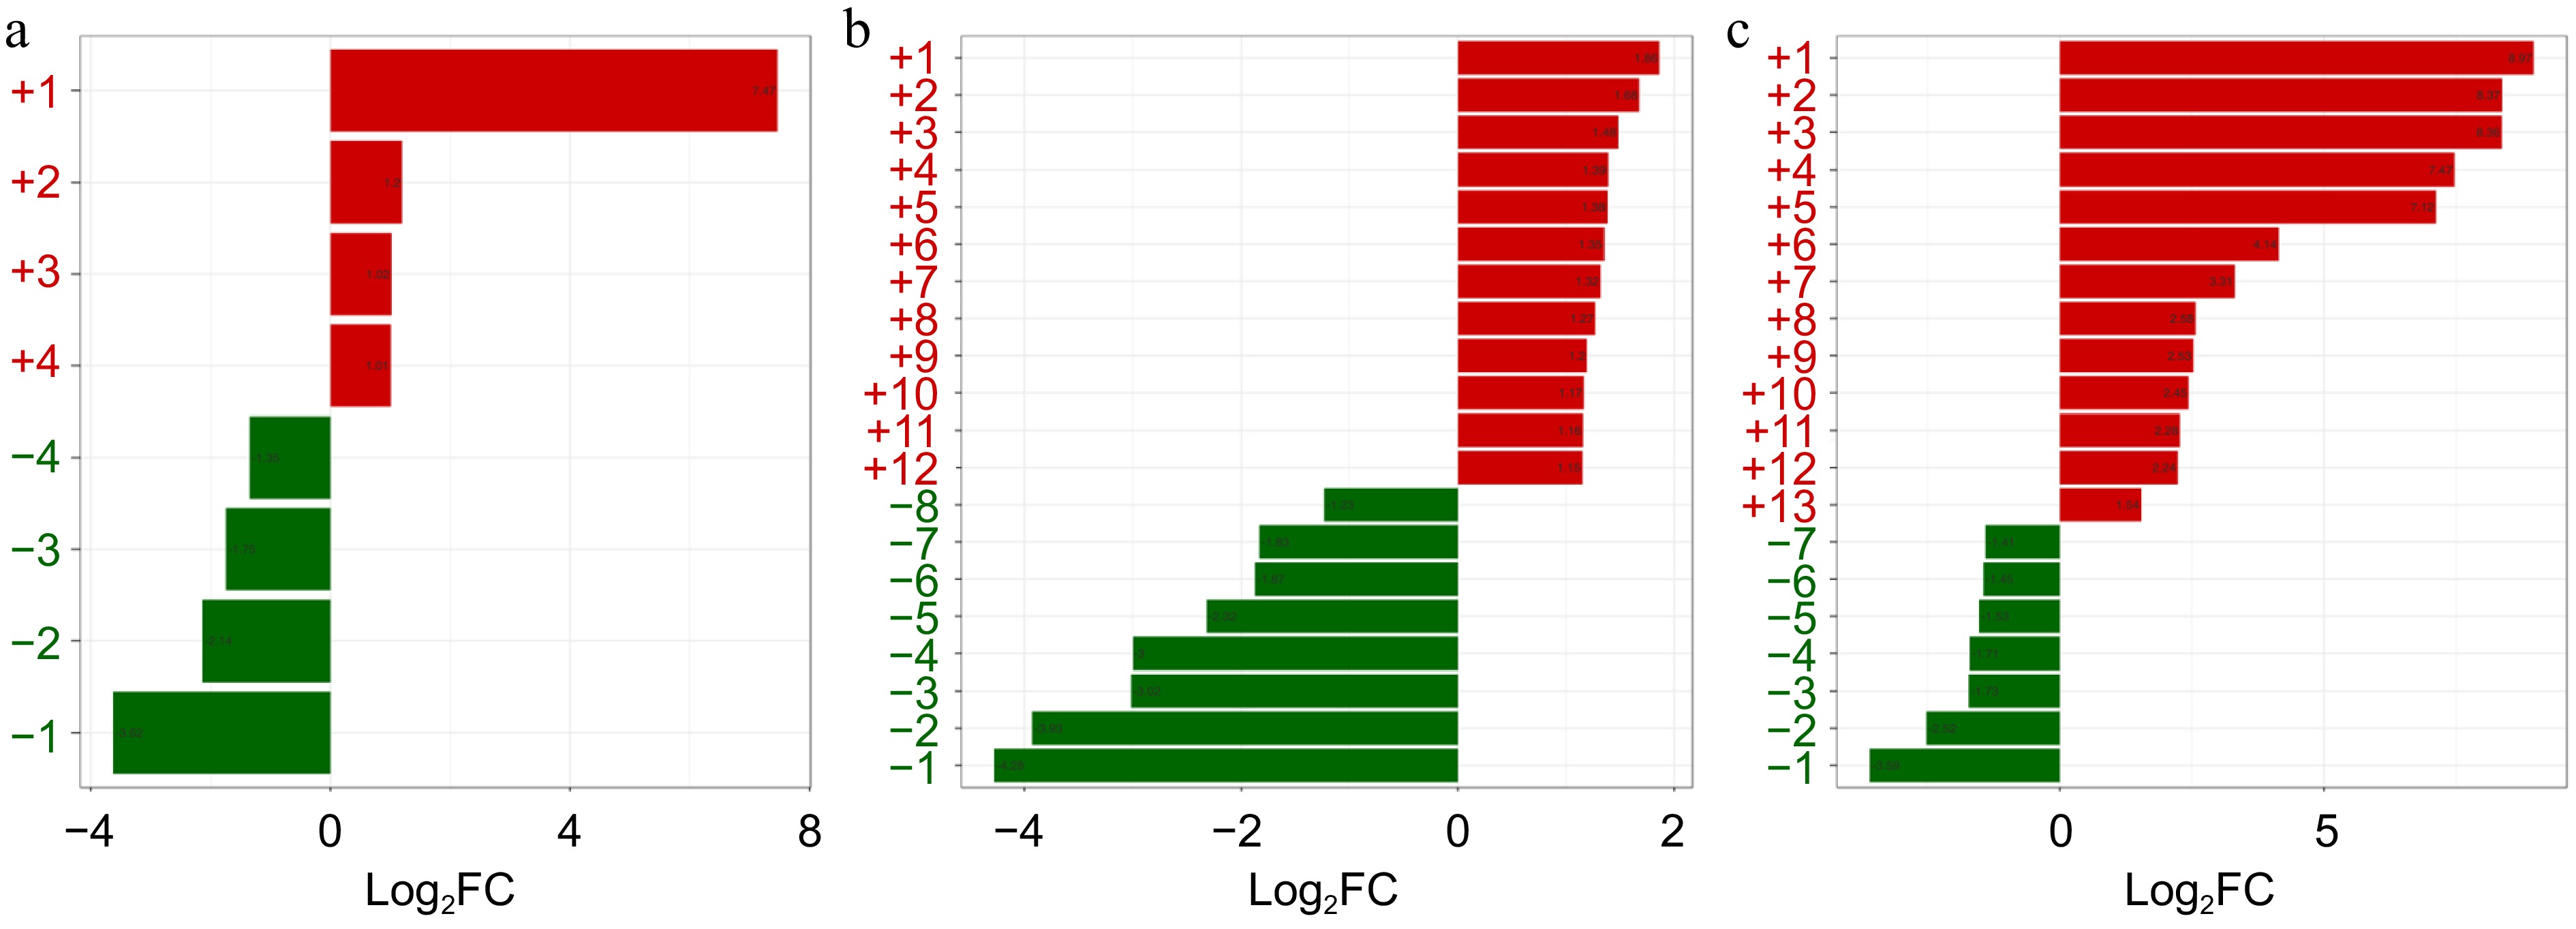
Figure 5.
Differential polyphenol compounds in green coffee beans across three altitude groups (HA1, MA2, LA3). (a) Eight metabolites regulated between HA1 vs. LA3 (from top to bottom: 5,7,3',4'-tetrahydroxy-6,8-diprenylisoflavone, isolariciresinol-9'-O-glucoside, 3,5-dihydroxy-3',4'-diacetoxylstilbene-3-O-glucoside, caffeic acid, viscumneoside III, 2-hydroxy-3-(4-hydroxyphenyl) propanoic acid, 6-hydroxycoumarin, secoisolariciresinol-9'-O-xyloside). (b) Twenty metabolites regulated between HA1 vs. MA2 (from top to bottom: ethyl caffeate, cinnamic acid, 2-(formylamino) benzoic acid, isolariciresinol-9'-O-glucoside, caffeic acid, 5-O-feruloyl quinic acid glucoside, ferulic acid, 6,7-dihydroxy-4-methylcoumarin, 1-(4-hydroxybenzoyl) glucose, p-coumaric acid, 2-hydroxycinnamic acid, 1-O-salicyloyl-β-D-glucose, swertiajaponin, pinoresinol, epipinoresinol, antiarol, robinetin, 5,7-dihydroxy-4-methylcoumarin, viscumneoside III, icariside E4). (c) Twenty metabolites regulated between MA2 vs. LA3 (from top to bottom: robipseudin A, honyucitrin, 3',5'-diprenylgenistein, 5,7,3',4'-tetrahydroxy-6,8-diprenylisoflavone, sanggenol N, icariside E4, robinetin, viscumneoside III, 5,7-dihydroxy-4-methylcoumarin, epipinoresinol, pinoresinol, antiarol, 6'-O-sinapoylsucrose, benzyl β-primeveroside, 6-hydroxycoumarin, 7-hydroxy-8-methoxychromanon, 2-(formylamino)benzoic acid, ethyl caffeate, 2-hydroxy-3-(4-hydroxyphenyl) propanoic acid, secoisolariciresinol-9'-O-xyloside). The score scale grading from red to green corresponds to fold change in the content of metabolite shifting from high to low.
-
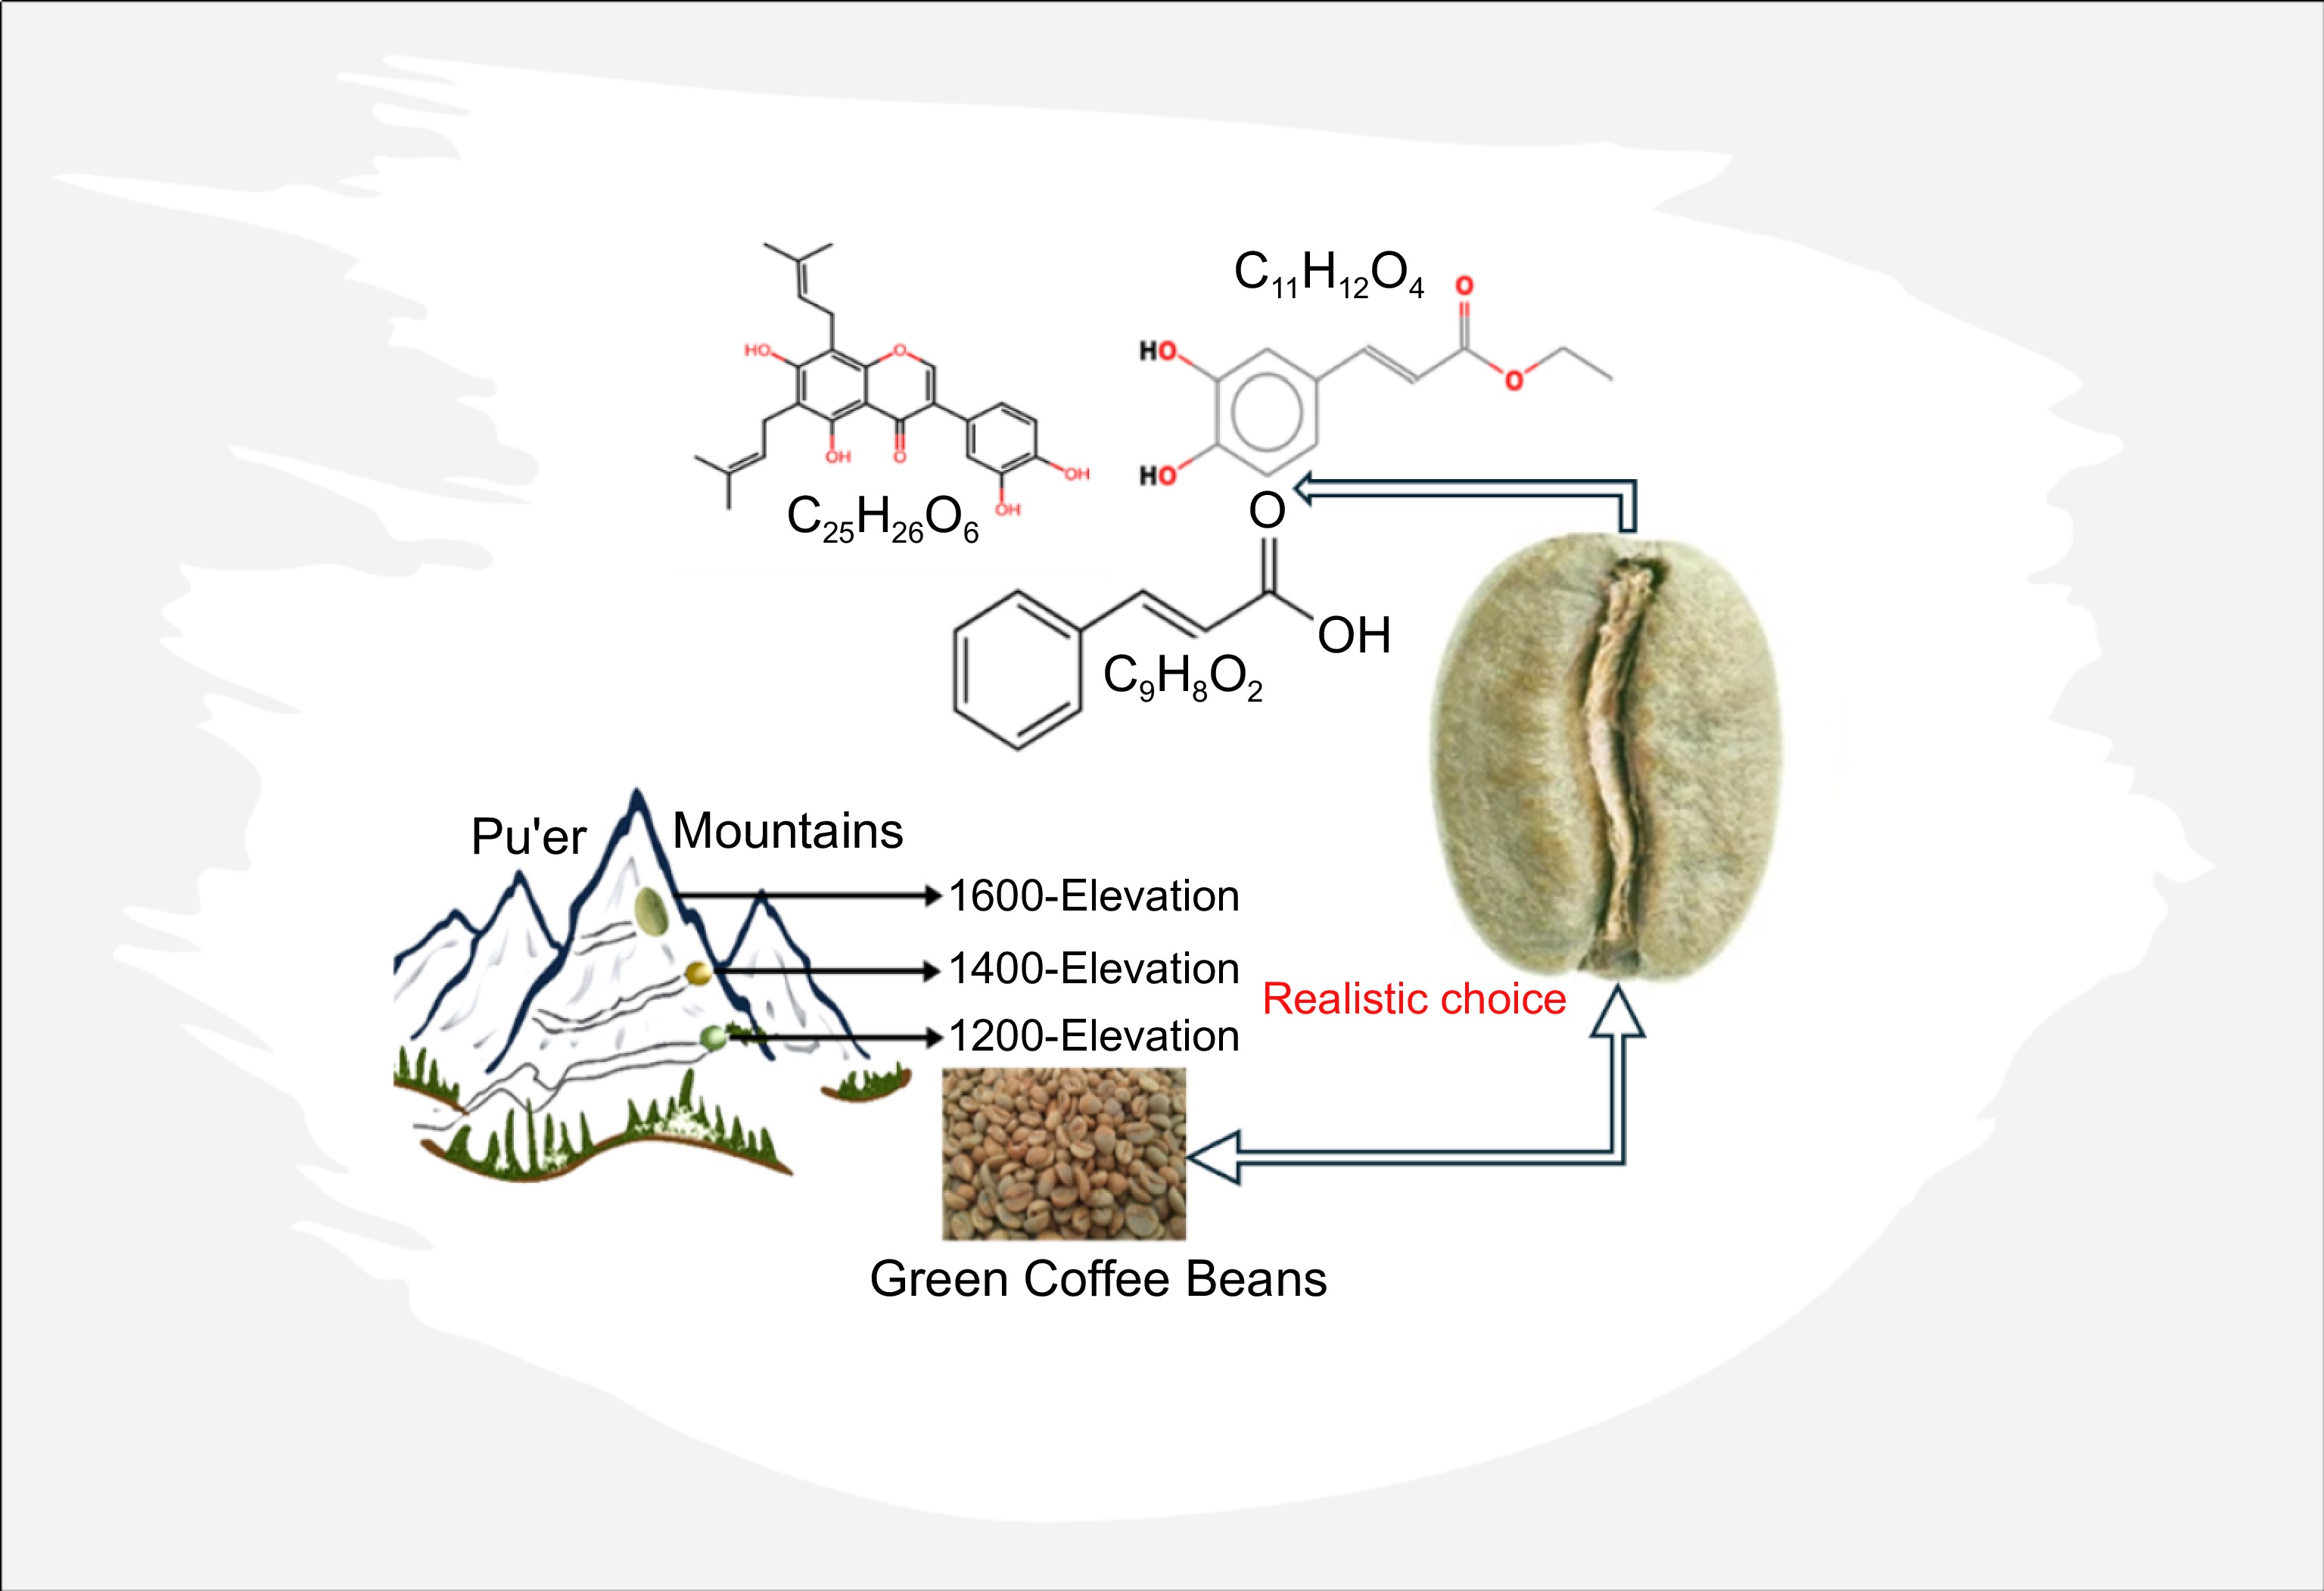
Figure 6.
Demonstration of critical compounds in green coffee bean regulated at: high-1600, medium-1400 and low-1200 elevations, respectively).
-
Treatment group Significant Up regulated Down regulated HA1 vs LA3 8 4 4 HA1 vs MA2 31 11 20 MA2 vs LA3 31 11 20 HA1 indicates 1,600 m - High altitude, MA2 indicates 1,400 m - Medium altitude, and LA3 indicates 1,200 m - Low altitude, respectively. Table 1.
The number of differential metabolites regulated at different altitudes.
Figures
(6)
Tables
(1)