-
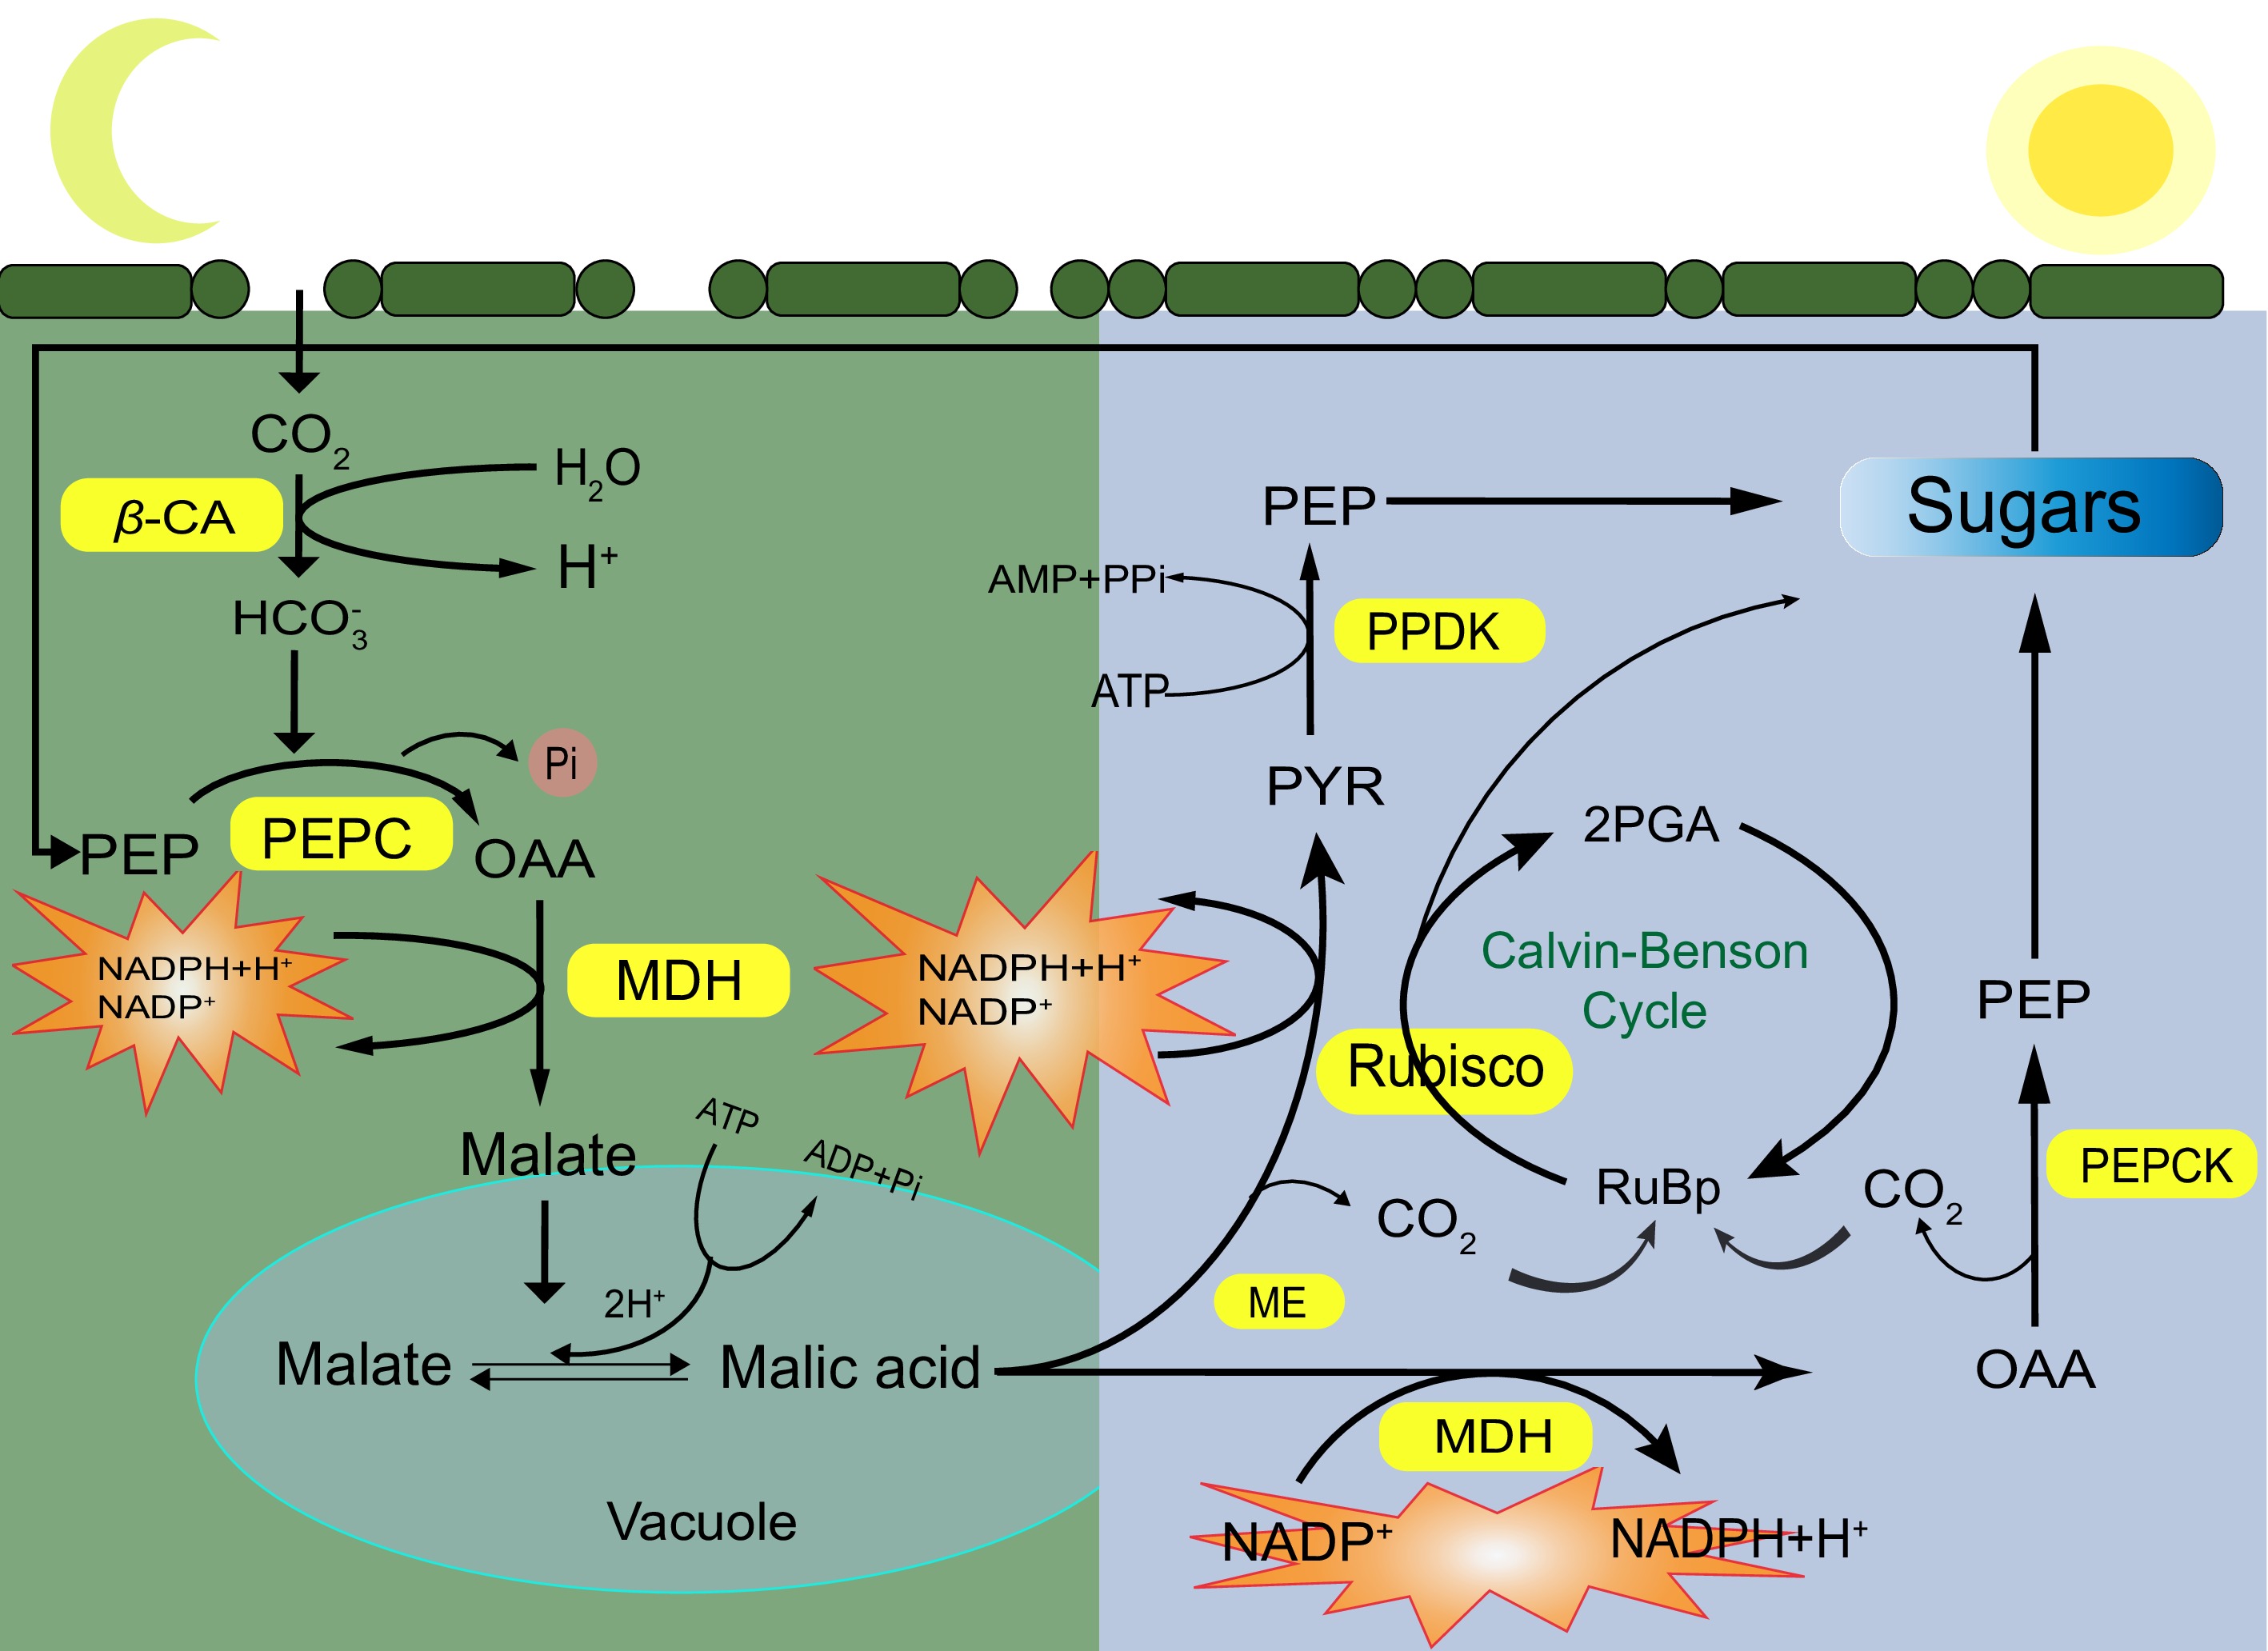
Figure 1.
The specific process of crassulacean acid metabolism in plants. Yellow is the key enzyme in the CAM pathway. CA: carbonic anhydrase; PEPC: phosphoenolpyruvate carboxylase; PEPCK: phosphoenolpyruvate carboxylase kinase; MDH: malic dehydrogenase; ME: malic acid enzyme; PPDK: pyruvate phosphokinase; Rubisco: ribulose 1,5-diphosphate carboxylase/oxygenase.
-
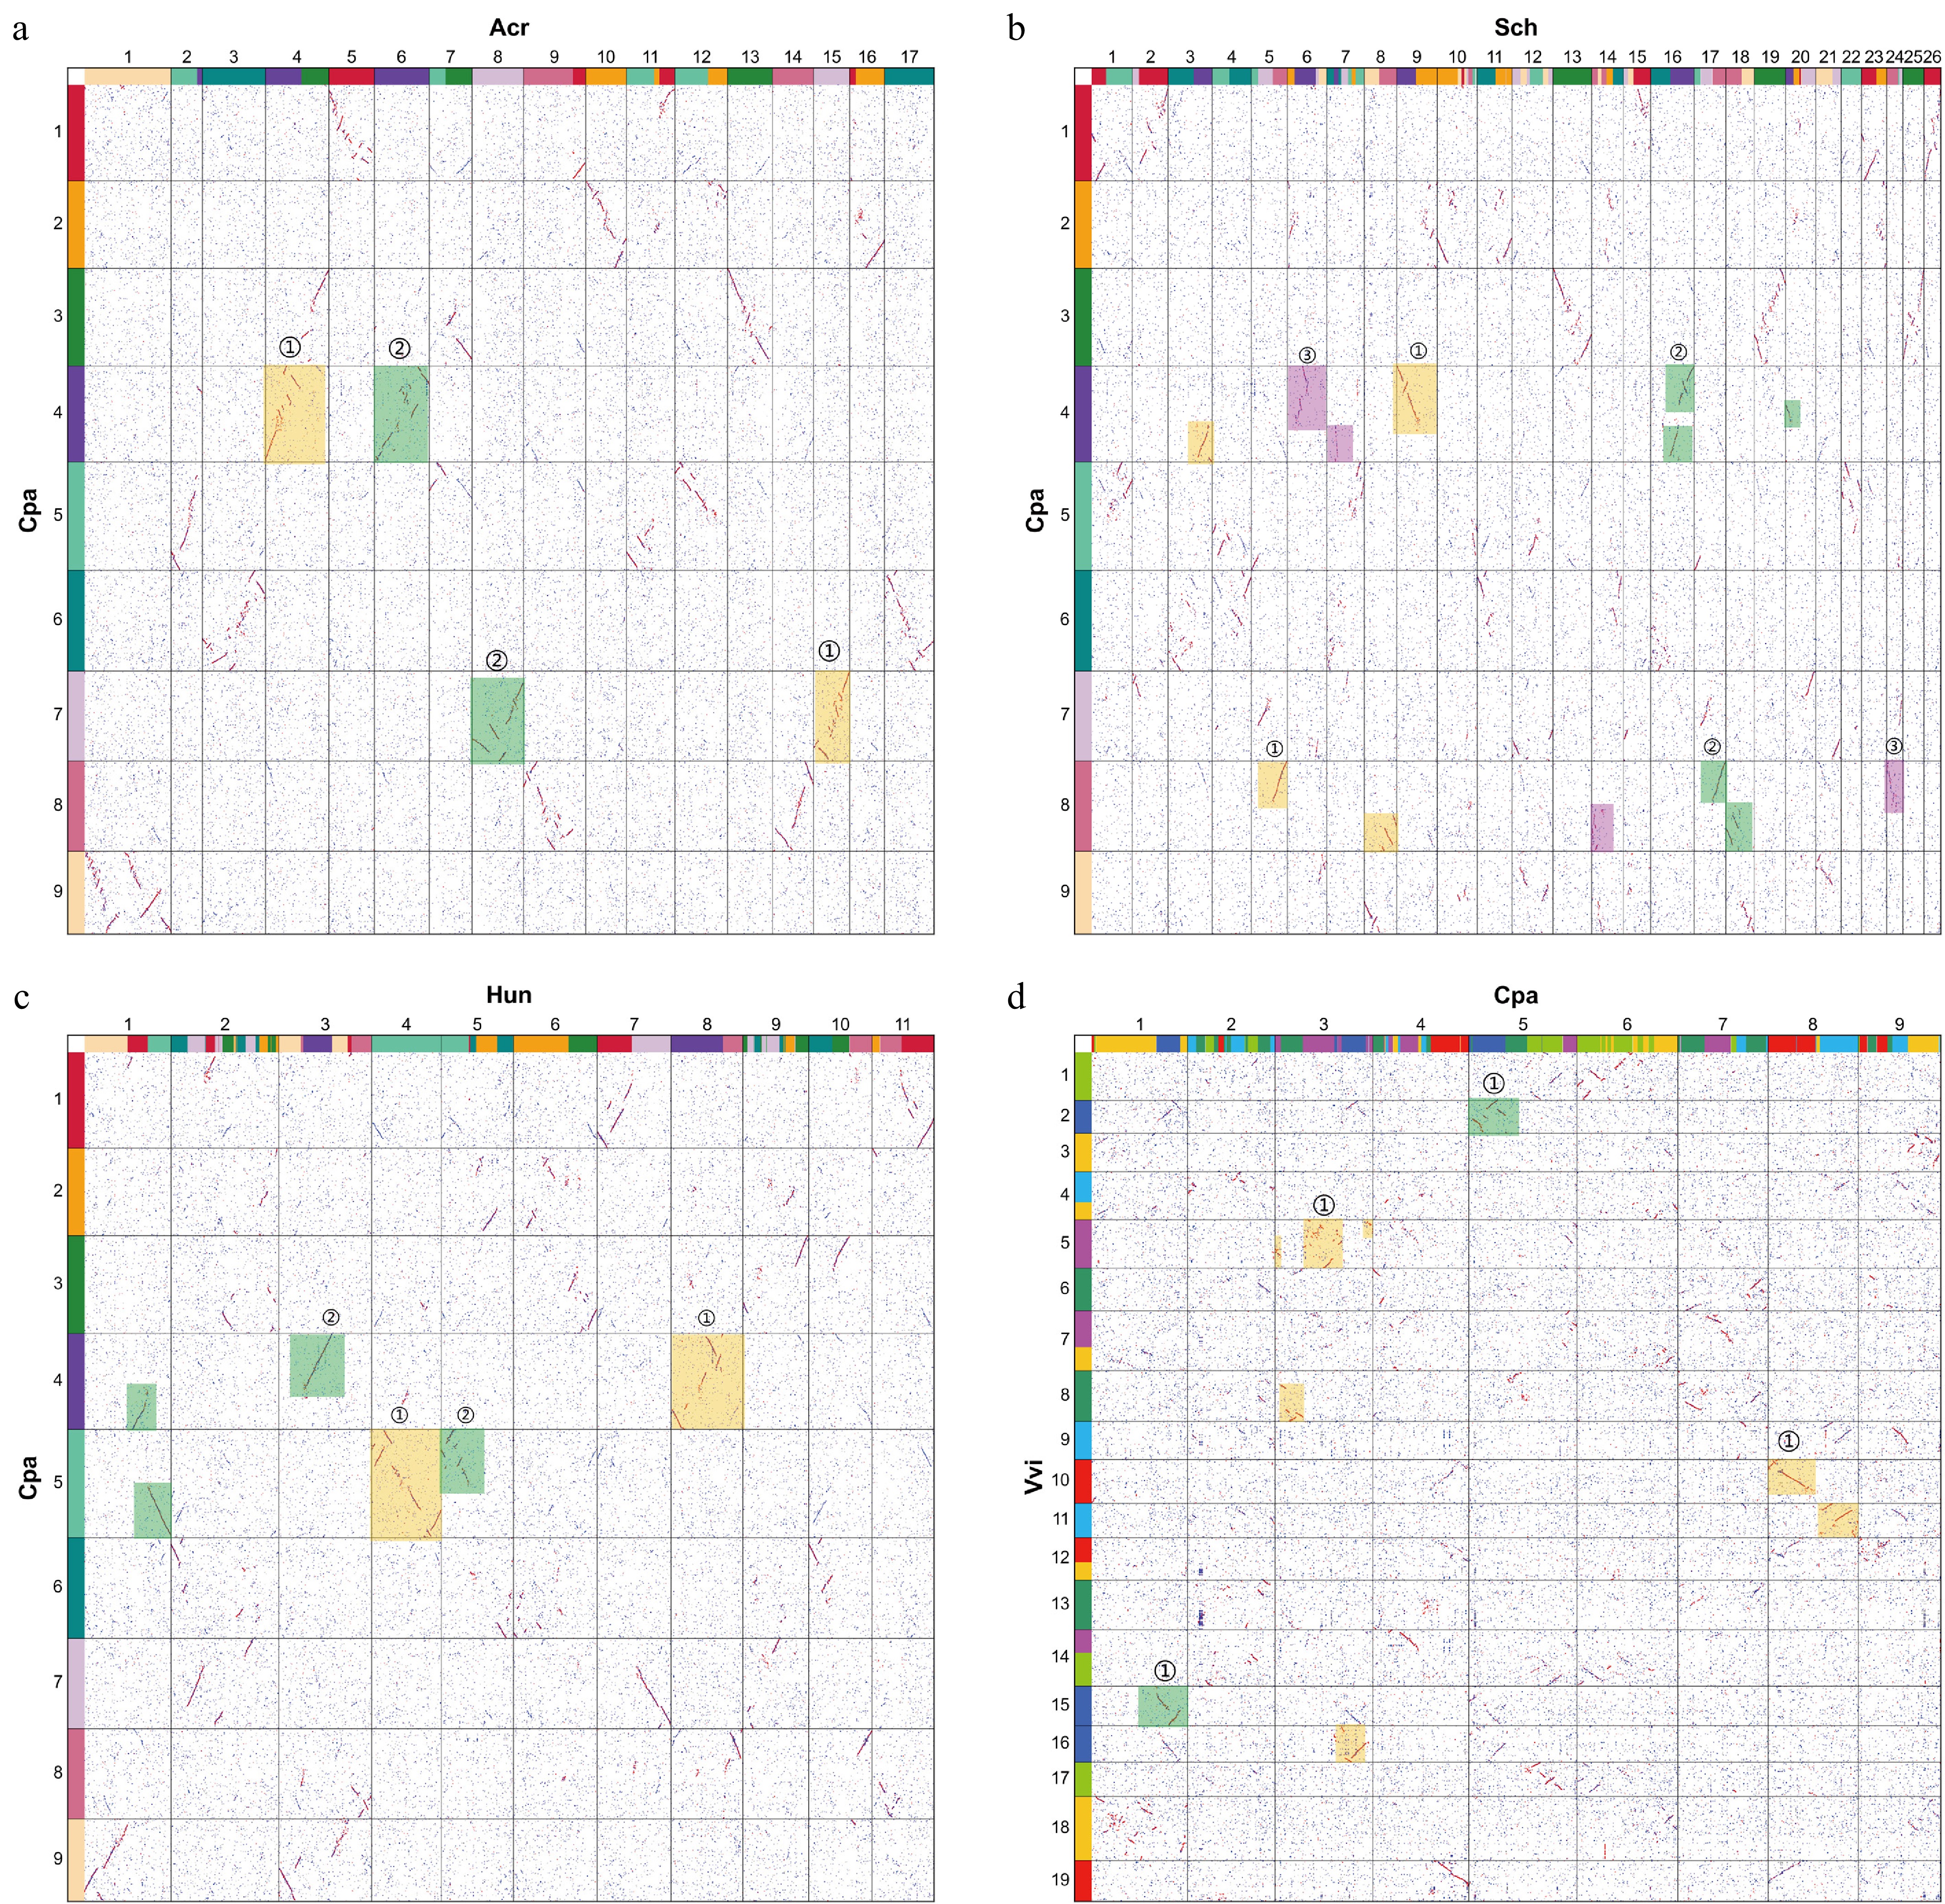
Figure 2.
Homologous dotplots between Chenopodium pallidicaule and other related species. The numbers in the dotplot denote the chromosome numbers of each species. Red fragments indicate the primary species-to-species alignment, while blue segments denote the secondary alignments. (a) C. pallidicaule (Cpa) vs A. cruentus (Acr). The orange and green rectangular boxes represent the two distinct sets of subgenomes identified. (b) C. pallidicaule (Cpa) vs S. chinensis (Sch). The orange, purple, and green rectangular boxes represent the three distinct sets of subgenomes identified. (c) C. pallidicaule (Cpa) vs H. undatus (Hun). The orange and green rectangular boxes represent the two distinct sets of subgenomes identified. (d) C. pallidicaule (Cpa) vs V. vinifera (Vvi). The contiguous line segments comprising red dots within the dotplot exhibit a distinct absence of overlap along both the horizontal and vertical axes. This characteristic pattern reflects a one-to-one correspondence in the ratio of best-matched homologous regions between the compared genomes.
-
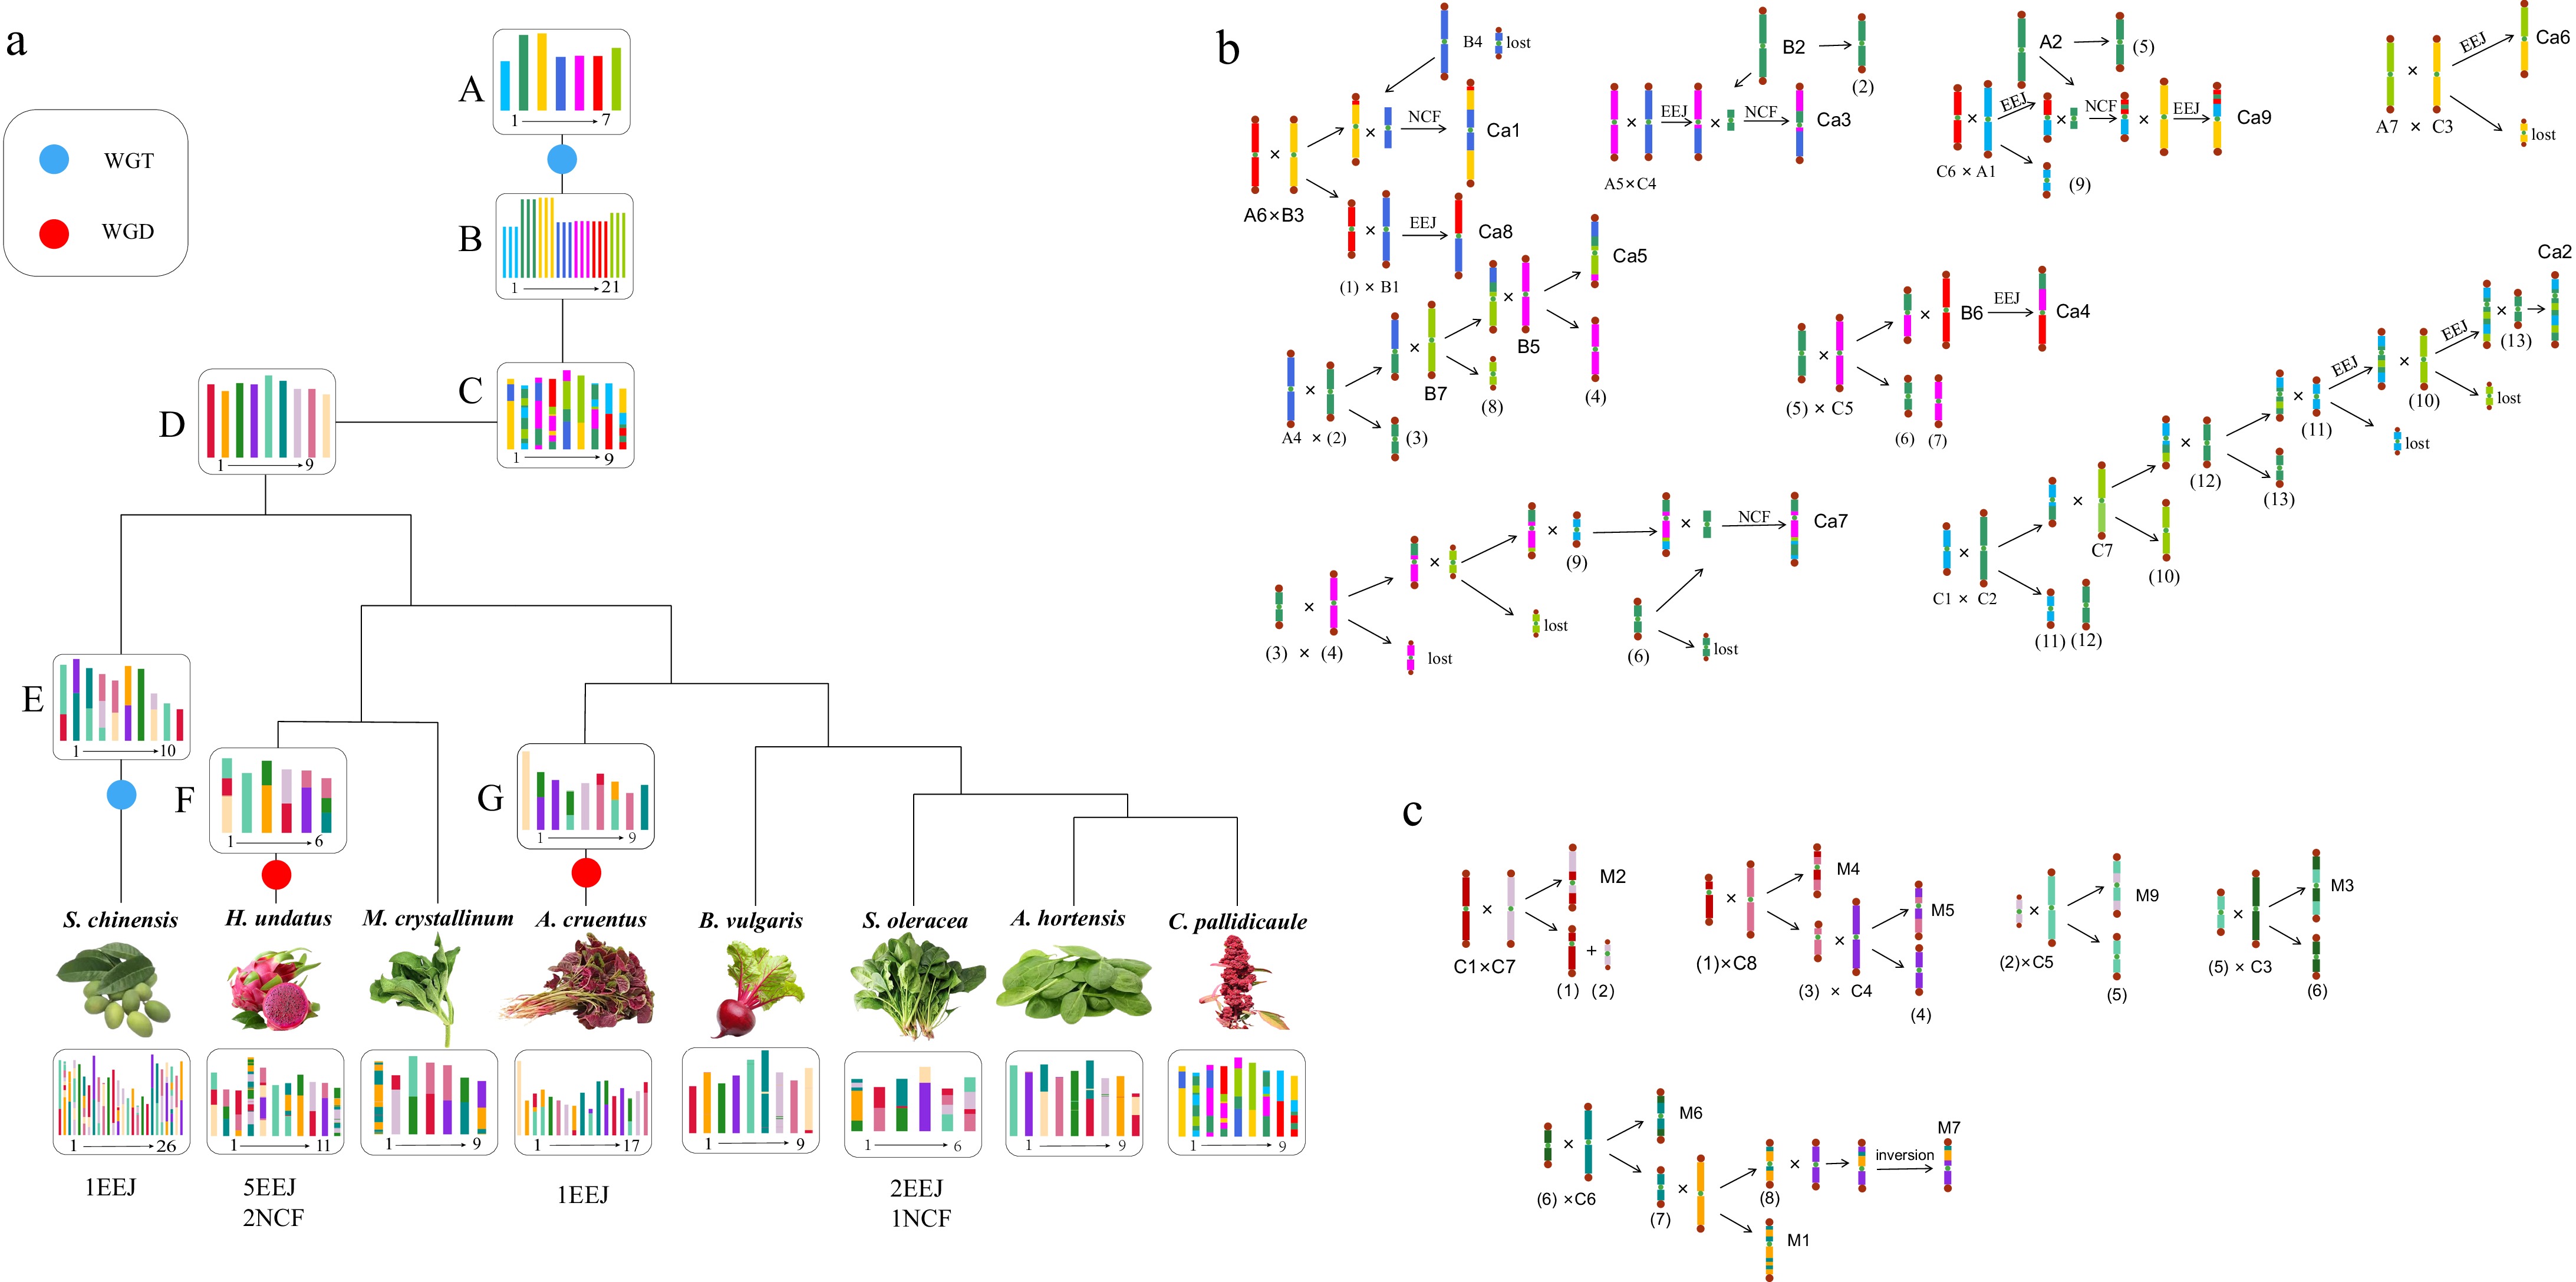
Figure 3.
Chromosome karyotype reconstruction and evolution in Caryophyllales species. (a) The blue circle denotes the WGT event, while the red circle represents the WGD event. The chromosome karyotype of the key nodes and the chromosome numbers of each species are depicted in the diagram, with species denoted by their Latin names. (b) The schematic illustrates the formation process of the ancestral chromosome of Caryophyllales. A1–A7, B1–B7, and C1–C7 represent the ancestral chromosomes of the core eudicot species post-WGT event. Ca1–Ca9 represent the ancestral chromosome of Caryophyllales, with 'lost' indicating the loss of the resulting B chromosome. (c) The diagram portrays the formation process of M. crystallinum chromosome. C1–C9 represent the ancestral chromosome of Caryophyllales, while M1–M9 denote the M. crystallinum chromosome.
-
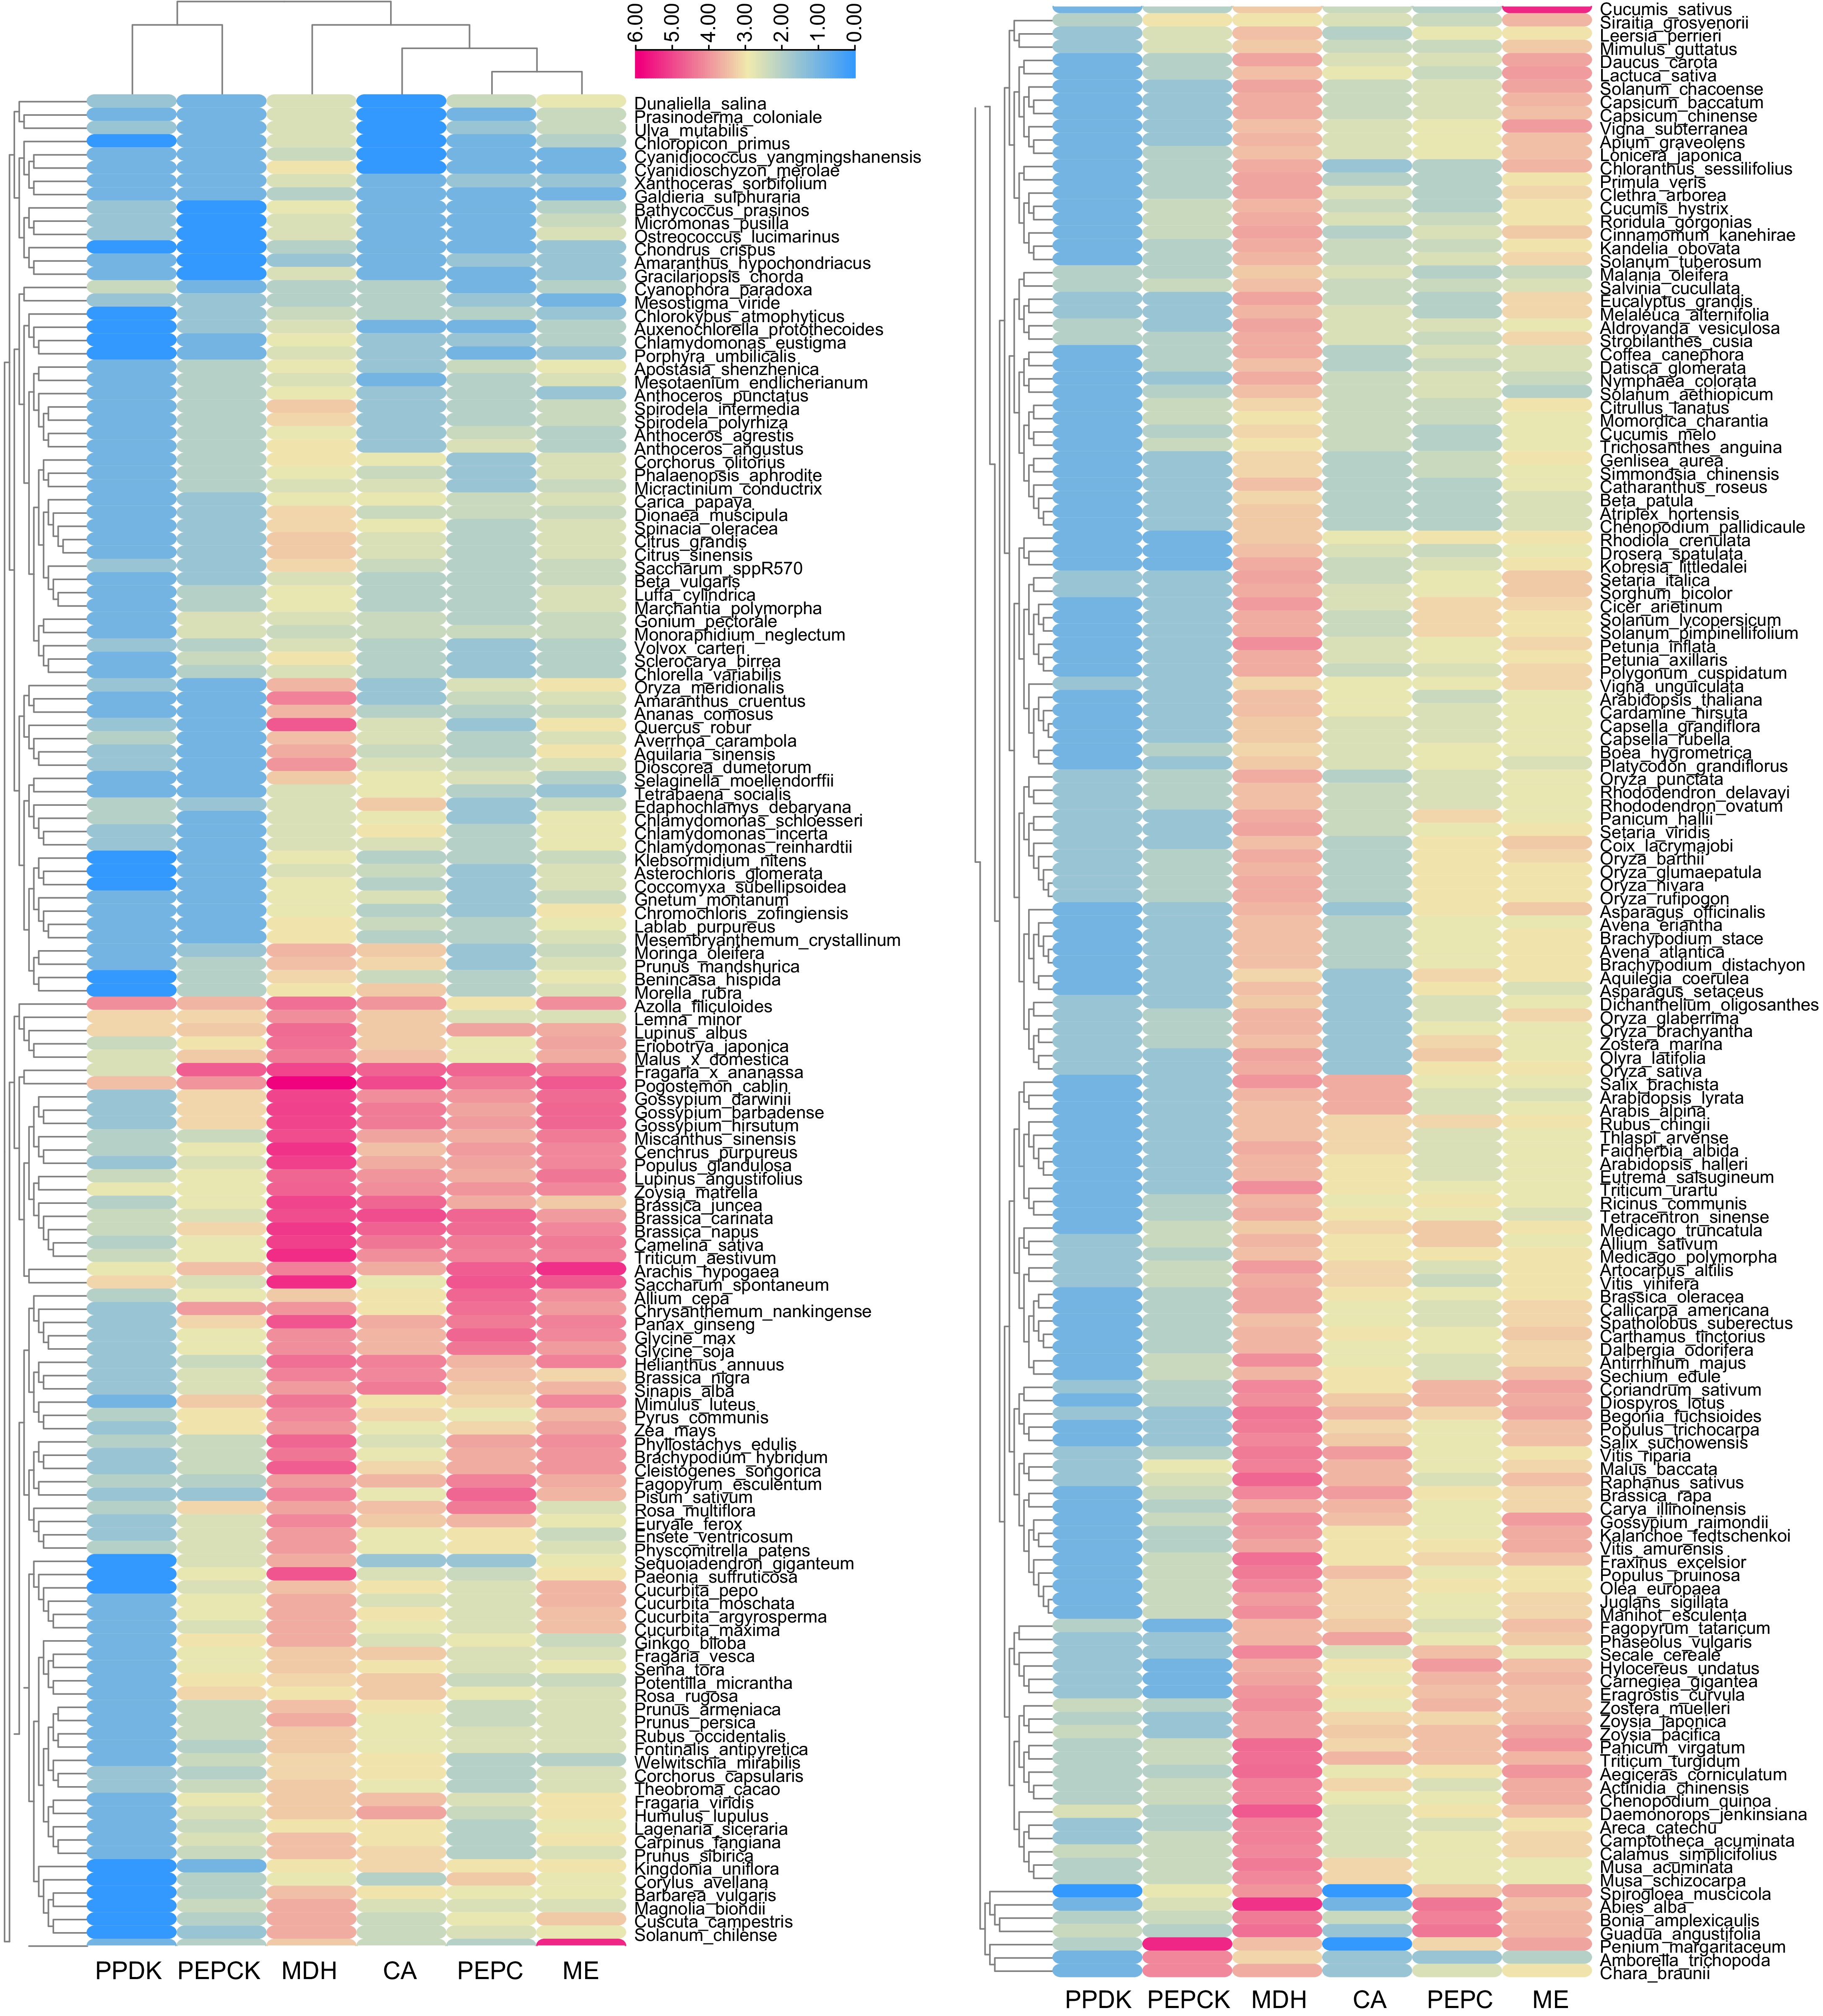
Figure 4.
Heatmap of CAM-related gene number in 288 plants. The numbers were transformed by log2.
-
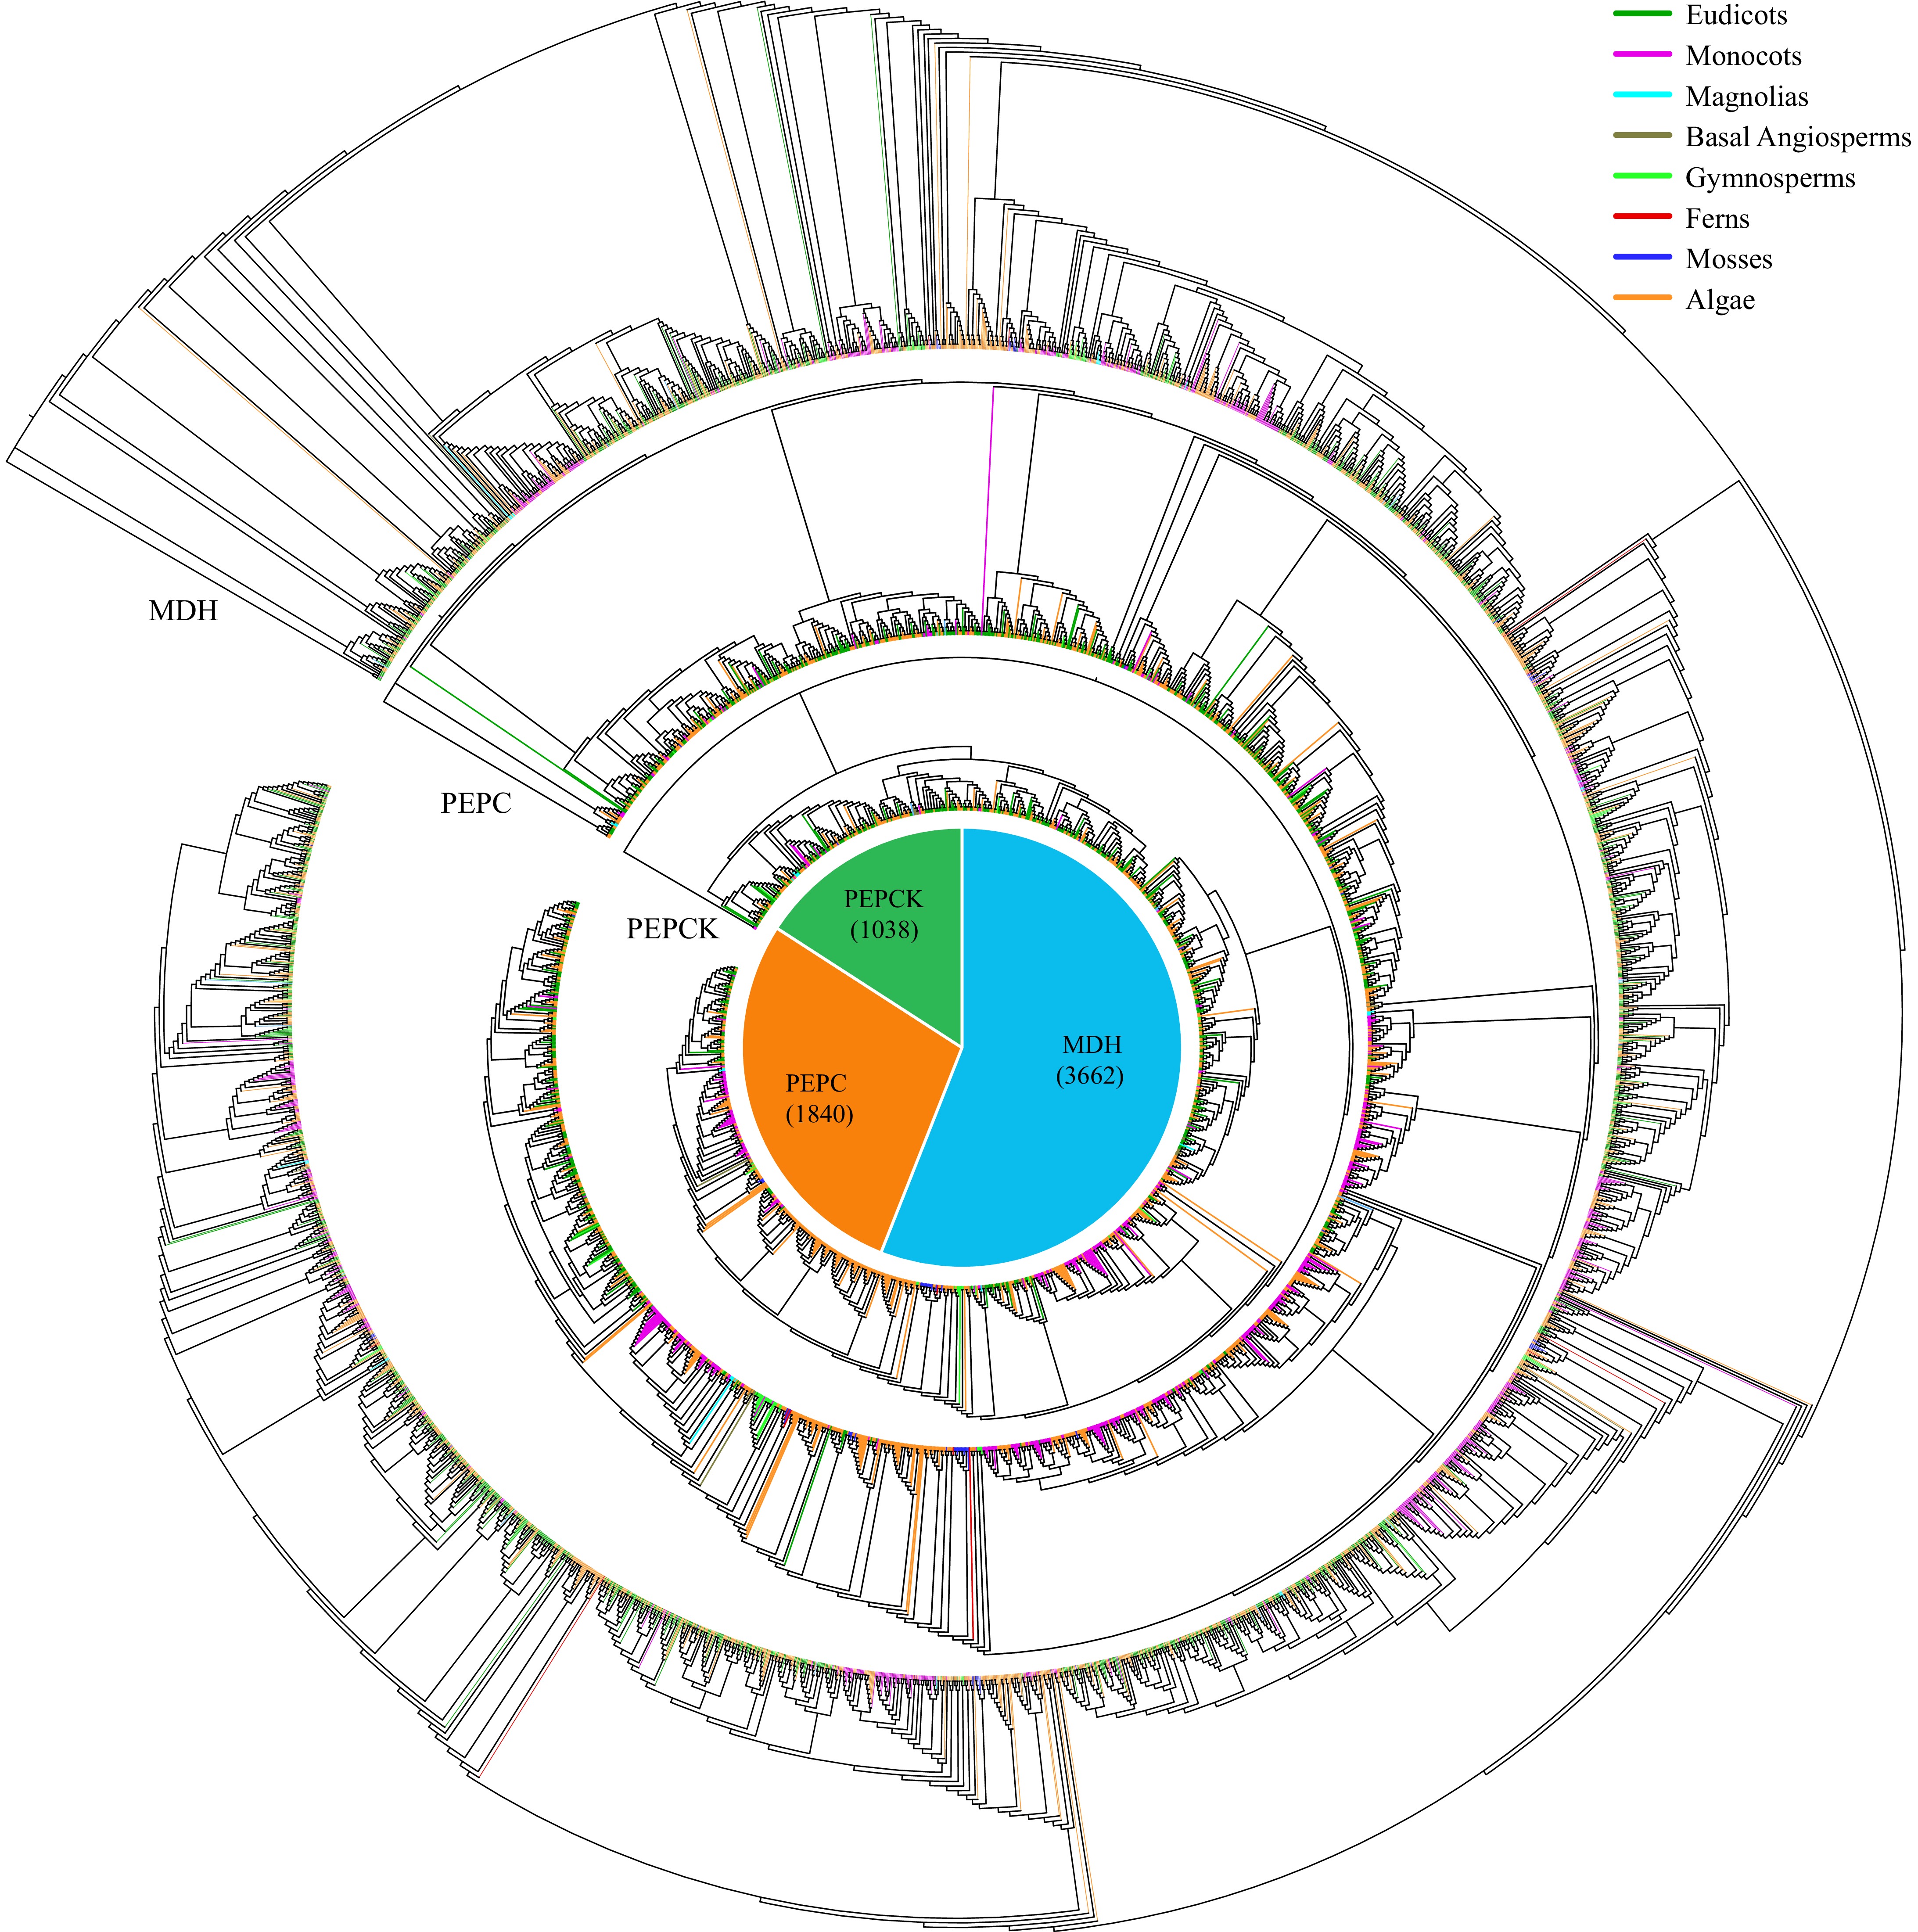
Figure 5.
Maximum-likelihood trees were constructed for CAM-related genes, encompassing families such as MDH, PEPC, and PEPCK, utilizing amino acid sequences from 288 species with 1,000 bootstraps. The pie chart illustrates the overall distribution of each CAM-related gene across the 288 species. Branches within the evolutionary tree are color-coded to denote the taxonomic classification of the respective species.
-
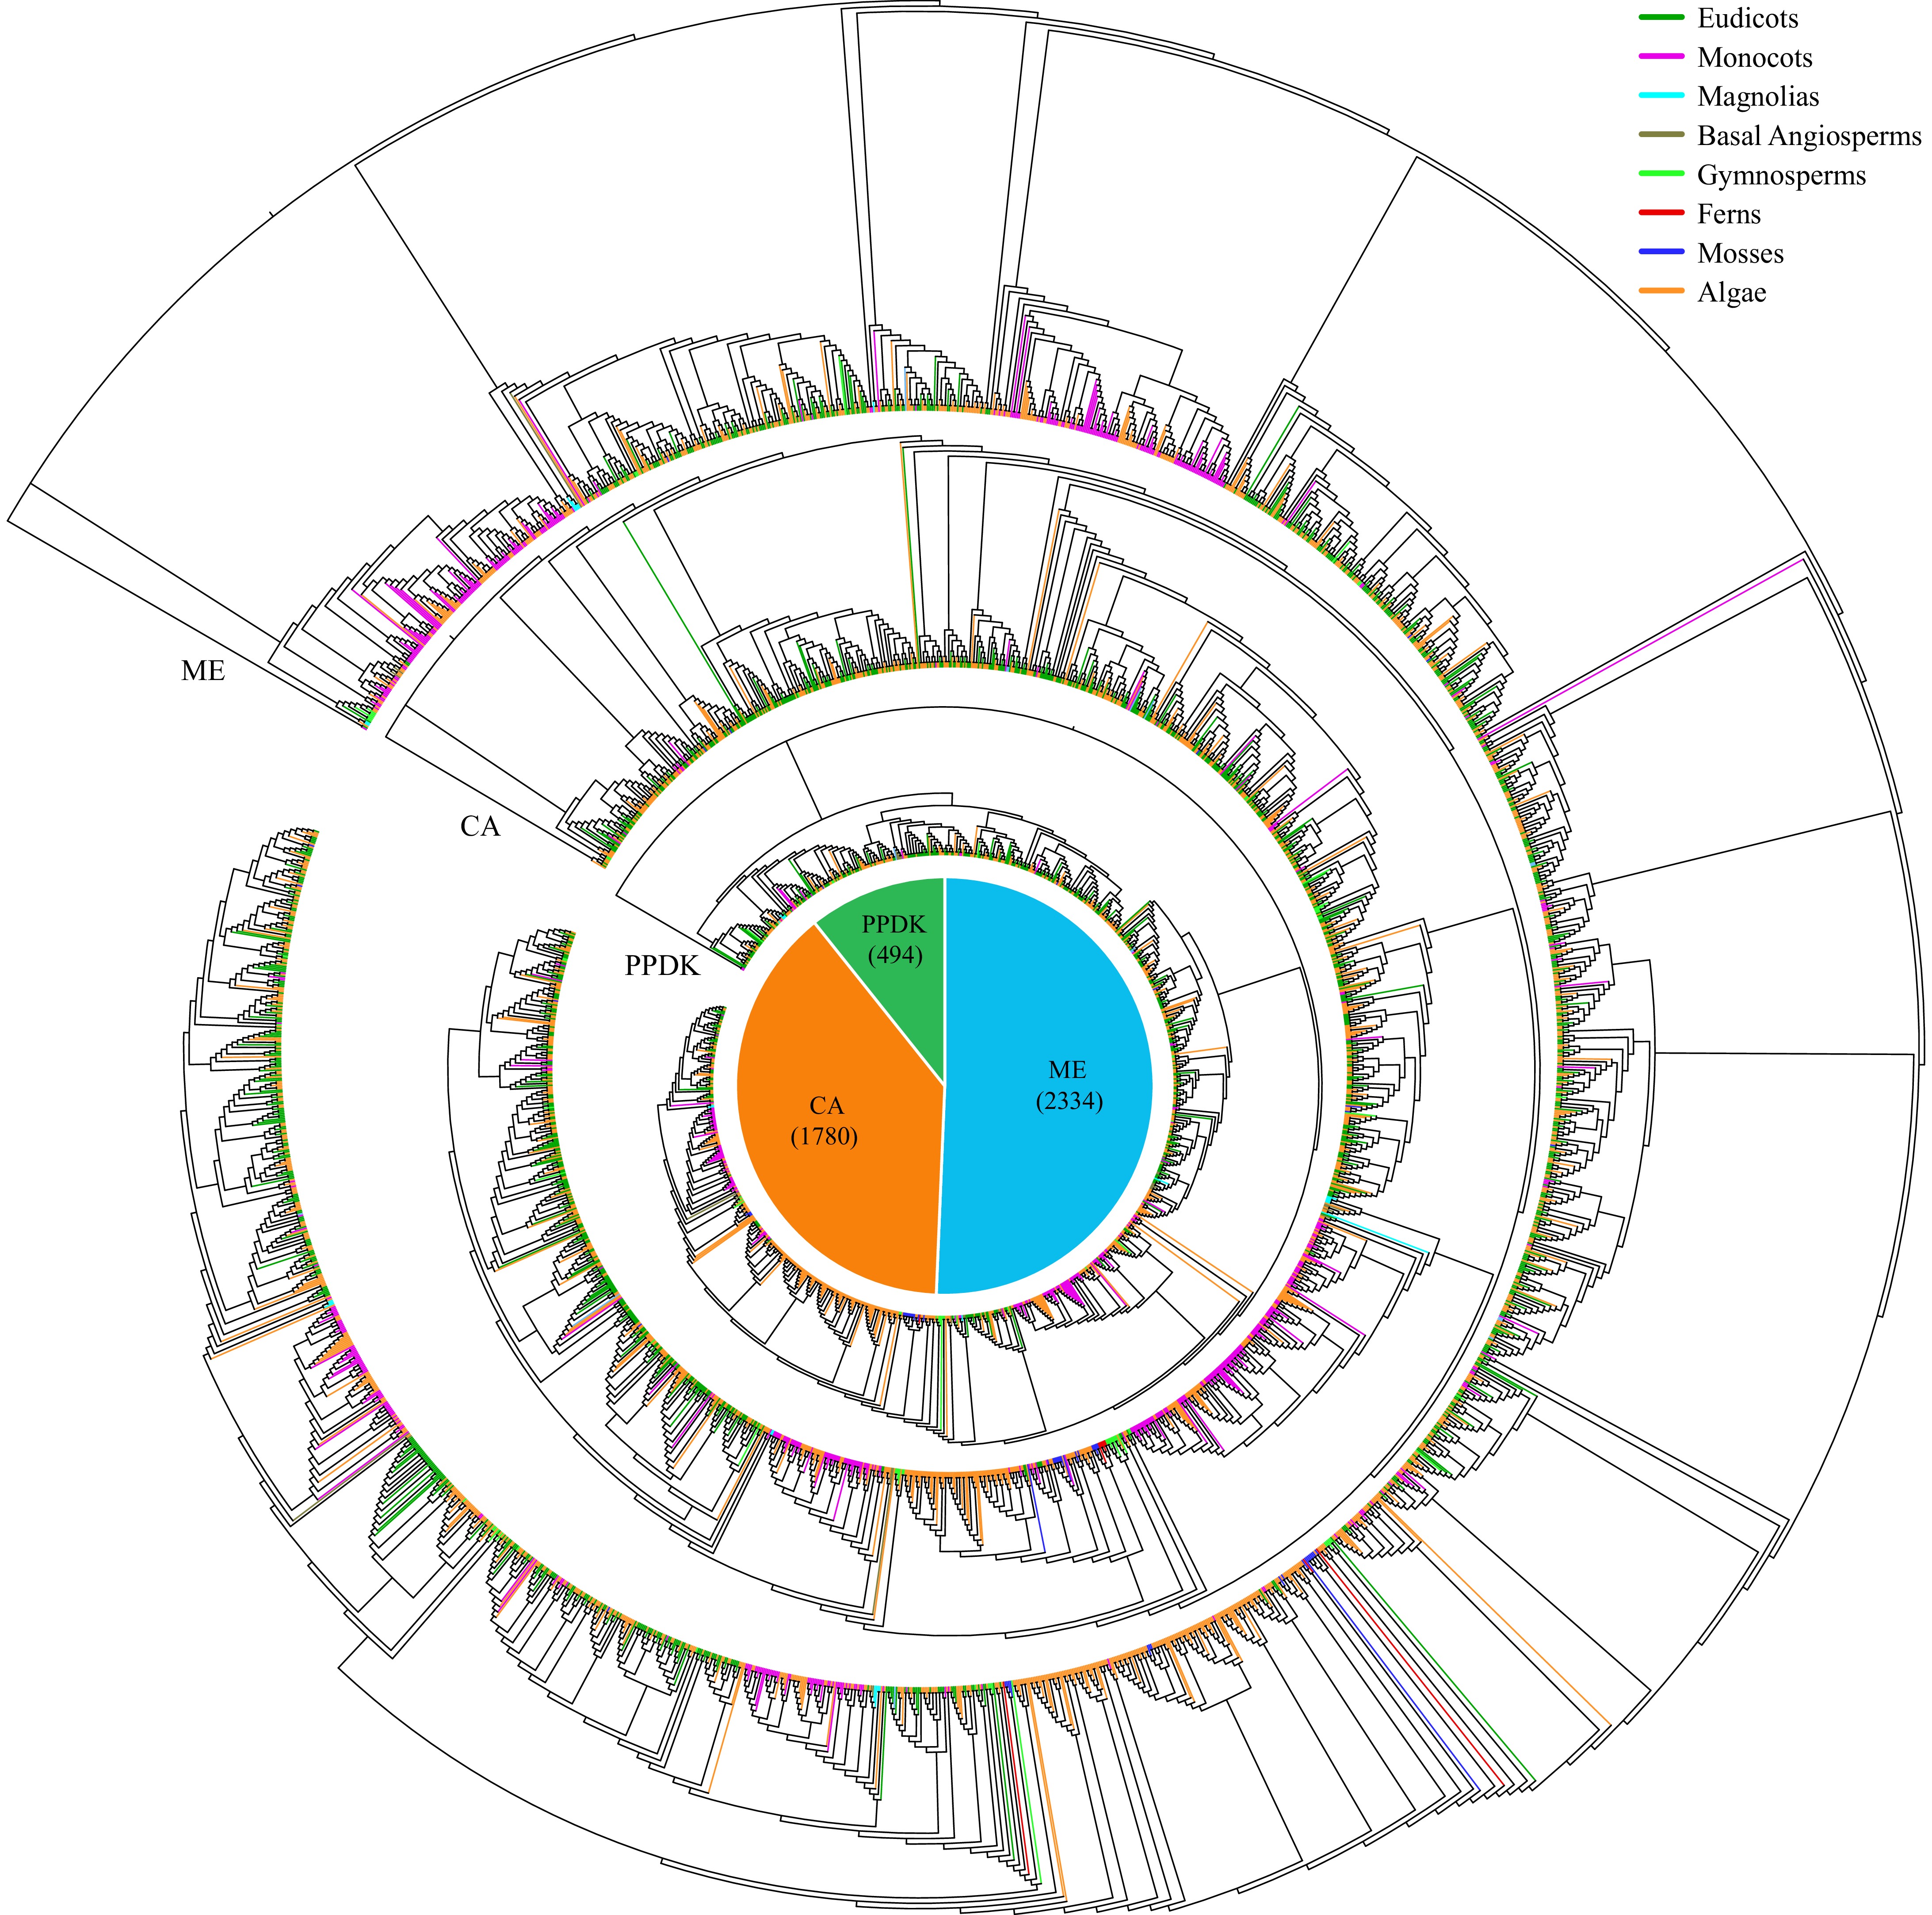
Figure 6.
Maximum-likelihood trees were generated for CAM-related genes, encompassing families such as ME, CA, and PPDK, utilizing amino acid sequences from 288 species with 1,000 bootstraps. The pie chart depicts the total number of each CAM-related gene across the 288 species. Different colored branches within the evolutionary tree denote the taxonomic affiliations of the respective species.
-
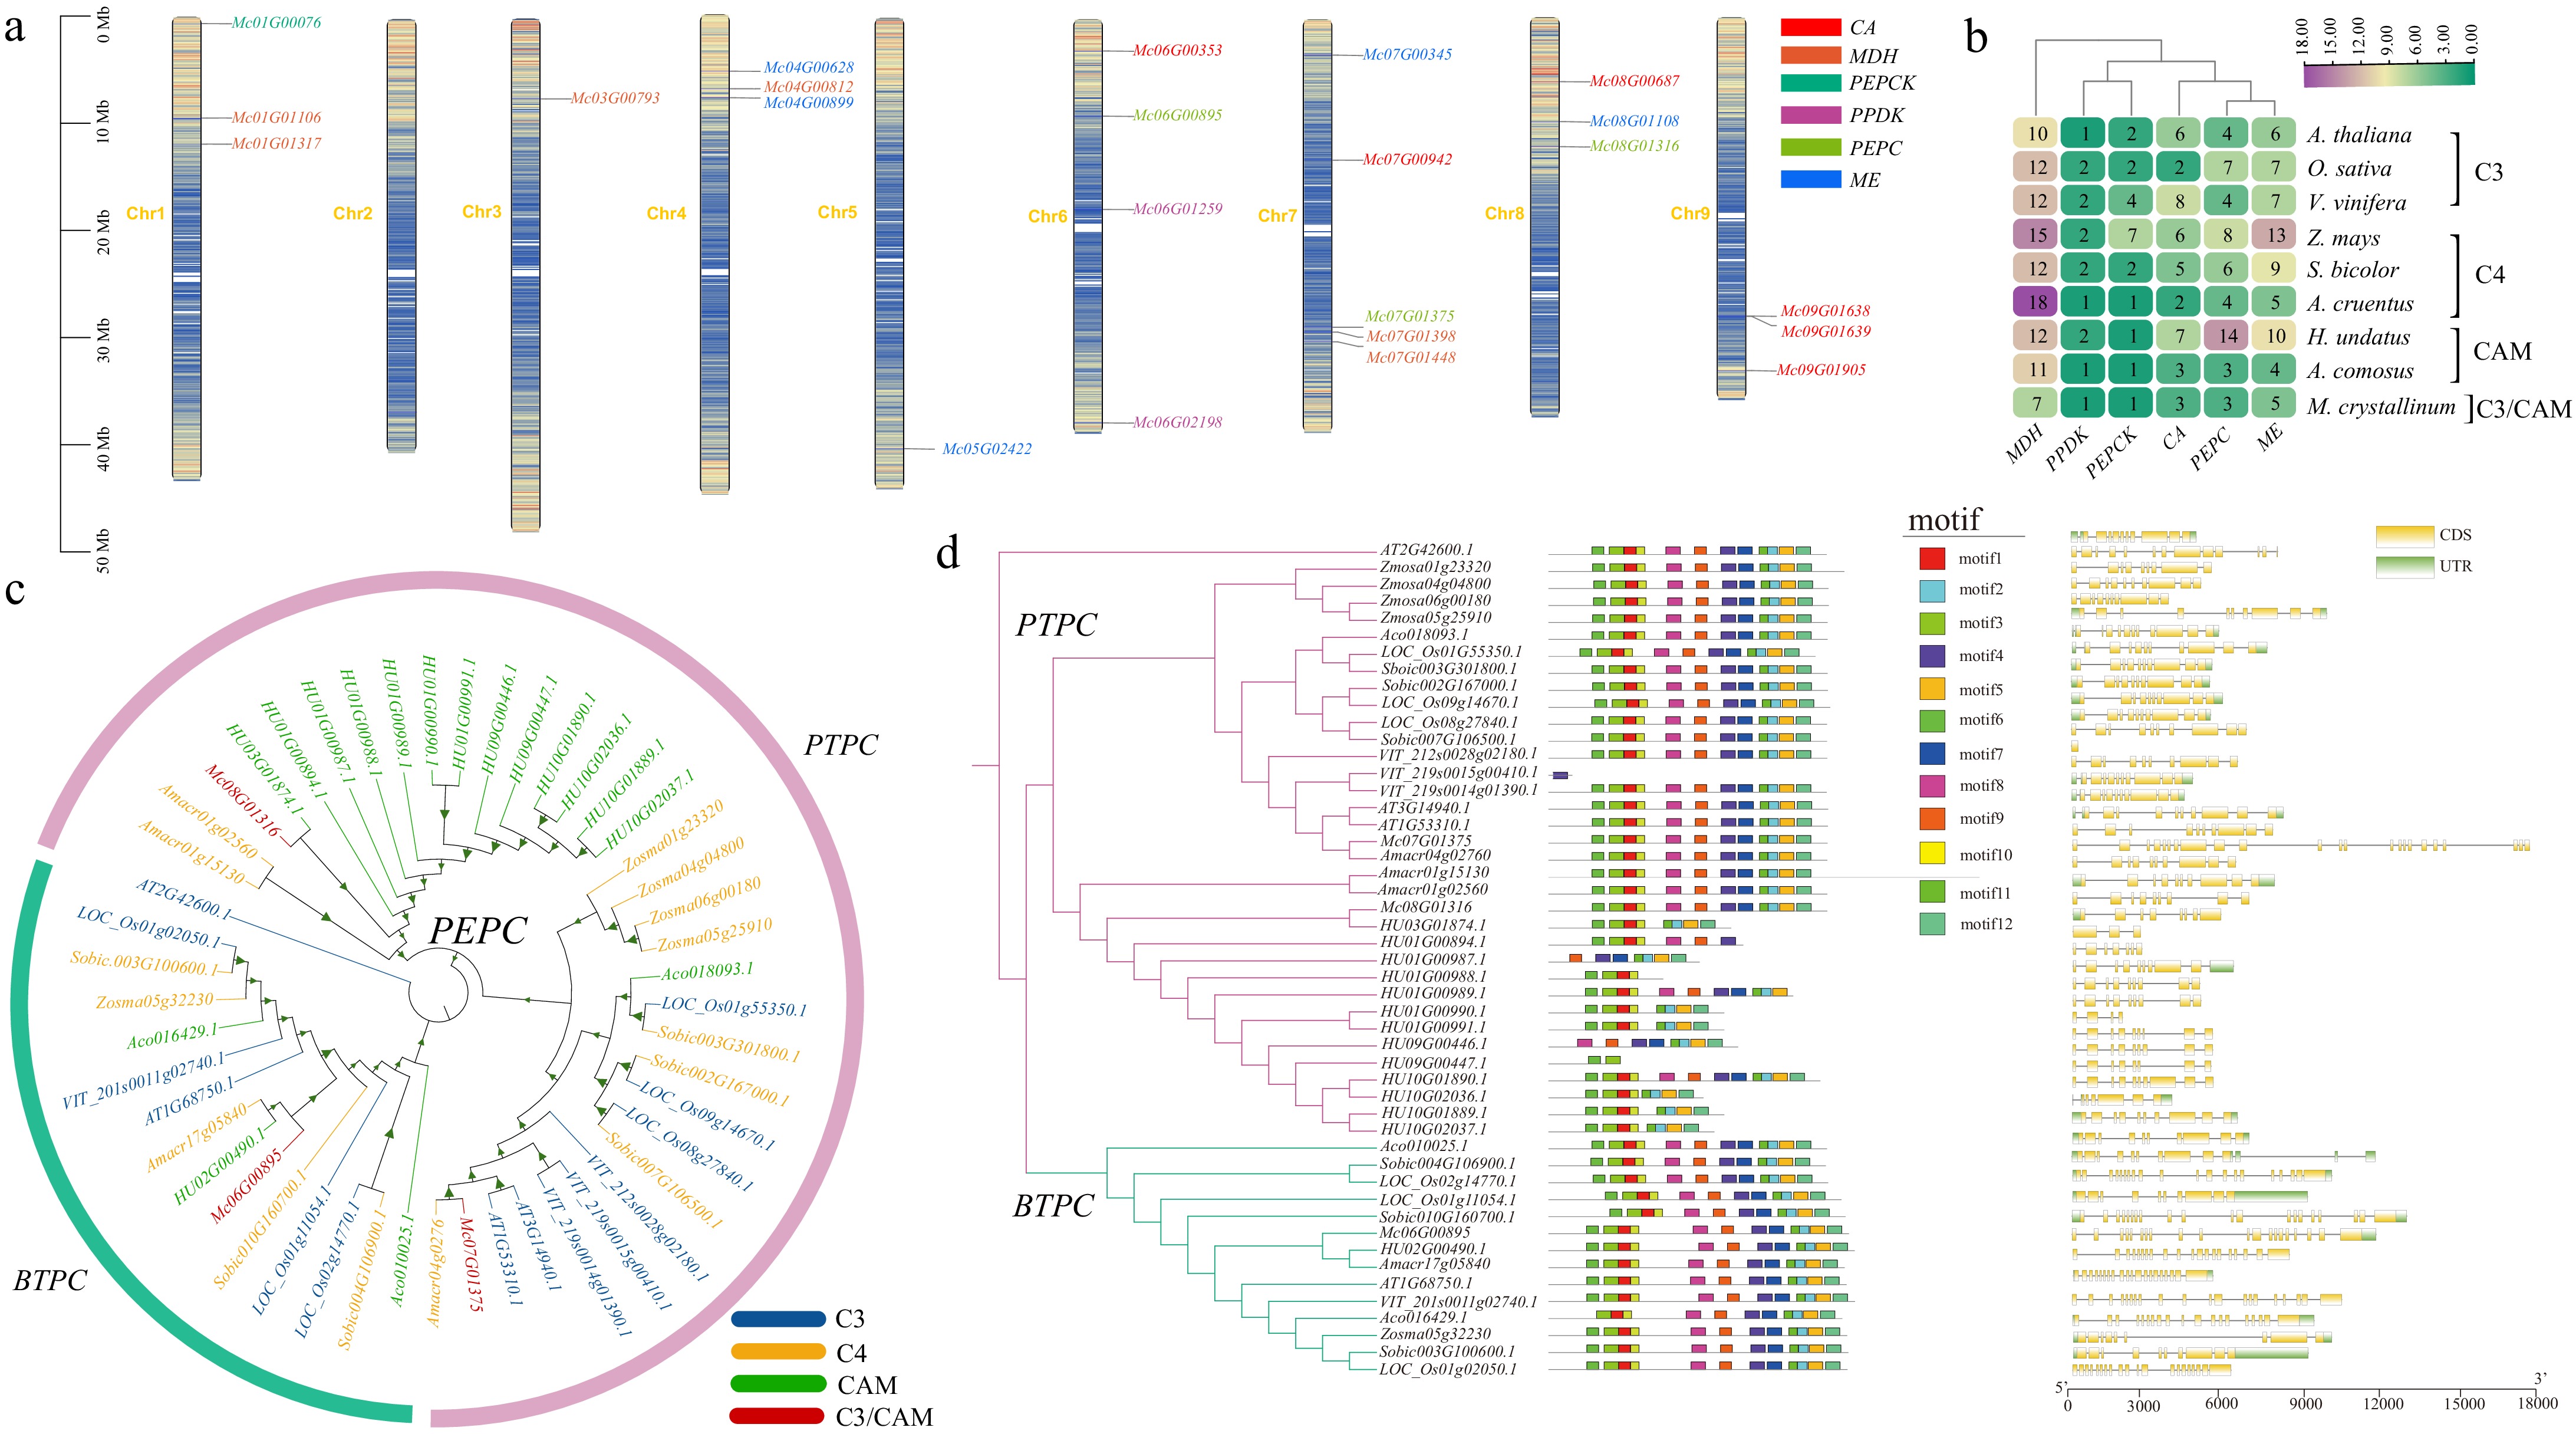
Figure 7.
CAM gene analysis across the ice plant and other eight representative species. (a) Map illustrating the distribution pattern of CAM genes within the genome of the ice plant. (b) Heatmap of CAM gene numbers across ice plants and other eight representative species. (c) Phylogenetic tree of PEPC proteins in ice plants and other species. The color of genes represents C3, C4, CAM, and C3/CAM types. The color of the outer circle denotes the three subfamilies of the PEPC gene family. (d) Phylogenetic tree, conserved motifs, and gene structure of PEPC across the ice plant and other species. To the left of the phylogenetic tree, schematic representations depict conserved motifs within PEPC proteins, as identified through MEME analysis. Different colors are utilized to signify different motifs. On the right side of the tree, a schematic diagram illustrates the gene structure of PEPC proteins using TBtools. Here, the coding sequences (CDS) are visually distinguished in yellow, while the untranslated regions (UTR) are depicted in green, facilitating a comprehensive understanding of the structural organization of PEPC genes across taxa.
Figures
(7)
Tables
(0)