-
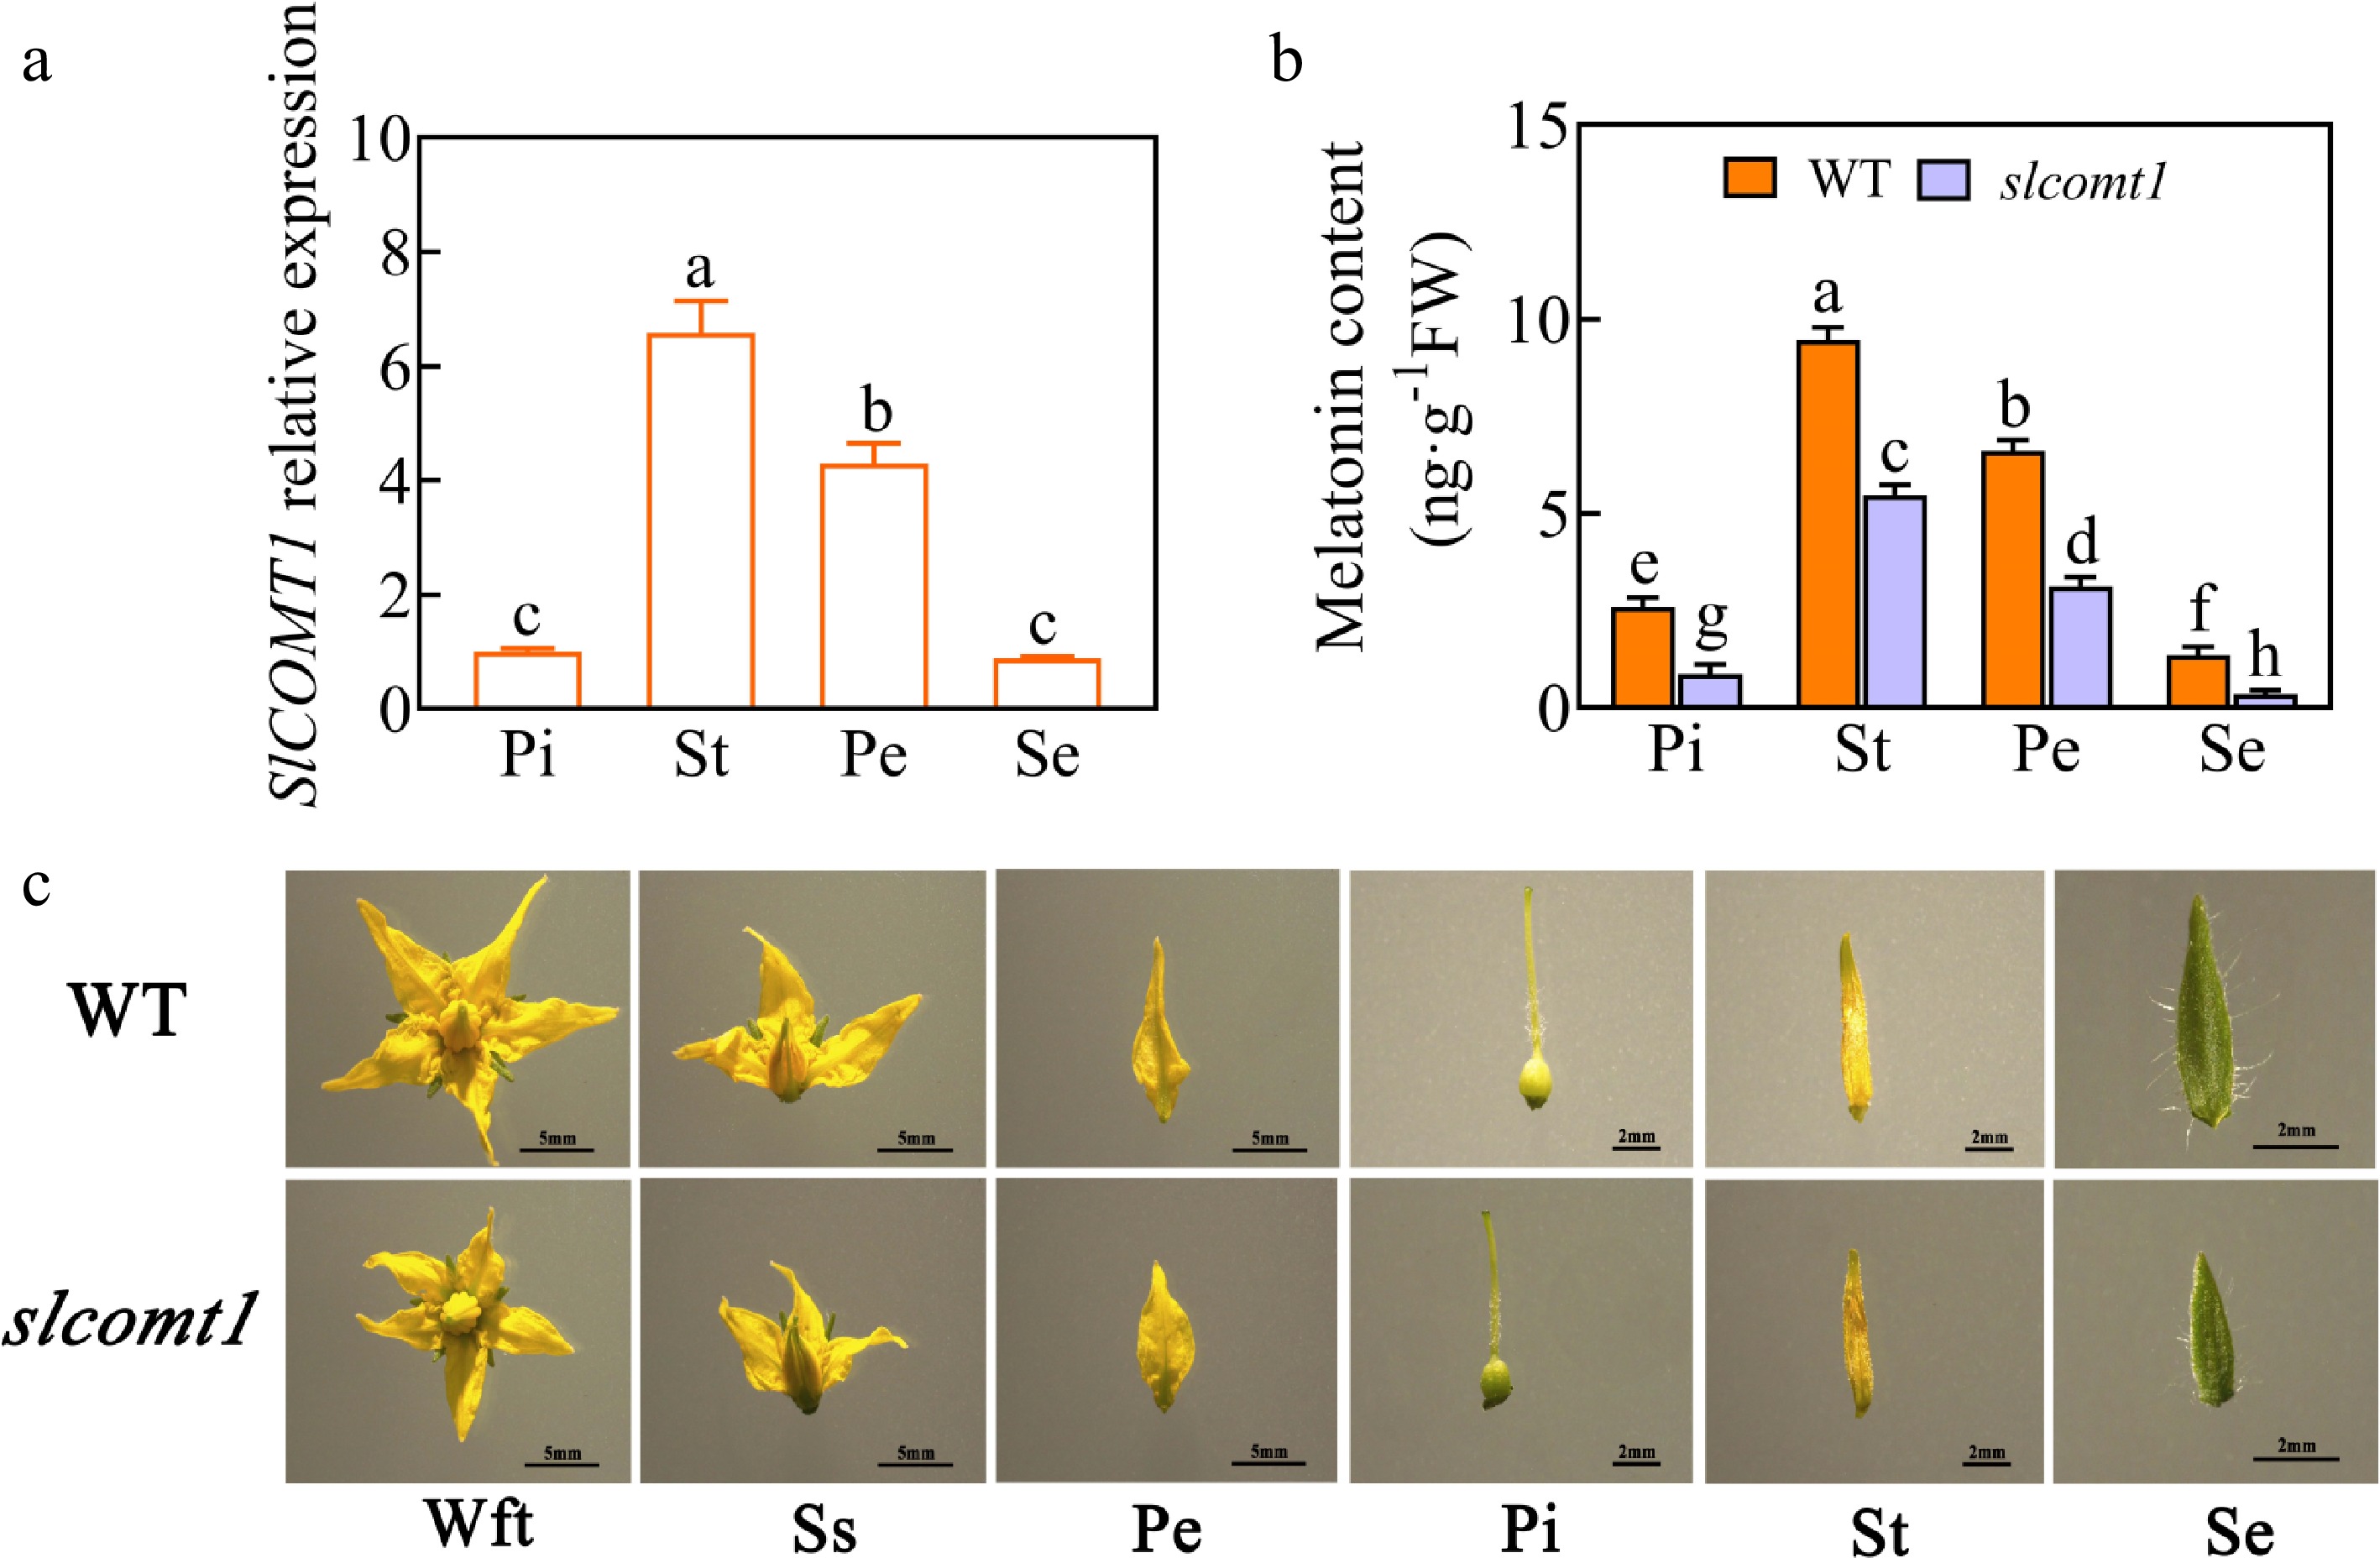
Figure 1.
SlCOMT1 gene deletion reduces melatonin accumulation and disrupts floral development in tomato. (a) Relative expression levels of the SlCOMT1 gene in various floral tissues. Pi: pistil, St: stamen, Pe: petal, Se: sepal. WT: wild-type. slcomt1:SlCOMT1 gene deletion plants. (b) Endogenous melatonin content. (c) Floral tissue anatomical observations. Wft: Whole flower top view, Ss: Side sectional view. Plotted values are mean ± standard deviation (n = three biological replicates), separated using Duncan's multiple range test (p < 0.05); means with different lower-case letters represent significant differences.
-
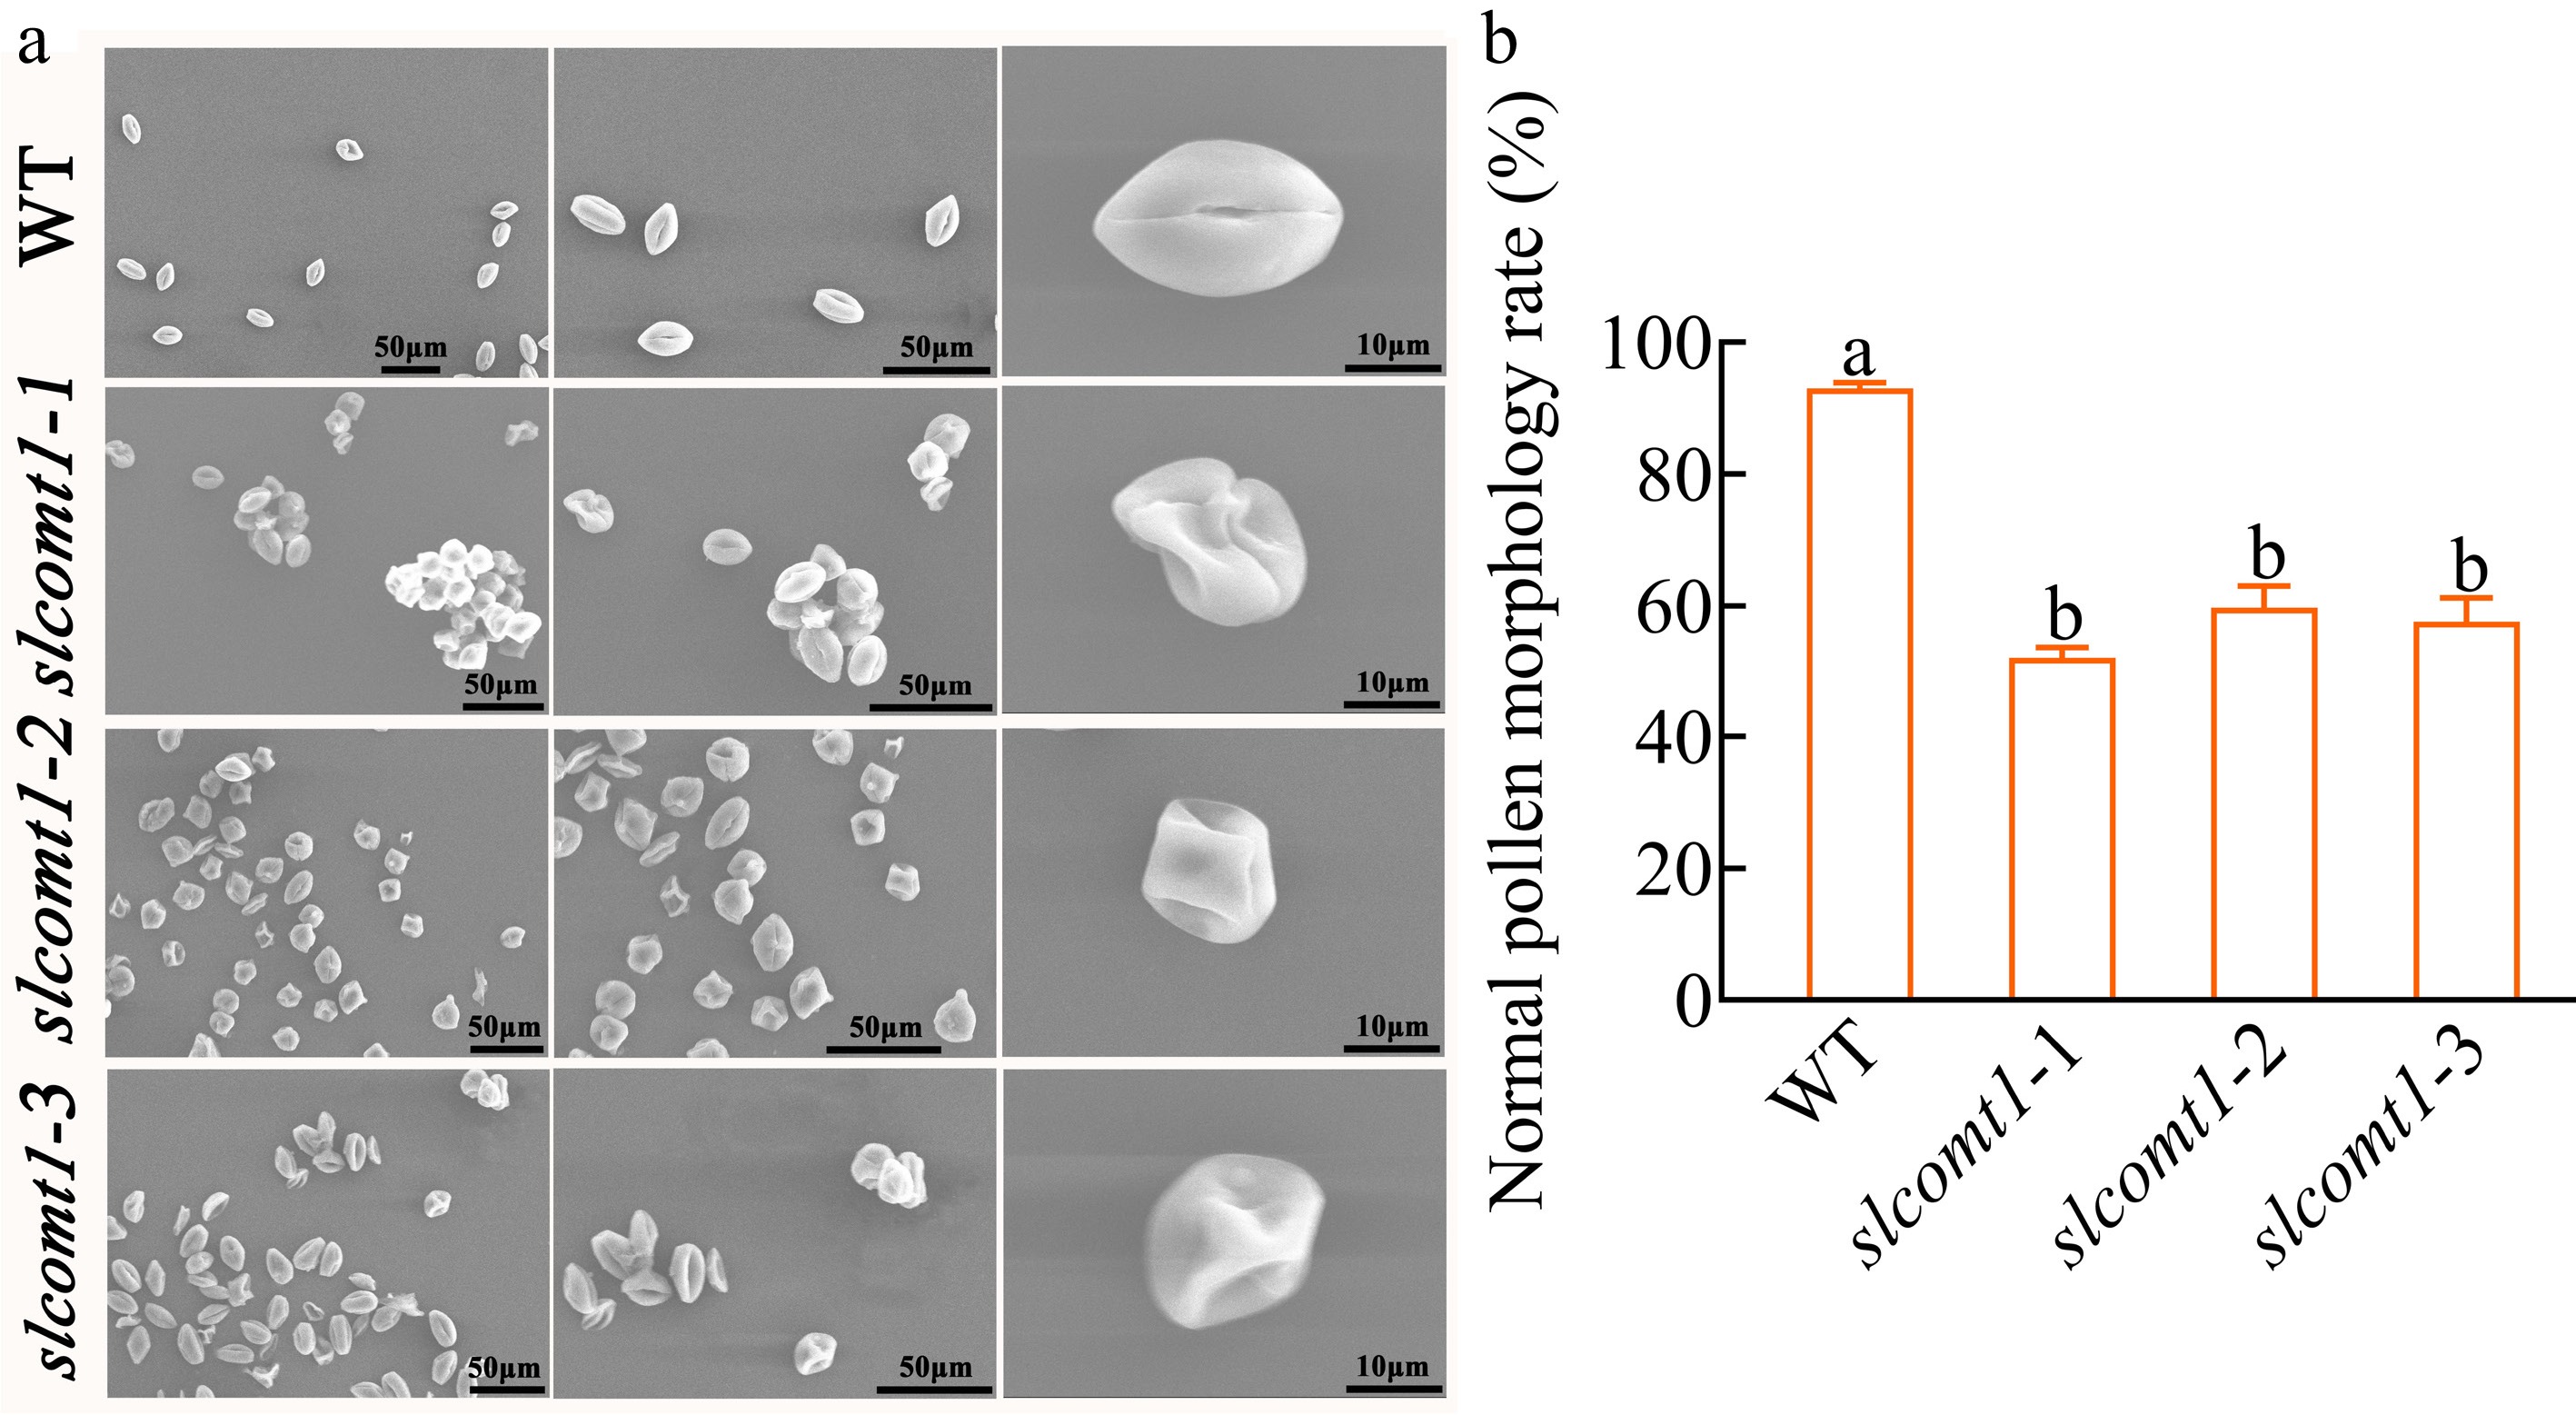
Figure 2.
SlCOMT1 gene deletion disrupts pollen morphology. (a) Scanning electron microscopy (SEM) reveals aberrant pollen morphology in SlCOMT1 gene deletion. Mature pollen grains from WT and three independent slcomt1 lines (#1−#3). (b) Quantitative impairment of pollen structural integrity. Plotted values are mean ± standard deviation (normal morphology rate calculated from ≥ 200 grains per genotype across, n = three biological replicates), separated using Duncan's multiple range test (p < 0.05); means with different lower-case letters represent significant differences.
-
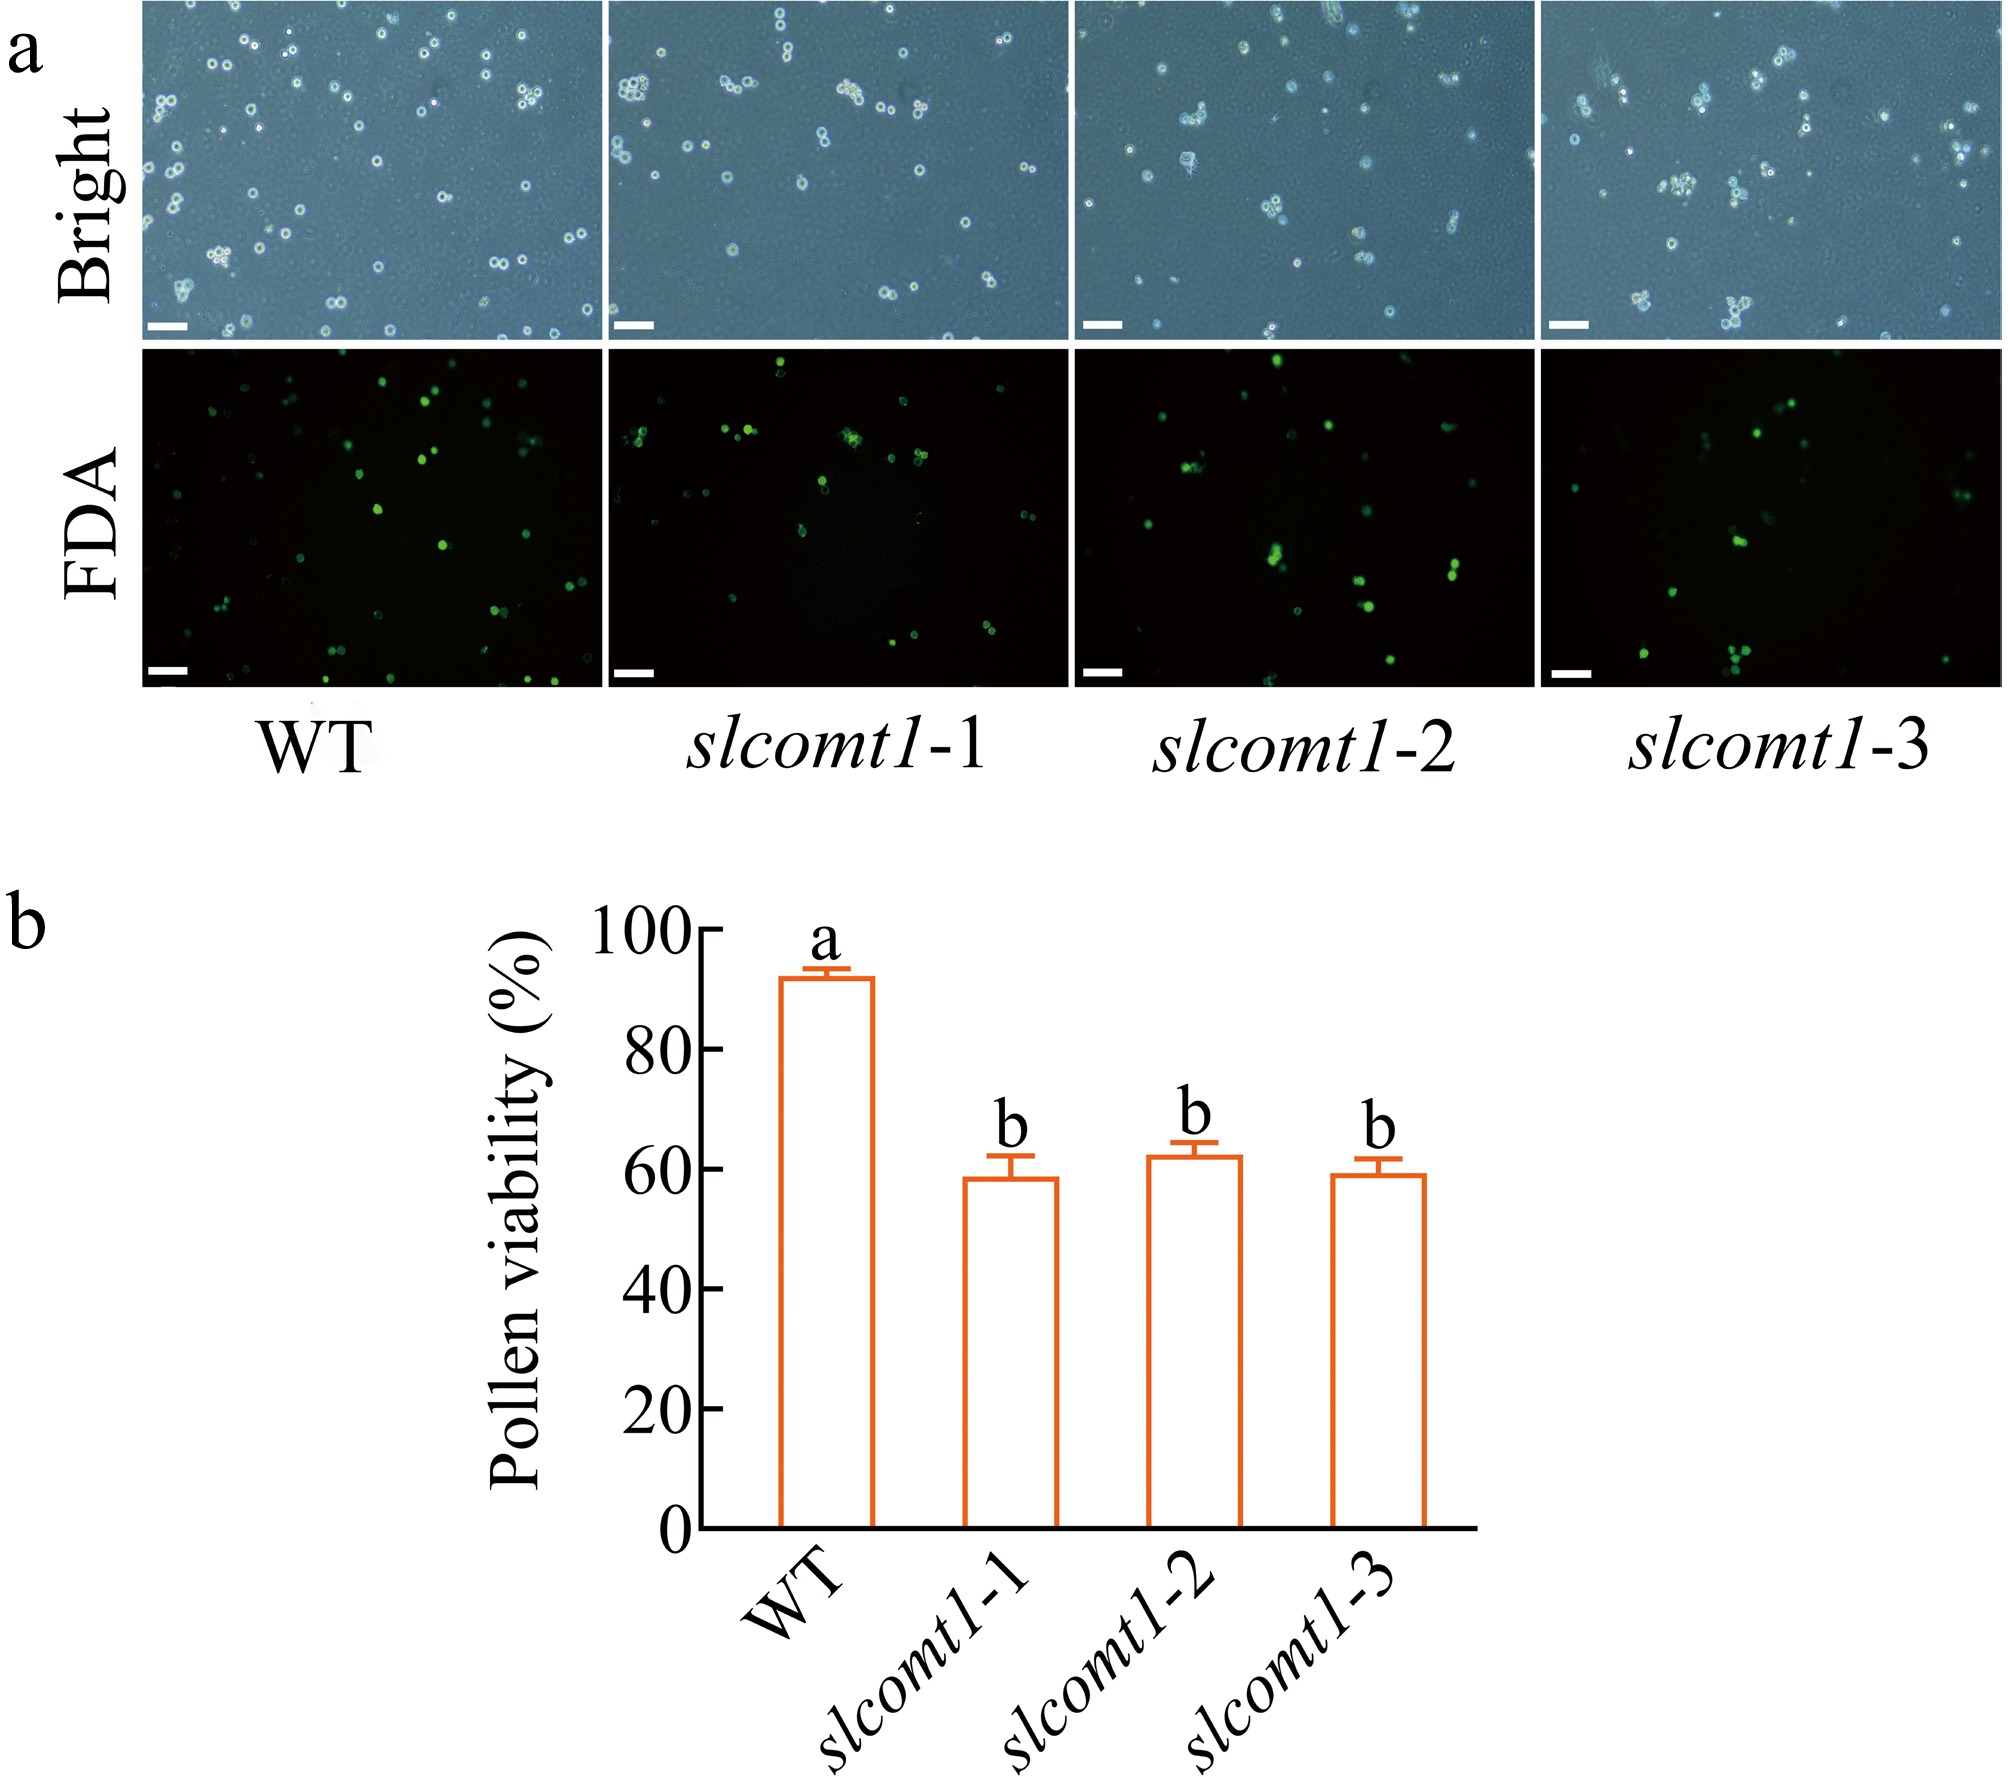
Figure 3.
SlCOMT1 gene deletion impairs pollen viability. (a) Fluorescein diacetate (FDA) staining reveals reduced metabolic activity in mutant pollen. Pollen from WT and three independent slcomt1 lines (#1−#3) at anthesis. Viable pollen with intact esterase activity fluoresce green. (b) Quantitative loss of pollen viability correlates with fruit set failure. Viability calculated as (fluorescent grains/total grains) × 100%. Bar = 100 μm. Plotted values are mean ± standard deviation (≥ 200 grains scored per genotype across, n = three biological replicates), separated using Duncan's multiple range test (p < 0.05); means with different lower-case letters represent significant differences.
-
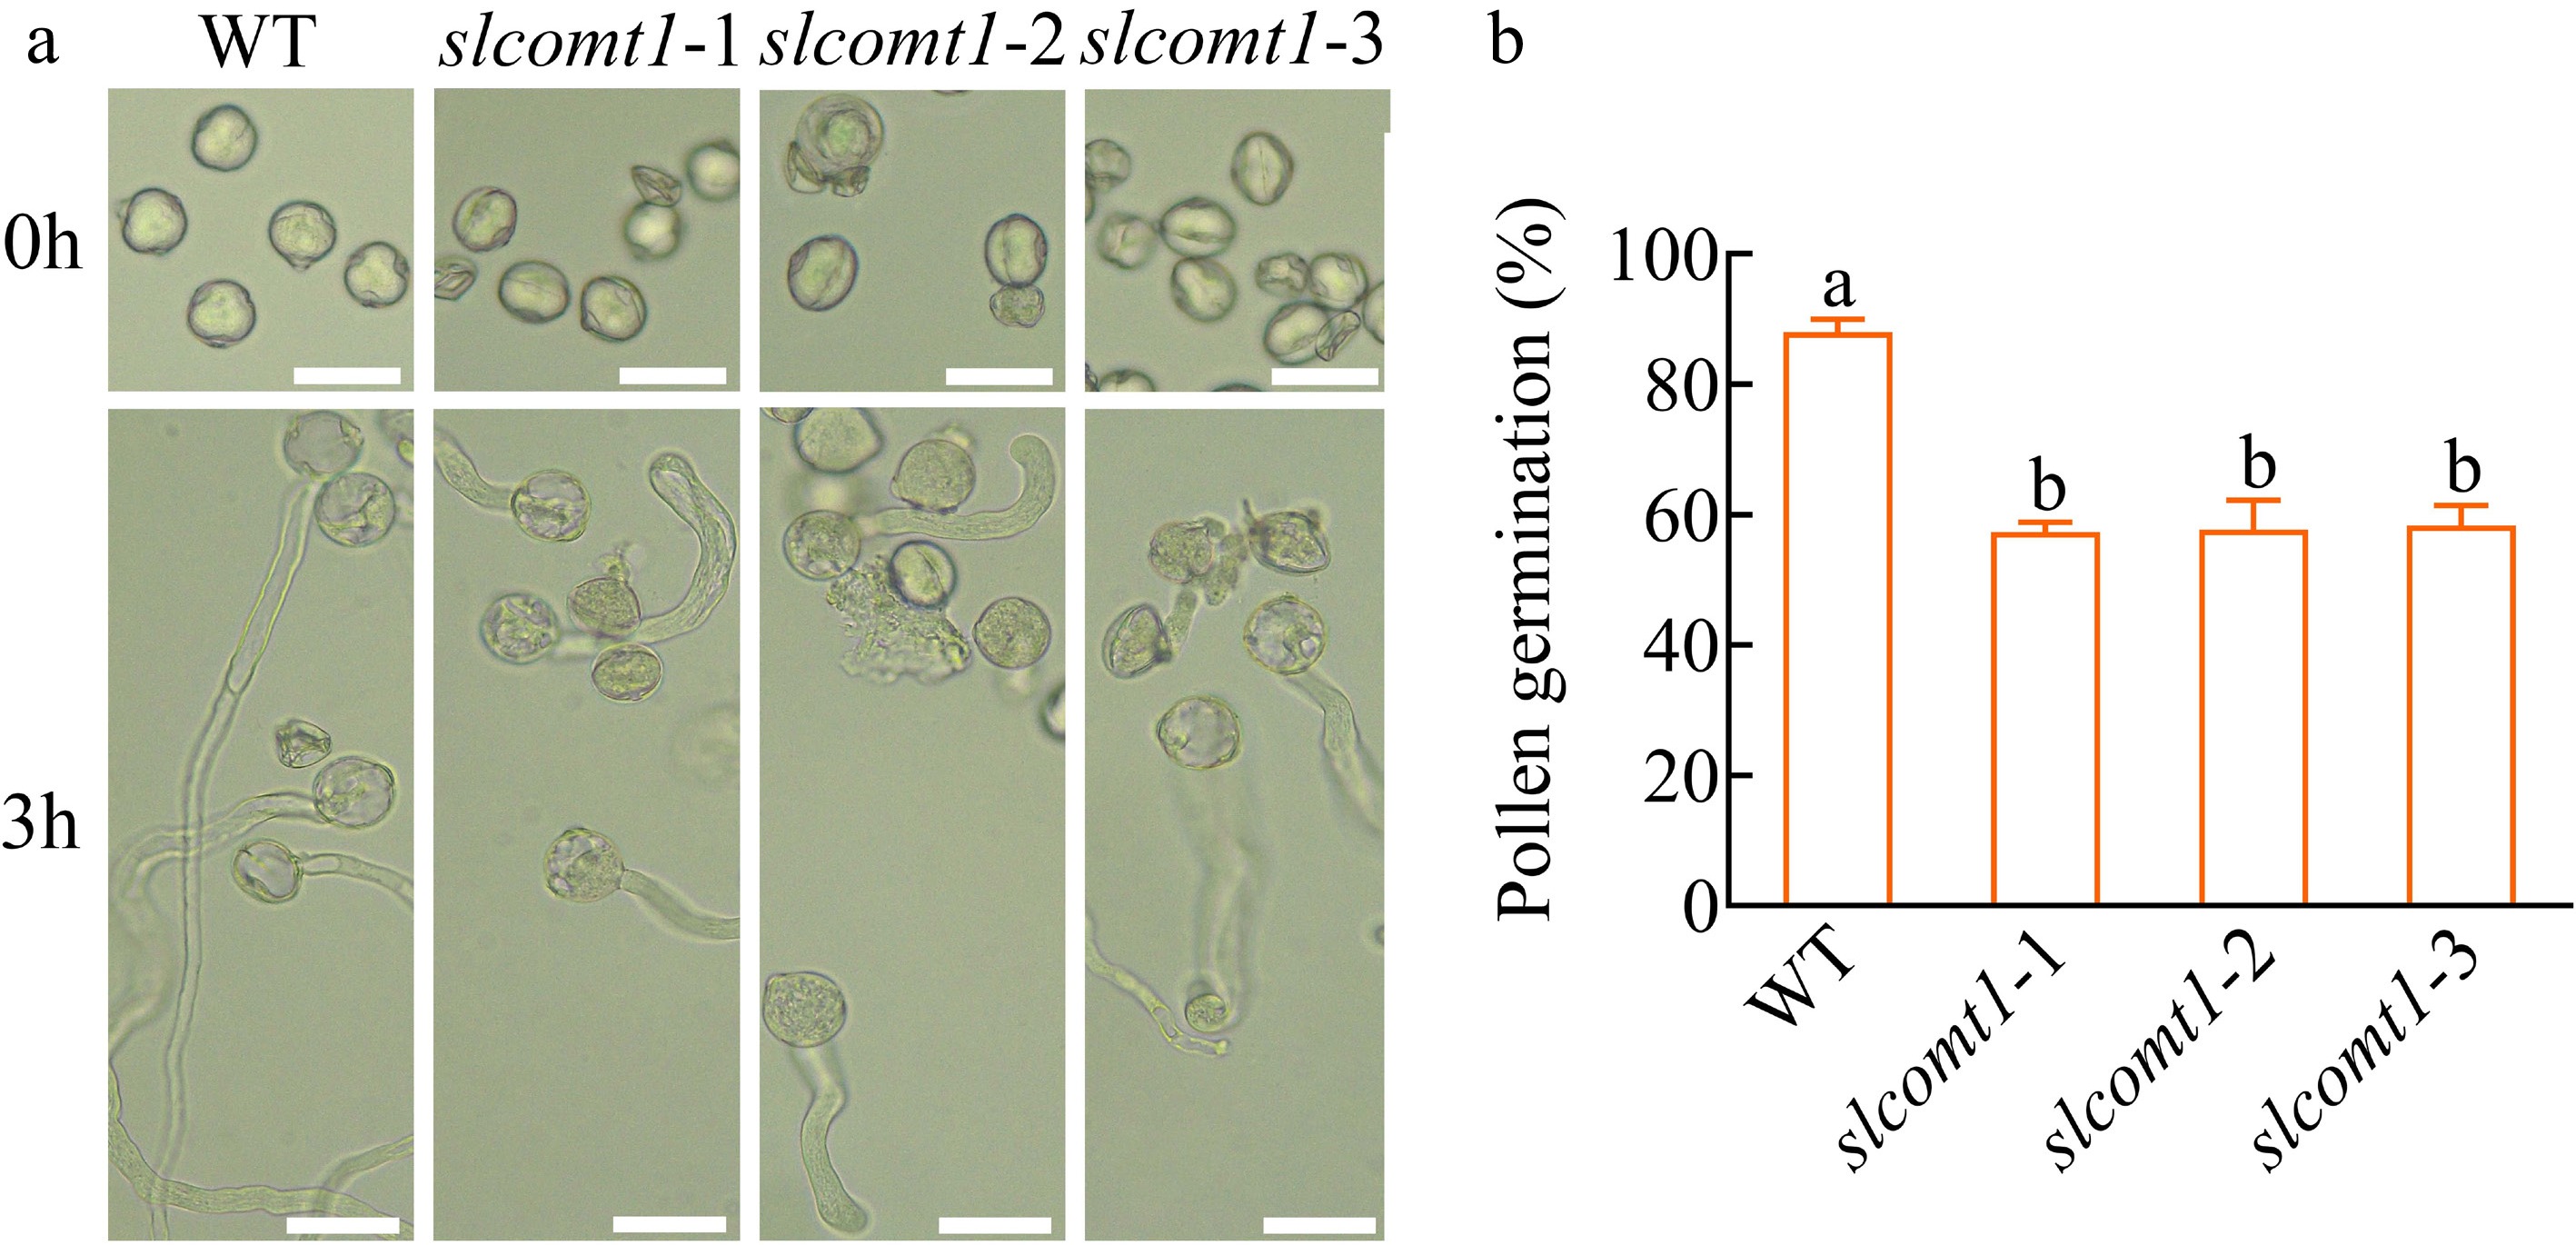
Figure 4.
SlCOMT1 gene deletion suppresses in vitro pollen germination. (a) SlCOMT1 gene deletion impairs pollen tube emergence in vitro. Pollen from WT and three independent slcomt1 lines (#1−#3) germinated for 3 h on solid medium. (b) Quantitative defect in pollen germination efficiency. Bar = 50 μm. Plotted values are mean ± standard deviation (≥ 200 grains scored per genotype across, n = three biological replicates), separated using Duncan's multiple range test (p < 0.05); means with different lower-case letters represent significant differences.
-
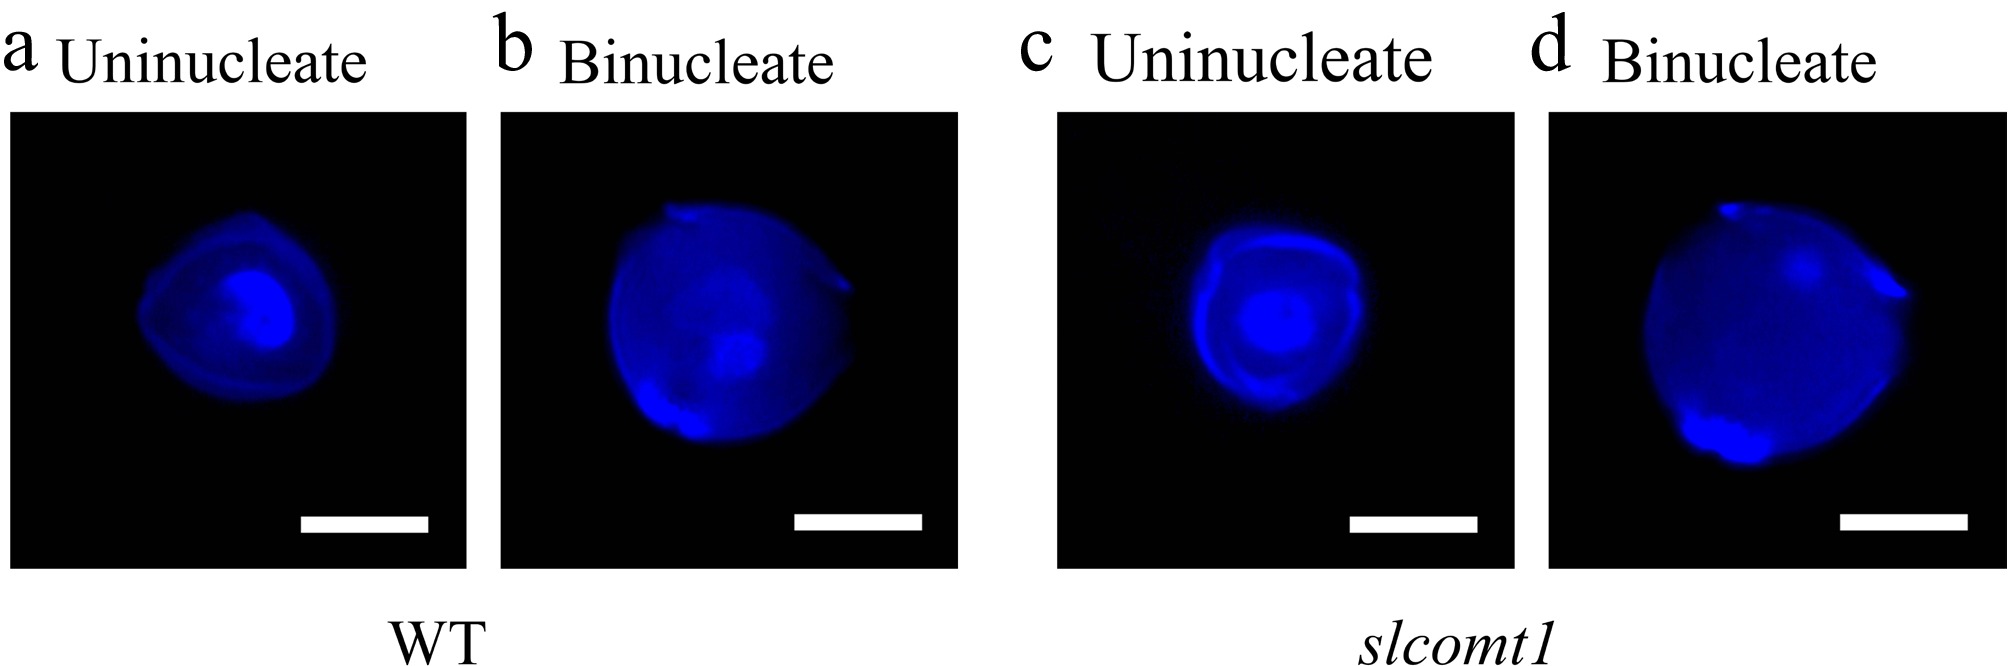
Figure 5.
SlCOMT1 gene deletion disrupts nuclear division during microspore transition from uninucleate to binucleate stage. (a), (b) Normal nuclear progression in WT microspores. DAPI staining of WT microspores. (c), (d) Aberrant nuclear behavior in slcomt1 mutants. Bar = 10 μm.
-
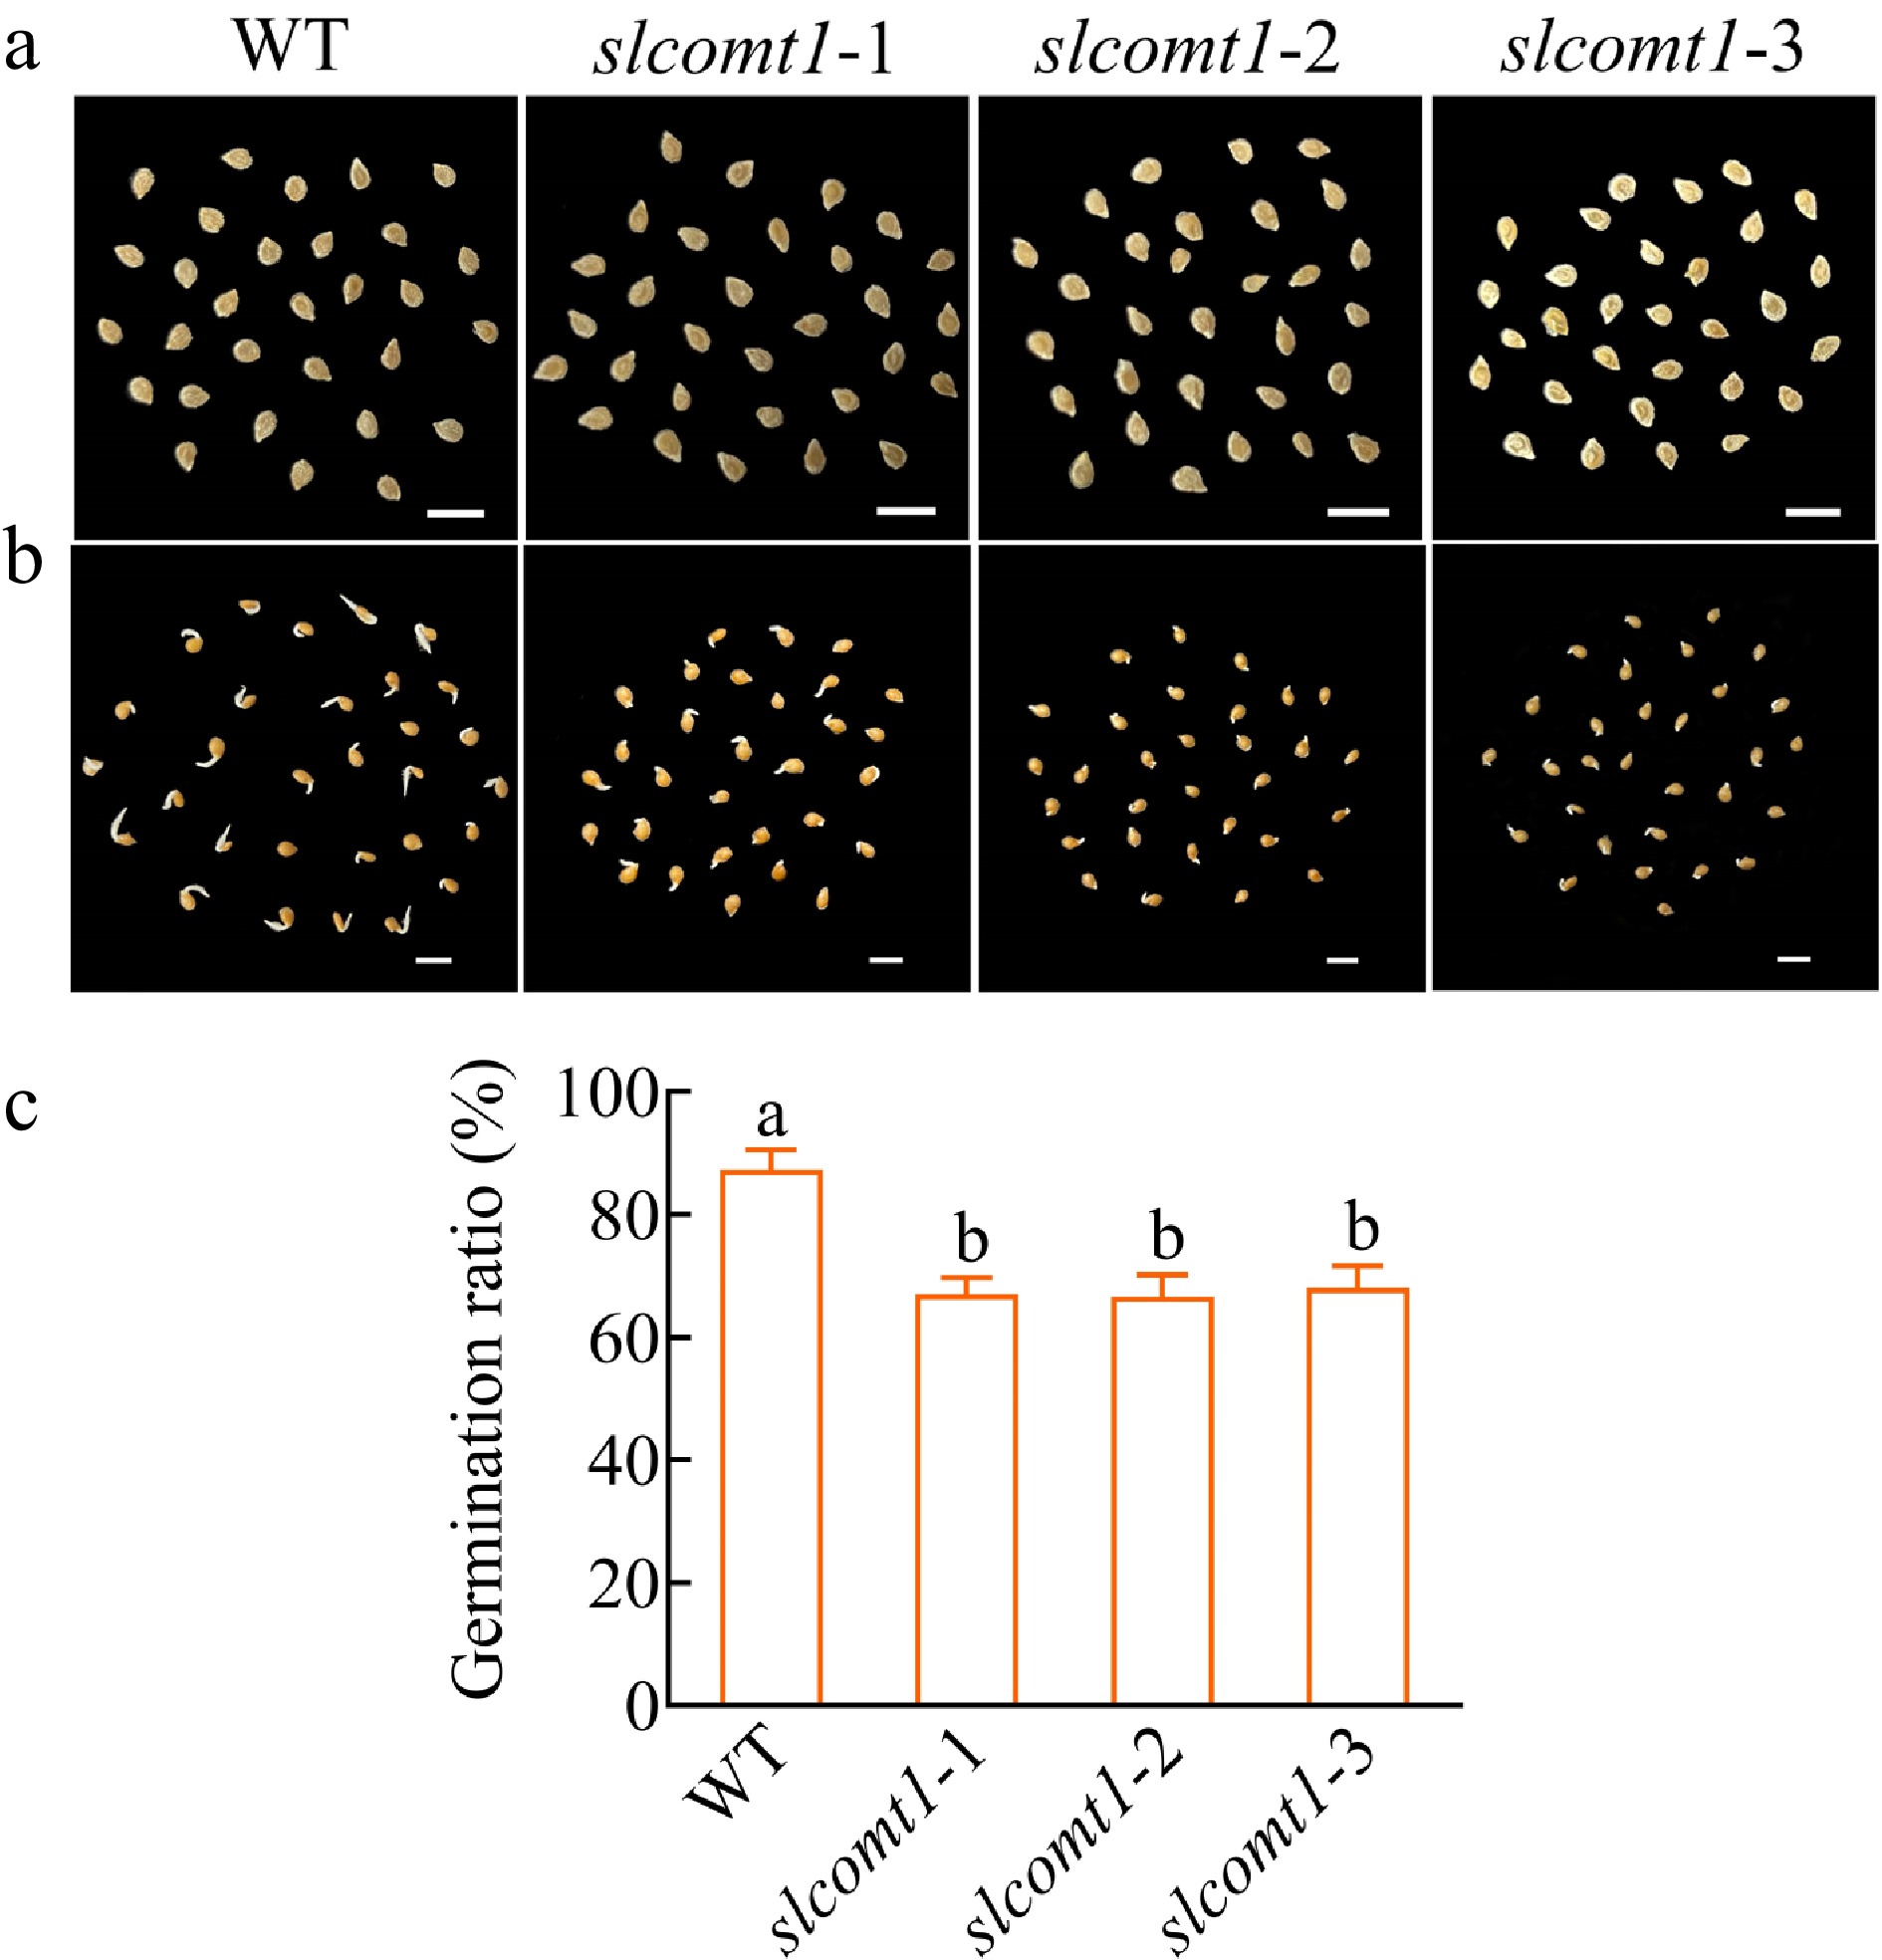
Figure 6.
SlCOMT1 gene deletion impairs seed germination. (a) Phenotype of seeds from WT and three independent slcomt1 lines (#1−#3). (b) Delayed radicle emergence in SlCOMT1 gene deletion during germination. Seeds stratified and germinated on filter paper. Day 5 phenotypes. (c) SlCOMT1 gene deletion reduces seed germination rate. Bar = 5 mm. Plotted values are mean ± standard deviation (n = three biological replicates), separated using Duncan's multiple range test (p < 0.05); means with different lower-case letters represent significant differences.
-
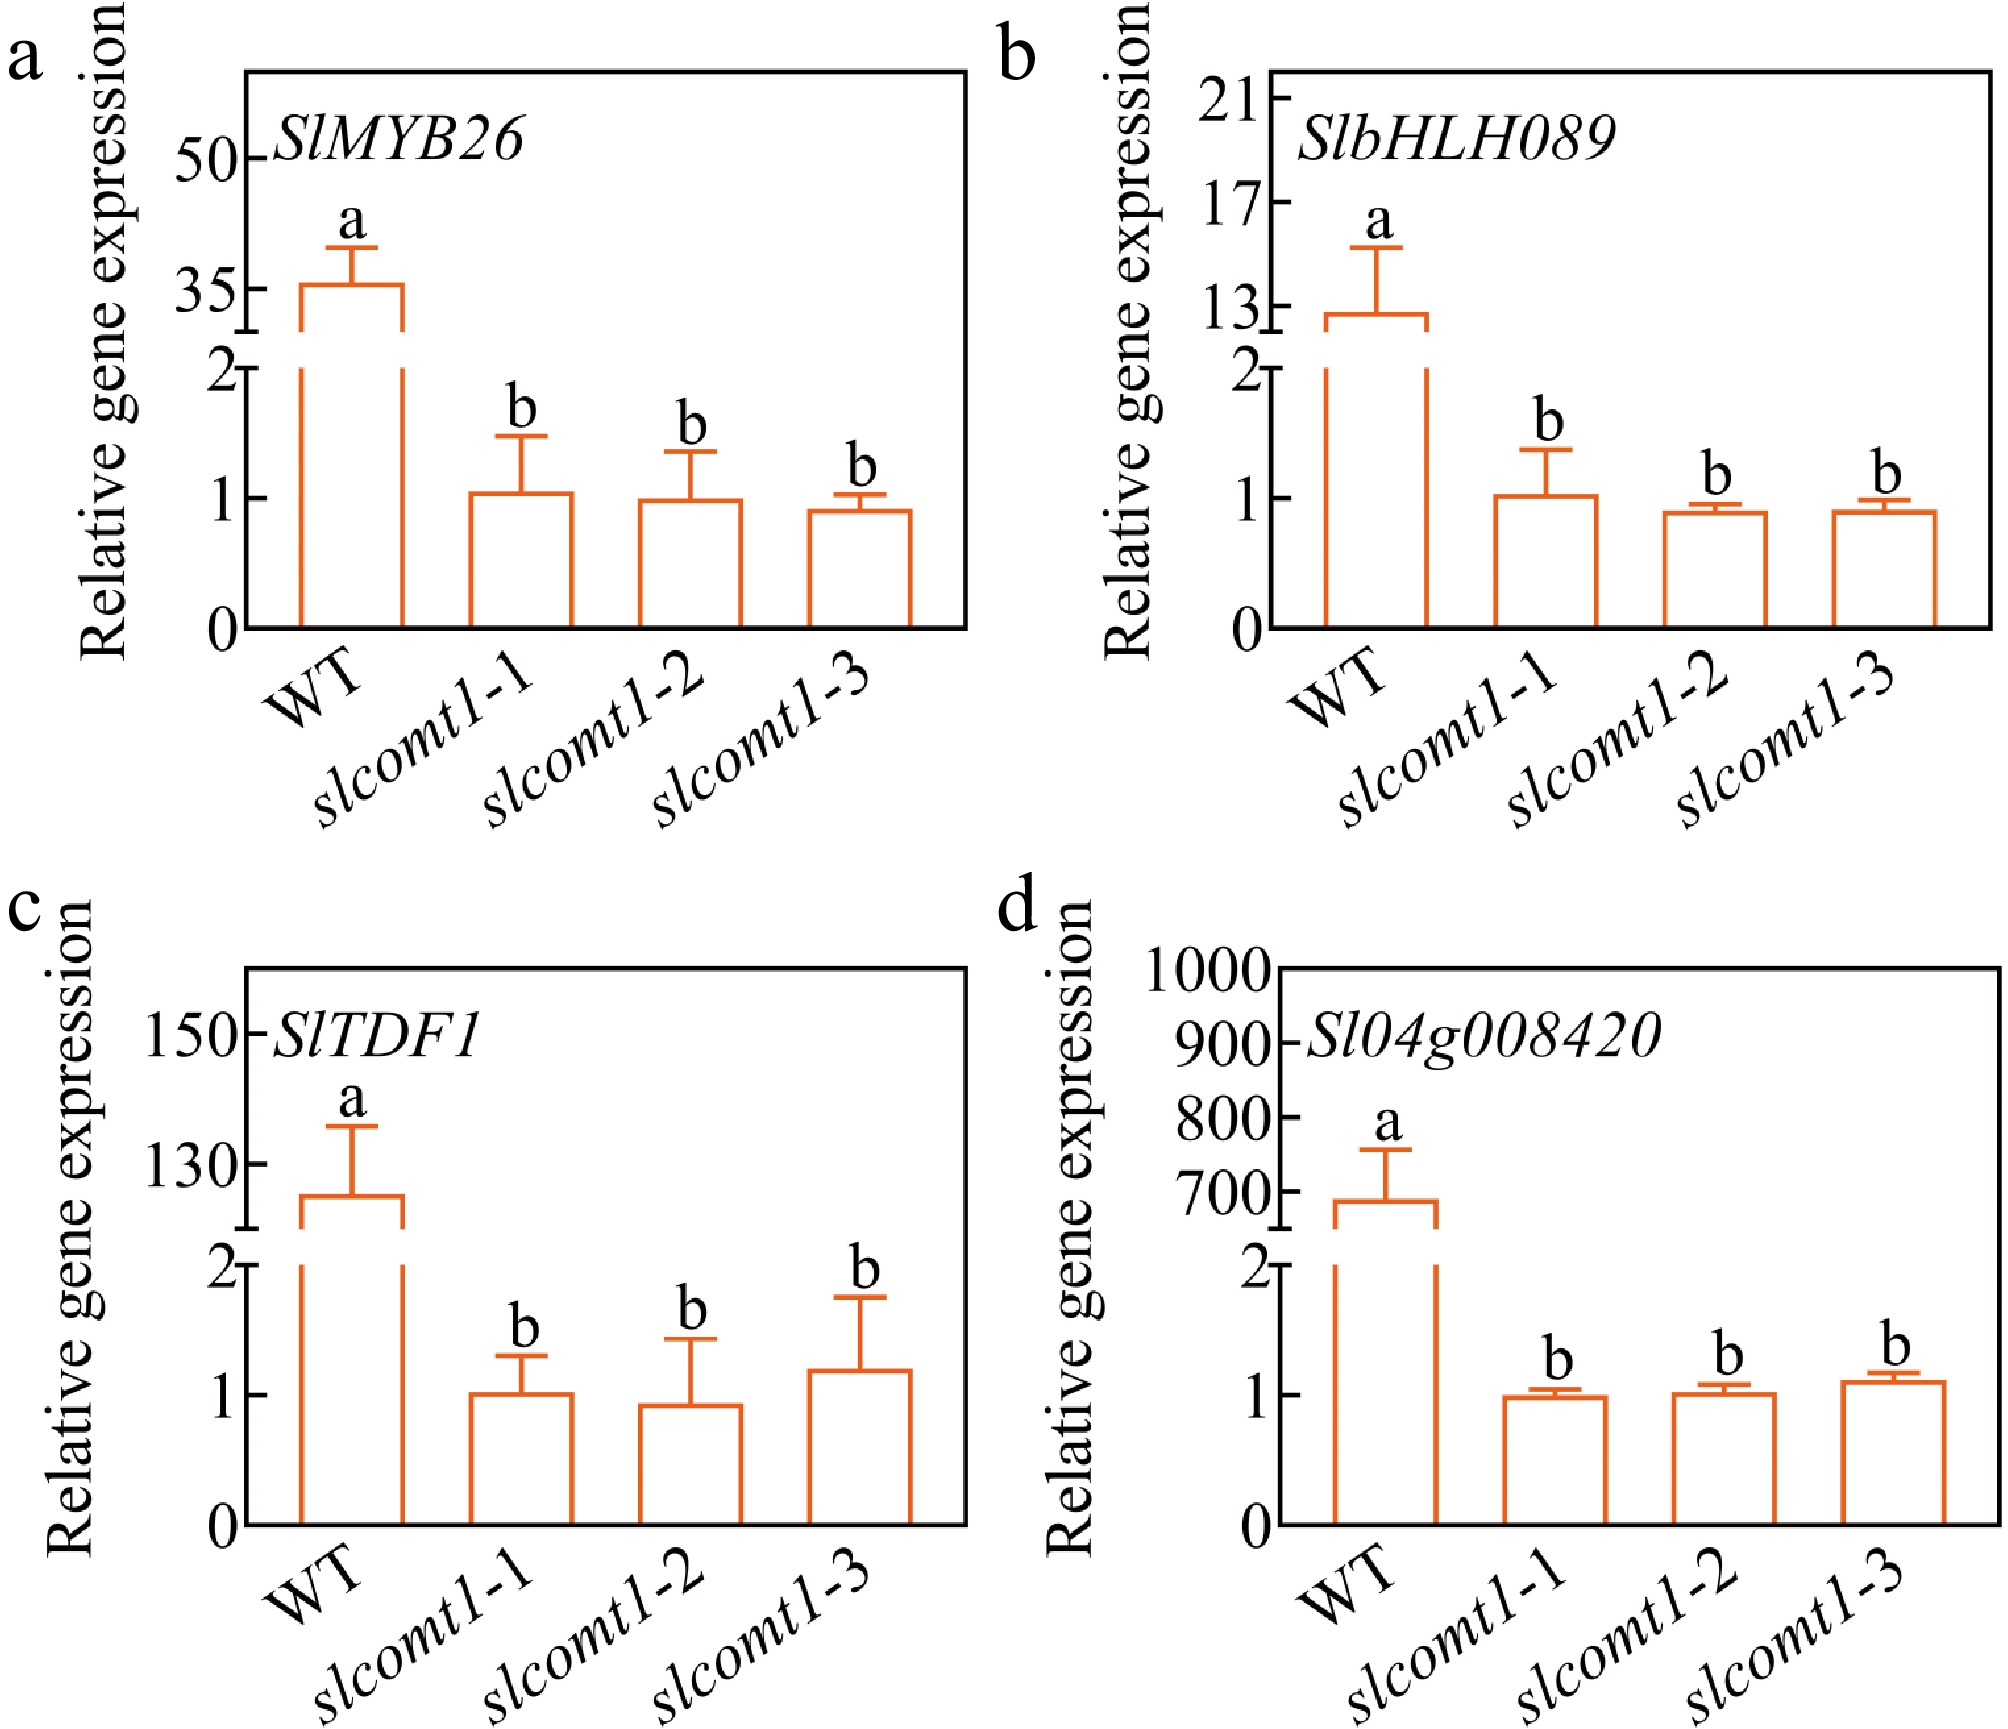
Figure 7.
Expression levels of pollen development-associated regulatory factors. Plotted values are mean ± standard deviation (n = three biological replicates), separated using Duncan's multiple range test (p < 0.05); means with different lower-case letters represent significant differences.
Figures
(7)
Tables
(0)