-
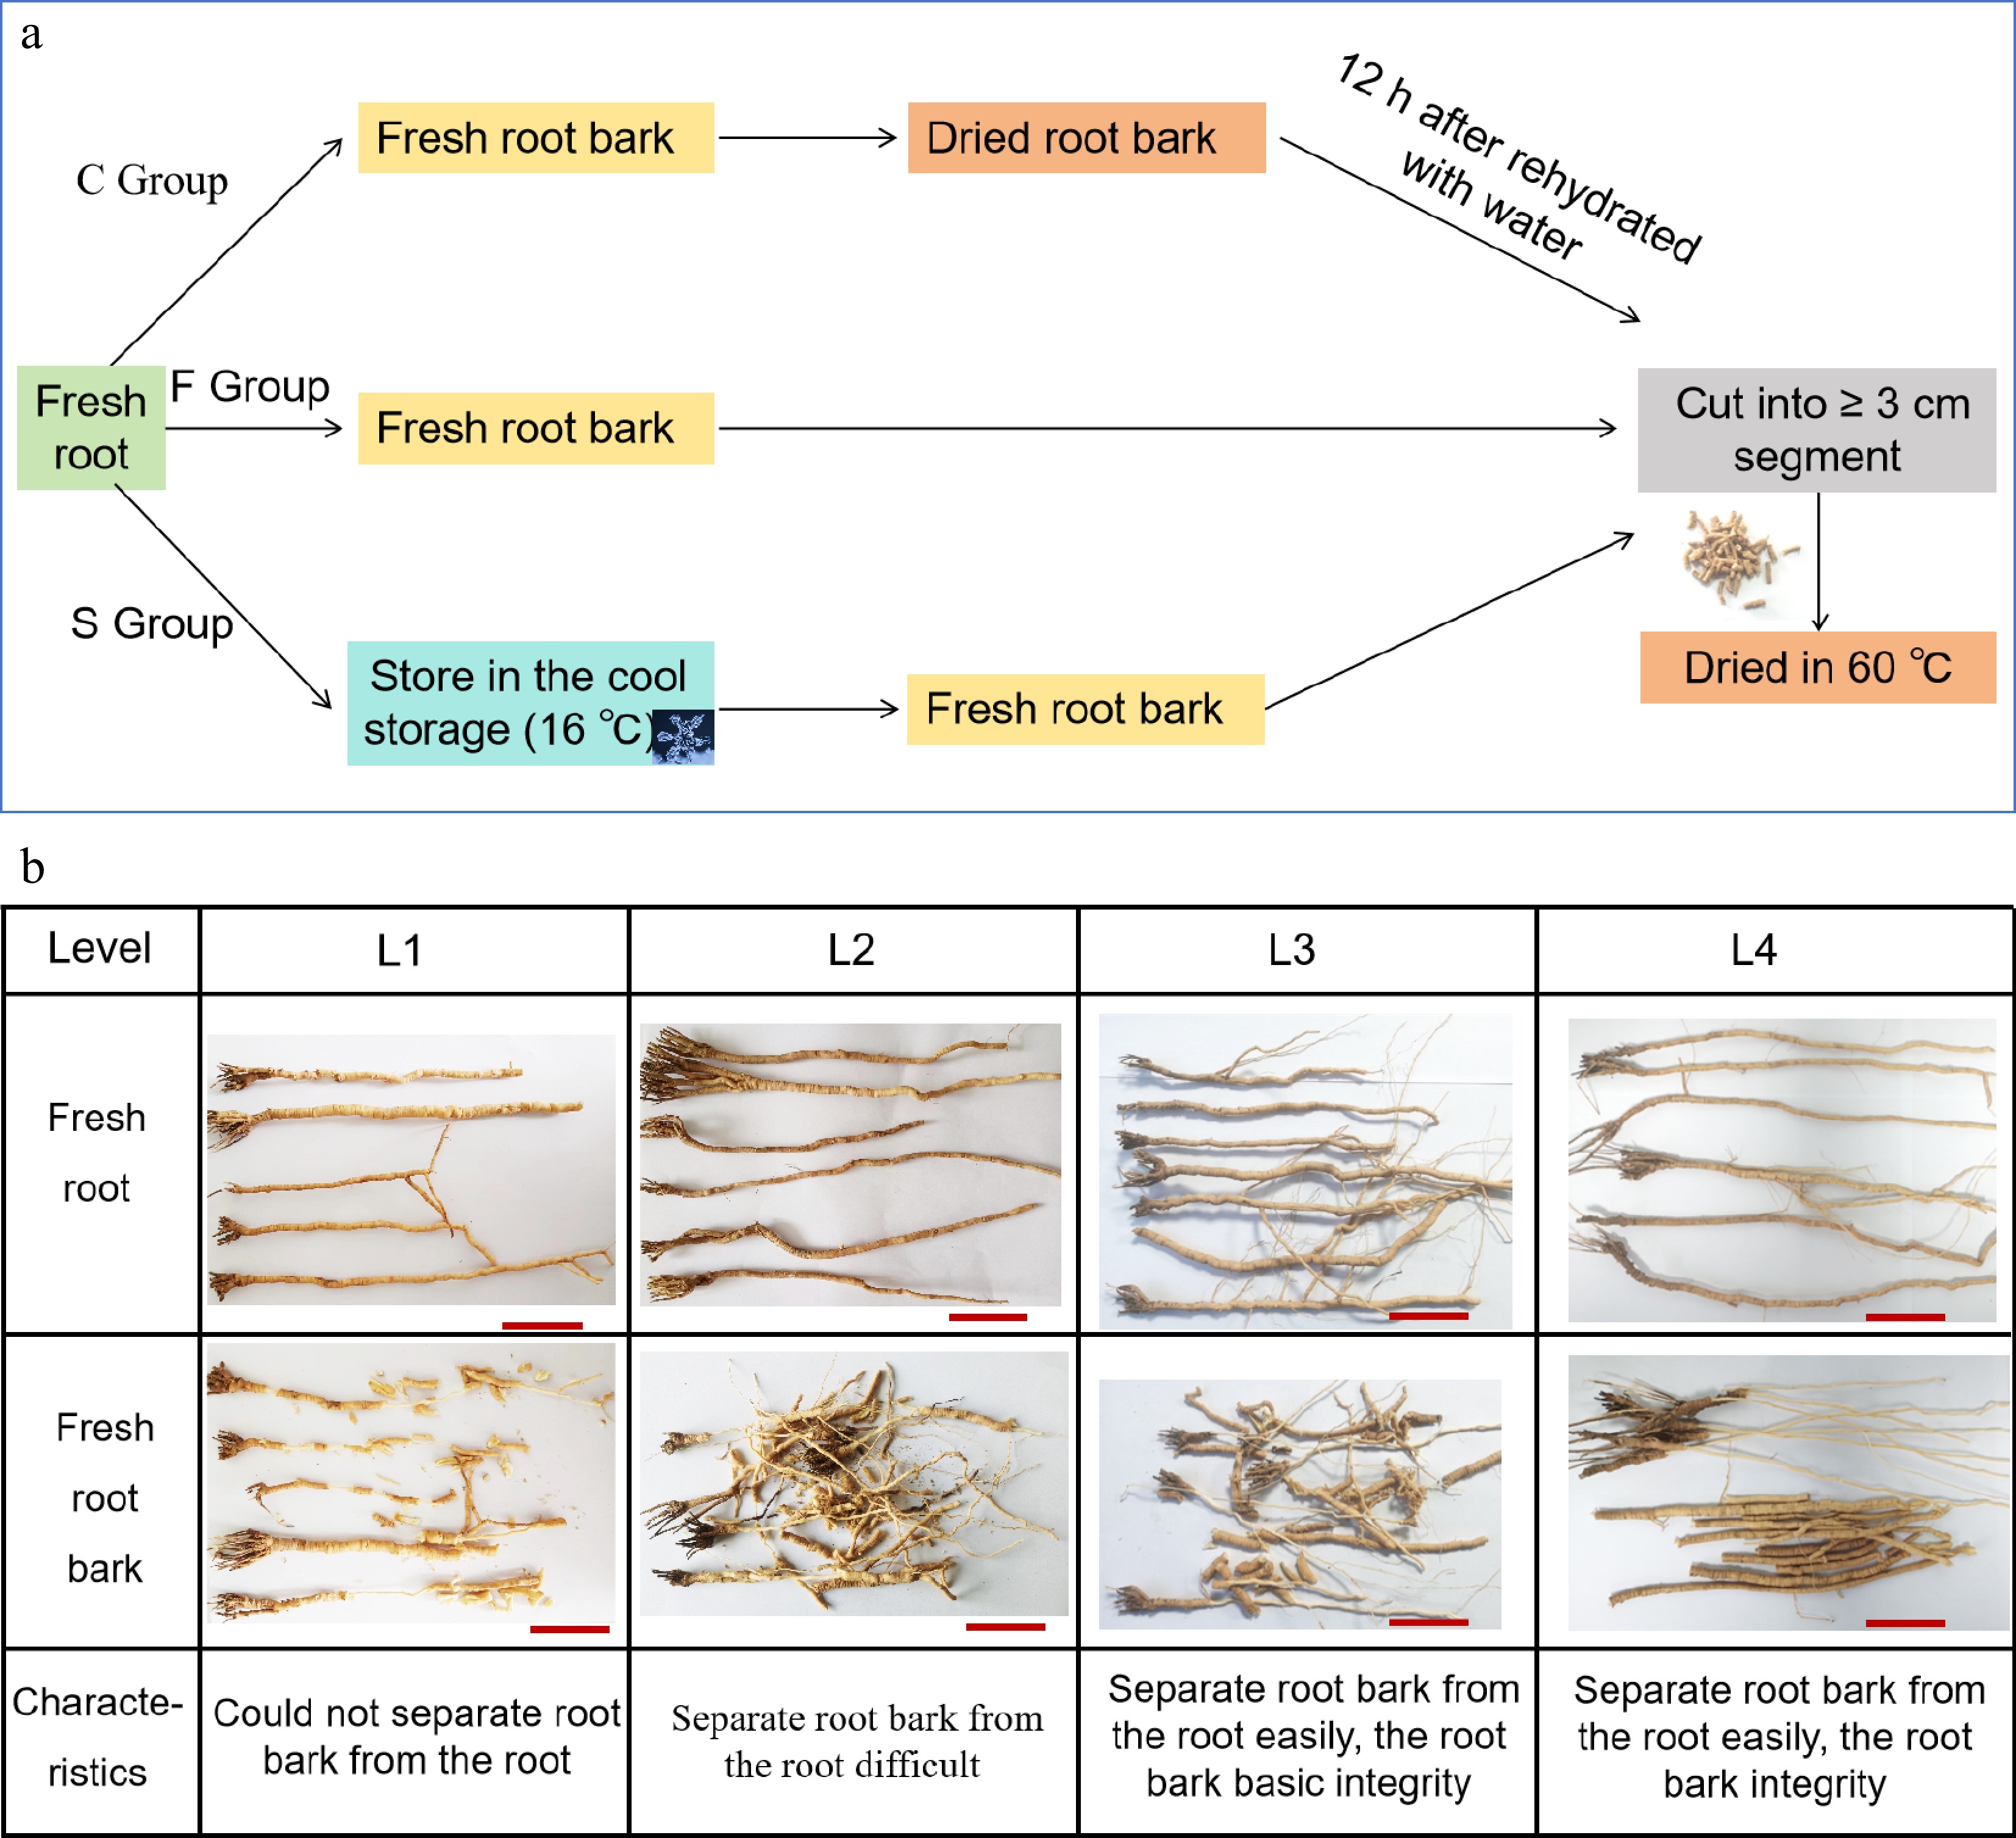
Figure 1.
(a) Preparation of samples for different post-harvest processing methods, (b) and the standards of the fresh root-bark.
-
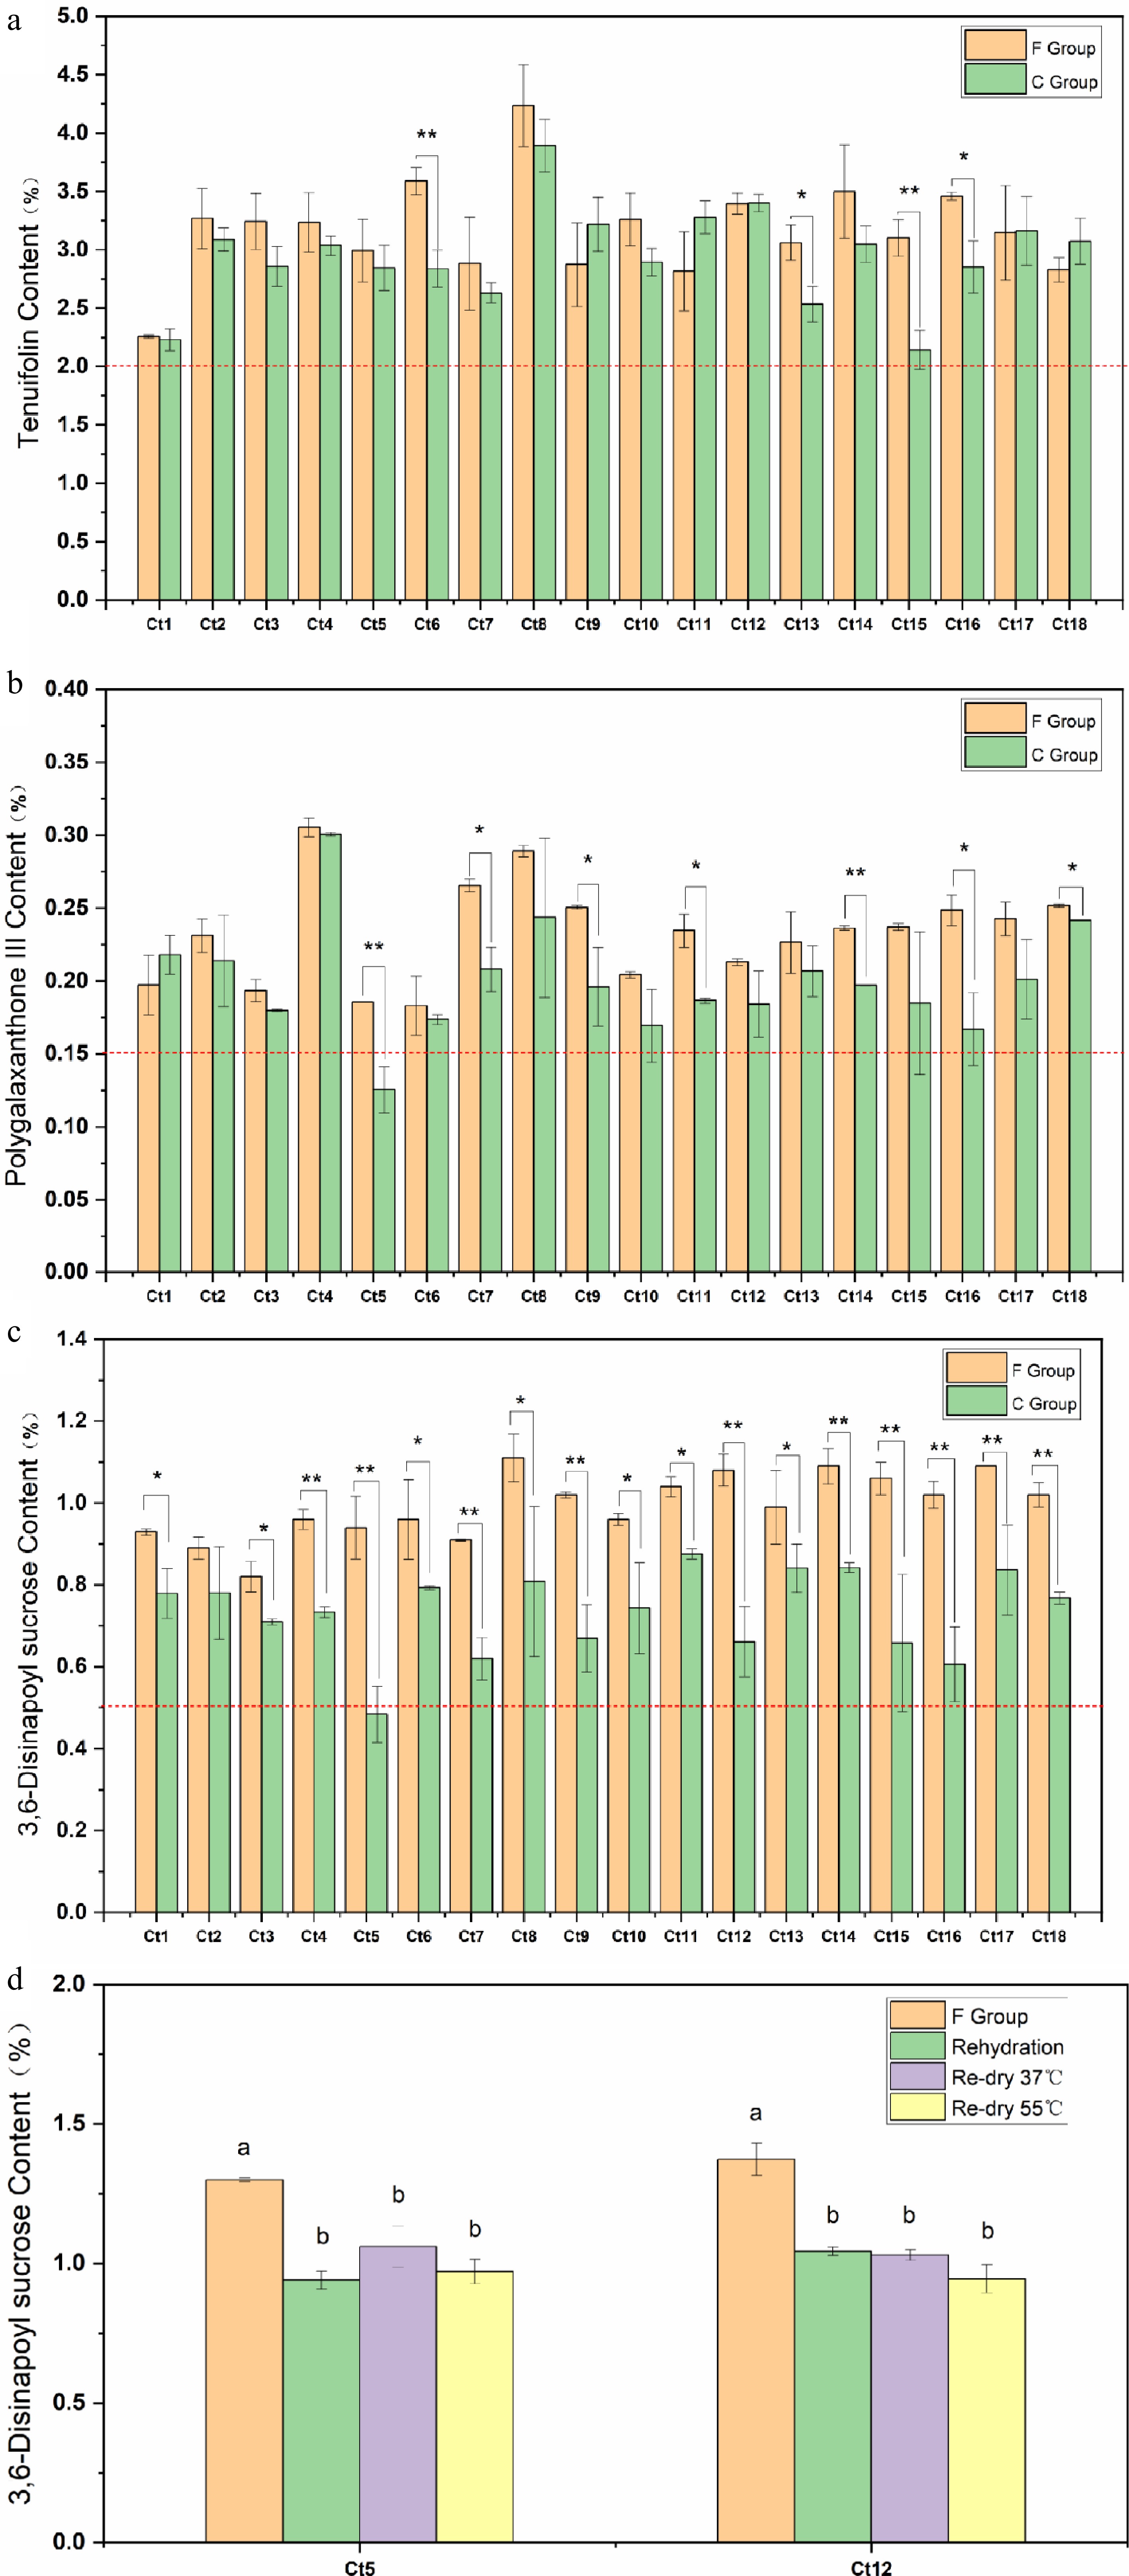
Figure 2.
Content of (a) TF, (b) Polygalaxanthone III, and (c) 3,6-disinapoyl sucrose in F group and C group. (d) Rehydration reduced the content of 3,6-disinapoyl sucrose in P. tenuifolia root bark. Error bars represent the SD of three biological replicates. Different letters indicate significant differences (p < 0.05).
-
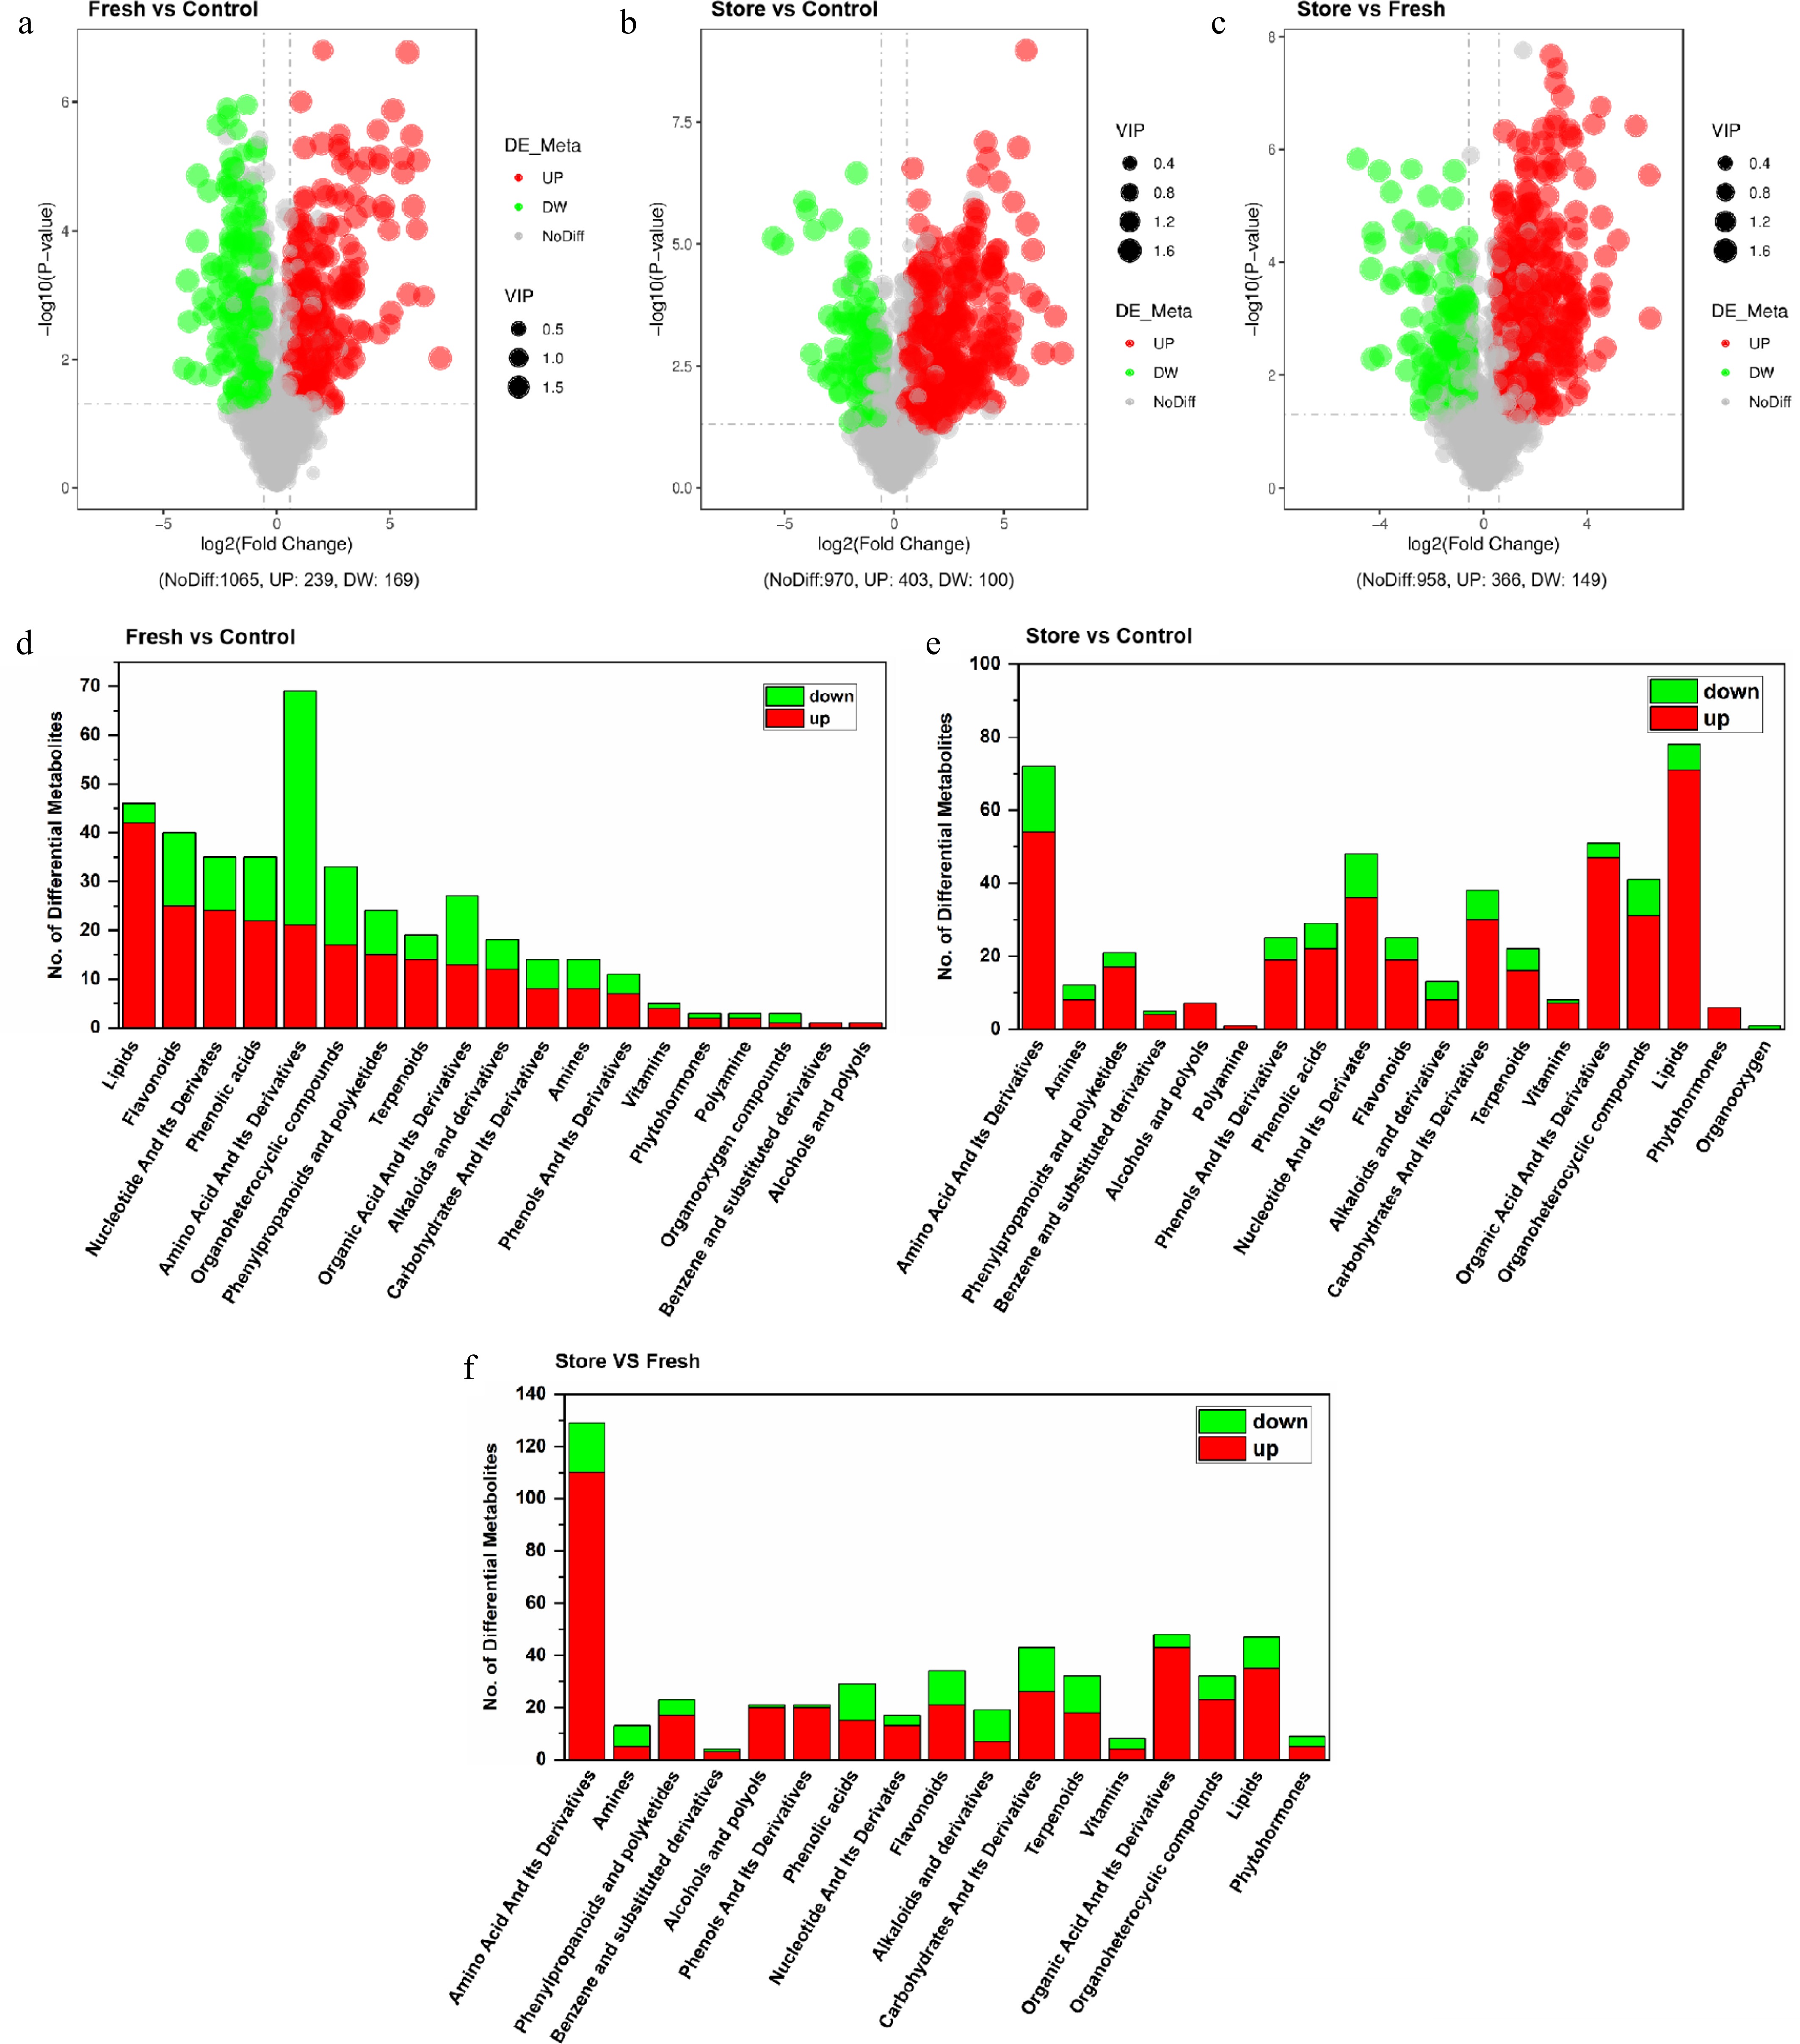
Figure 3.
The different metabolites in P. tenuifolia root-barks processed in three different post-harvest processing were identified and screened. The volcano maps exhibited the DMs between (a) F group and C group, (b) S group and C group, (c) S group and F group. The DMs were screened under the standards of Variable Importance in the Projection (VIP) > 1.0, FC > 1.5, or FC < 0.667 and T test p-value < 0.05. The DMs were displayed by classes between (d) F group and C group, (e) S group and C group, (f) S group and F group.
-
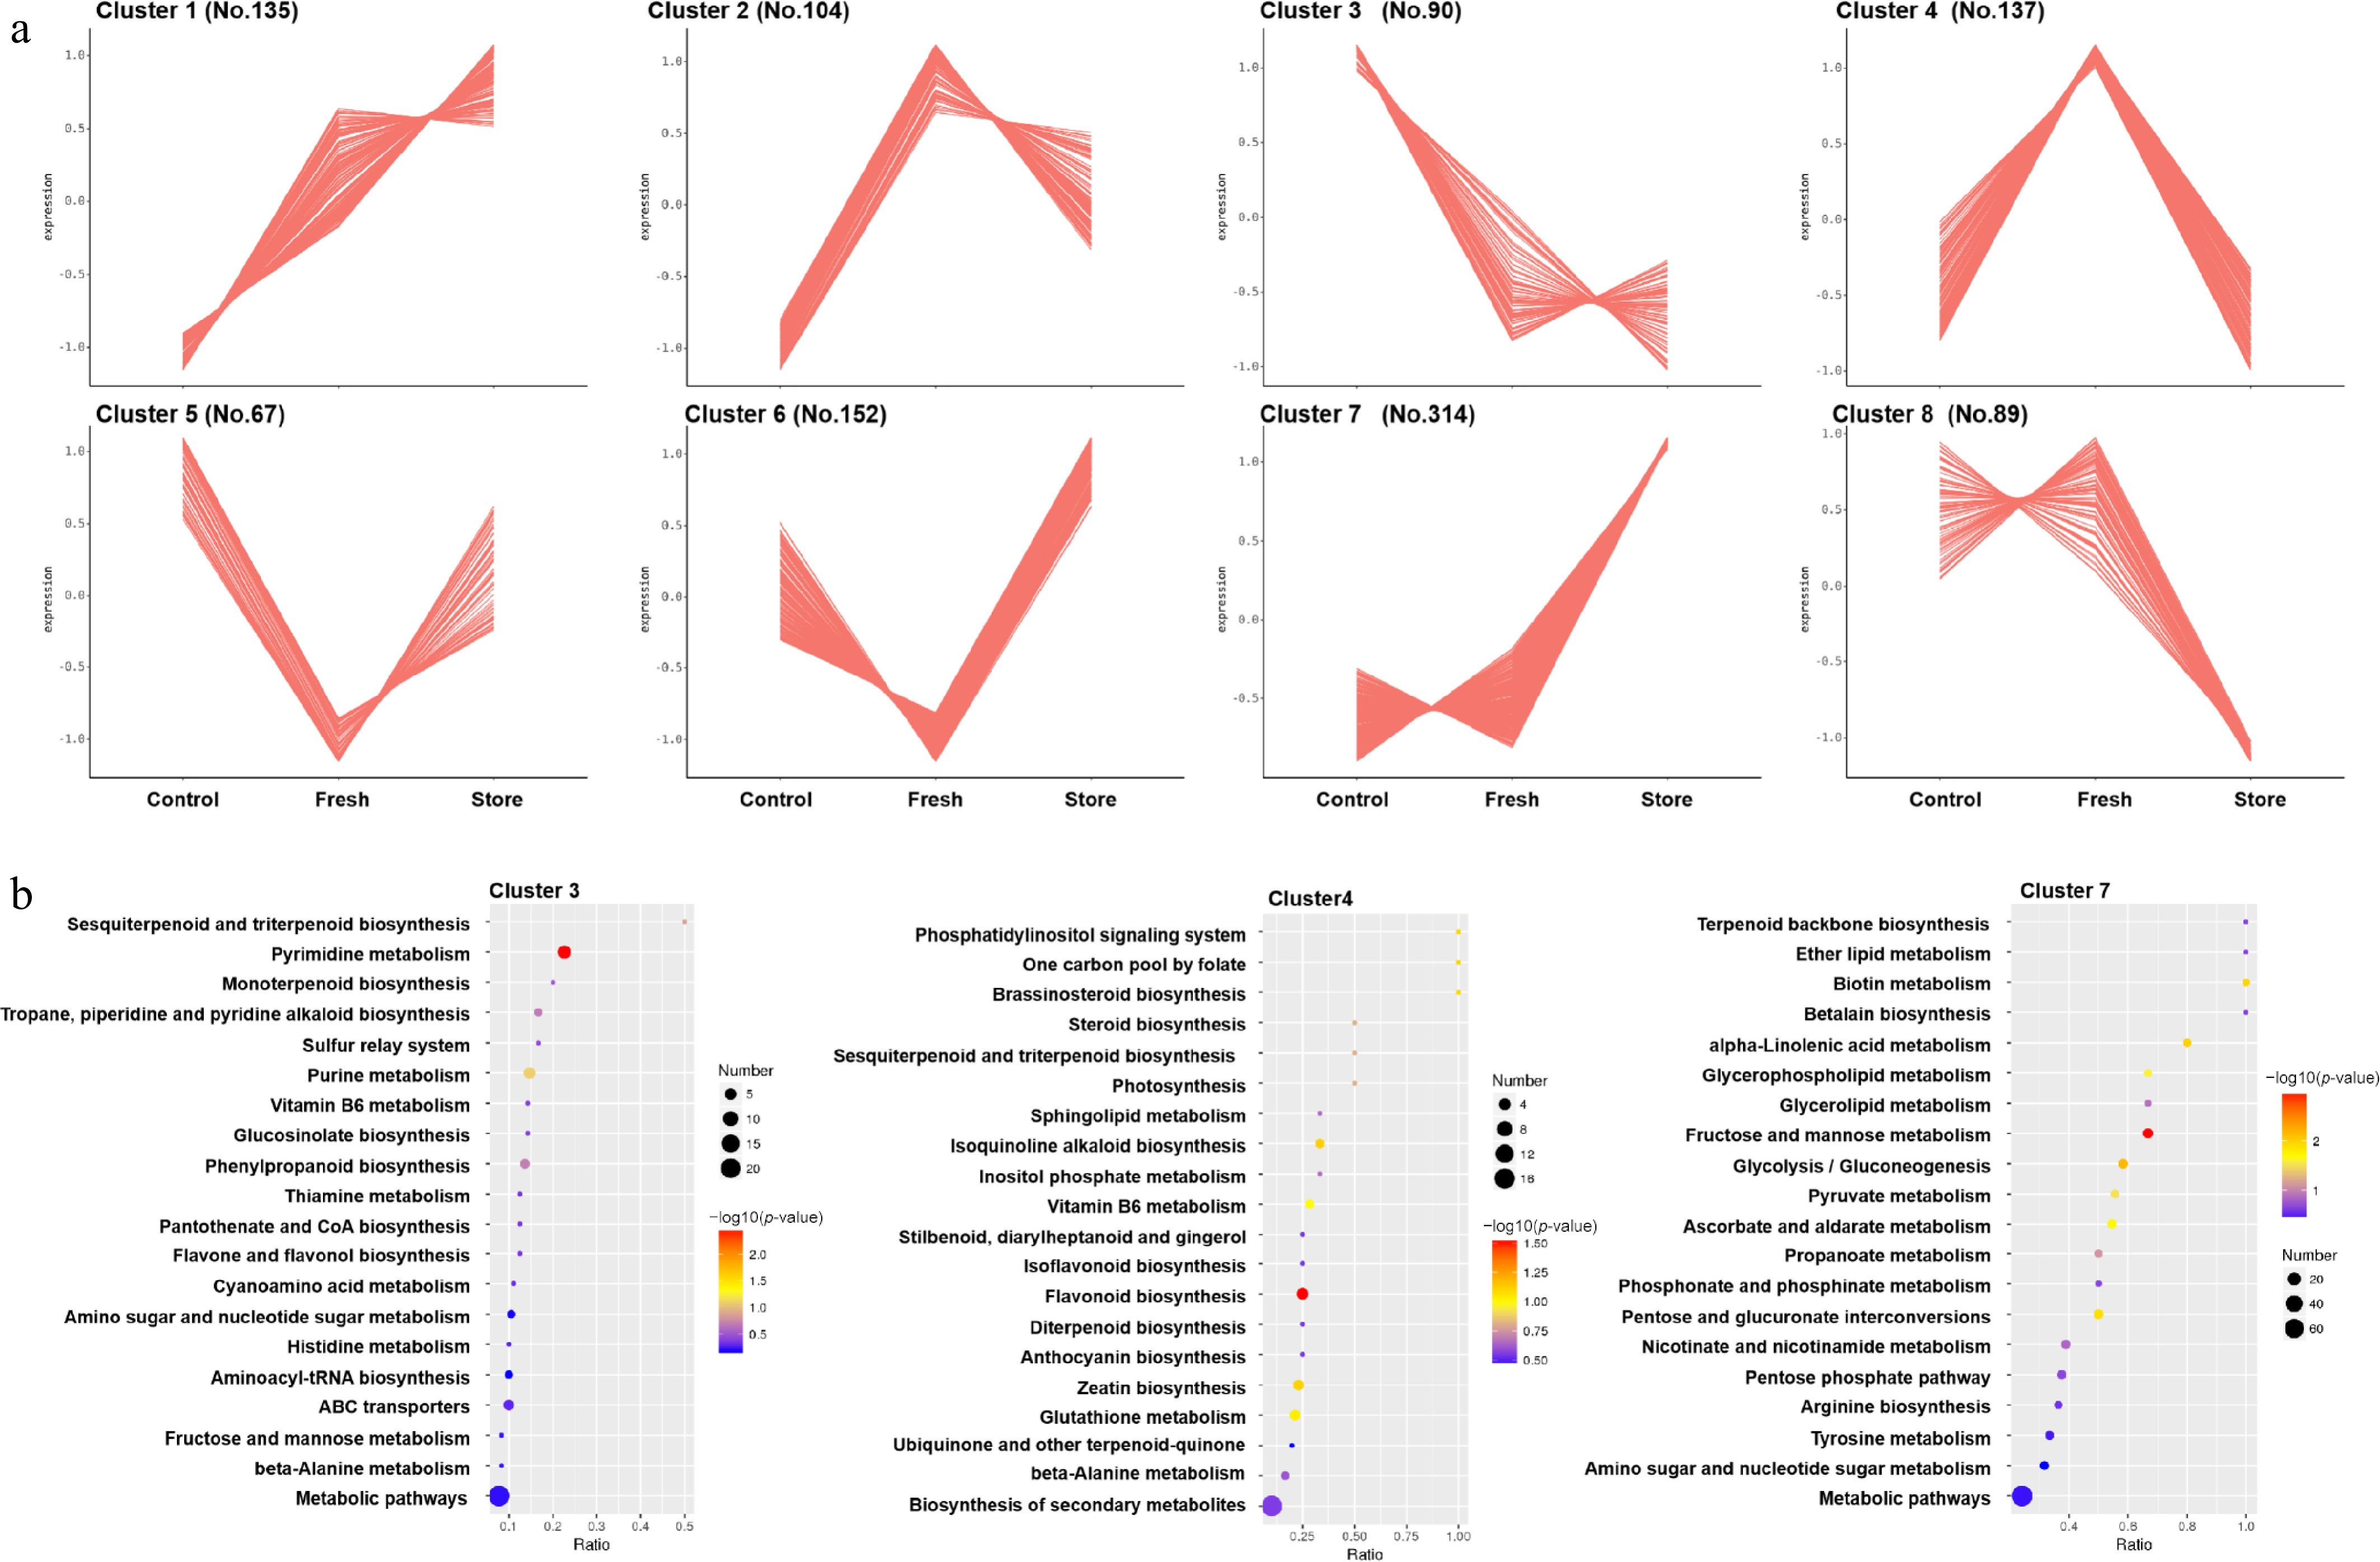
Figure 4.
K-means clustering analysis and KEGG analysis of the DM in the three different post-harvest processing. (a) Clusters of metabolites contents in response to the different post-harvest processing. No means the number of metabolites. (b) KEGG enrichment of the metabolites in cluster 3, cluster 4, and cluster 7. The color and the size of the point represents the p-value and the number of DMs in the corresponding path, respectively. An entire list of the p-value of the metabolites and the enriched KEGG pathway can be found in Supplementary Tables S8 and S9, respectively.
-
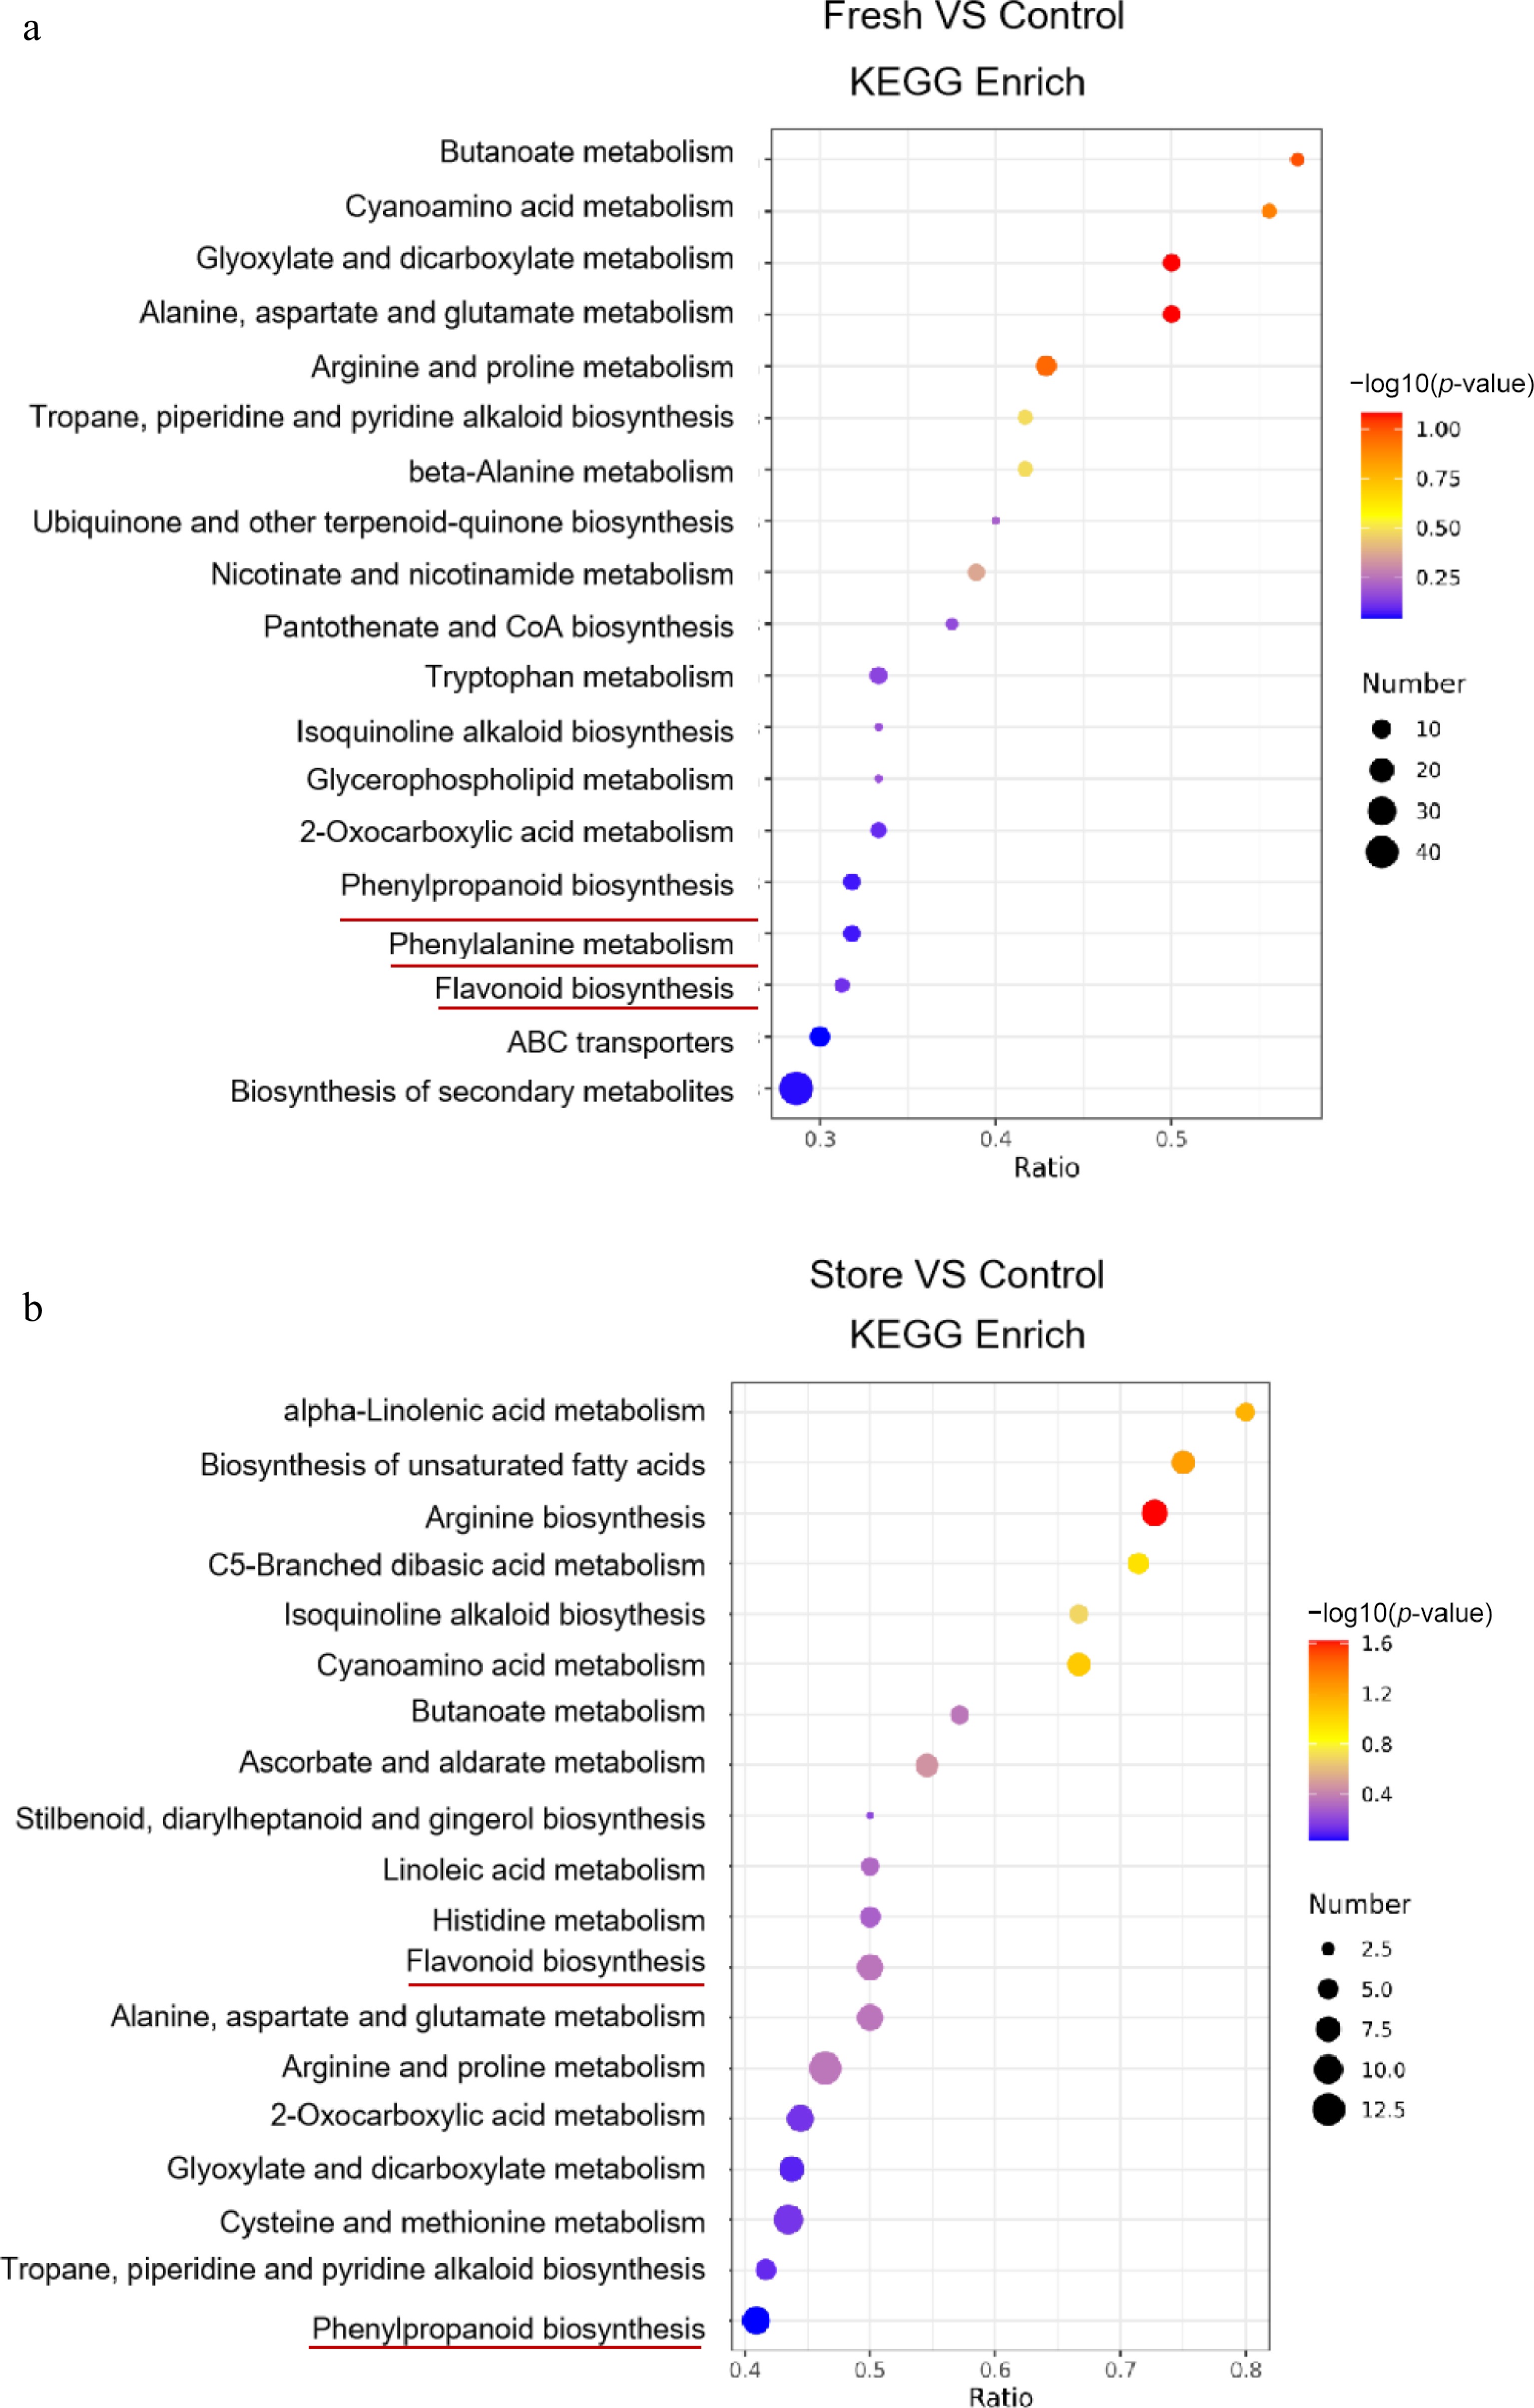
Figure 5.
The KEGG pathway enrichment is based on the DM in F group vs C group, and S group vs C group after removal of some pathways of primary metabolism or phytohormone. Number means the number of metabolites. The color and the size of the point represents the p-value and the number of DMs in the corresponding path, respectively.
-
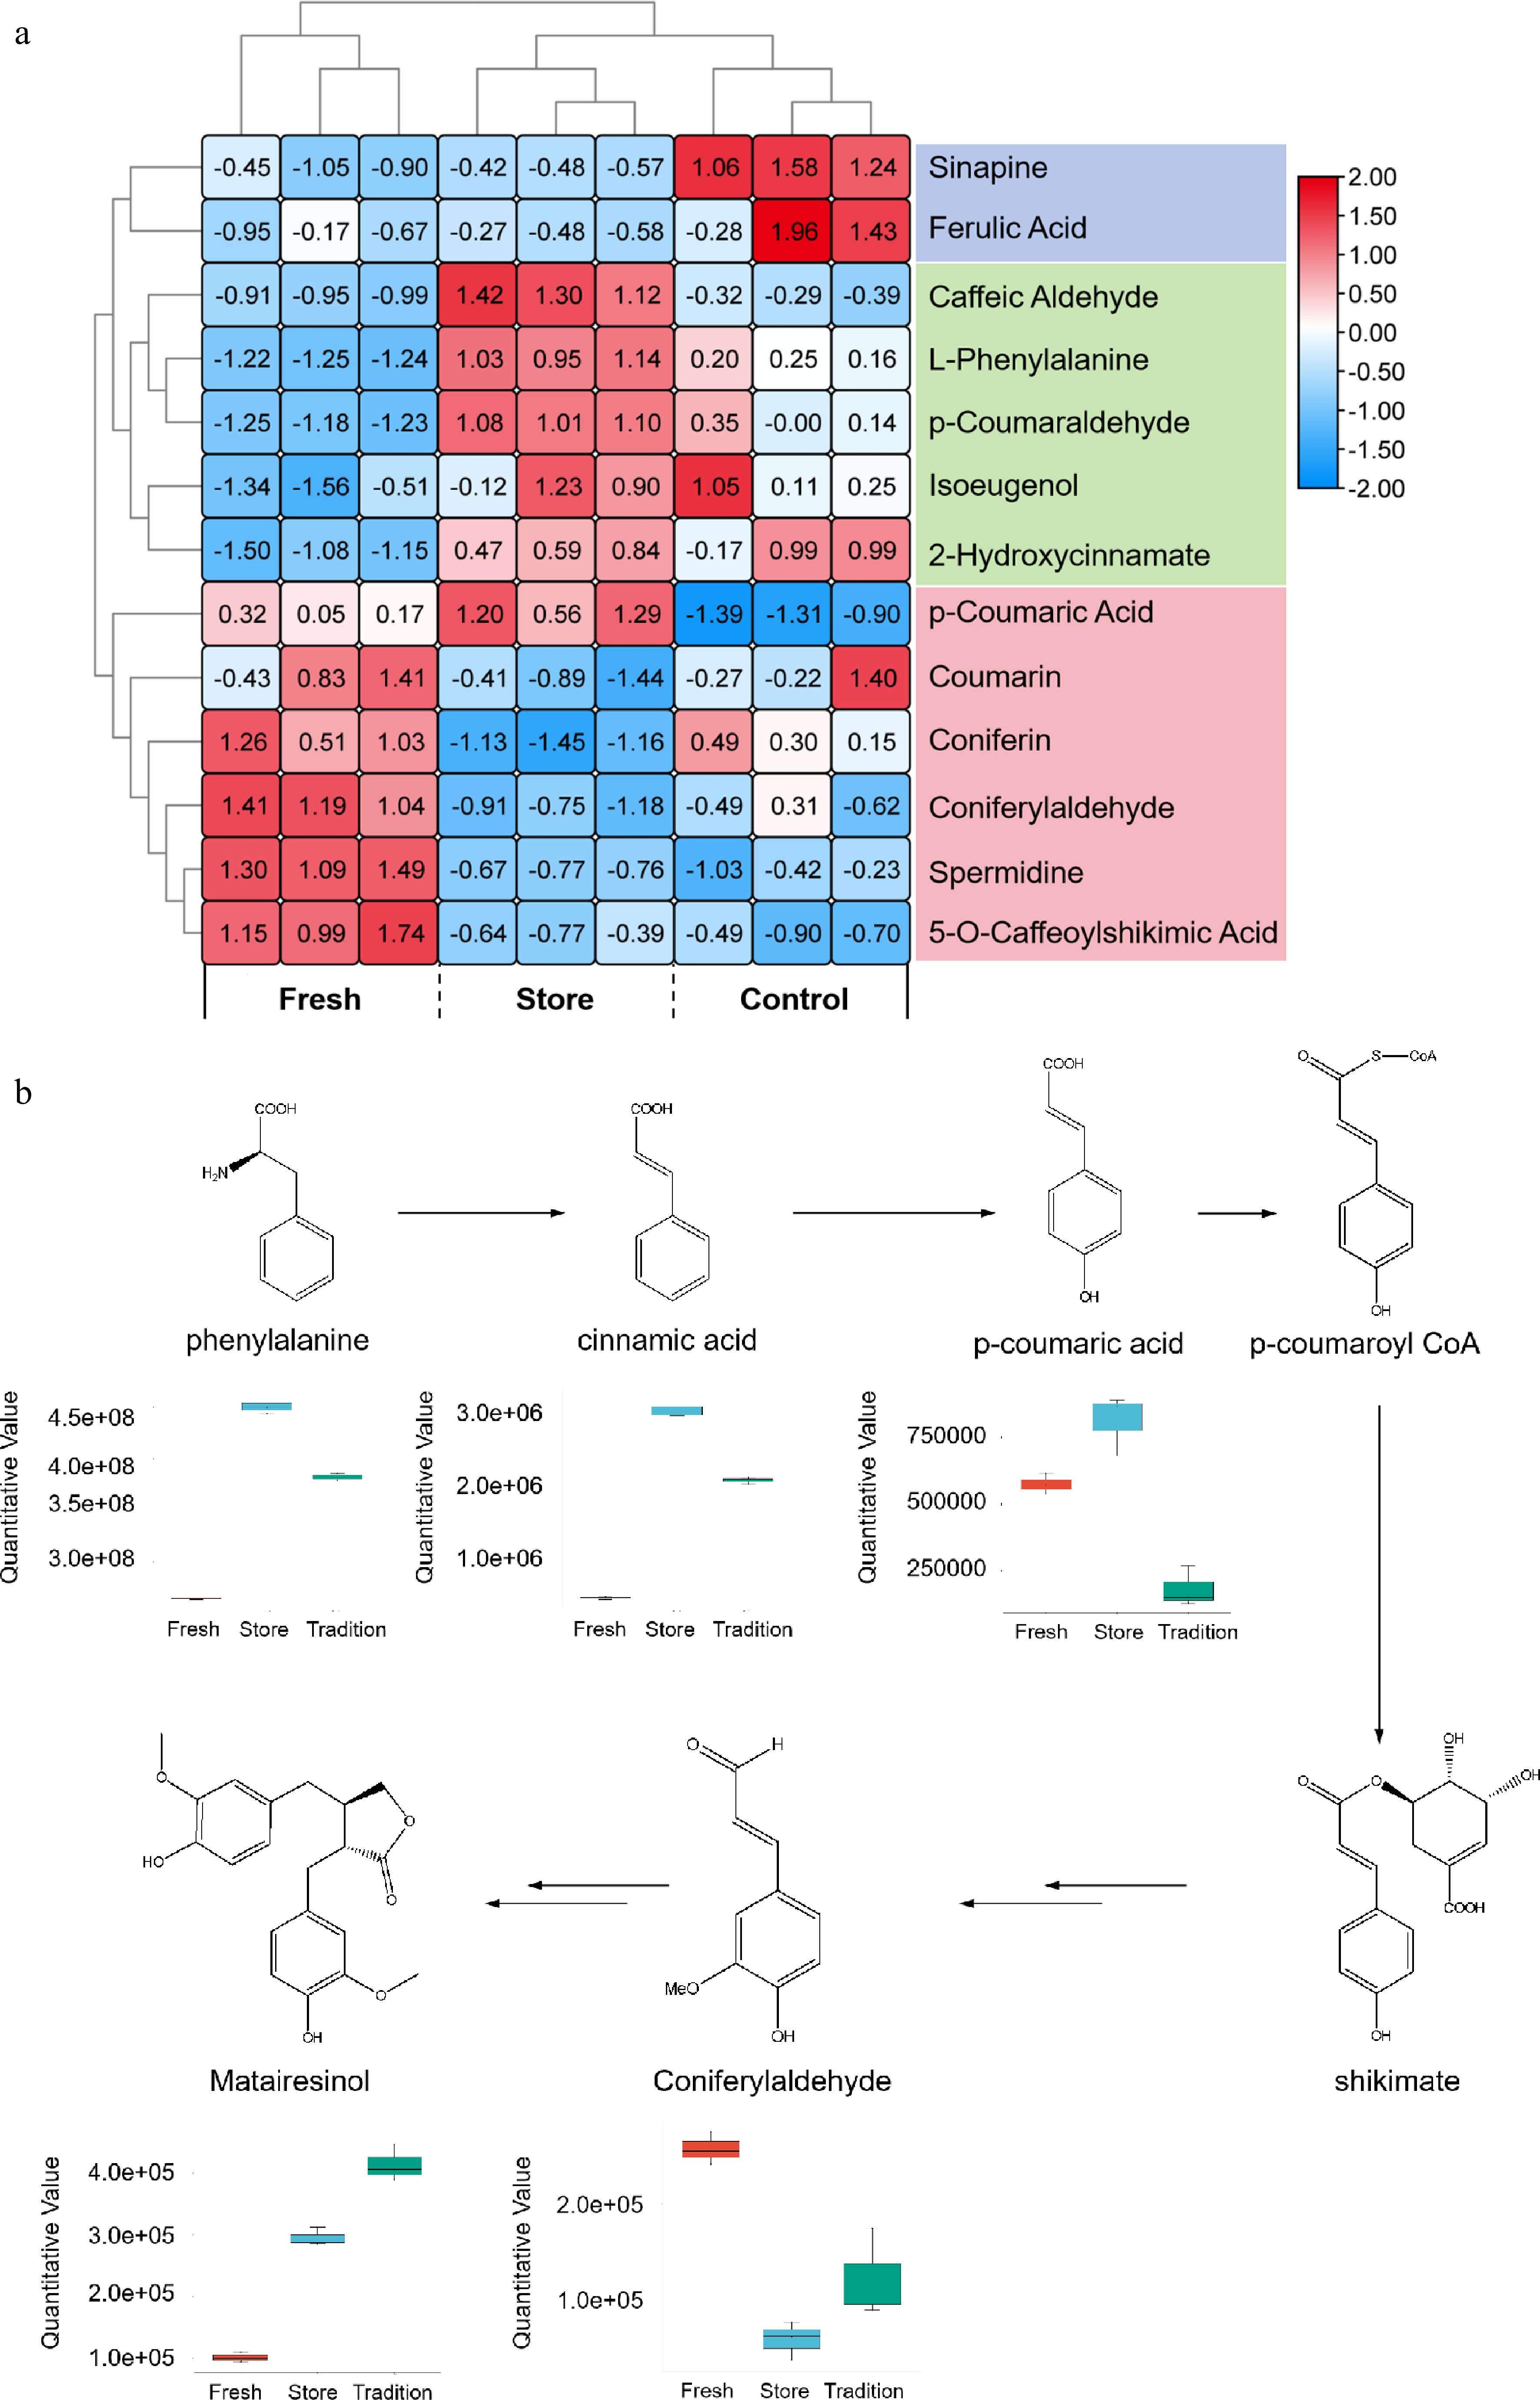
Figure 6.
Various post-harvest processing techniques have a significant impact on the metabolic pathway associated with phenylalanine. (a) Heat maps of the key DMs that are enriched within the phenylalanine-related metabolic pathway. In this representation, each sample is depicted as a column, while each metabolite is represented as a row. The abundance of each metabolite is indicated by a color gradient, with red signifying high abundance and blue indicating low abundance. (b) Schematic representation of the phenylpropanoid metabolic pathway is provided.
-
No. Relative water content of fresh root-bark (%) TF (%) Polygalaxanthone III (%) 3,6-disinapoyl sucrose (%) Spt 1-1 33.95 ± 0.15 2.49 ± 0.08 0.23 ± 0.01 1.18 ± 0.10 Spt 1-2 29.75 ± 0.06 3.21 ± 0.41 0.25 ± 0.03 1.06 ± 0.07 Spt 1-3 28.50 ± 0.16 2.71 ± 0.18 0.23 ± 0.02 1.10 ± 0.13 Spt 1-4 23.76 ± 0.12 2.77 ± 0.07 0.22 ± 0.02 1.04 ± 0.09 Spt 1-5 20.99 ± 0.08 2.80 ± 0.20 0.22 ± 0.03 1.08 ± 0.03 Spt 1-6 14.45 ± 0.33 2.70 ± 0.47 0.24 ± 0.02 1.19 ± 0.10 Spt 2-1 46.96 ± 0.22 2.65 ± 0.35 0.22 ± 0.01 1.03 ± 0.07 Spt 2-2 36.06 ± 0.17 2.72 ± 0.34 0.21 ± 0.01 1.15 ± 0.10 Spt 2-3 34.49 ± 0.22 2.34 ± 0.29 0.20 ± 0.01 1.08 ± 0.10 Spt 2-4 28.72 ± 0.17 3.08 ± 0.62 0.24 ± 0.04 1.04 ± 0.01 Spt 2-5 15.89 ± 0.11 2.84 ± 0.34 0.26 ± 0.03 1.10 ± 0.04 Spt 2-6 15.75 ± 0.31 2.64 ± 0.57 0.26 ± 0.02 1.13 ± 0.04 Spt 3-1 29.99 ± 0.20 2.96 ± 0.04 0.21 ± 0.00 0.94 ± 0.02 Spt 3-2 28.81 ± 0.14 3.17 ± 0.45 0.23 ± 0.04 0.92 ± 0.05 Spt 3-3 24.65 ± 0.04 3.65 ± 0.25 0.23 ± 0.01 0.94 ± 0.06 Spt 3-4 23.28 ± 0.08 2.64 ± 0.38 0.19 ± 0.01 0.98 ± 0.12 Spt 3-5 22.98 ± 0.31 3.44 ± 0.30 0.22 ± 0.02 1.00 ± 0.06 Spt 3-6 15.16 ± 0.11 3.21 ± 0.65 0.18 ± 0.01 0.96 ± 0.04 Spt 4-1 39.26 ± 0.21 2.61 ± 0.02 0.27 ± 0.04 1.13 ± 0.11 Spt 4-2 37.72 ± 0.21 2.70 ± 0.47 0.28 ± 0.01 1.09 ± 0.11 Spt 4-3 29.86 ± 0.07 2.71 ± 0.18 0.23 ± 0.01 1.16 ± 0.17 Spt 4-4 28.92 ± 0.10 3.21 ± 0.41 0.27 ± 0.01 0.96 ± 0.05 Spt 4-5 28.77 ± 0.30 2.77 ± 0.07 0.25 ± 0.01 1.08 ± 0.01 Spt 4-6 28.24 ± 0.11 2.49 ± 0.08 0.26 ± 0.02 1.16 ± 0.07 Table 1.
The content of three internal index components (TF, 3,6-disinapoyl sucrose, Polygalaxanthone III) of the root-bark separated in different water content.
-
Spt 1 Spt 2 Spt 3 Spt 4 Correlation
(r)Significant
(p value)Correlation
( r)Significant
(p value)Correlation
(r)Significant
(p value)Correlation
(Rho)Significant
(p value)TF −0.003 0.996 −0.262 0.615 −0.128 0.809 −0.086 0.872 Polygalaxanth-one III 0.097 0.855 −0.821 0.045 0.685 0.134 0.464 0.354 3,6-disinapoyl sucroseS −0.128 0.809 −0.461 0.358 −0.486 0.328 0.000 1.000 Table 2.
Correlation analysis between content of three internal index components (TF, 3,6-disinapoyl sucrose, Polygalaxanthone III) and the water content fresh root cored.
Figures
(6)
Tables
(2)