-
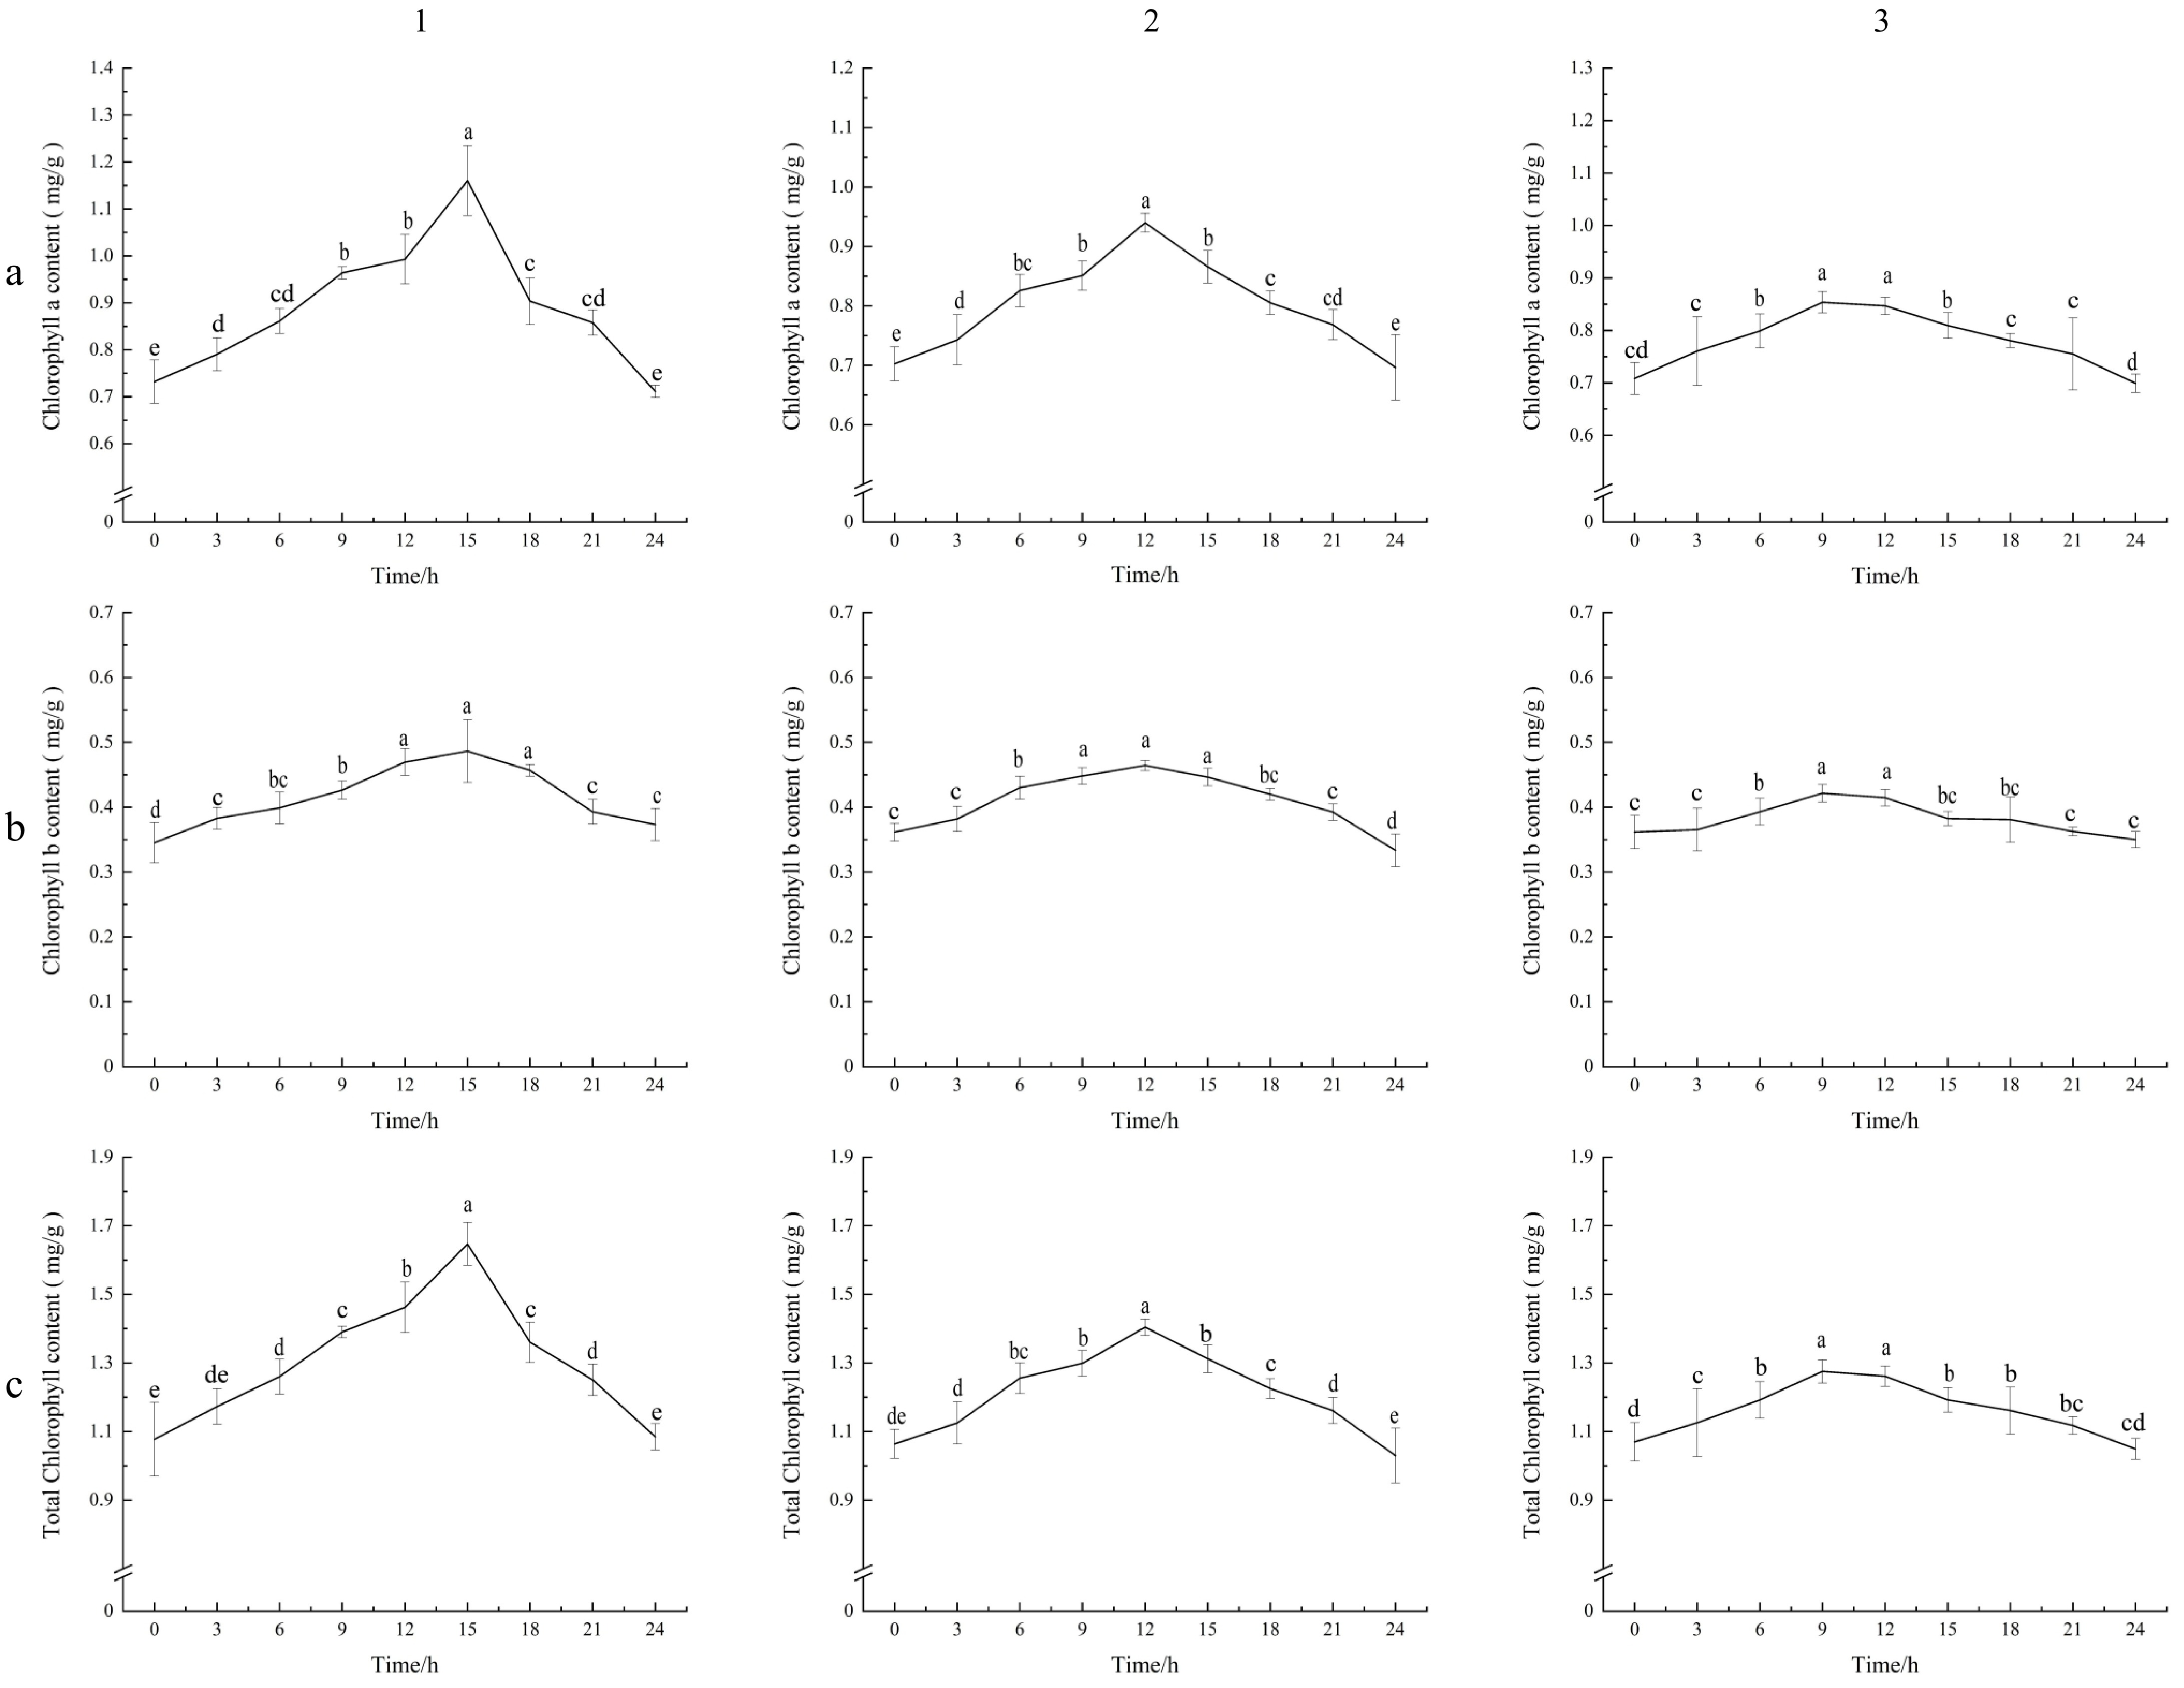
Figure 1.
Chlorophyll a, chlorophyll b, and total chlorophyll values of carrot leaves under different photoperiods. (a1), (b1), (c1) Photoperiodic lighting (16 h of light : 8 h of dark, 16L/8D); (a2), (b2), (c2) Photoperiodic lighting (12 h of light : 12 h of dark, 12L/12D); (a3), (b3), (c3) Photoperiodic lighting (8 h of light : 16 h of dark, 8L/16D). (a1)–(a3) Content of chlorophyll a. (b1)–(b3) Content of chlorophyll b. (c1)–(c3) Content of total chlorophyll. The standard deviation (SD) is represented by the error bars. Different lowercase letters indicate significant differences at the 0.05 level.
-
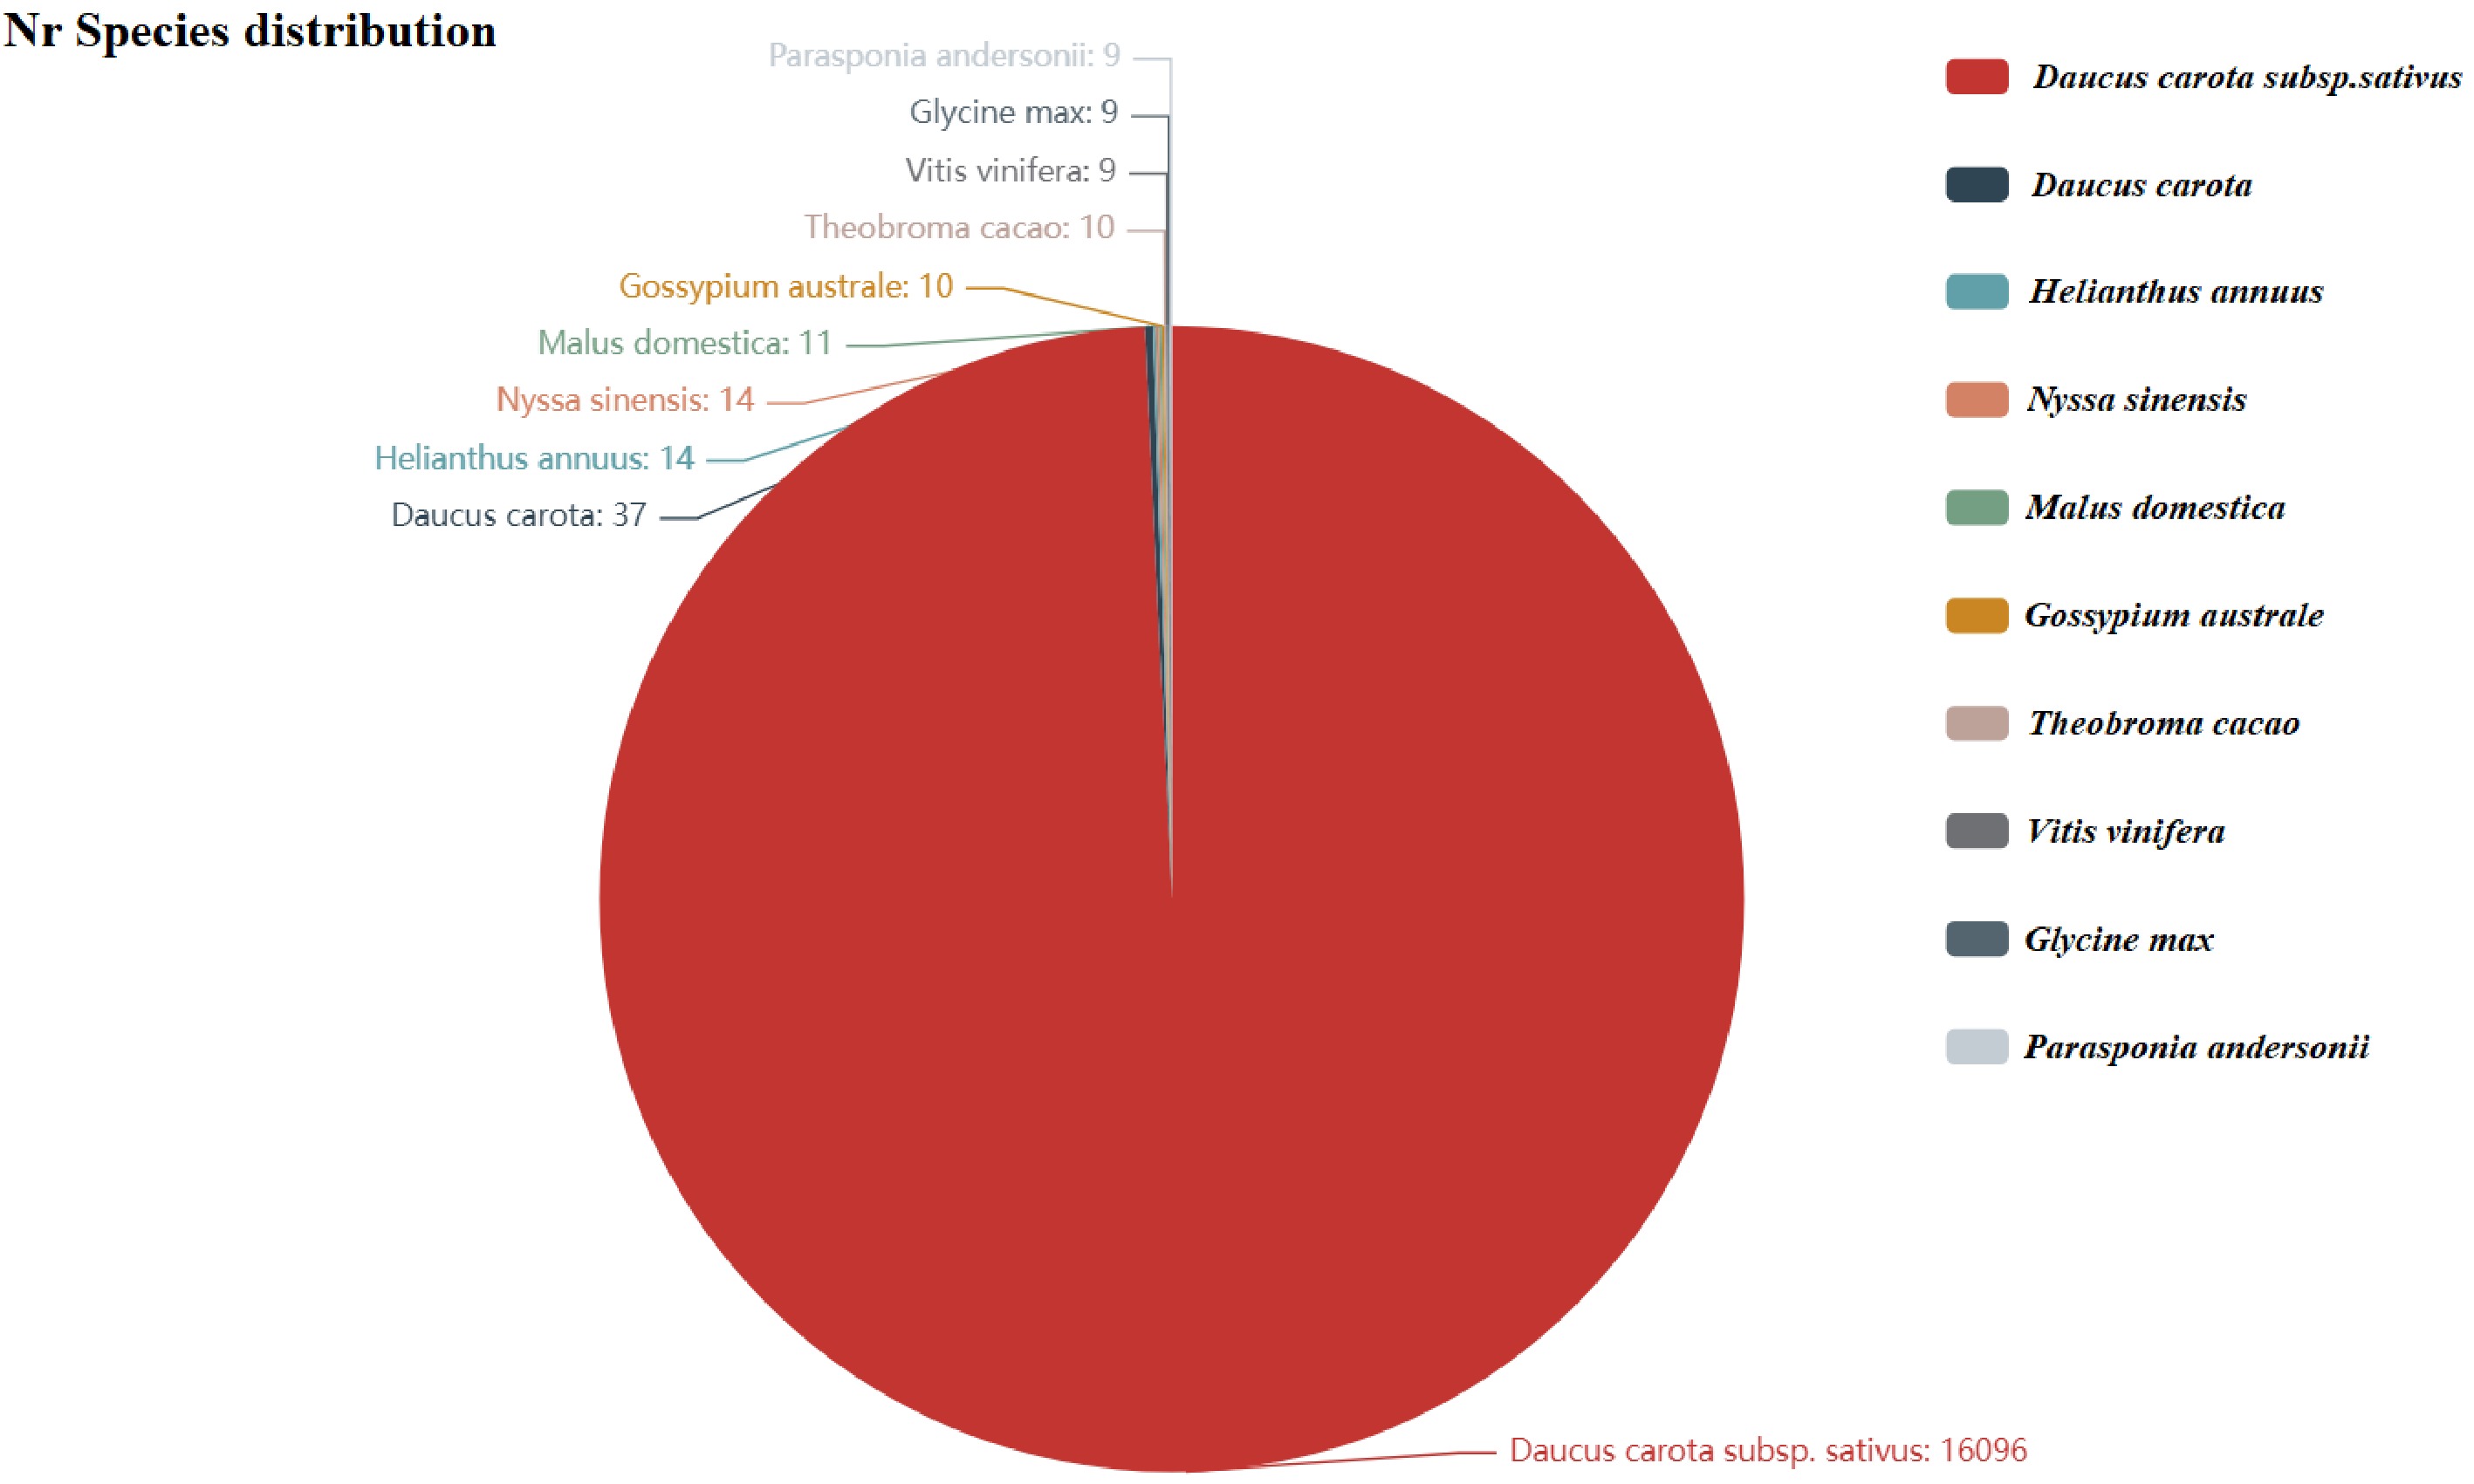
Figure 2.
Nr annotated species distribution map for carrot. The top 10 species with the most comparisons are counted. The number represents the number of different species in the Nr database. The different colors represent the different species. The species distribution of BLAST hits for each unigene occurs with a cut-off of 1E−5.
-
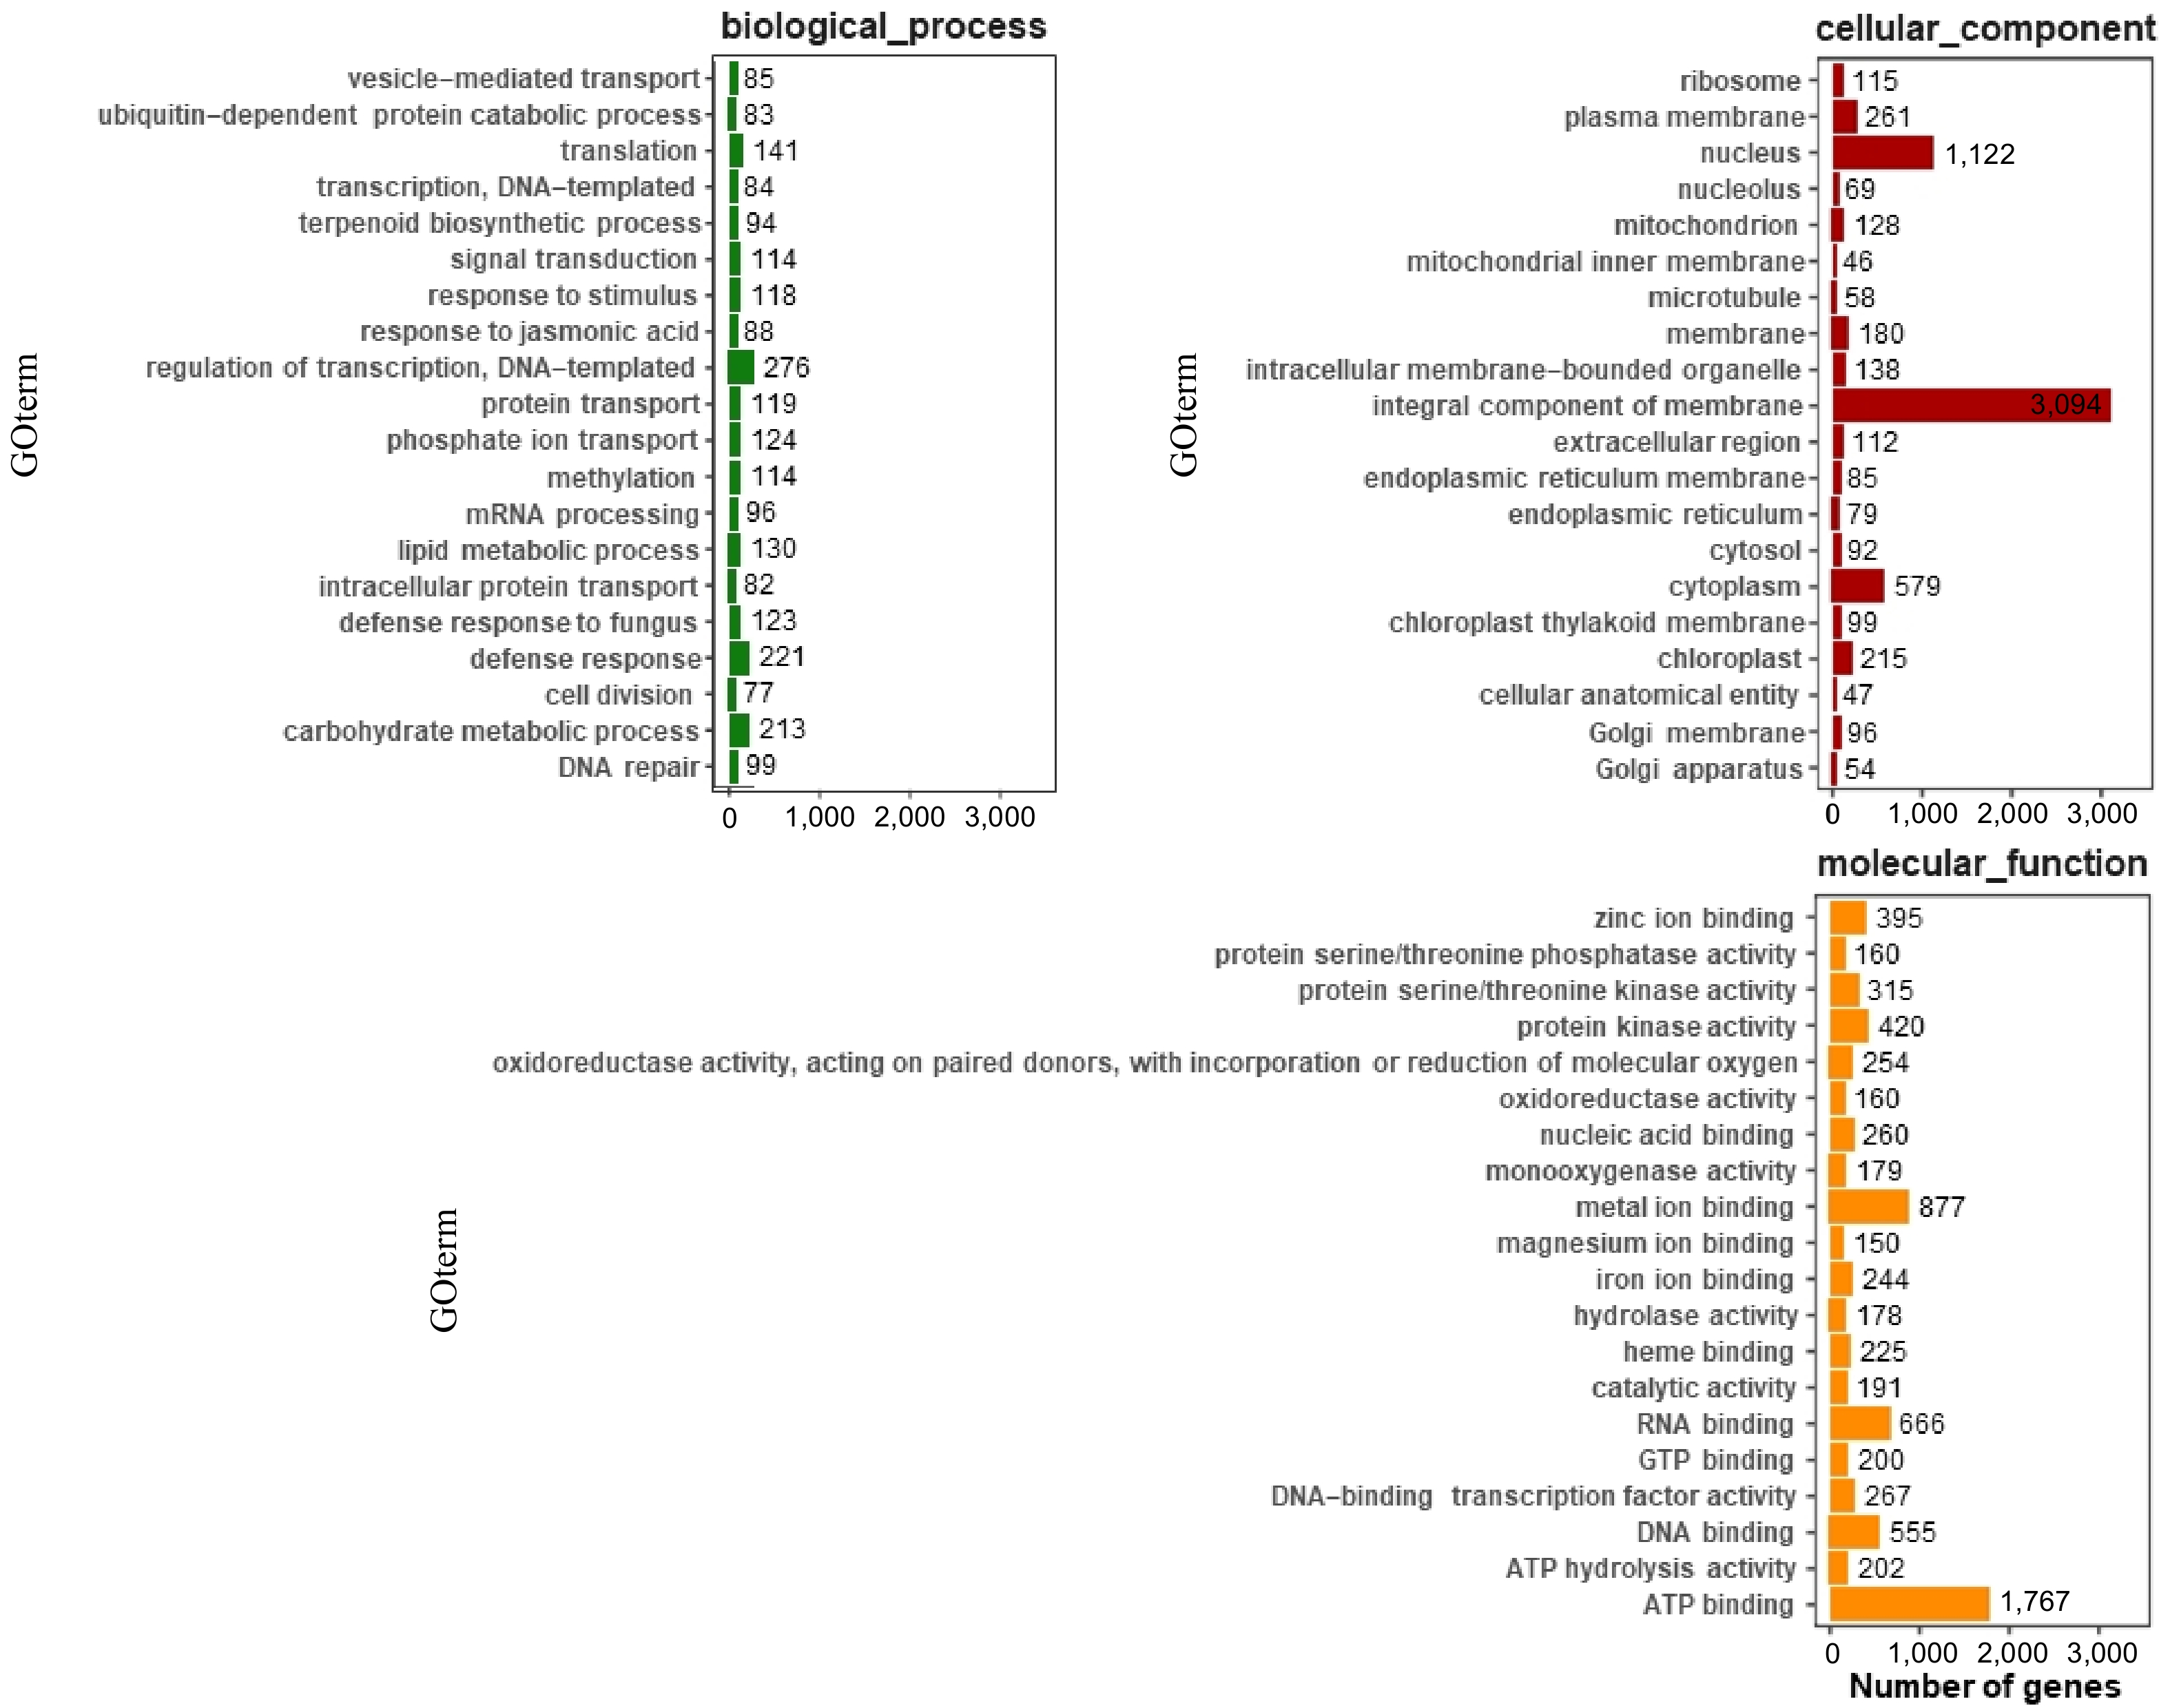
Figure 3.
GO annotation of functional genes in carrot. The top 20 most annotated GO slim terms were selected in each category; each single-copy gene was classified into at least one GO term. All single-copy genes were divided into three categories: molecular function, cellular component, and biological process.
-
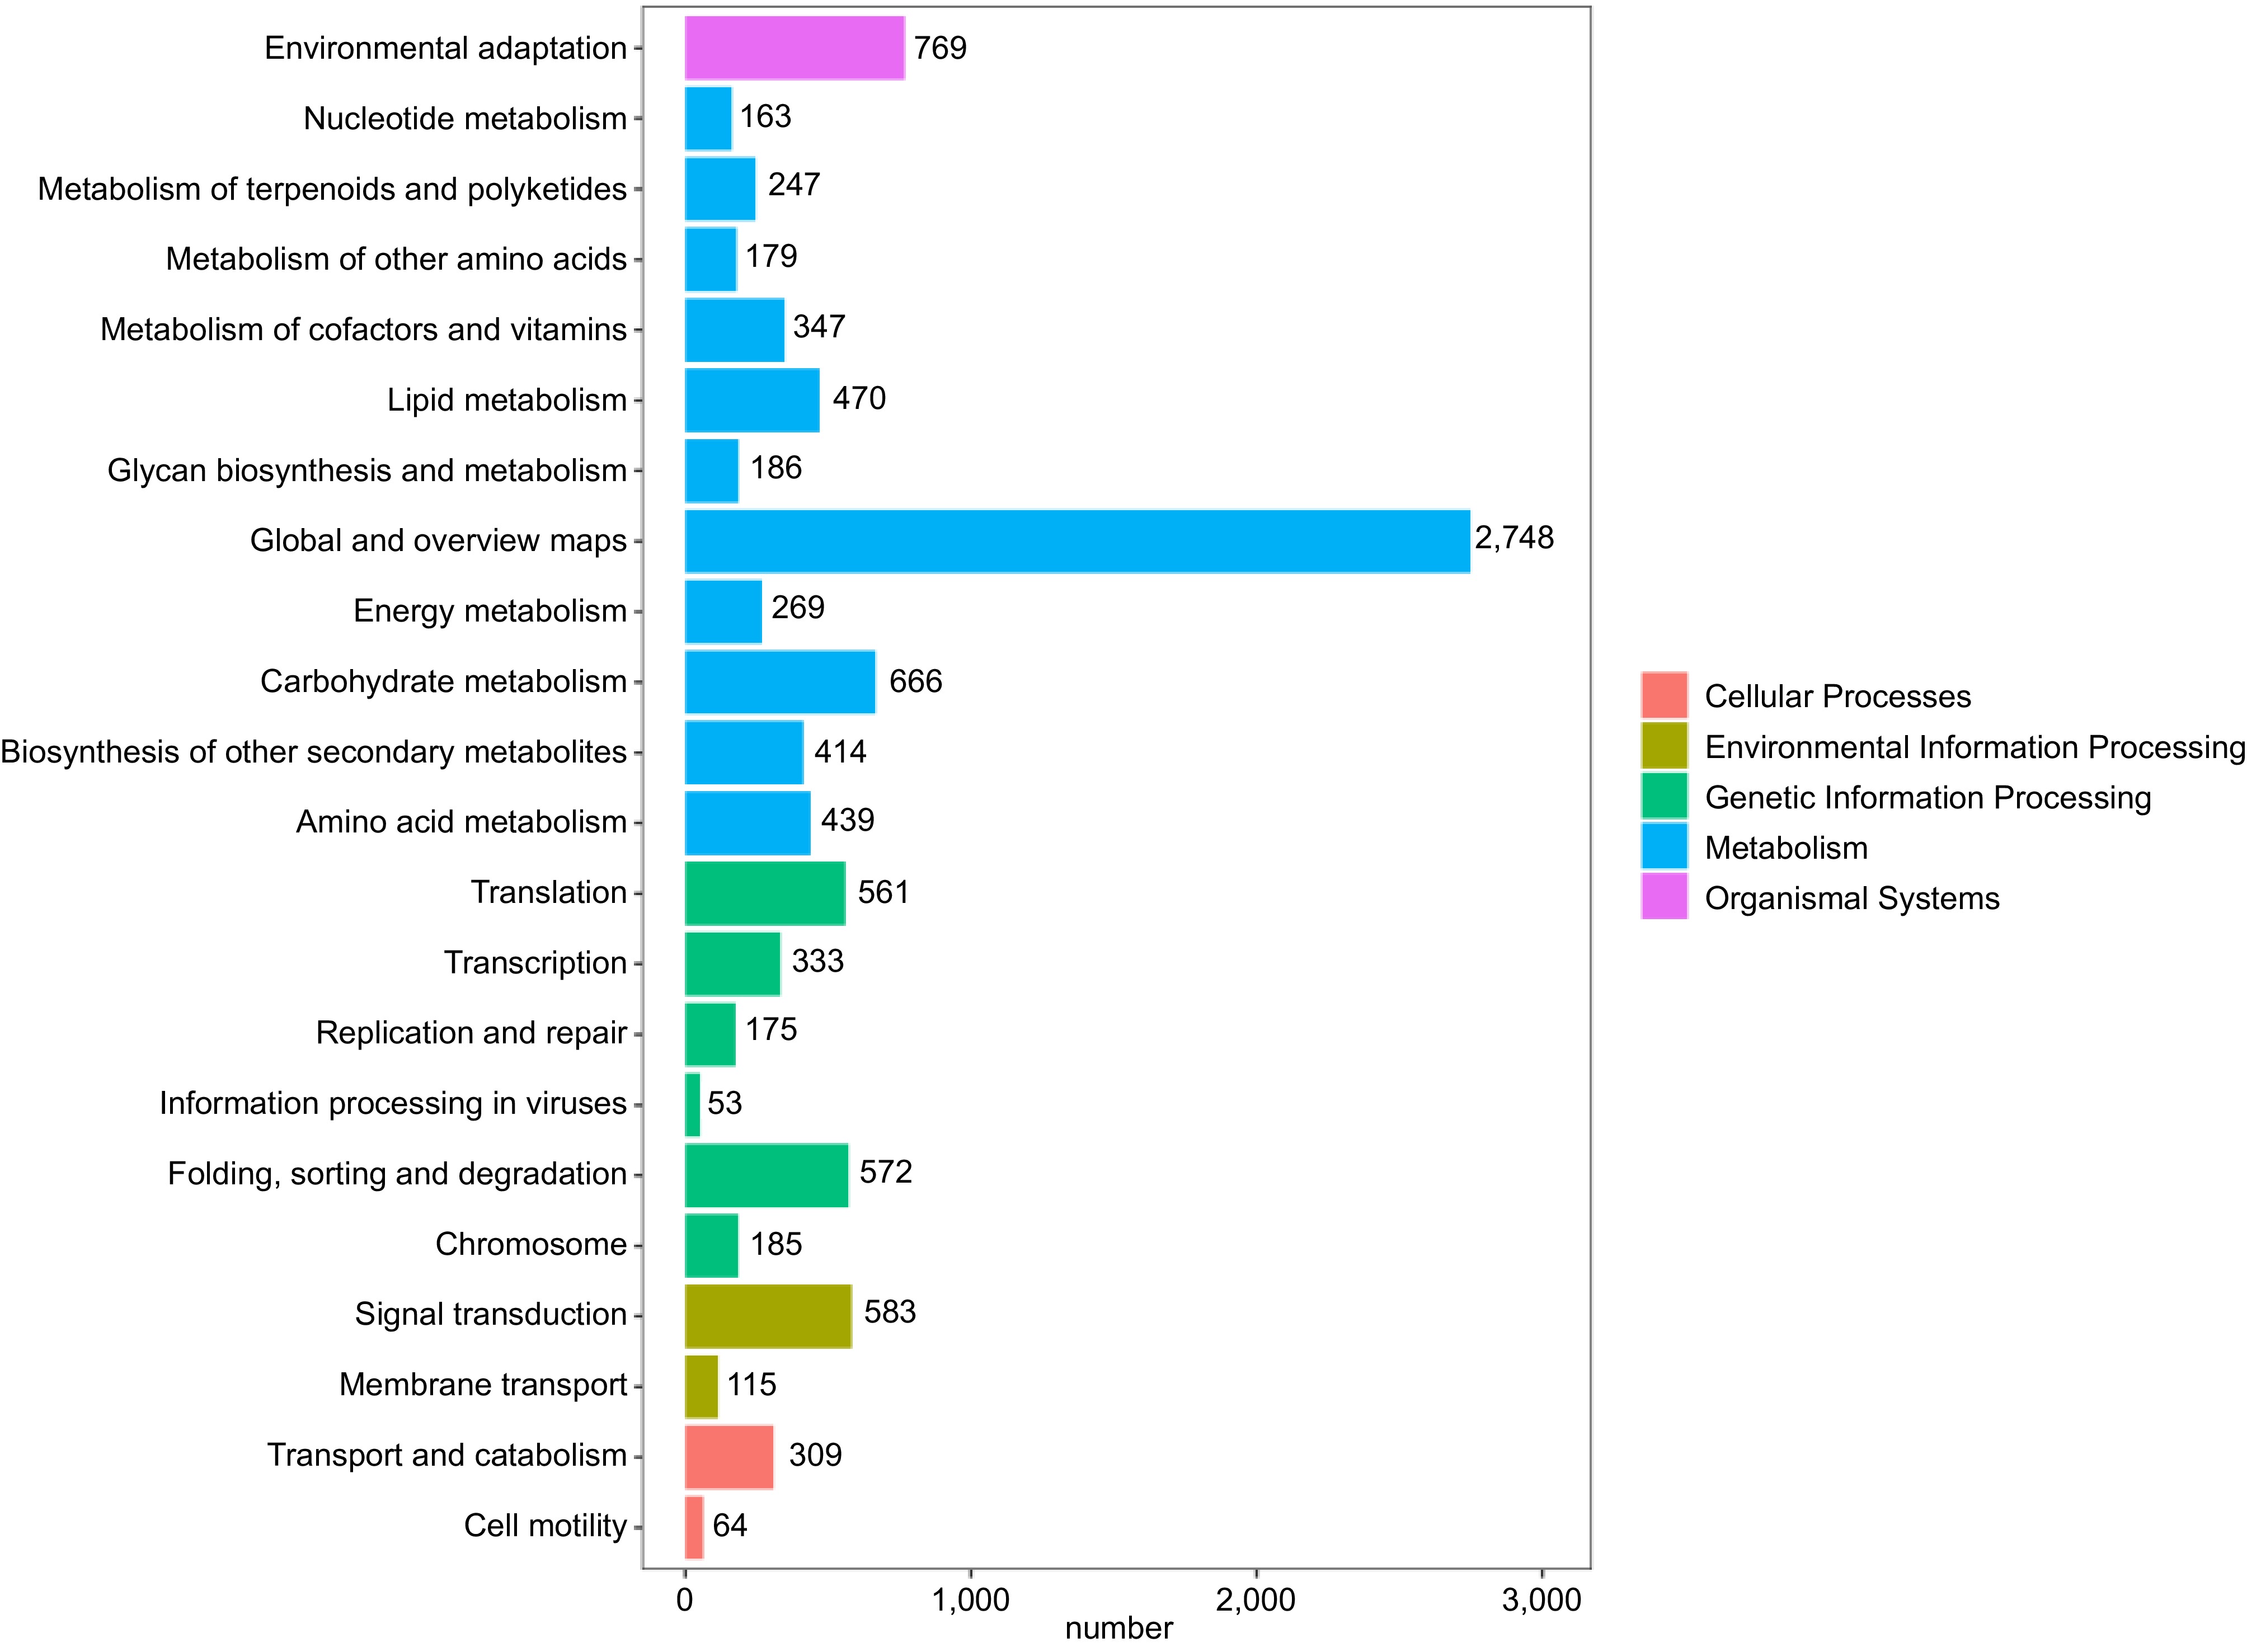
Figure 4.
KEGG metabolic pathway classification. Different colors represent the five classes involved in the KEGG metabolic pathway, and numbers represent the number of single genes in different classes.
-
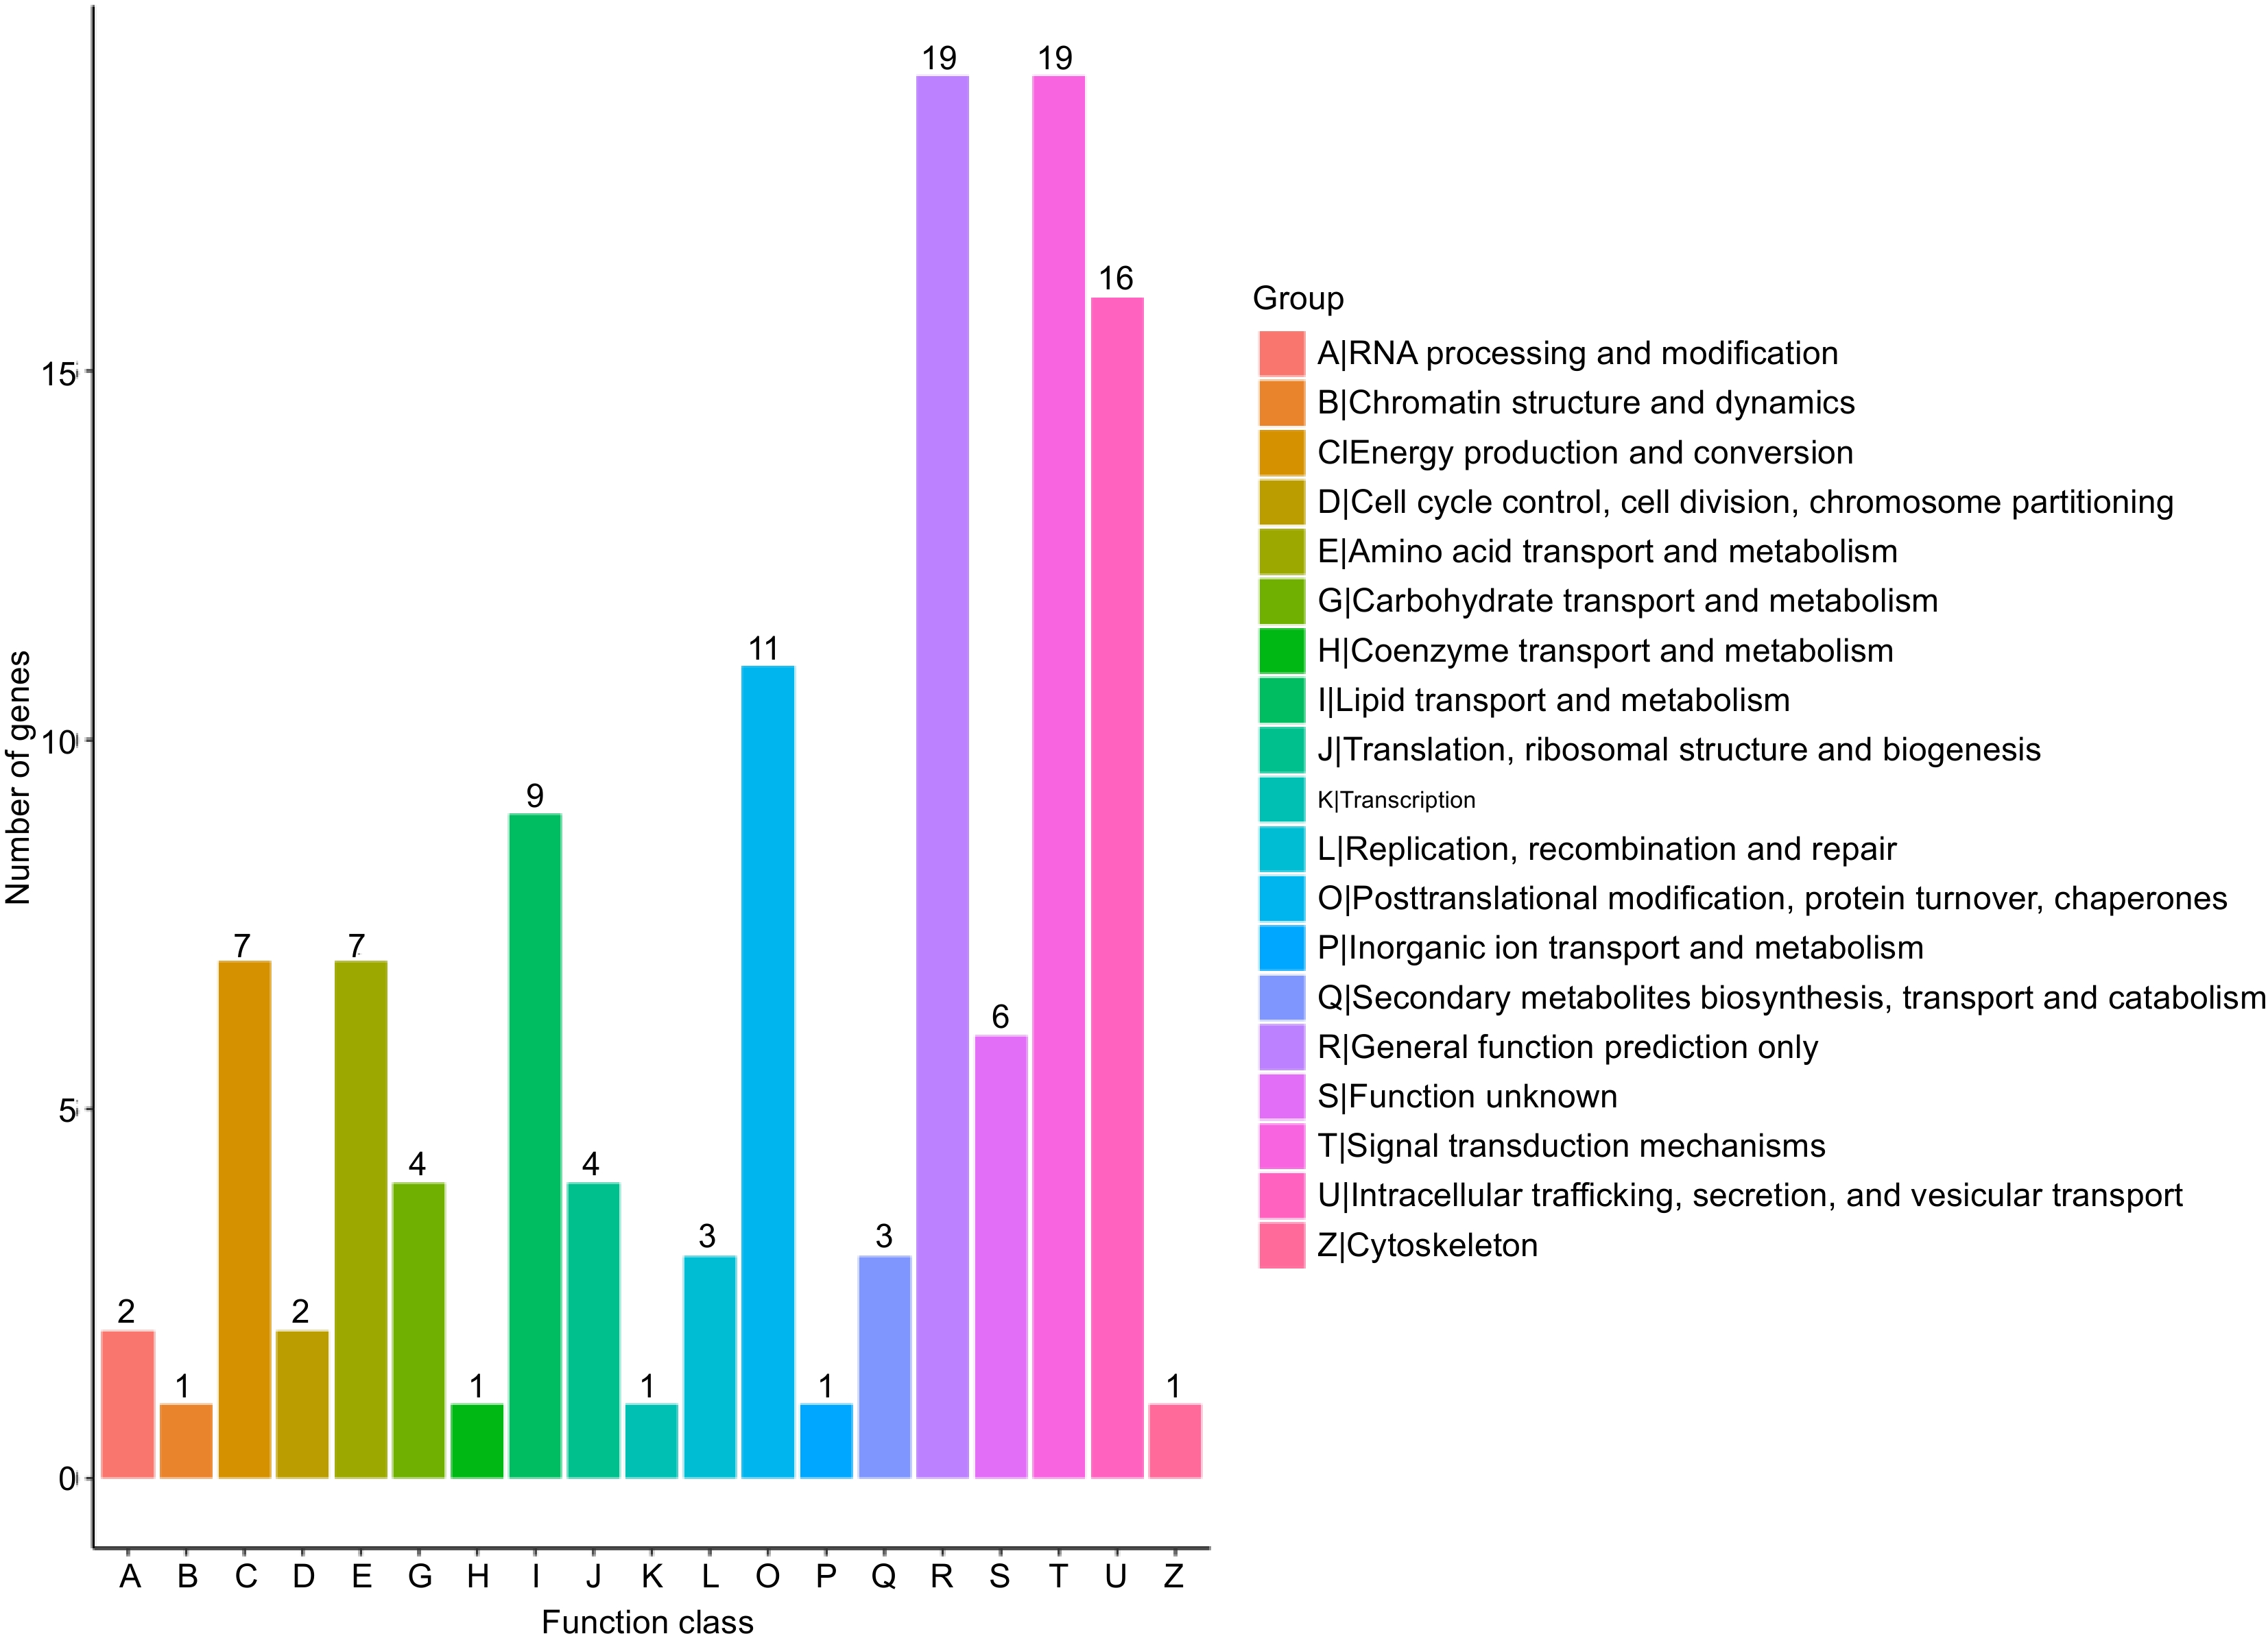
Figure 5.
Clusters of orthologous group classification.
-
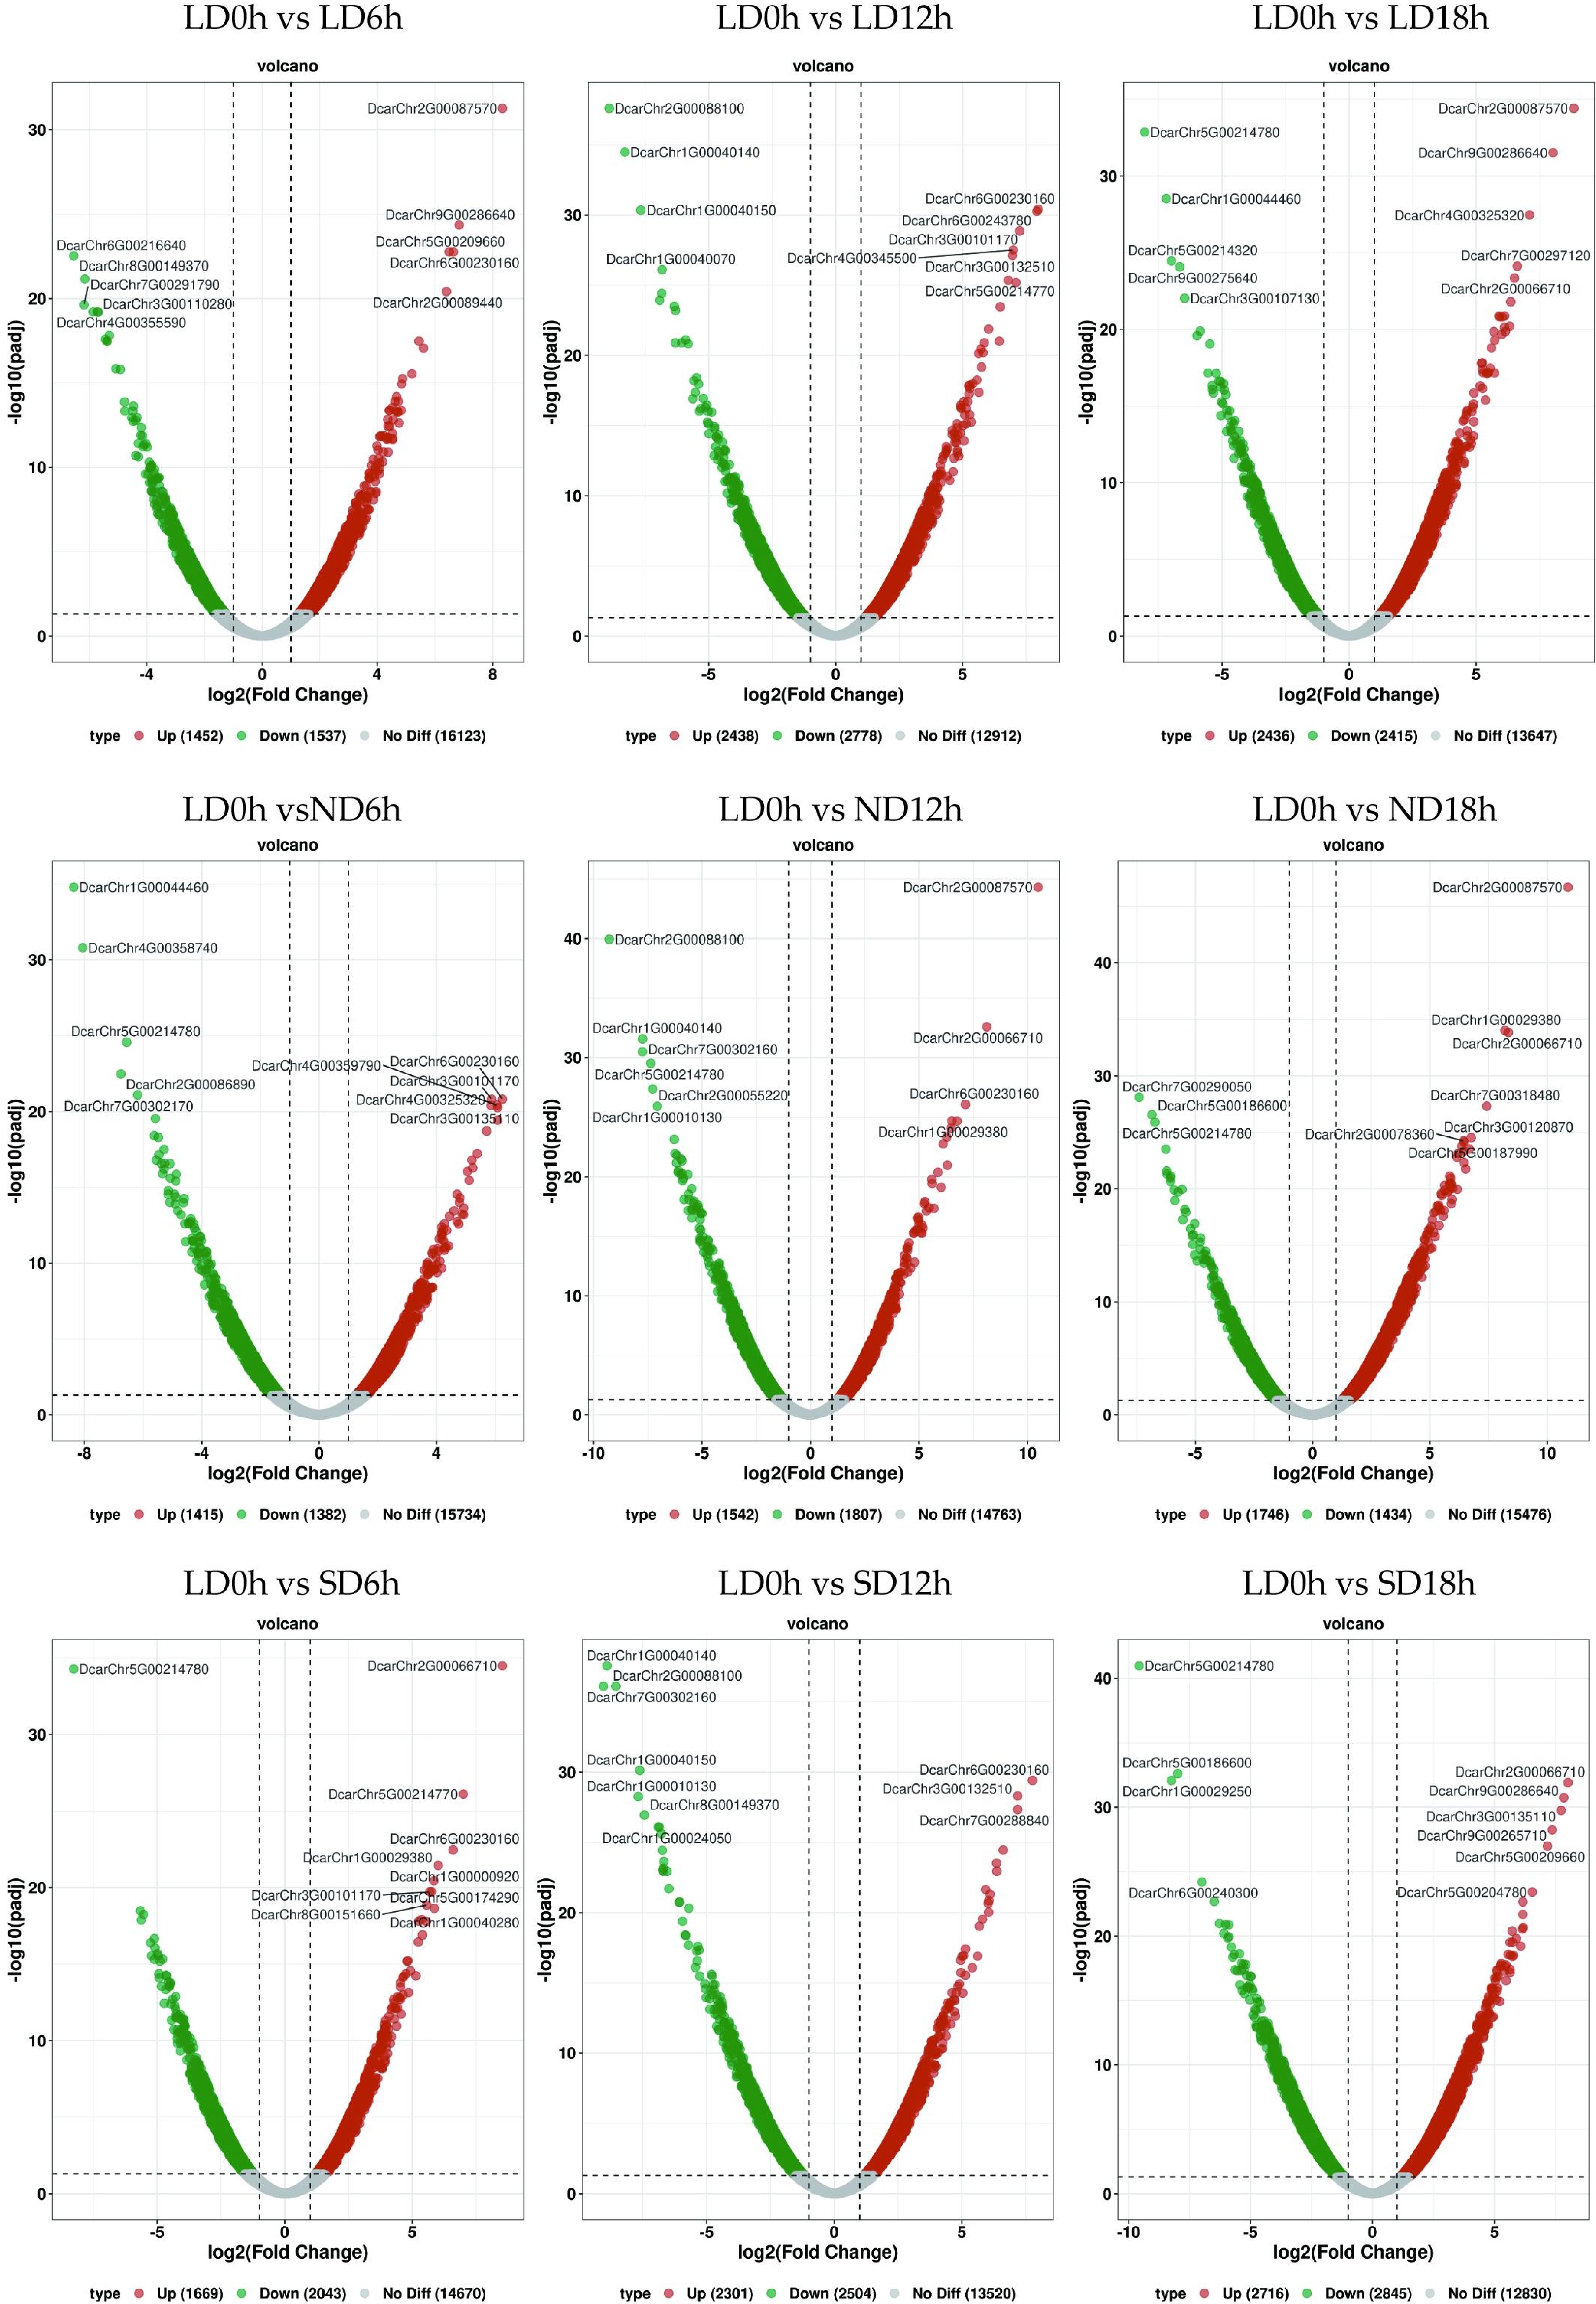
Figure 6.
Volcano map of differentially expressed genes. Each point represents a gene, the x-axis indicates the change in gene expression, represented by log2 fold change; the y-axis indicates the significance of these changes, represented by the negative log10 value or adjusted FDR.
-
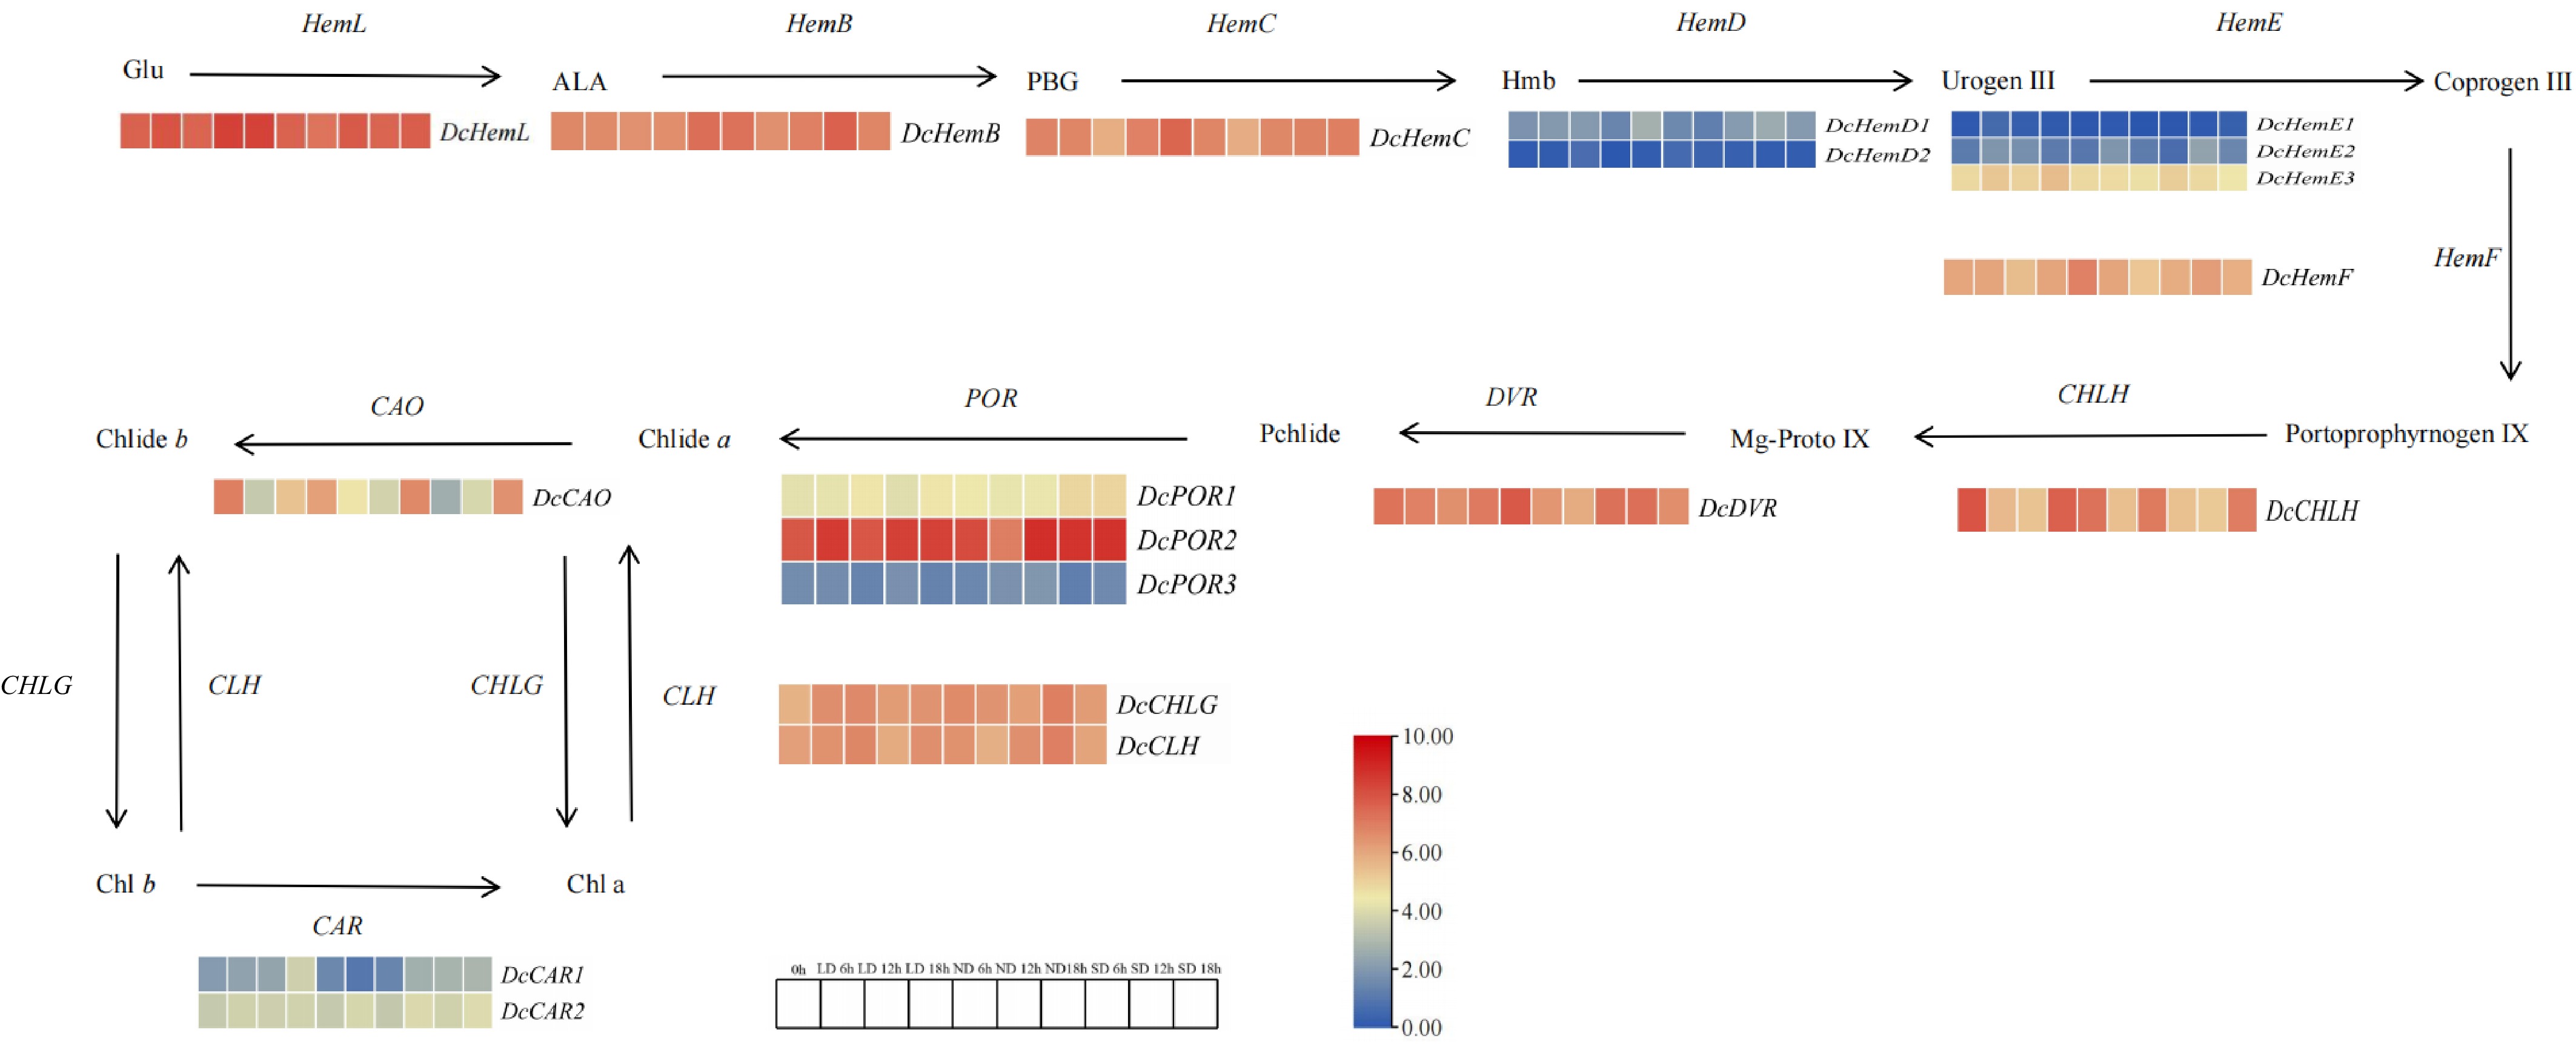
Figure 7.
Differential expression of chlorophyll metabolic pathways and related genes. Note: Red indicates upward adjustment, blue indicates downward adjustment. The heat map of the pathway shows the differential expression level of chlorophyll metabolism related genes in carrot leaves at different points and the initial time T0 h. Red and blue are used to represent the difference multiples after log2, from high to low.
-
Sample Clean reads Clean bases Q20 rate Q30 rate GC content DCLD0h 43,365,412 6,395,402,710 98.478% 95.877% 44.117% DCLD12h 43,334,880 6,337,176,548 98.652% 96.356% 44.729% DCLD18h 43,321,152 6,383,854,293 98.479% 95.879% 44.903% DCLD6h 43,360,340 6,345,333,158 98.588% 96.182% 44.537% DCND0h 43,367,032 6,378,584,039 98.554% 96.100% 44.853% DCND12h 43,325,992 6,348,538,225 98.628% 96.287% 44.535% DCND18h 43,322,194 6,324,925,416 98.746% 96.616% 44.344% DCND6h 43,371,146 6,317,422,287 98.808% 96.789% 44.331% DCSD0h 43,346,780 6,351,631,563 98.645% 96.330% 45.223% DCSD12h 43,372,700 6,340,560,437 98.670% 96.405% 44.700% DCSD18h 43,342,060 6,340,330,366 98.605% 96.254% 44.769% DCSD6h 43,340,566 6,381,388,011 98.578% 96.123% 44.667% Note: Sample is the sample name; clean reads are the remaining reads after filtering; clean bases are the remaining base numbers after filtering; Q20 rate refers to the proportion of bases with a quality score greater than 20 (error rate less than 1%) in the total filtered sequence; Q30 rate refers to the proportion of bases with a quality score greater than 30 (error rate less than 0.1%) in the total filtered sequence; GC content represents the GC content in the filtered data. Table 1.
Statistics of functional annotation results.
-
Item Count Percentage (%) All 19,972 100.00 Annotation 16,564 82.94 KEGG 12,583 63.00 Nr 16,519 82.71 Uniprot 16,392 82.07 GO 12,385 62.01 KOG 101 0.51 Pfam 12,125 60.71 TF 525 2.63 Table 2.
Functional annotation results statistics.
Figures
(7)
Tables
(2)