


-
Carrot (Daucus carota L.), a biennial root vegetable from the Apiaceae family, is widely cultivated and valued for its high nutritional content[1−3]. Its leaves are rich in chlorophyll, which plays a vital role in photosynthesis. Chlorophyll accumulation in plants is influenced by multiple environmental factors[4−6]. As an obligate long-day species, carrot shows distinct growth behaviors and greater photoperiod sensitivity compared to model plants such as Arabidopsis thaliana. The photoperiod response mechanism in carrot integrates vernalization and long-day signaling to ensure reproductive success in temperate climates, illustrating a sophisticated and evolutionarily distinct regulatory strategy not commonly seen in model plant systems[7,8].
The photoperiod phenomenon in plants refers to the control of physiological responses through the perception of day length. The biological clock is usually an endogenous rhythm with a period of 24 h, also known as the circadian rhythm. Carrot plants sense changes in light signals through this circadian rhythm and thereby alter their photosynthesis[9]. Carrot plants alter their photosynthesis and adjust their phenotype by sensing changes in circadian light signals. Light is an important factor affecting plant photosynthesis and growth and development. Changes in light conditions directly affect plant growth and development, and plants have flexible responses to circadian rhythms[10].
Plants perceive changes in the external light environment, mainly through the regulation of the light signal pathway and the biological clock signal pathway. Light is sensed by plant photoreceptors and served as a signal to regulate genes involved in circadian rhythms, adapting to environmental fluctuations, and influencing plant growth and development[11]. Light regulated plant growth, flowering, photosynthesis, secondary metabolism, and other aspects, affecting physiological and biochemical changes in plants, thus modulating the yield and quality of crops[12,13]. Studies have shown that photoperiod significantly affects chlorophyll metabolism and accumulation in carrot leaves by regulating the photosensitive pigment signaling pathway. Under long-day conditions, the photoreceptor phyB activates key chlorophyll synthesis genes (such as HEMA1 and CHLH), increasing the chlorophyll a/b ratio. Abscisic acid (ABA) accumulation inhibits the synthesis of chlorophyll precursors during short photoperiods. Meanwhile, the chlorophyll enzyme (CLH) is activated, accelerating the decomposition of chlorophyll and causing the leaves to turn yellow[14−16]. In carrots, through the study of transcription factors related to circadian rhythms, it was found that gene expression and physiological indicators exhibit rhythmic expression[12,17]. The diurnal variation of gene expression related to photosynthesis in tomatoes. When the light intensity is low, the peak time of the biological clock and photosynthesis-related genes shifts later[18].
Currently, research on regulating the growth and development of carrots using different photoperiods is scarce. Transcriptome sequencing technology, as a key method for exploring gene expression patterns under specific conditions, plays an important role in studies of bio-environmental interactions, growth and development of animals and plants, and is a crucial tool in plant genomics research and variety breeding[19]. In this study, the carrot cultivar 'Kurodagosun' was subjected to measurements of chlorophyll content under light-dark cycles of 12 h/12 h, 16 h/8 h, and 8 h/16 h. Additionally, transcriptome sequencing analysis was conducted at four time points within one photoperiod. By using bioinformatics methods to analyze the sequencing data, the impact of photoperiods on the growth and development of carrots was clarified, providing important information for the study of chlorophyll metabolism.
-
The experimental material was carrot 'Kurodagosun' seedlings, which were grown in the artificial climate chamber of the State Key Laboratory of Crop Genetics & Germplasm Enhancement and Utilization at Nanjing Agricultural University (Nanjing, China). Carrot seeds were germinated on filter paper for 3 d before being sown into pots with a nutrient soil mixture of organic substrate:vermiculite:perlite in a ratio of 1:1:1. For each treatment, three biological replicates were set up, with six plants per replicate. At 70 d after sowing, healthy, uniformly growing plants were selected and placed in growth chambers under conditions of 25 °C, a photoperiod of 12 h/12 h, and a humidity of 70% ± 5% for 1 week.
Photoperiodic treatment and sample collection
-
Subsequently, the carrot seedlings were subjected to three different light cycle treatments: photoperiodic lighting (16 h of light : 8 h of dark, 16L/8D); Photoperiodic lighting (12 h of light : 12 h of dark, 12L/12D); Photoperiodic lighting (8 h of light : 16 h of dark, 8L/16D) at 25 °C, with a light intensity of 240 µmol·m−2·s−1 and humidity of 70% ± 5%. Sampling began at 0:00 in the morning, with the initial time recorded as 0 h. Healthy seedlings with consistent growth were sampled every 3 h, the time taken was one photoperiod (24 h). Then wrapped in aluminum foil, quickly frozen in liquid nitrogen, and stored at −80 °C for subsequent experiments. For transcriptome analysis, sampling was carried out at 0, 6, 12, and 18 h for one light cycle. Each sample had three biological replicates.
Chlorophyll content measurement
-
For each treatment, three consecutive plants were selected. The chlorophyll contents of three leaves of each plant with uniform growth were determined using the alcohol extraction method. The plant samples were weighed, and then placed in four times their volume of 96% ethanol, ensuring that the plant samples are fully immersed in the ethanol. In the dark, the plant samples were extracted in 96% ethanol for 24 h, and then the extract was collected. Absorbance was measured using a PE-2100 atomic absorption spectrophotometer (PerkinElmer, Waltham, Massachusetts, USA) at 649 and 665 nm wavelengths. This procedure was repeated three times for each treatment, and the average chlorophyll value was calculated.
RNA-seq data and enrichment analysis of differentially expressed genes
-
Low-quality data filtering was performed on the sequenced reads to obtain valid data. Based on the filtered data, further analysis was conducted. FastQC software (version 0.11.9, default parameters,
www.bioinformatics.babraham.ac.uk/projects/fastqc ) was used to assess the quality of the raw sequencing data, identifying and excluding low-quality sequences and potential contaminants. The Trim Galore tool was utilized to trim the transcriptomic samples, removing low-quality regions and retaining high-quality reads. The processed reads were compared against the carrot reference genome using HISAT2 software (version 2.1.0) to determine their genomic location. The number of reads for each gene was counted, and the read counts were estimated for each transcript using RSEM software (version 1.3.3, default parameters). The read counts obtained from RSEM were converted to FPKM values, a normalized expression measure used to evaluate the expression levels of genes and transcripts. The screening of differentially expressed genes (DEGs) was conducted using the edgeR package (version 4.2.1). The screening criteria included setting the FDR threshold below 0.05 to control the false positive rate in multiple tests, and setting the absolute value of log2 fold change (log2FC) greater than 1.5 as the initial screening criterion, meaning that the gene expression levels in different treatments should differ by at least 2.83 times. In this analysis, the FDR value was used as a filter standard for significant differences to ensure that the identified DEGs were statistically significant.Functional annotation analysis
-
Gene function annotation for the cultivar 'Kurodagosun' was performed through sequence alignment with public databases. BLAST tools were used to compare sequences against the NCBI Nr and Nt databases, Swiss-Prot, and KOG databases to filter out matching results. Blast2GO software (version 6.0) was utilized to map sequence functions to Gene Ontology (GO) terms, covering molecular function, biological process, and cellular components. The Gene Ontology (GO) database (
www.geneontology.org ) is a comprehensive model of biological systems that encompasses molecules, cells, and organisms. It provides the latest scientific computational representation of gene functions. By inputting the differentially expressed genes (DEGs) obtained from the screening into the GO database for retrieval, the enriched GO terms associated with these DEGs can be determined. The KEGG database (www.genome.jp/kegg/pathway.html ) aids in metabolic analysis and metabolic network studies within organisms. By inputting the differentially expressed genes into the KEGG database for retrieval, the significantly enriched metabolic pathways (Pathways) can be identified. This pathway assignment using the KEGG database helps uncover the specific metabolic processes in which the genes are involved. The Uniprot database records the correspondence between each protein family and the functional nodes in Gene Ontology, allowing for the prediction of the biological functions performed by the protein sequences encoded by transcripts through this system[20,21]. Based on the associations between databases, KOG/COG annotation results were obtained, and classification statistics and plotting for KOG/COG categories were conducted[22].Data processing and analysis
-
The collected data were organized using Microsoft Excel 2019 software, and IBM SPSS Statistics 25.0 was used for significance difference analysis, employing Duncan's multiple range test (p < 0.05). OriginPro 2024 software was used to draw tables and figures.
-
The contents of chlorophyll a, chlorophyll b, and total chlorophyll of carrot leaves under 12L/12D and 16L/8D treatments were higher than those under 8L/16D conditions. Under 16L/8D conditions, the average chlorophyll a, chlorophyll b values of carrot leaves were 0.886 and 0.415, reaching the highest value of 1.160 and 0.486 after 15 h of treatment. Under 12L/12D conditions, the average chlorophyll a, chlorophyll b values of carrot leaves were 0.800 and 0.409, reaching the highest value of 0.940 and 0.464 after 12 h of treatment. Under 8L/16D conditions, the average chlorophyll a, and chlorophyll b values of carrot leaves were 0.779 and 0.381, reaching the highest value of 0.854 and 0.422 after 9 h of treatment. In this study, long photoperiod treatments significantly increased the chlorophyll a, chlorophyll b, and total chlorophyll values of carrot leaves. At the end of the light period, they return to a dark respiration state, reducing chlorophyll synthesis (Fig. 1).
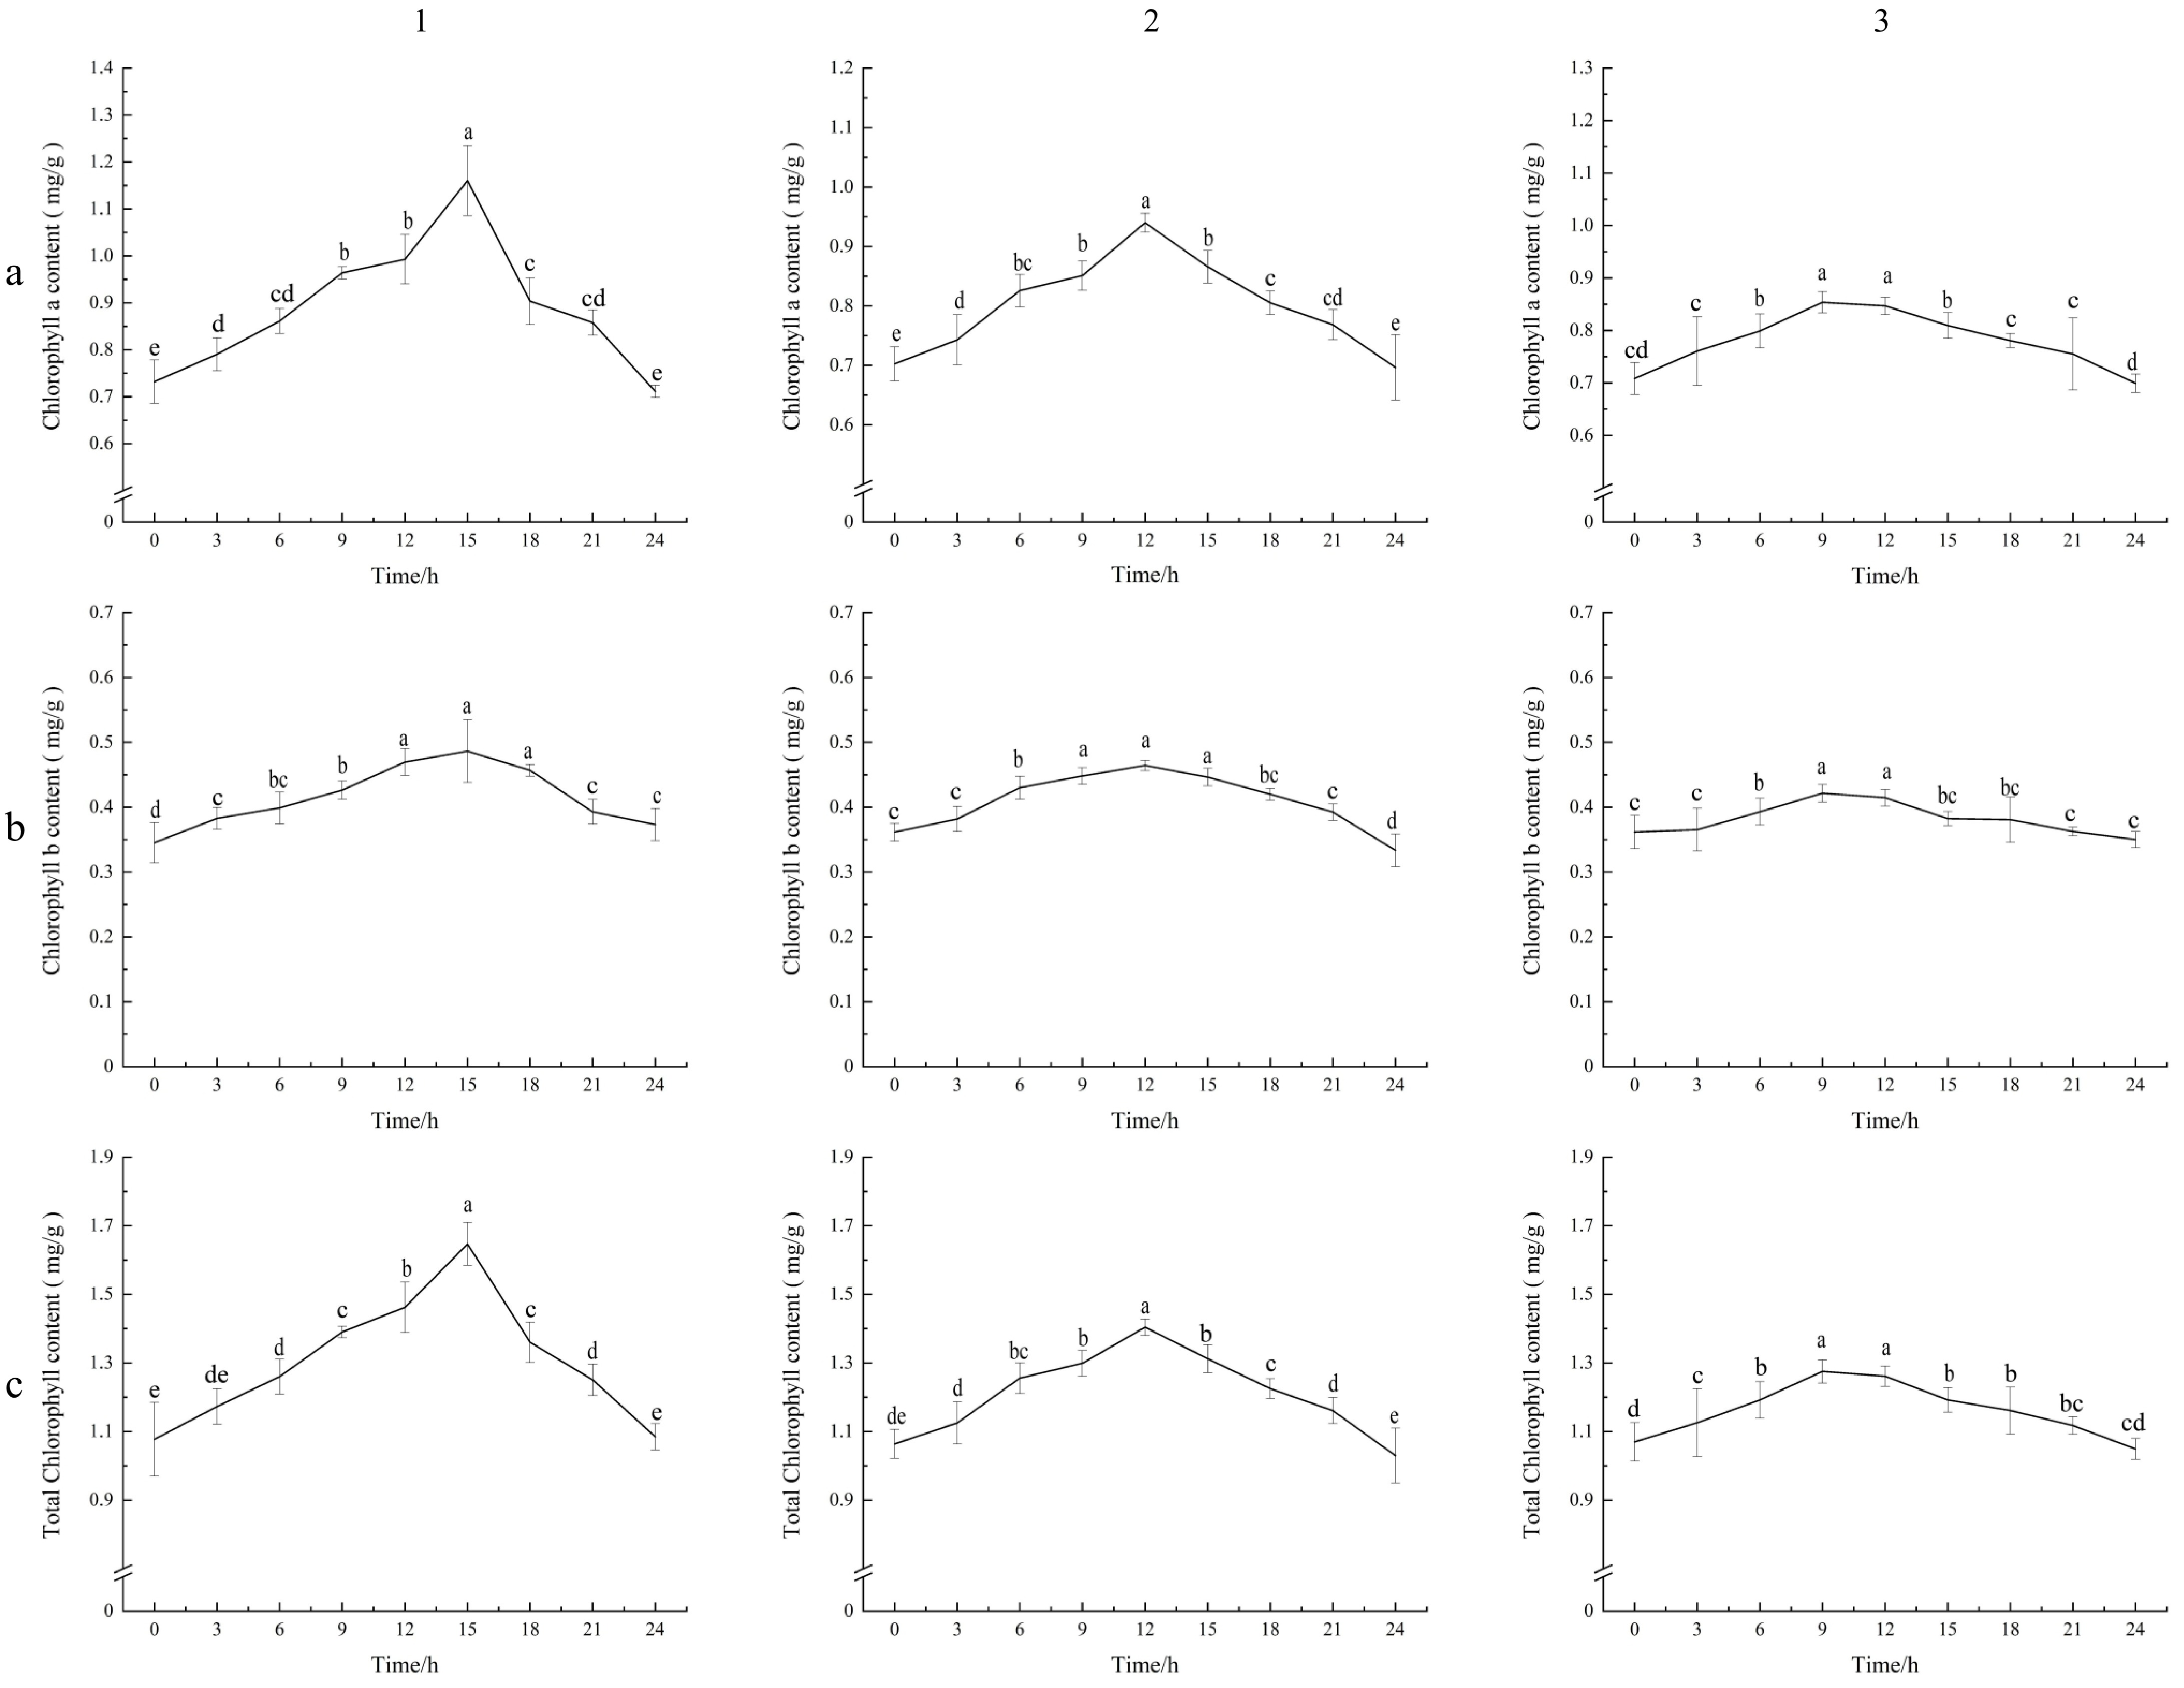
Figure 1.
Chlorophyll a, chlorophyll b, and total chlorophyll values of carrot leaves under different photoperiods. (a1), (b1), (c1) Photoperiodic lighting (16 h of light : 8 h of dark, 16L/8D); (a2), (b2), (c2) Photoperiodic lighting (12 h of light : 12 h of dark, 12L/12D); (a3), (b3), (c3) Photoperiodic lighting (8 h of light : 16 h of dark, 8L/16D). (a1)–(a3) Content of chlorophyll a. (b1)–(b3) Content of chlorophyll b. (c1)–(c3) Content of total chlorophyll. The standard deviation (SD) is represented by the error bars. Different lowercase letters indicate significant differences at the 0.05 level.
Quality analysis of carrot transcriptome sequencing at different time points
-
Through transcriptome sequencing analysis of the carrot leaves of 'Kurodagosun' under different photoperiods, the effective data volume for each treatment was between 6.31 and 6.40 Gb. The Q20 values were all greater than 98.62%, and the Q30 values were all greater than 96.27%. The GC contents were from 44.117% to 44.903% (Table 1). Low-quality data filtering was performed on the sequenced reads to obtain valid data: (1) reads with more than 10% of bases having a Phred quality score below 20 (Q20); (2) reads containing more than 5% of undetermined bases (N); and (3) adapter sequences or PCR duplicates that could introduce bias into the analysis.
Table 1. Statistics of functional annotation results.
Sample Clean reads Clean bases Q20 rate Q30 rate GC content DCLD0h 43,365,412 6,395,402,710 98.478% 95.877% 44.117% DCLD12h 43,334,880 6,337,176,548 98.652% 96.356% 44.729% DCLD18h 43,321,152 6,383,854,293 98.479% 95.879% 44.903% DCLD6h 43,360,340 6,345,333,158 98.588% 96.182% 44.537% DCND0h 43,367,032 6,378,584,039 98.554% 96.100% 44.853% DCND12h 43,325,992 6,348,538,225 98.628% 96.287% 44.535% DCND18h 43,322,194 6,324,925,416 98.746% 96.616% 44.344% DCND6h 43,371,146 6,317,422,287 98.808% 96.789% 44.331% DCSD0h 43,346,780 6,351,631,563 98.645% 96.330% 45.223% DCSD12h 43,372,700 6,340,560,437 98.670% 96.405% 44.700% DCSD18h 43,342,060 6,340,330,366 98.605% 96.254% 44.769% DCSD6h 43,340,566 6,381,388,011 98.578% 96.123% 44.667% Note: Sample is the sample name; clean reads are the remaining reads after filtering; clean bases are the remaining base numbers after filtering; Q20 rate refers to the proportion of bases with a quality score greater than 20 (error rate less than 1%) in the total filtered sequence; Q30 rate refers to the proportion of bases with a quality score greater than 30 (error rate less than 0.1%) in the total filtered sequence; GC content represents the GC content in the filtered data. Functional annotation and classification
-
To reveal the biological functions of new genes, an in-depth functional annotation analysis of 19,972 unigene sequences was conducted. The following seven databases were used: Nr (NCBI non-redundant database), proposed by Deng[23], where 16,519 transcripts matched in this database, accounting for 82.71%; Pfam (Protein family database), proposed by Finn[24], where 12,125 transcripts were annotated in this database, accounting for 60.71%; Uniprot, where 16,392 transcripts (82.07%) were annotated; KEGG (Kyoto Encyclopedia of Genes and Genomes), proposed by Kanehisa[25], where 12,583 transcripts were annotated, accounting for 63.00%; GO (Gene Ontology), proposed by Ashburner[21], where 12,385 transcripts were annotated in this database, accounting for 62.01%; KOG (Clusters of Orthologous Groups), proposed by Tatusov[22], where 101 transcripts were annotated in this database, accounting for 0.51%. Through these extensive database searches, rich functional information for these transcripts were provided, better understanding their biological roles (Table 2). This may reflect the specificity of the database, which focuses on conserved eukaryotic gene families. Given the unique genomic characteristics of D. carota and potential evolutionary differences from well-annotated species, many transcripts may not have corresponding homologues in the KOG database.
Table 2. Functional annotation results statistics.
Item Count Percentage (%) All 19,972 100.00 Annotation 16,564 82.94 KEGG 12,583 63.00 Nr 16,519 82.71 Uniprot 16,392 82.07 GO 12,385 62.01 KOG 101 0.51 Pfam 12,125 60.71 TF 525 2.63 After assembly, 19,972 unigenes were compared with relevant databases, among which 16,519 were annotated in the NR database. Based on the NR database comparison results, the top 10 species with the most comparisons were counted, and the rest were categorized as other species. The top 10 species were: Daucus carota subsp. sativus (16,096), Daucus carota (37), Helianthus annuus (14), Nyssa sinensis (14), Malus domestica (11), Gossypium australe (10), Theobroma cacao (10), Vitis vinifera (nine), Glycine max (nine), Parasponia andersonii (nine) (Fig. 2, Supplementary Table S1).
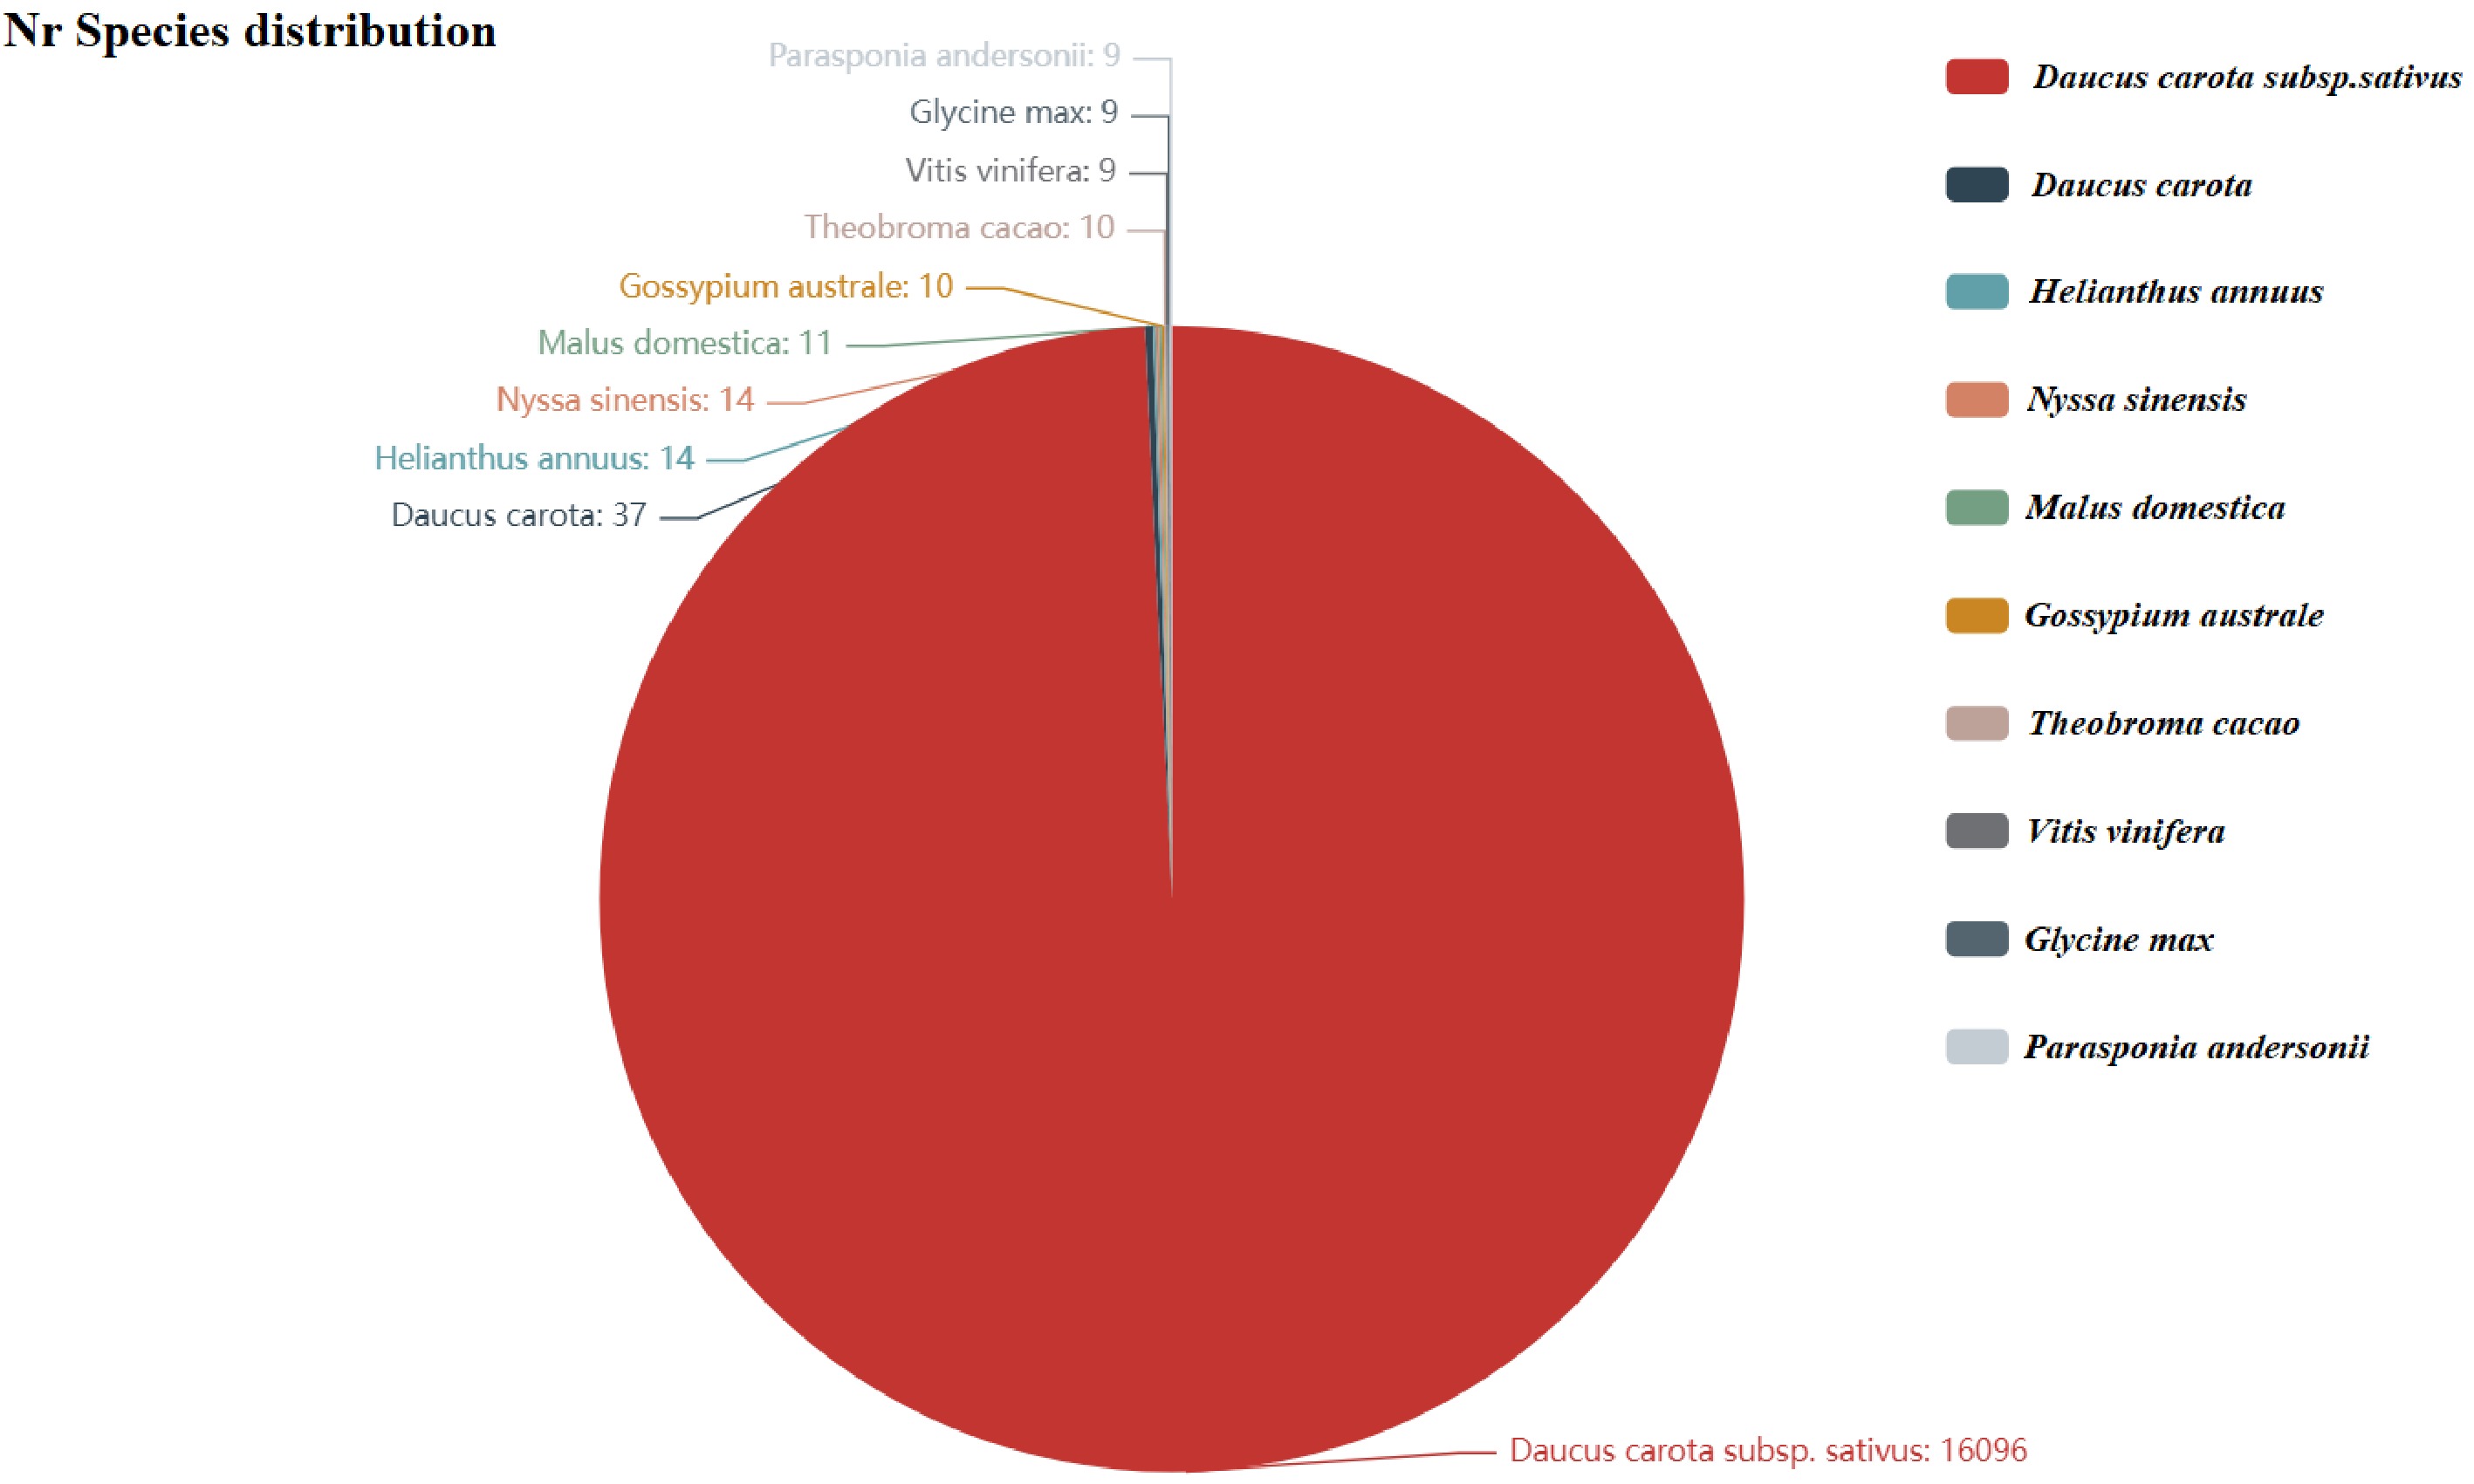
Figure 2.
Nr annotated species distribution map for carrot. The top 10 species with the most comparisons are counted. The number represents the number of different species in the Nr database. The different colors represent the different species. The species distribution of BLAST hits for each unigene occurs with a cut-off of 1E−5.
GO analysis
-
The expression profiles of carrot genes were searched in the GO database, and standardized gene functions were classified. There are four sub-levels of genetic information processing, with translation (759) and folding, classification, and degradation (530) dominating. In this category, genes related to ribosomal proteins and chaperone proteins are particularly abundant. Ribosomal protein L10 is involved in ribosome assembly and translation (RPL10). Research shows that 38 downstream components of the NIK1/RPL10 antiviral signaling module, LIMYB, which represses 39 translational machinery-related gene expression and translation, also suppresses 40 photosynthetic apparatus-related genes, leading to inhibition of the photosynthetic function[26]. This gene plays a key role in protein synthesis and may affect the overall efficiency of the photosynthetic mechanism in carrot leaves. A total of 12,385 unigenes were assigned to three main GO categories (biological process, cellular component, and molecular function). Regarding biological processes, transcription regulation, DNA-templated synthesis (276), defense response (21), and translation (141) involved the largest number of single-gene clusters. Among the cellular components, integral components of the membrane (3,094), the nucleus (1,122), and cytoplasm (579) were involved in the most single-gene clusters. The most common terms regarding molecular functions were ATP binding (1,767), metal ion binding (877), and RNA binding (666) (Fig. 3).
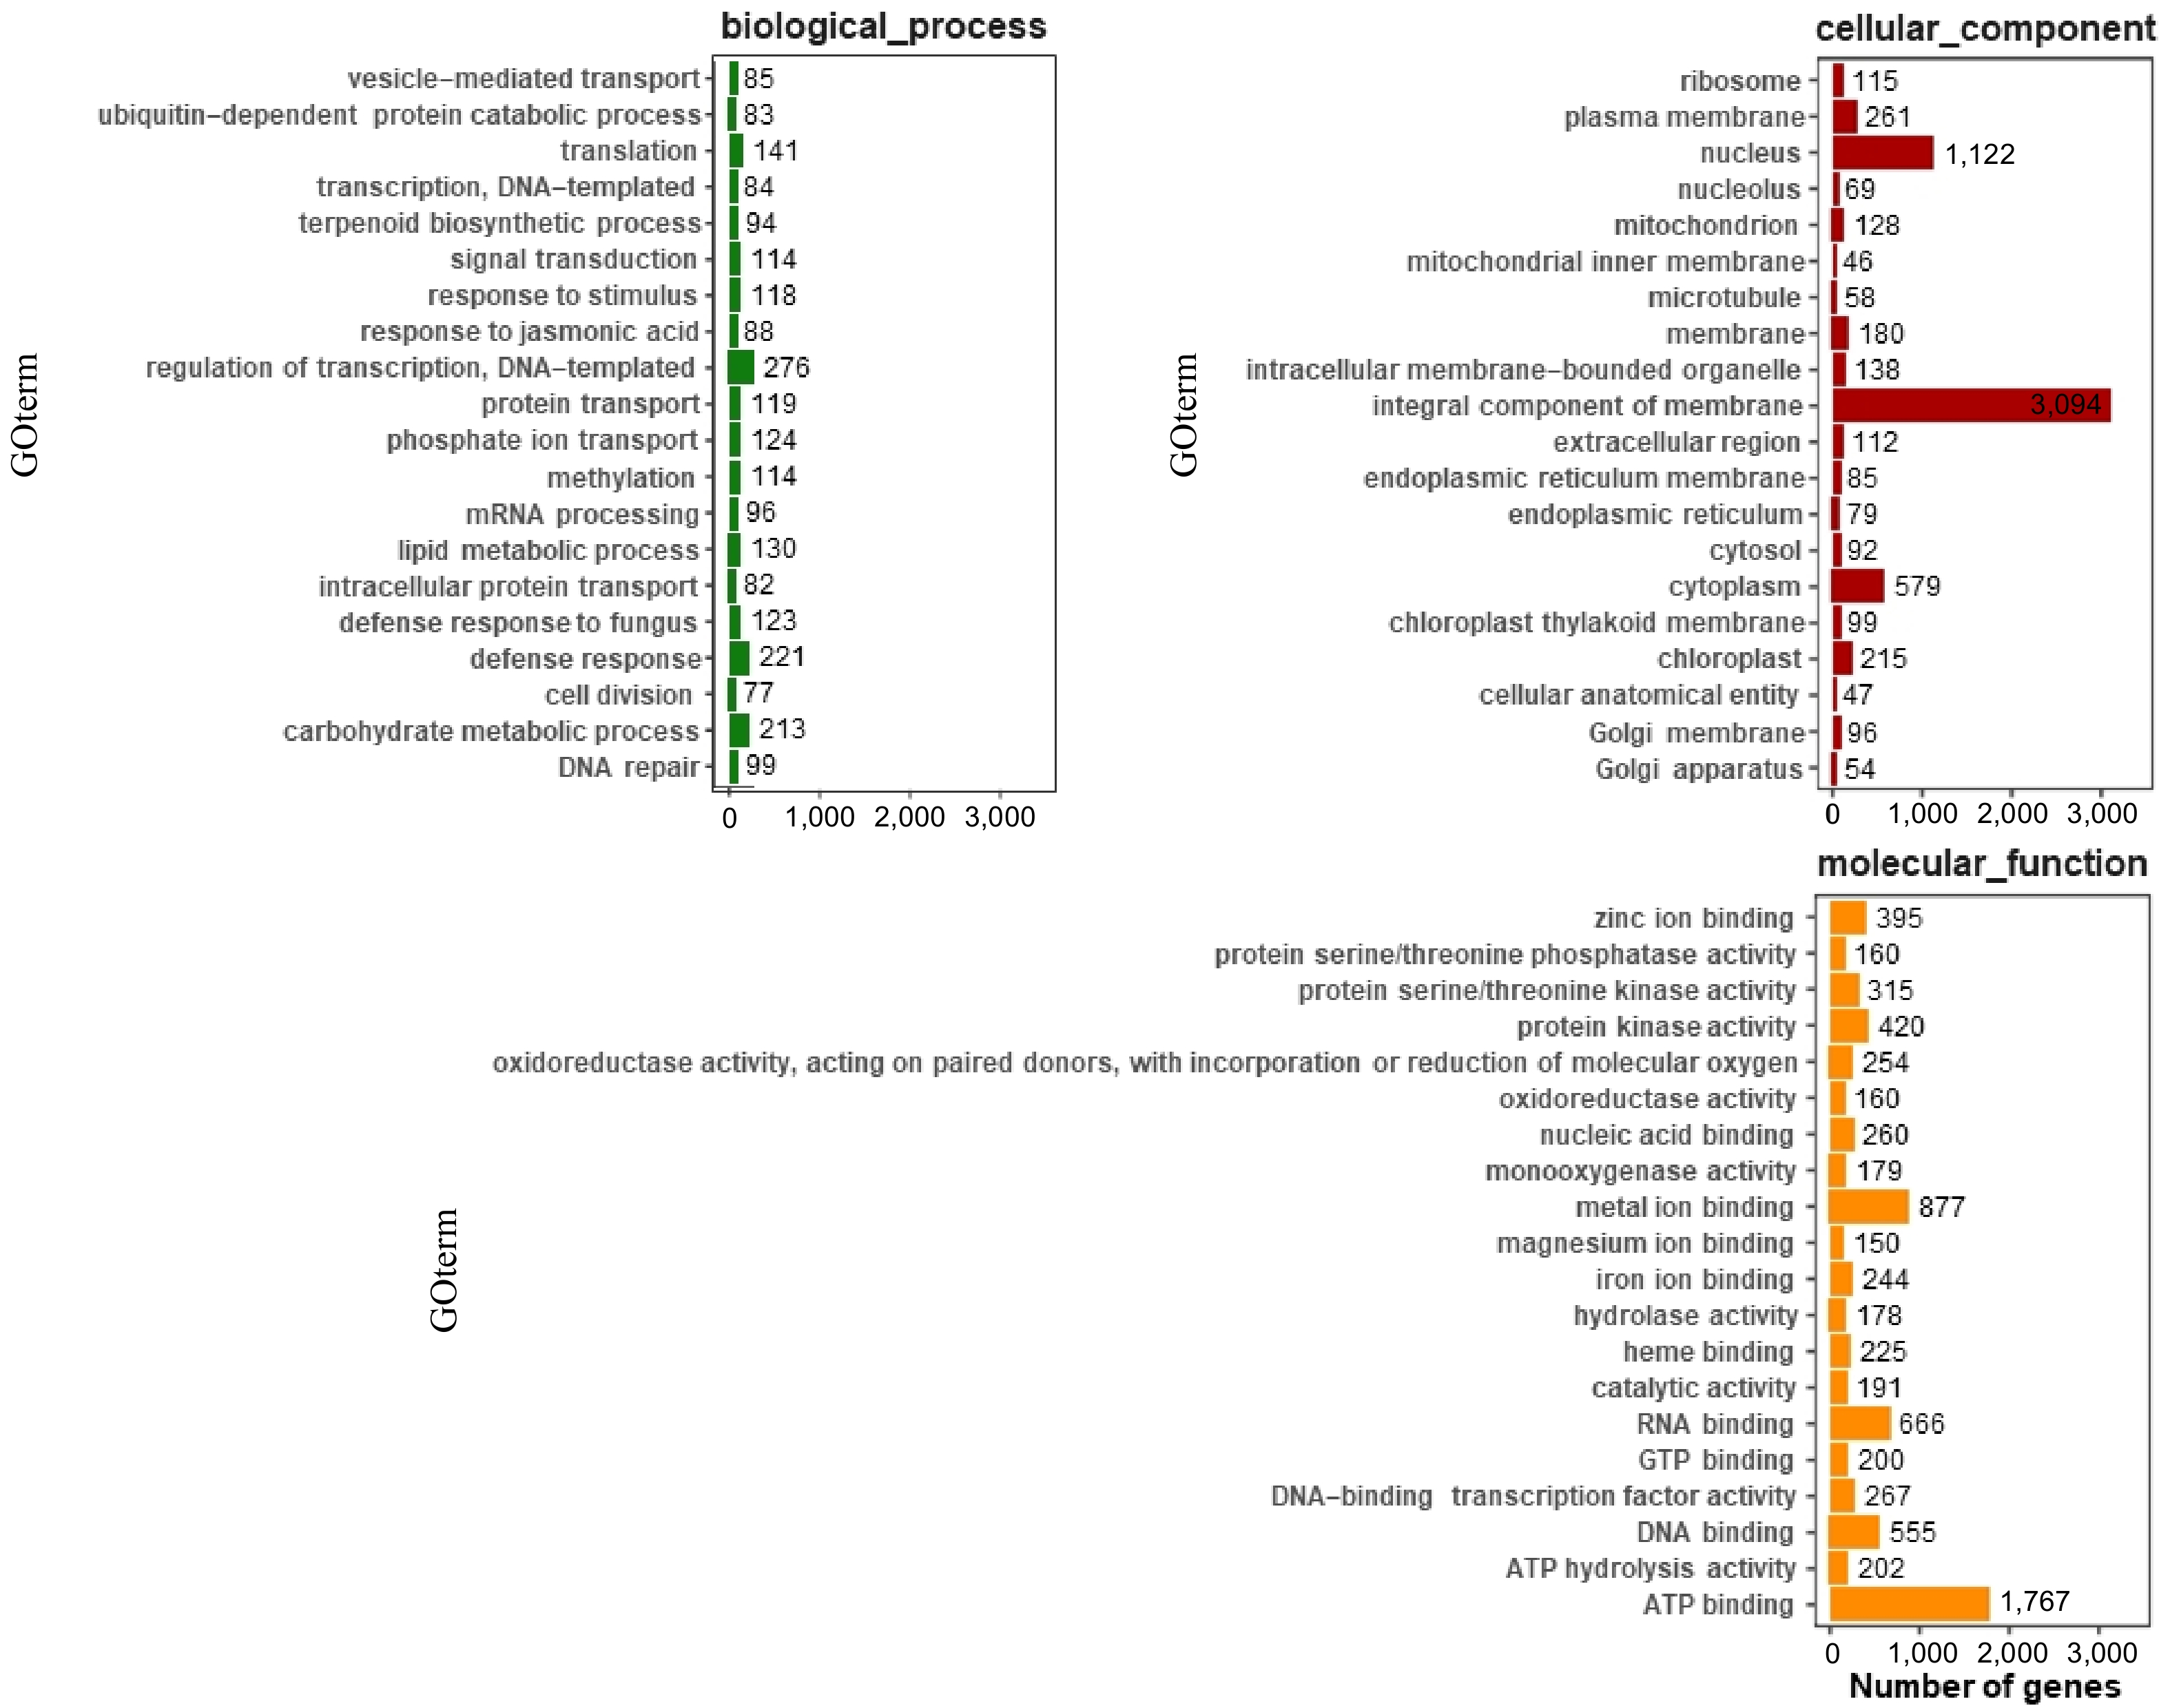
Figure 3.
GO annotation of functional genes in carrot. The top 20 most annotated GO slim terms were selected in each category; each single-copy gene was classified into at least one GO term. All single-copy genes were divided into three categories: molecular function, cellular component, and biological process.
KEGG classification
-
Following KEGG annotation of the unigene sequences, they were grouped based on the KEGG metabolic pathways in which they participated (Fig. 4). A total of 8,050 individual gene clusters were identified. The categorization was structured into five distinct tiers: cellular processes, environmental information processing, genetic information processing, metabolism, and organismal systems. Metabolism was the largest category, with 11 sublevels. The first three categories of these 11 sublevel metabolic pathways were global and overview maps (1,750), carbohydrate metabolism (535), and amino acid metabolism (368). There were four sublevels of genetic information processing, with translation (759), and folding, sorting, and degradation (530) accounting for the majority.
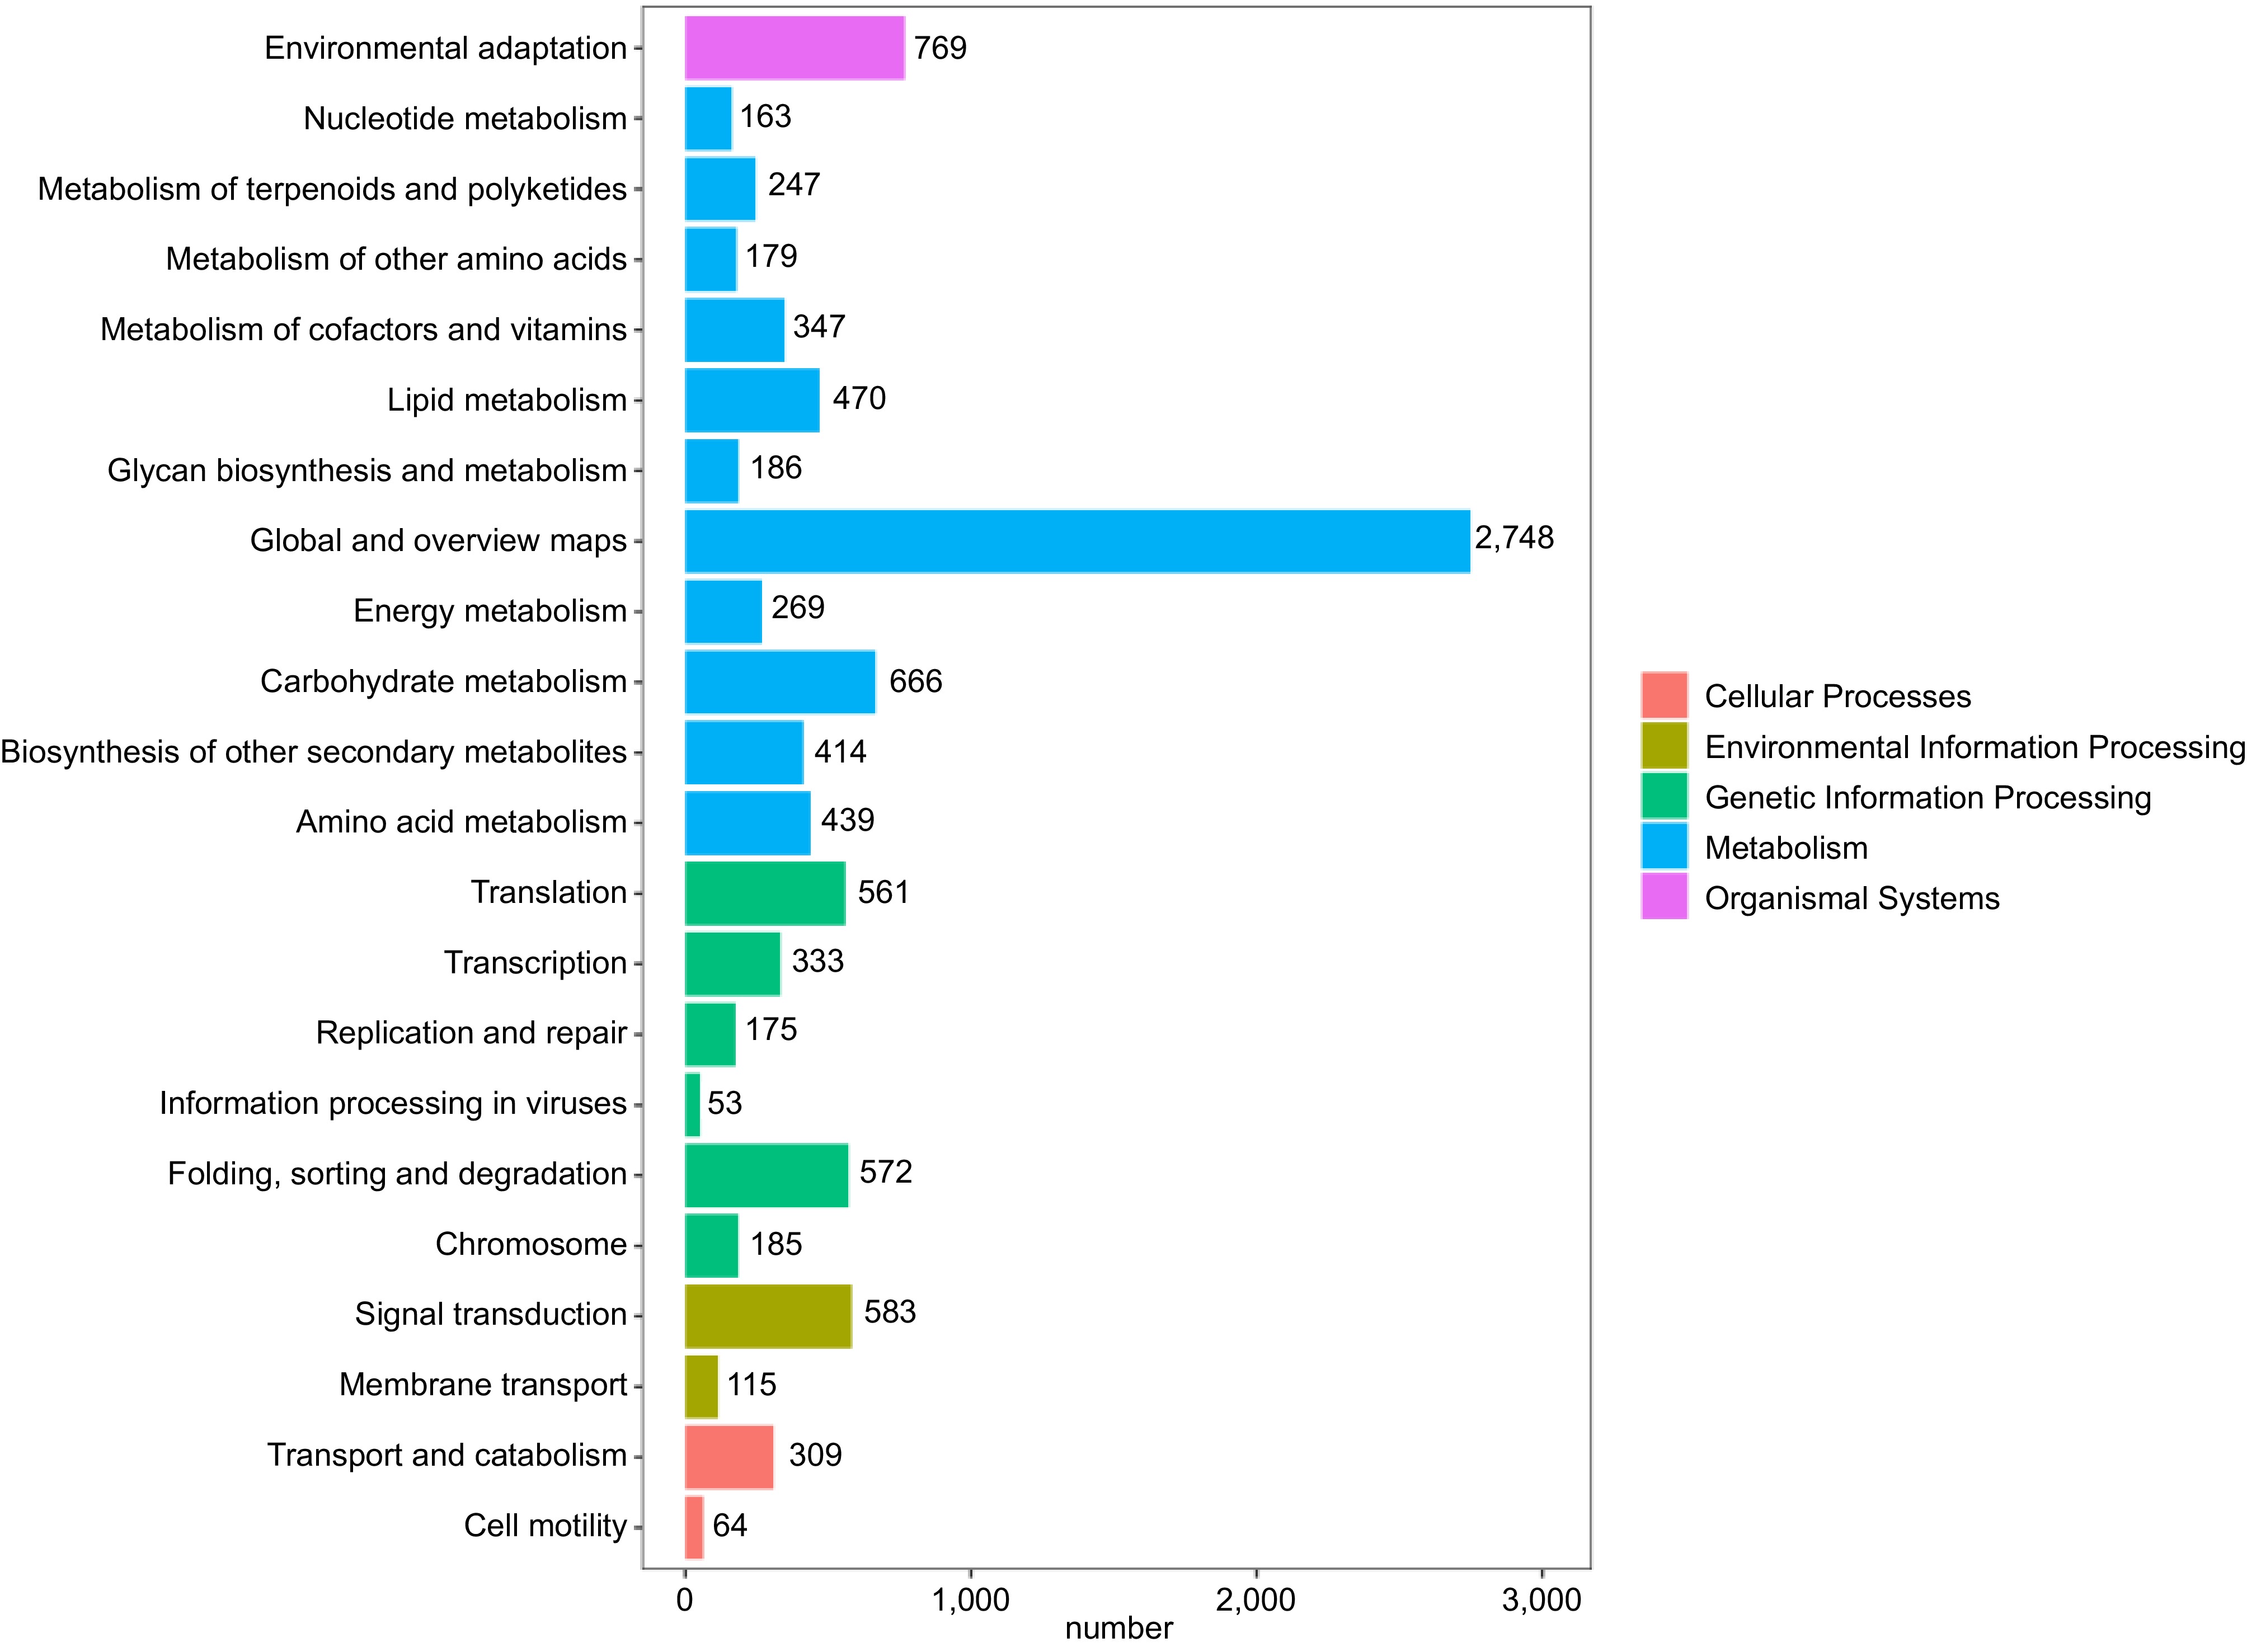
Figure 4.
KEGG metabolic pathway classification. Different colors represent the five classes involved in the KEGG metabolic pathway, and numbers represent the number of single genes in different classes.
KOG classification
-
The KOG database is a phylogenetic relational database specially constructed for eukaryotes. The KOG database divides eukaryotic genes into 18 different functional categories, which covers everything from basic biological processes to complex cellular functions. By KOG annotation of unigenes, they can be classified according to the KOG functional group. A total of 98 sequences were classified in the KOG database. Of the 18 KOG classes, 10 (10.20%) of the single gene function was not yet clear. Among the categories with known functions, 'posttranslational modification, protein turnover, chaperones' was the largest category, containing 36 single genes, accounting for 36.73% of the total. The importance of this category lies in the fact that it involved the ultimate maturation, stability, and functional regulation of proteins, which are all critical steps for proteins within cells to function properly. This was followed by the 'general function prediction only' category, which contains 28 single genes, accounting for 28.57% of the total. As shown in Fig. 5, this category may include some genes that have a wide range of functions, or are not yet well understood.
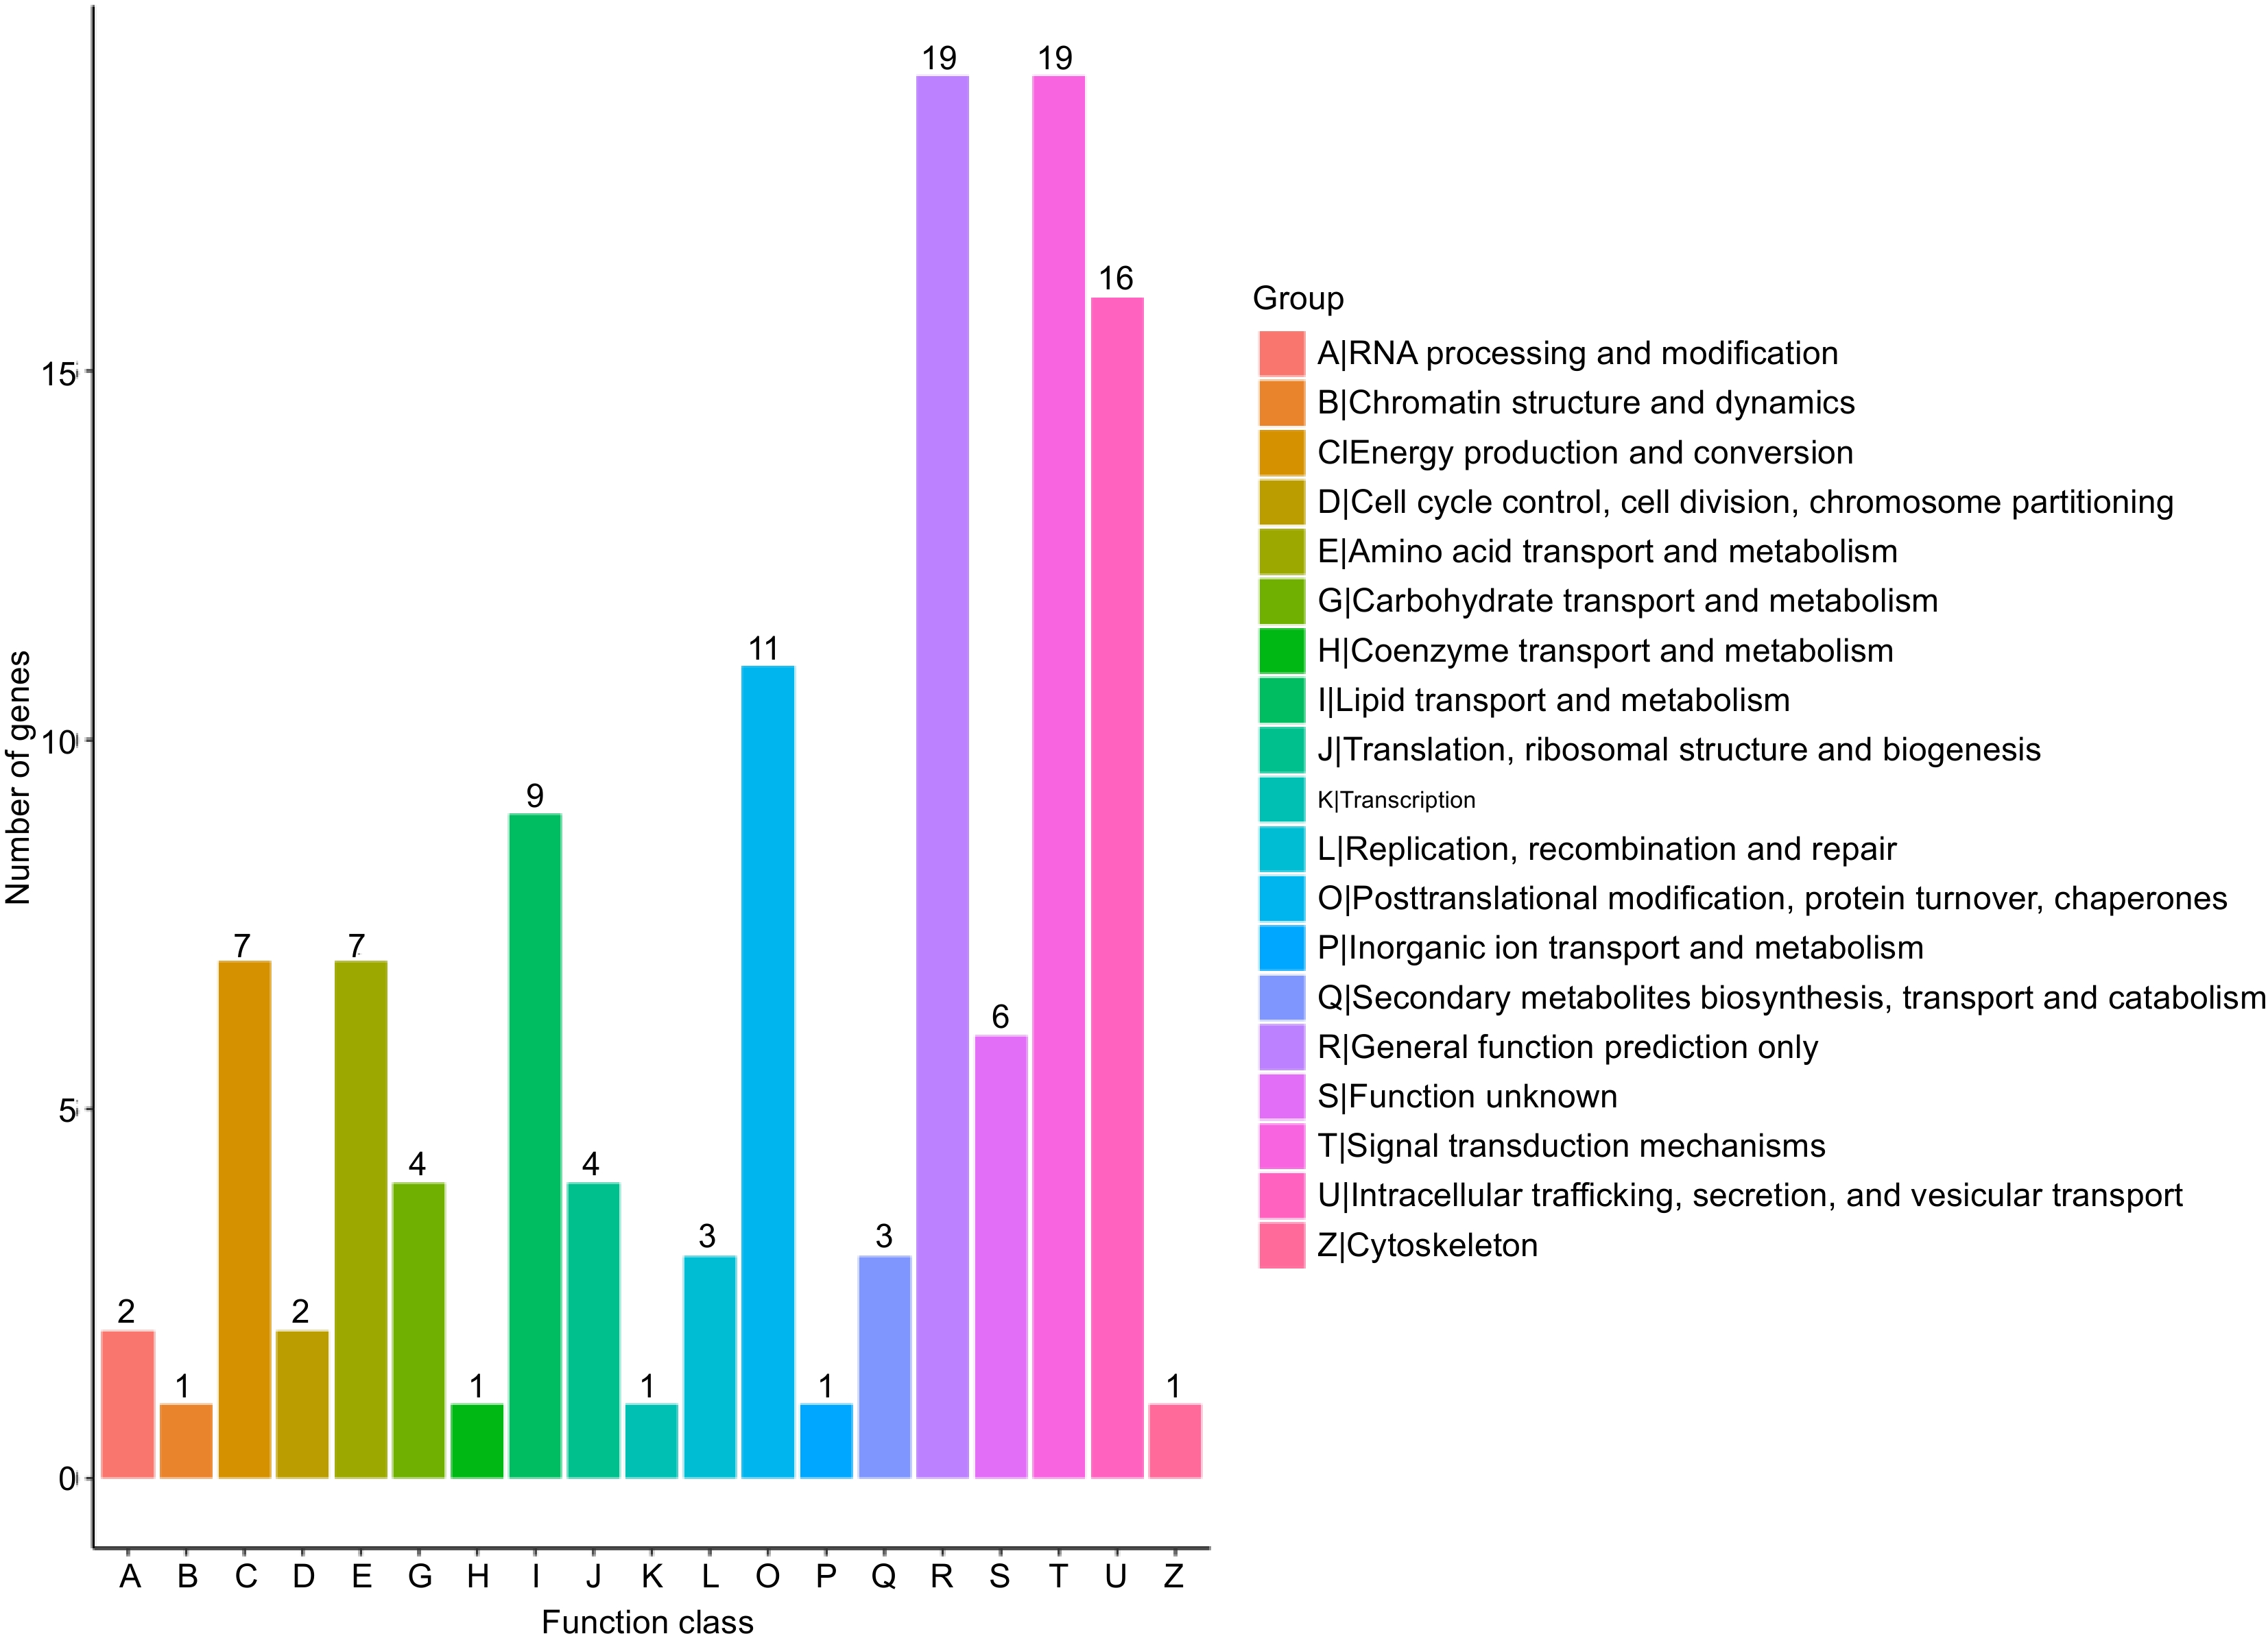
Figure 5.
Clusters of orthologous group classification.
Screening of differentially expressed genes of time-series sampling
-
Comparing carrot leaves at 10 different time points (LD0 h, LD6 h, LD12 h, LD18 h, ND6 h, ND12 h, ND18 h, SD6 h, SD12 h, SD18 h) with the initial time T0h, multiple differentially expressed genes (DEGs) were identified, and the overall distribution of different genes was inferred using volcano plots (Fig. 6, Supplementary Table S2). The results showed that LD0 h and LD6 h co-expressed 2,989 differentially expressed genes, of which 1,452 were upregulated and 1,537 were downregulated. LD0 h and LD12 h expressed 5,216 differentially expressed genes, with 2,438 upregulated and 2,778 downregulated. LD0 h and LD18 h co-expressed 4,851 differentially expressed genes, including 2,436 upregulated and 2,415 downregulated. LD0 h and SD6 h co-expressed 3,712 differentially expressed genes, with 1,669 upregulated and 2,043 downregulated. LD0 h and SD12 h co-expressed 4,805 differentially expressed genes, including 2,301 upregulated and 2,504 downregulated. LD0 h and SD18 h co-expressed 5,561 differentially expressed genes, with 2,716 upregulated and 2,845 downregulated. LD0 h and ND6 h co-expressed 2,797 differentially expressed genes, of which 1,415 were upregulated and 1,382 downregulated. LD0 h and ND12 h co-expressed 3,349 differentially expressed genes, with 1,542 upregulated and 1,807 downregulated. LD0 h and ND18 h co-expressed 3,180 differentially expressed genes, including 1,746 upregulated and 1,434 downregulated.
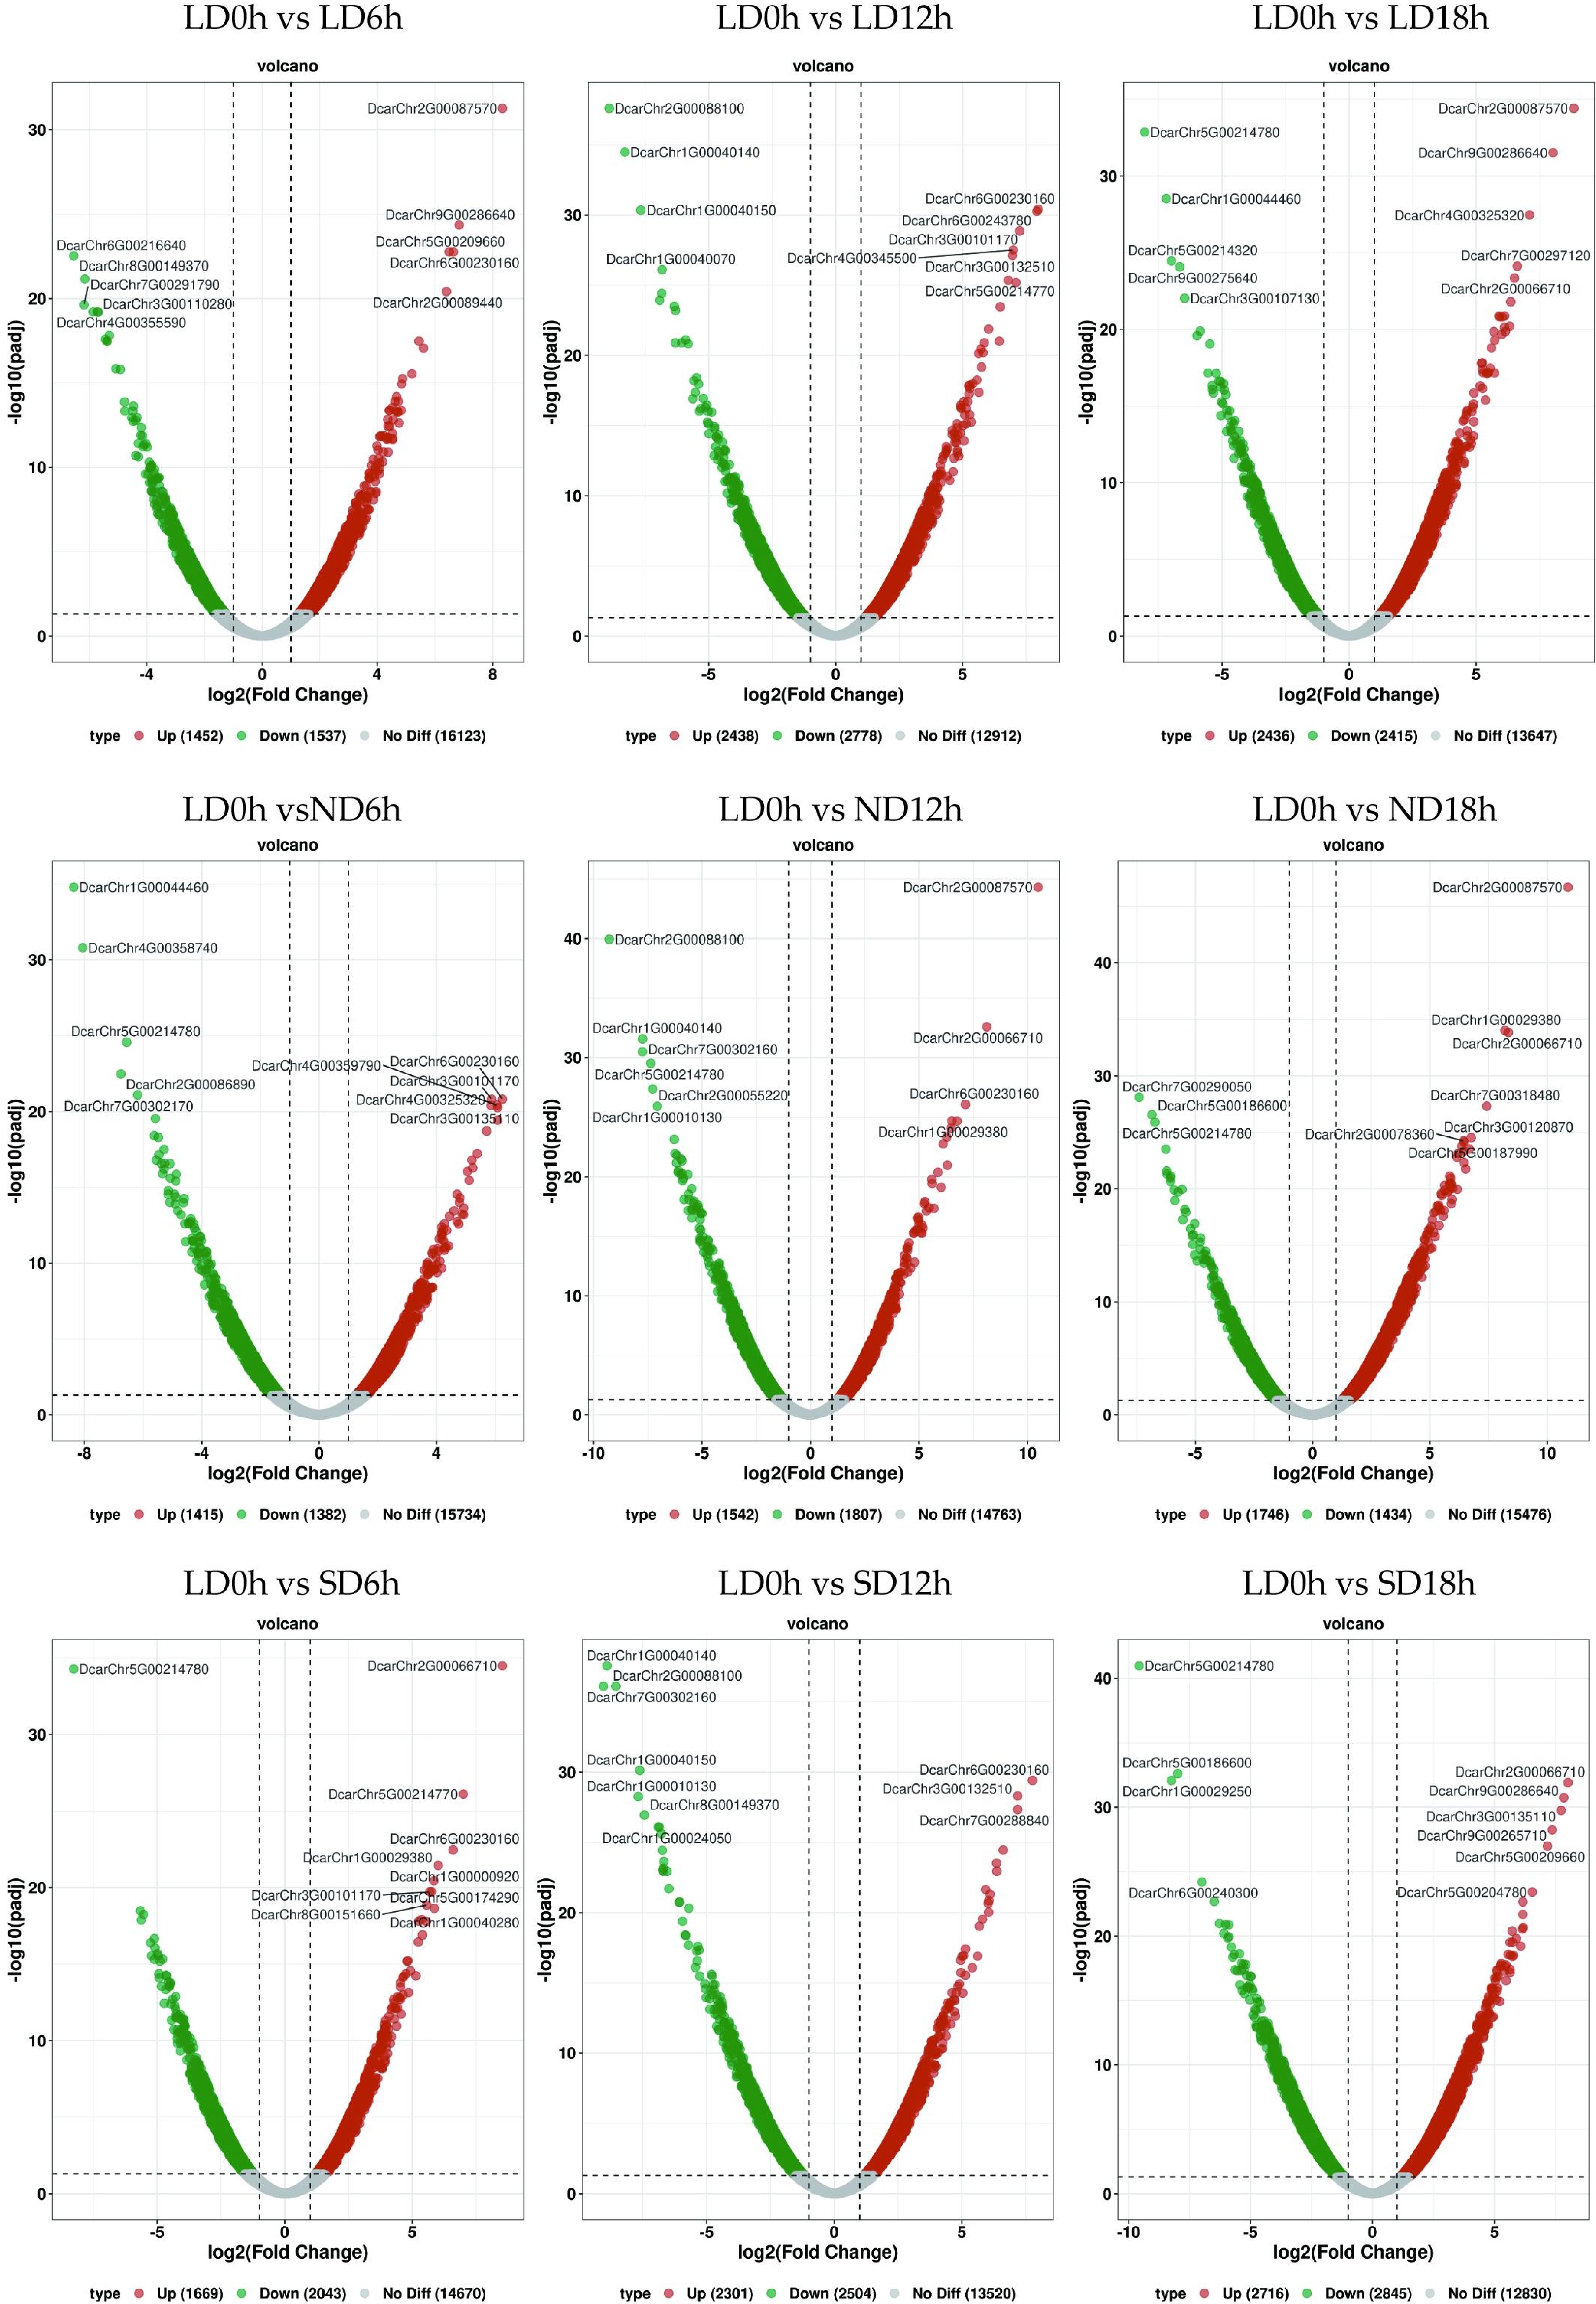
Figure 6.
Volcano map of differentially expressed genes. Each point represents a gene, the x-axis indicates the change in gene expression, represented by log2 fold change; the y-axis indicates the significance of these changes, represented by the negative log10 value or adjusted FDR.
Screening of different genes in the chlorophyll metabolic pathway in carrot plants at different time points
-
Through transcriptome sequencing, genes related to the regulation of the circadian rhythm of carrots under different photoperiods were screened. In LD0 h vs LD6 h, a total of two differentially expressed genes were downregulated, including CAO and CHL, and a total of two differentially expressed genes were upregulated, including Hem and POR. In LD0 h vs LD12 h, there is one differentially expressed downregulated gene CHL, and two genes Hem and POR are upregulated. In LD0 h vs LD18 h, there are three differentially expressed upregulated genes, namely CAO, CHL, and POR. In LD0 h vs ND6 h, a total of two differentially expressed genes were downregulated, including CAO and CAR, and a total of two differentially expressed genes were upregulated, including Hem and POR. In LD0 h vs ND12 h, there are two differentially expressed downregulated genes, CAR and CHL, and one differentially expressed upregulated gene, POR. In LD0 h vs ND18 h, the differential expression of CAR was downregulated. In LD0 h vs. SD6 h, there were two differentially expressed genes downregulated, including CAO and CHL, and two differentially expressed genes upregulated, including Hem and POR. In LD0 h vs. SD12 h, there were two differentially expressed downregulated genes, CAO and CHL, two differentially expressed upregulated genes, Hem and POR. In LD0 h vs SD18 h, there were two differentially expressed genes upregulated, including Hem and POR (Fig. 7, Supplementary Table S3).
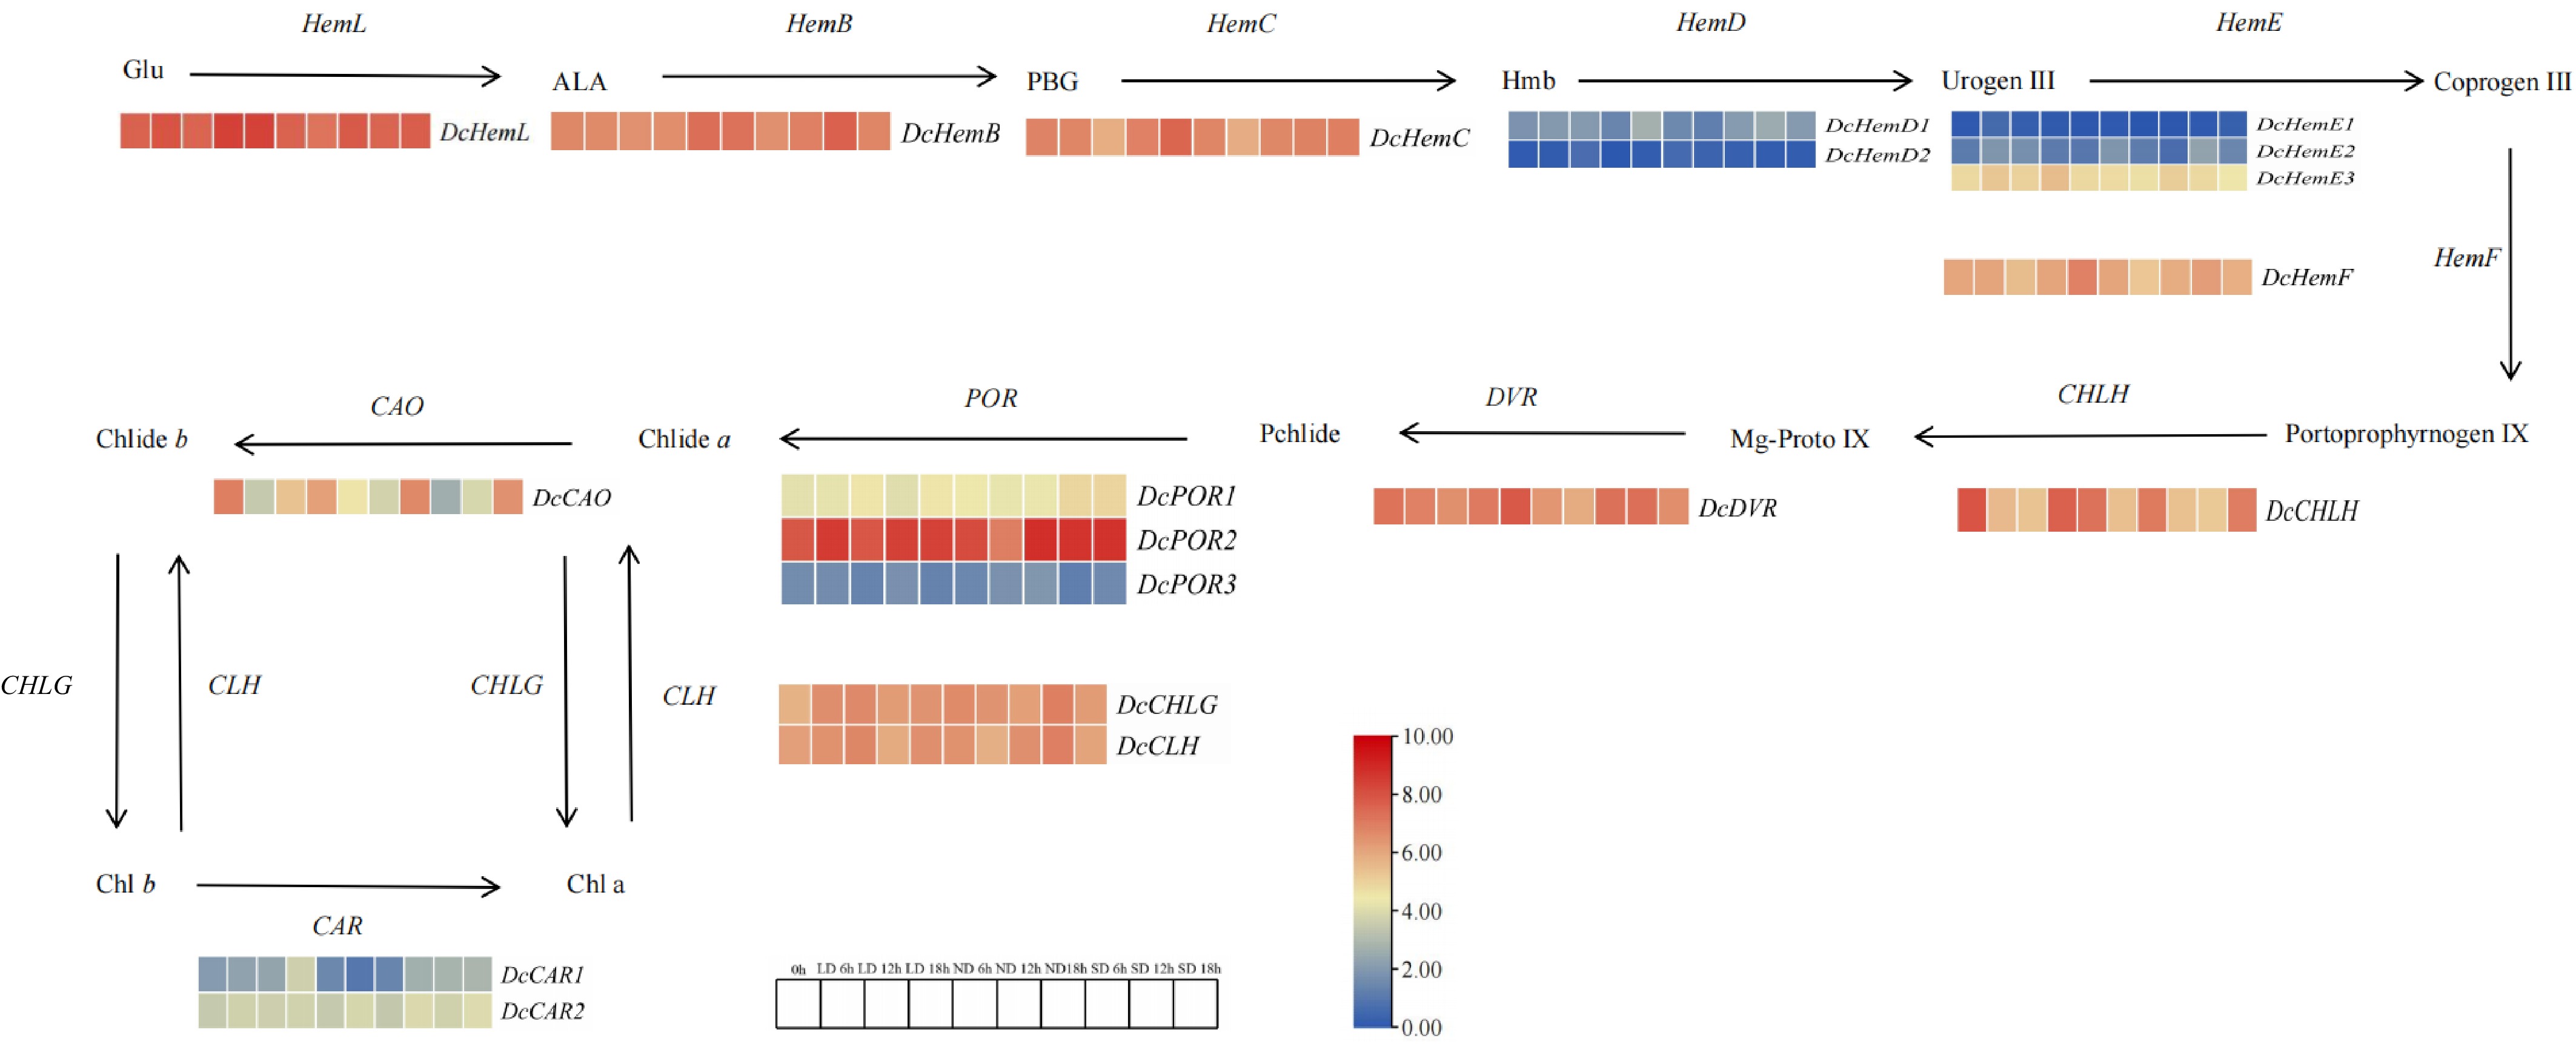
Figure 7.
Differential expression of chlorophyll metabolic pathways and related genes. Note: Red indicates upward adjustment, blue indicates downward adjustment. The heat map of the pathway shows the differential expression level of chlorophyll metabolism related genes in carrot leaves at different points and the initial time T0 h. Red and blue are used to represent the difference multiples after log2, from high to low.
-
Light functions as a critical environmental cue that regulates circadian rhythms. This signal is detected by specific photoreceptors and transduced to entrain the internal circadian clock, thereby enabling plants to synchronize their physiological processes with external diurnal cycles. Such photo regulatory mechanisms enhance adaptive responses to environmental variations and play a fundamental role in modulating growth and development[27]. In addition to physical environmental factors such as photoperiod, biological factors like rhizosphere microorganisms also play a key role in regulating plant growth and stress resistance[28]. This study examines the effects of various photoperiod regimes—specifically 12L/12D, 6L/18D, and 18L/6D on the growth and development of carrots by simulating distinct diurnal cycles. The experimental design aims to elucidate the role of day length in regulating carrot physiology, thereby offering an empirical foundation for improved cultivation practices and scientific crop management. Hu et al.[29] discussed how circadian rhythm affects the expression of genes related to chlorophyll metabolism in tea plants. Hu et al.[30] also found that under skeleton conditions of photoperiod, the expression profile of circadian clock genes and photosynthesis-related genes in tea plants changed, the circadian rhythm of tea plants was more disturbed, and the efficiency of photosynthesis decreased.
The levels of chlorophyll content in leaves directly reflected the nutritional and growth status of plants. Measuring chlorophyll content using the traditional biochemical method is a common and effective method. In this study, carrots grown under 16L/8D conditions exhibited higher chlorophyll a, chlorophyll b, and total chlorophyll values, indicating that extended light exposure favors chlorophyll synthesis and accumulation. Hu et al.[31] used high-throughput transcriptomic analysis techniques to explore the expression patterns of chlorophyll metabolism in tea plants under different light conditions, and identified differentially expressed genes related to chlorophyll metabolism. Enzymes involved in chlorophyll synthesis are light-responsive, and their activity increases with appropriately extended light exposure, leading to increased chlorophyll content. When plants are exposed to insufficient light for extended periods, the synthesis of photosynthetic pigments is affected, restricting photosynthesis and hindering plant growth[32−36].
The carrot transcriptome has been studied extensively, for example, using bioinformatics methods to identify two putative ALs coding genes in the carrot transcriptome. DcALs encode functional nuclear transcription factors, and DcAL4 promotes salt stress tolerance in plants[37]. By combining genomic and transcriptomic analyses, Koutouan et al.[38] identified, under the co-localization regions, terpene-related genes that are differentially expressed between a resistant and a susceptible carrot genotype. Transcriptomic analyses were performed to detect the key pathways and genes associated with the differential responses between ALB-resistant (HB55) and ALB-susceptible (14,088) carrot cultivars[39]. Using the available genomic and transcriptomic data, Yahyaa et al.[40] isolated a cDNA encoding eugenol/isoeugenol synthase, an NADPH-dependent enzyme that converts coniferyl acetate to eugenol. Huang et al.[41] compared transcriptomic analysis combined with metabolic profiling of two carrot cultivars producing different spectrums and levels of phenylpropene compounds revealed that biosynthesis of is elemicin and elemicin could proceed via the (iso) eugenol-independent pathway. However, the role of the carrot transcriptome in circadian rhythms has not been reported.
In this study, transcriptome analysis of carrot circadian rhythm genes under varying photoperiods revealed key regulators with photoperiod-dependent expression, High-throughput sequencing yielded 19,972 unigene sequences. Of these, 12,385 were assigned to 60 functional categories in the GO classification, 101 were grouped into 19 functional categories under KOG, and 12,583 were mapped to 22 metabolic pathways in the KEGG classification. The intricate biosynthesis, interconversion, and degradation of chlorophylls are fundamental to photosynthetic efficiency and plant adaptation.
This study synthesizes the roles of several key genes (Hem, CHLH, DVR, POR, CAO, CHLG, CLH, and CAR) within this metabolic network, elucidating their specific contributions and interdependencies. The Hem genes encode enzymes responsible for synthesizing δ-aminolaevulinic acid (ALA) and catalyzing its conversion to uroporphyrinogen III (UroIII) via porphobilinogen (PBG). Critically, the flux through the Hem-mediated pathway dictates the overall capacity for chlorophyll biosynthesis. Mutations or dysregulation in Hem genes typically result in reduced protochlorophyllide accumulation and chlorotic phenotypes, underscoring their essential role as suppliers of precursors for downstream chlorophyll-specific steps[42,43]. The activity of the CHLH gene, encoding the catalytic subunit of Mg-chelatase, is tightly regulated by light, circadian rhythms, and plastid-to-nucleus retrograde signaling. Impairment of CHLH function leads to severe chlorophyll deficiency and accumulation of protoporphyrin IX (Proto IX), demonstrating its non-redundant role in channeling porphyrin intermediates into the chlorophyll pathway. The light-dependent conversion of protochlorophyllide (Pchlide) to chlorophyllide (Chlide), catalyzed by POR, represents a crucial regulatory checkpoint preventing etioplastic development in darkness. Multiple POR isoforms often exist, with their expression and stability differentially modulated by light and developmental cues, ensuring precise spatiotemporal control of chlorophyll accumulation during de-etiolation and leaf development. Chlorophyll synthase, encoded by CHLG, catalyzes the final step of Chl a biosynthesis—the attachment of the phytol tail[44−46]. The conversion of Chl a to Chl b is mediated by CAO. Mutations in CAO result in a complete loss of Chl b, diminishing light-harvesting efficiency and altering the stoichiometry of light-harvesting complexes[47,48]. DVR ensures the production of stable nonvinyl chlorophyll species, which constitute the dominant functional forms in most plants. CLH initiates chlorophyll degradation by hydrolyzing Chl a (or b) to chlorophyllide a (or b) and phytol. Genes involved in carotenoid biosynthesis (represented by CAR play indispensable synergistic roles[49]. This underscores the essential interdependence between chlorophyll metabolism and carotenoid pathways in maintaining photosynthetic integrity and plant fitness[50−54]. The upregulation of Hem and POR genes under long-day conditions, and whether it is directly mediated by transcription factors (such as PIFs or HY5) within the light signaling pathway, as well as how these expression changes further affect photosynthetic efficiency and plant biomass, are important directions for future investigation.
In this study, the aim was to understand the effects of dynamic photoperiod change on chlorophyll metabolism by adjusting the photoperiod in carrot. These studies provide a possible reference for understanding the growth and development mechanism of carrot regulated by the circadian rhythm. To date, the circadian regulatory network in carrot remains uncharted territory. This study provides valuable insights into key integrator genes within the carrot photoperiod pathway, establishing a foundational framework for understanding root crop-specific circadian adaptations.
-
In this study, high-throughput transcriptomics technology was employed to analyze the response of chlorophyll metabolism in carrots to photoperiod changes. The research results show that photoperiod has a significant impact on the photosynthetic characteristics and chlorophyll synthesis of carrot plants. Under the condition of 16L/8D, the correlation values between photosynthesis and chlorophyll content increased significantly. The coordinated action of the Hem, CHLH, POR, CHLG, CAO, DVR, and CLH genes constitutes the core enzymatic and regulatory framework governing the chlorophyll life cycle. Although operating within a parallel biosynthetic pathway, the genes are intrinsically linked to this network, providing essential photoprotection, and structural support for chlorophyll-protein complexes. This integrated metabolic network is subject to multi-layered regulatory control spanning transcriptional, post-transcriptional, post-translational, and retrograde signaling mechanisms ensuring chlorophyll homeostasis is maintained in synchrony with developmental programs and environmental cues. Future research should prioritize elucidating the precise mechanisms of crosstalk between these pathways, the spatial organization of key enzymes within chloroplasts, and the fine-tuning of gene expression networks to optimize photosynthetic performance.
The research was supported by the Fundamental Research Funds for the Central Universities (KYLH2025002), the Open Research Project of Key Laboratory of Biotechnology of Qinghai-Tibet Plateau Biotechnology of the Ministry of Education (2023-SYS-02), the Priority Academic Program Development of Jiangsu Higher Education Institutions Project (PAPD), and the Bioinformatics Center of Nanjing Agricultural University.
-
The authors confirm contribution to the paper as follows: conceptualization: Zhang N, Hu ZH, Xiong AS; data curation: Zhang N, Hu ZH, Wang LX, Chen C, Liu H; investigation: Chen C, Liu H, Wang LX, Hu ZH; project administration: Zhuang J, Xiong AS; writing original draft preparation: Zhang N, Hu ZH: writing review and editing: Zhang N, Hu ZH. All authors reviewed the results and approved the final version of the manuscript.
-
All data generated or analyzed during this study are included in this published article.
-
The authors declare that they have no conflict of interest.
-
# Authors contributed equally: Nan Zhang, Zhi-Hang Hu
- Supplementary Table S1 Nr annotated species distribution map for Daucus carota.
- Supplementary Table S2 Differentially expressed genes of time-series sampling.
- Supplementary Table S3 Differential expression of chlorophyll metabolic pathways and related genes.
- Copyright: © 2025 by the author(s). Published by Maximum Academic Press, Fayetteville, GA. This article is an open access article distributed under Creative Commons Attribution License (CC BY 4.0), visit https://creativecommons.org/licenses/by/4.0/.
-
About this article
Cite this article
Zhang N, Hu ZH, Wang LX, Chen C, Zhuang J, et al. 2025. High-throughput transcriptomic analysis of circadian rhythm under different photoperiods in carrot. Vegetable Research 5: e042 doi: 10.48130/vegres-0025-0037 

High-throughput transcriptomic analysis of circadian rhythm under different photoperiods in carrot
- Received: 29 June 2025
- Revised: 27 August 2025
- Accepted: 29 August 2025
- Published online: 05 November 2025
Abstract: Carrot (Daucus carota L.) is an important root vegetable crop belonging to the Apiaceae family. The biological clock, or circadian rhythm, is typically a 24 h endogenous cycle that plays a crucial role in how higher plants perceive environmental changes through its function as an internal timing molecular network. Photoperiod regulates growth and development processes, and also affects the chlorophyll synthesis of carrot plants. This study employed high-throughput transcriptome analysis technology to investigate changes in gene expression within chlorophyll metabolism-related genes of carrots under different treatments in a single photoperiod (24 h). Three distinct environments were used: photoperiodic lighting (16 h of light : 8 h of dark, 16L/8D), photoperiodic lighting (12 h of light : 12 h of dark, 12L/12D), and photoperiodic lighting (8 h of light : 16 h of dark, 8L/16D) conditions. Time-series sampling was conducted at 3 h intervals (24 h), during which chlorophyll values were measured. Subsequently, transcriptome sequencing was performed at four time points, and bioinformatics analysis was used to identify and annotate differentially expressed genes involved in chlorophyll metabolism. The present results demonstrate that long-day conditions (16L/8D) significantly promote the accumulation of chlorophyll a, chlorophyll b, and total chlorophyll in carrot leaves, with peak values reaching 1.160 and 0.486 mg·g−1 at 15 h, respectively. Transcriptome analysis revealed numerous differentially expressed genes (DEGs) associated with the circadian rhythm and chlorophyll metabolism across the different photoperiods. Key chlorophyll biosynthetic genes, such as Hem and POR, were upregulated under long-day conditions, whereas genes like CAO and CHL showed differential expression patterns indicative of photoperiodic regulation. The present findings provide a potential molecular basis for understanding how photoperiods regulate chlorophyll metabolism in carrots, revealing the intrinsic mechanisms of circadian rhythm regulation in carrots.