-
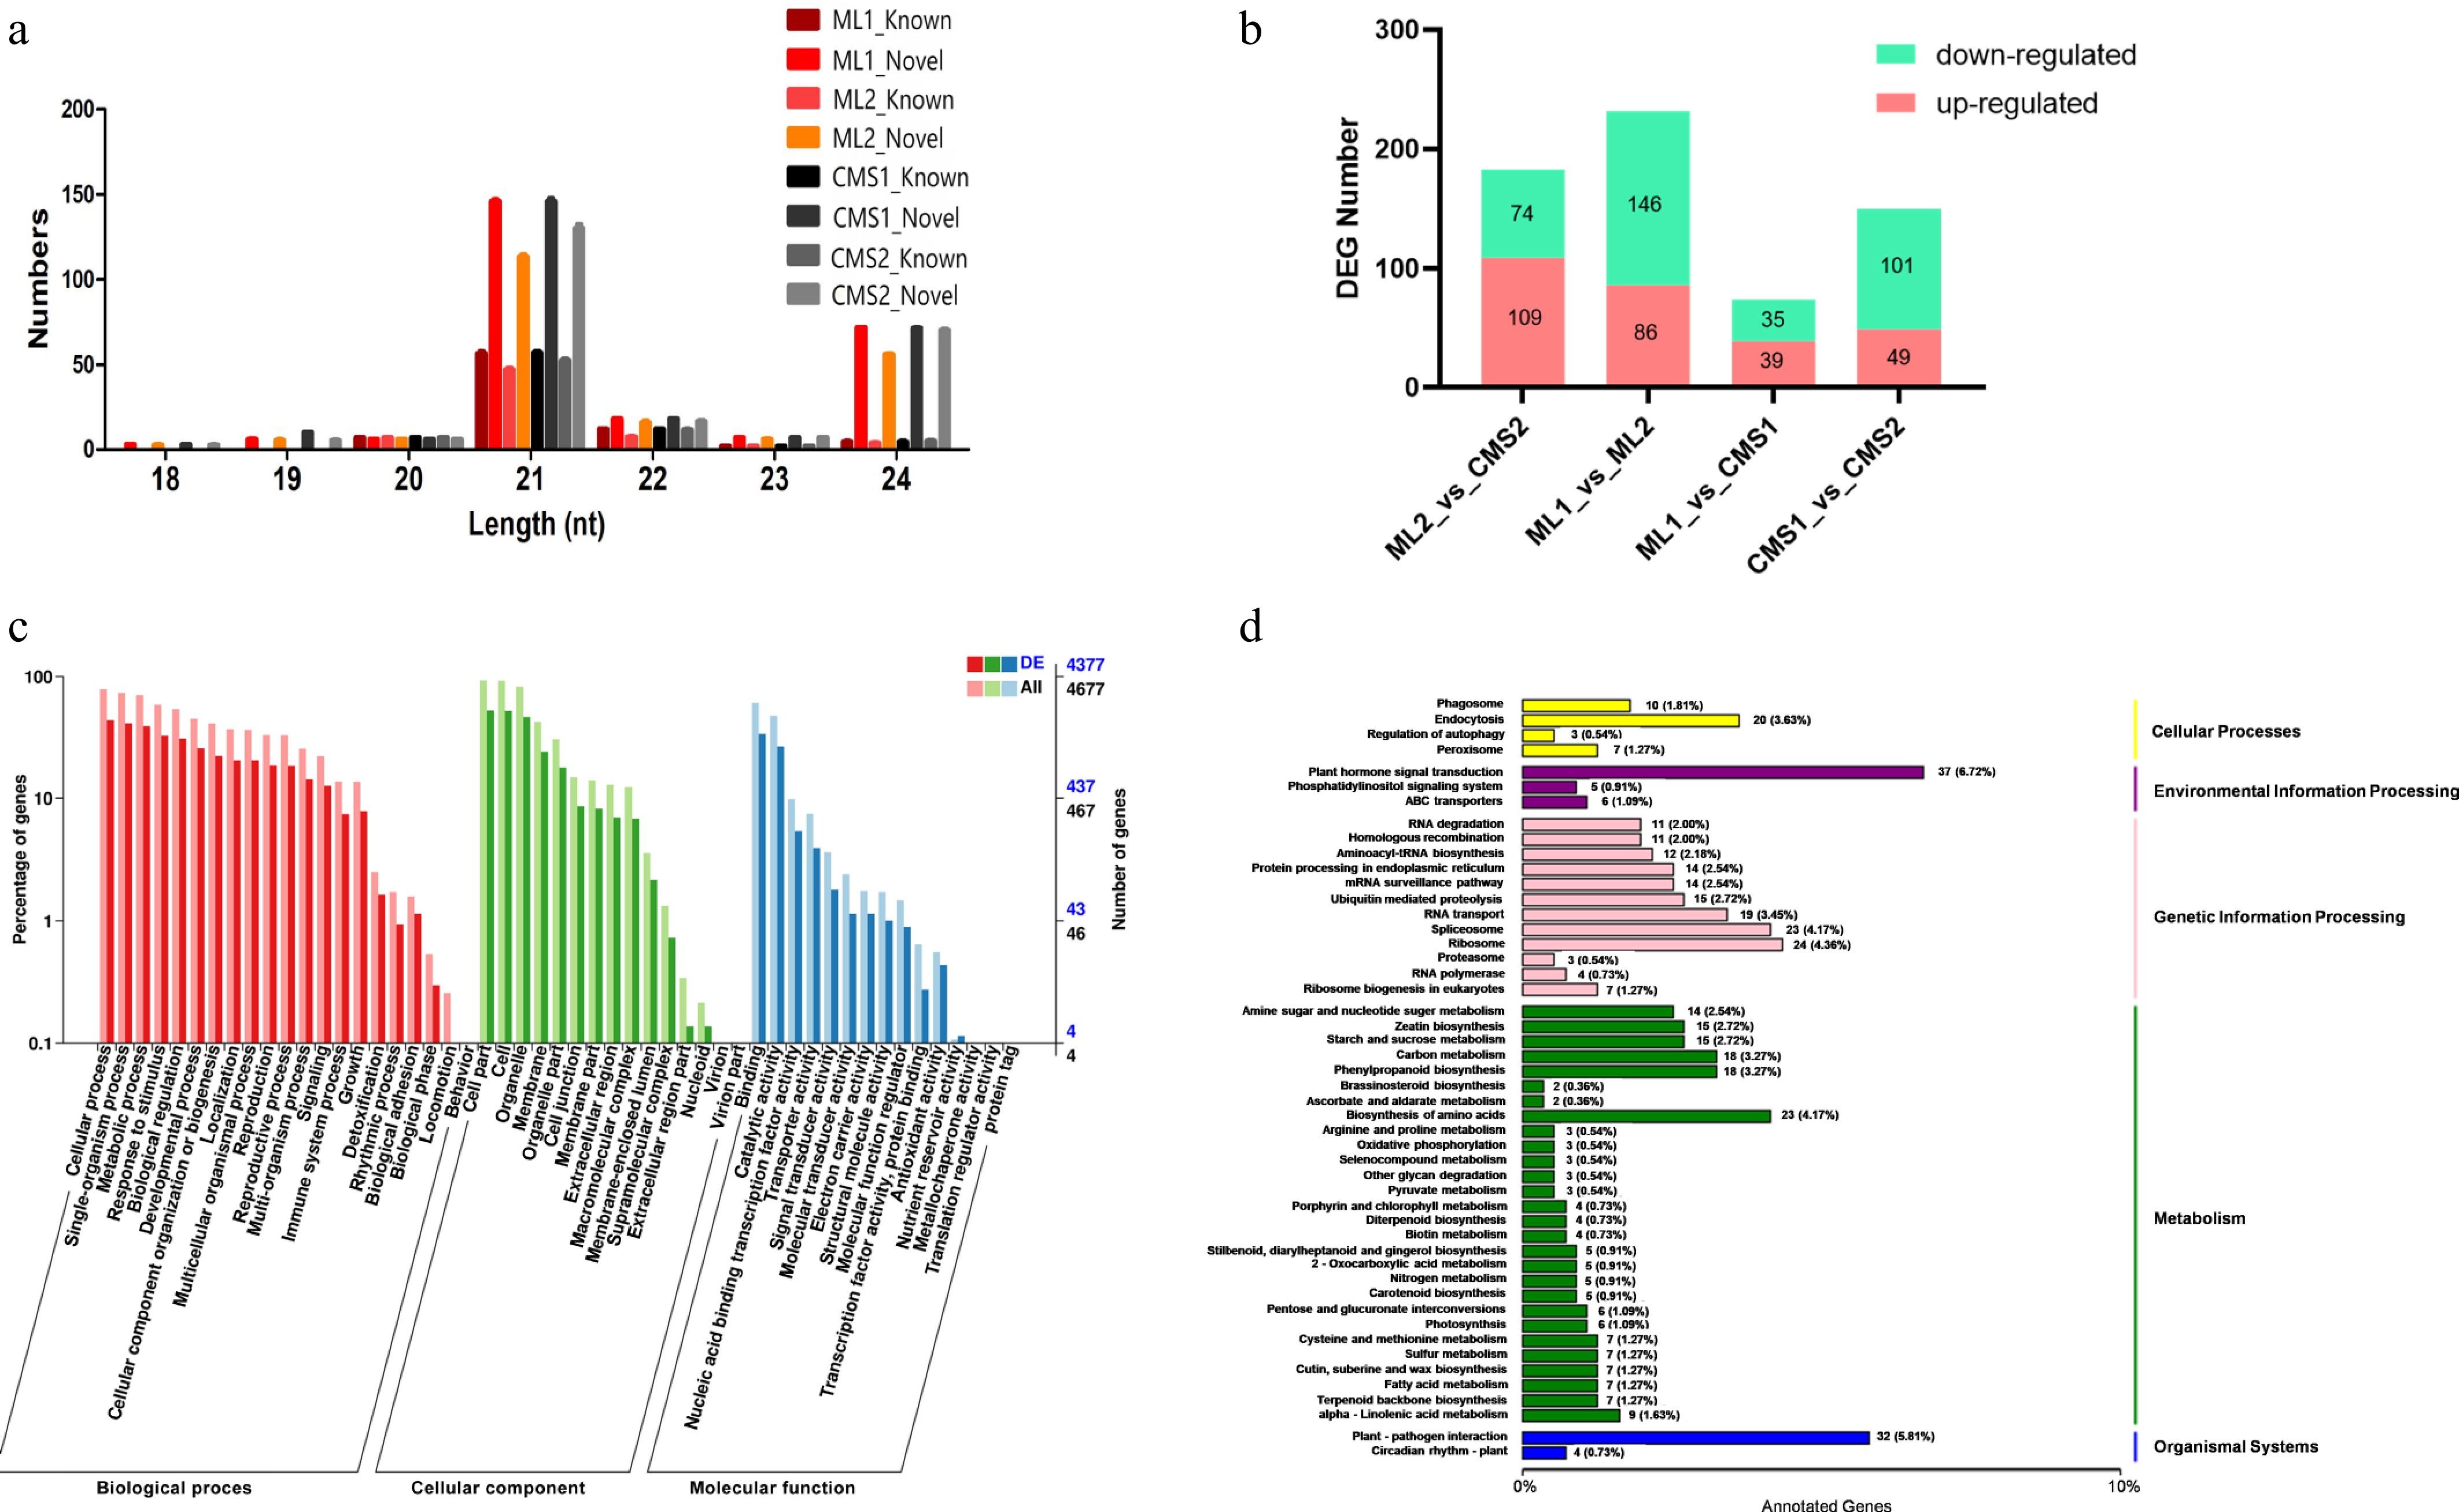
Figure 1.
Sequencing results of miRNAs in different pollen development periods of Ogura-type cytoplasmic male sterile and maintainer lines of Chinese cabbage. CMS1 refers to the early stage of pollen development in sterile lines, CMS2 refers to late pollen development in sterile lines, ML1 refers to the early development of pollen in the retention line, ML2 refers to the late stage of pollen development in the maintenance line. (a) Length statistics of known miRNAs and new miRNAs. (b) Statistics on the number of differentially expressed miRNAs in Ogura-type cytoplasmic male sterile and maintainer lines of Chinese cabbage during different pollen developmental periods. (c) GO annotation of target mRNAs of differentially expressed miRNAs in two lines of Chinese cabbage during late pollen development (ML2 vs CMS2). (d) KEGG pathway enrichment of target mRNAs of differentially expressed miRNAs in two lines of Chinese cabbage during late pollen development (ML2 vs CMS2).
-
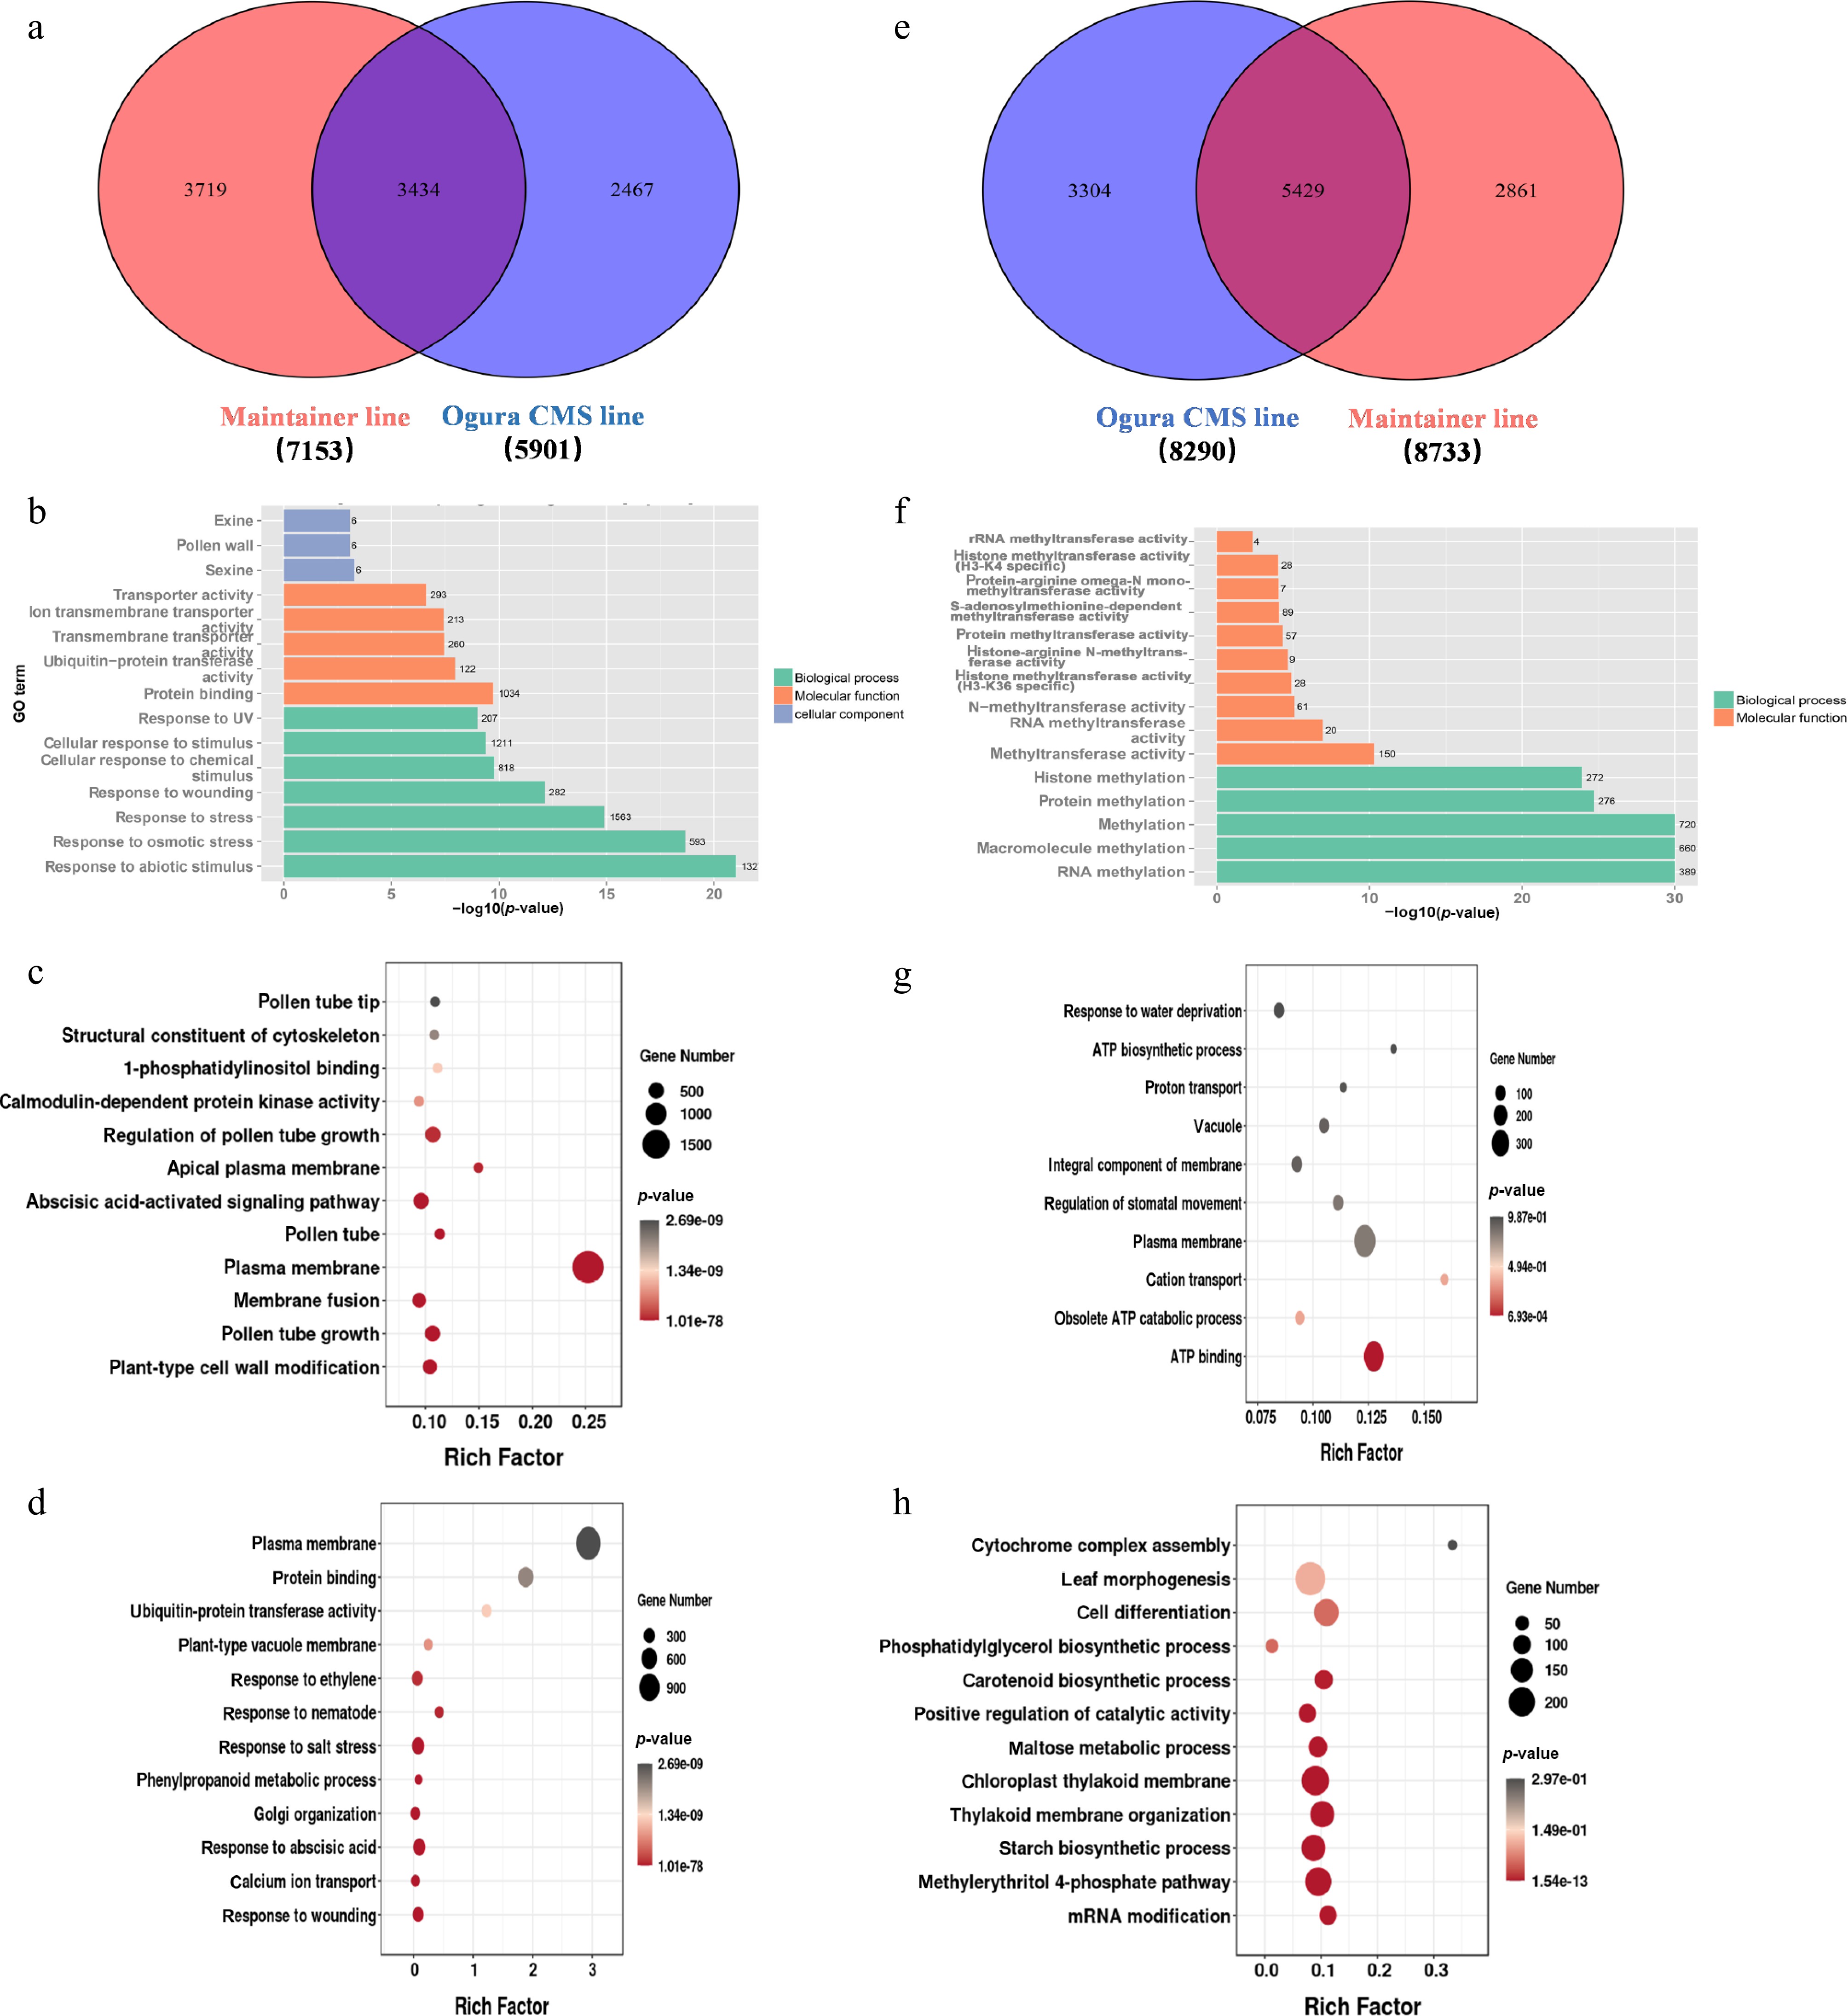
Figure 2.
Functional enrichment analysis of late-stage differentially expressed genes (DEGs) in Chinese cabbage Ogura CMS and maintainer lines. (a) Venn diagram quantifying upregulated DEGs: co-expressed and line-specific. (b) GO enrichment of co-expressed upregulated DEGs. (c) GO enrichment of maintainer line-specific upregulated DEGs. (d) GO enrichment of Ogura CMS line-specific upregulated DEGs. (e) Venn diagram quantifying downregulated DEGs: co-expressed and line-specific. (f) GO enrichment of co-expressed downregulated DEGs. (g) GO enrichment of maintainer line-specific downregulated DEGs. (h) GO enrichment of Ogura CMS line-specific downregulated DEGs.
-
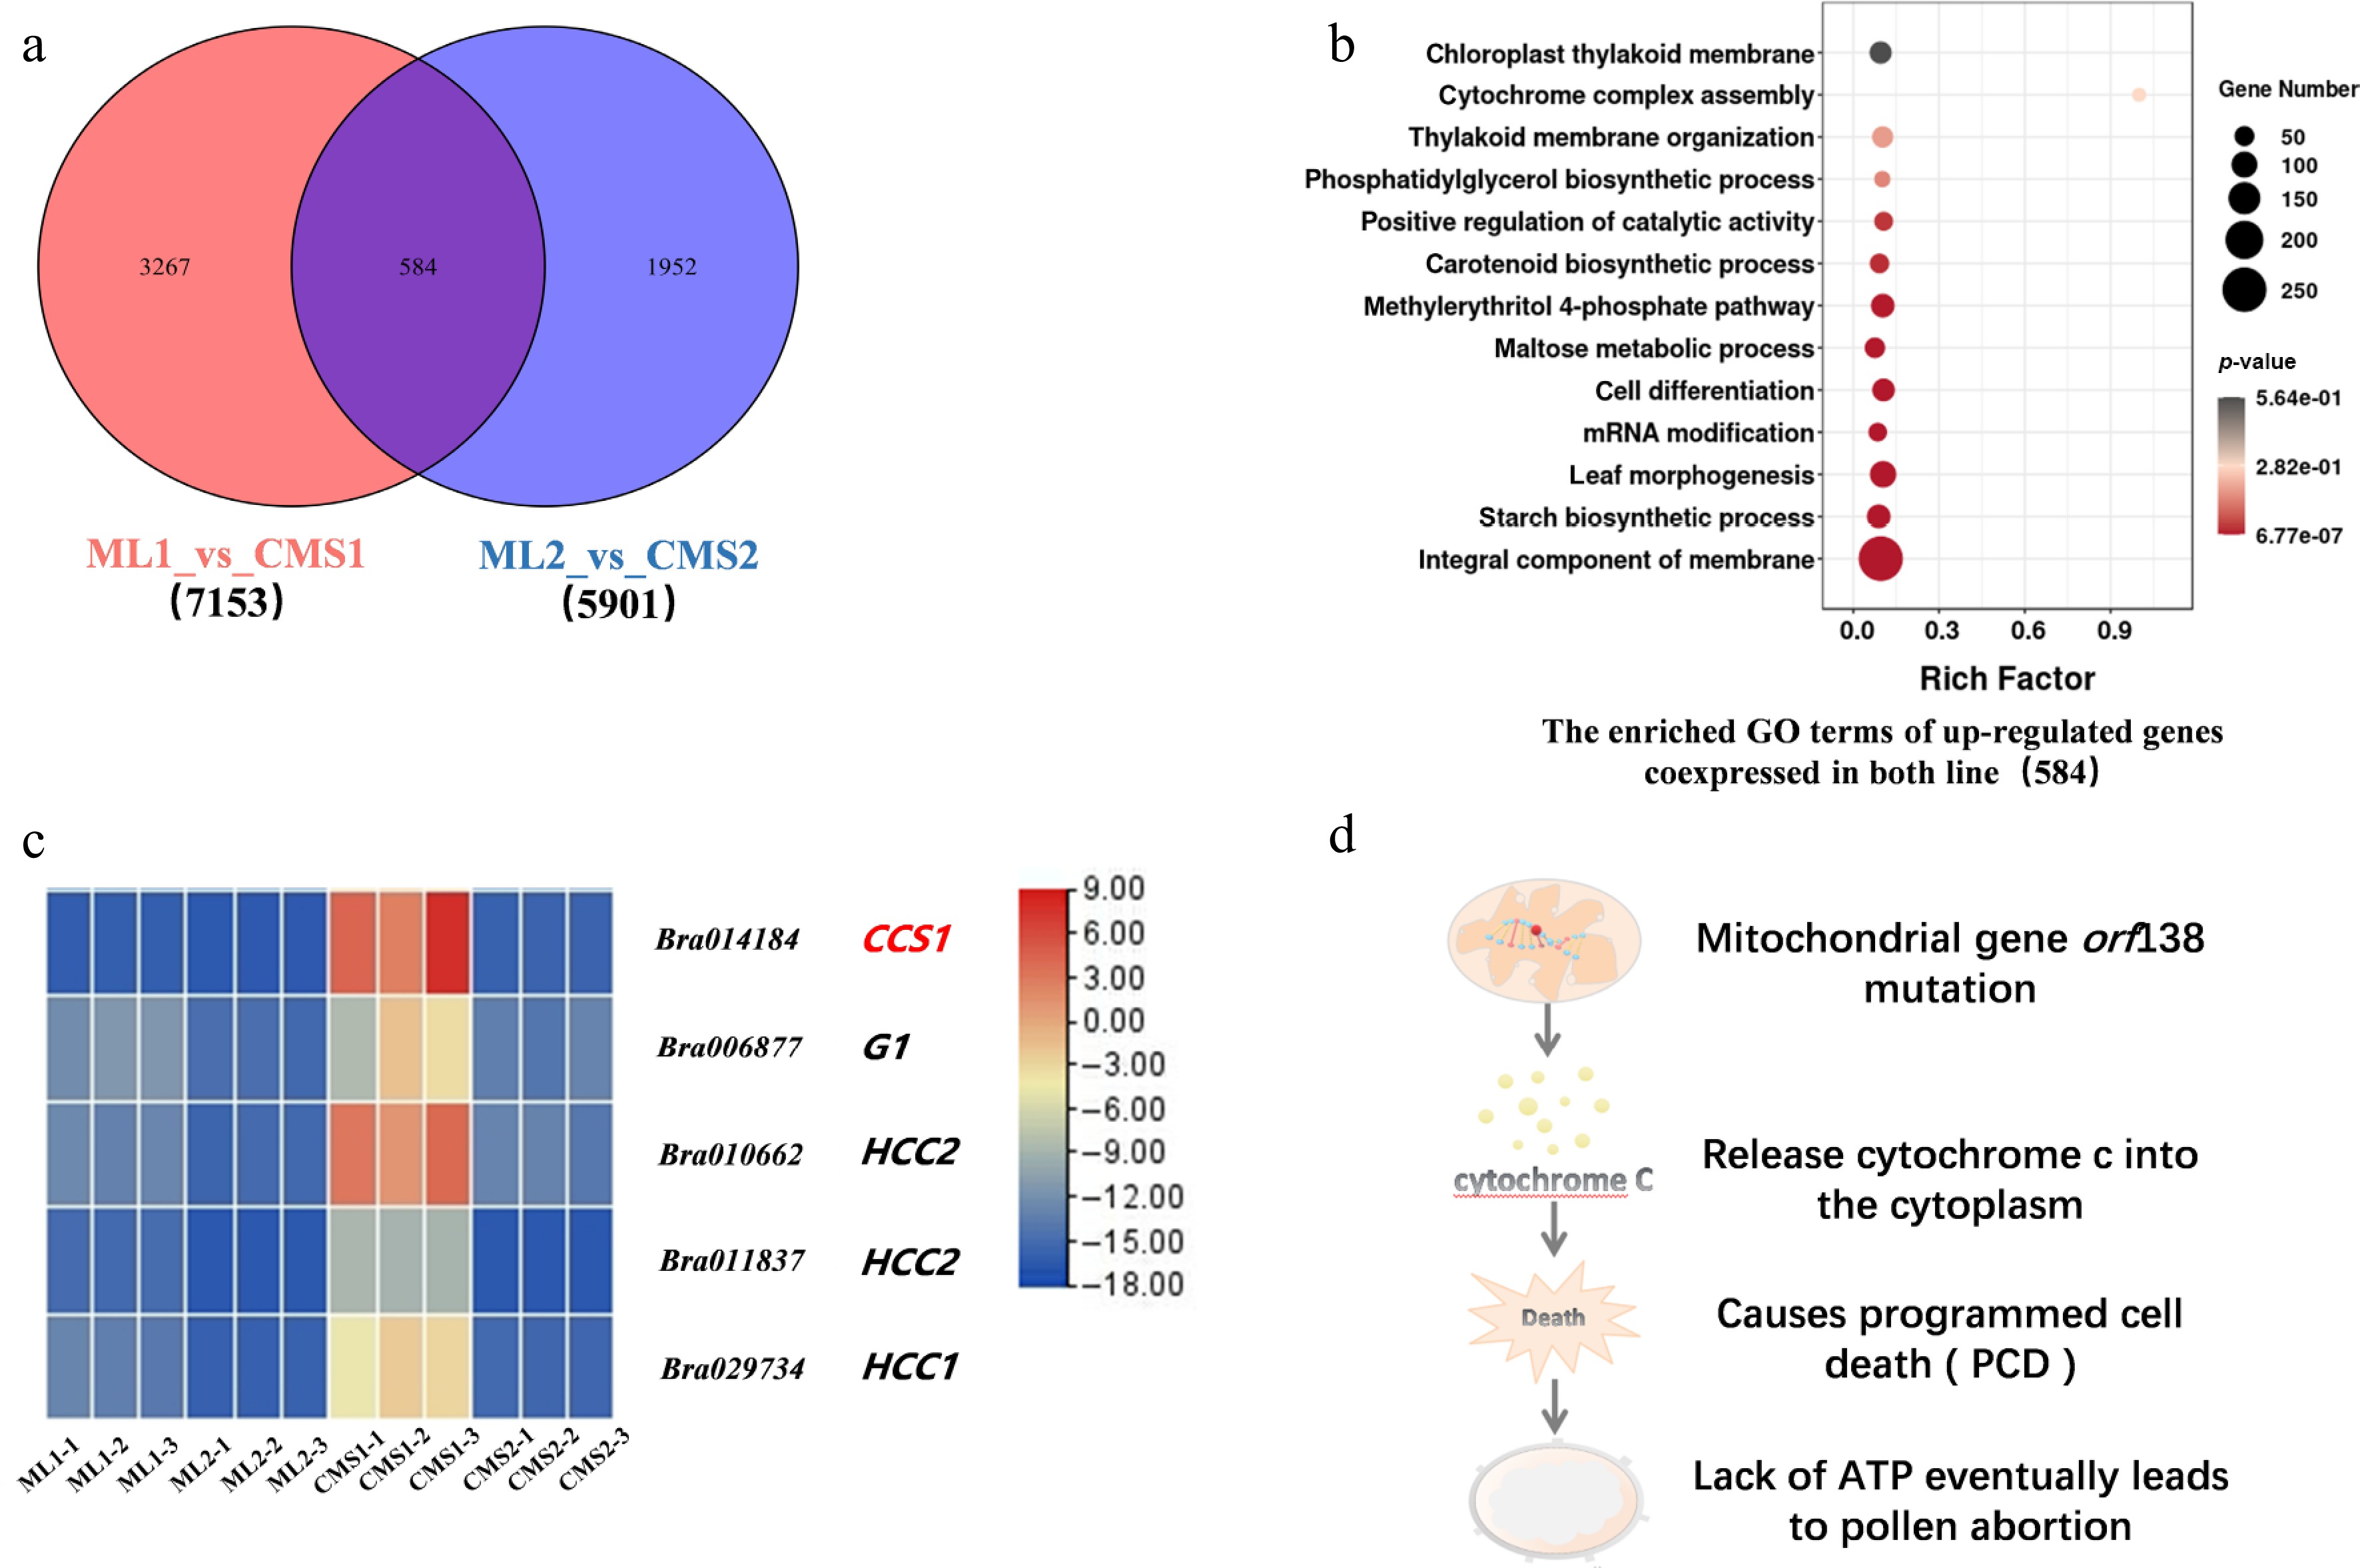
Figure 3.
Intergroup comparison of upregulated differential gene expression between Chinese cabbage Ogura CMS and maintainer lines. (a) Number of differentially expressed genes specifically expressed and co-expressed between the two groups. (b) GO enrichment analysis of co-expressed upregulated genes between the two groups. (c) Heatmap of cytochrome c-related differential genes in the Chinese cabbage Ogura CMS and maintainer lines. (d) Predictive analysis of the signaling pathway of the downstream cytochrome c response to the mitochondrial mutation.
-
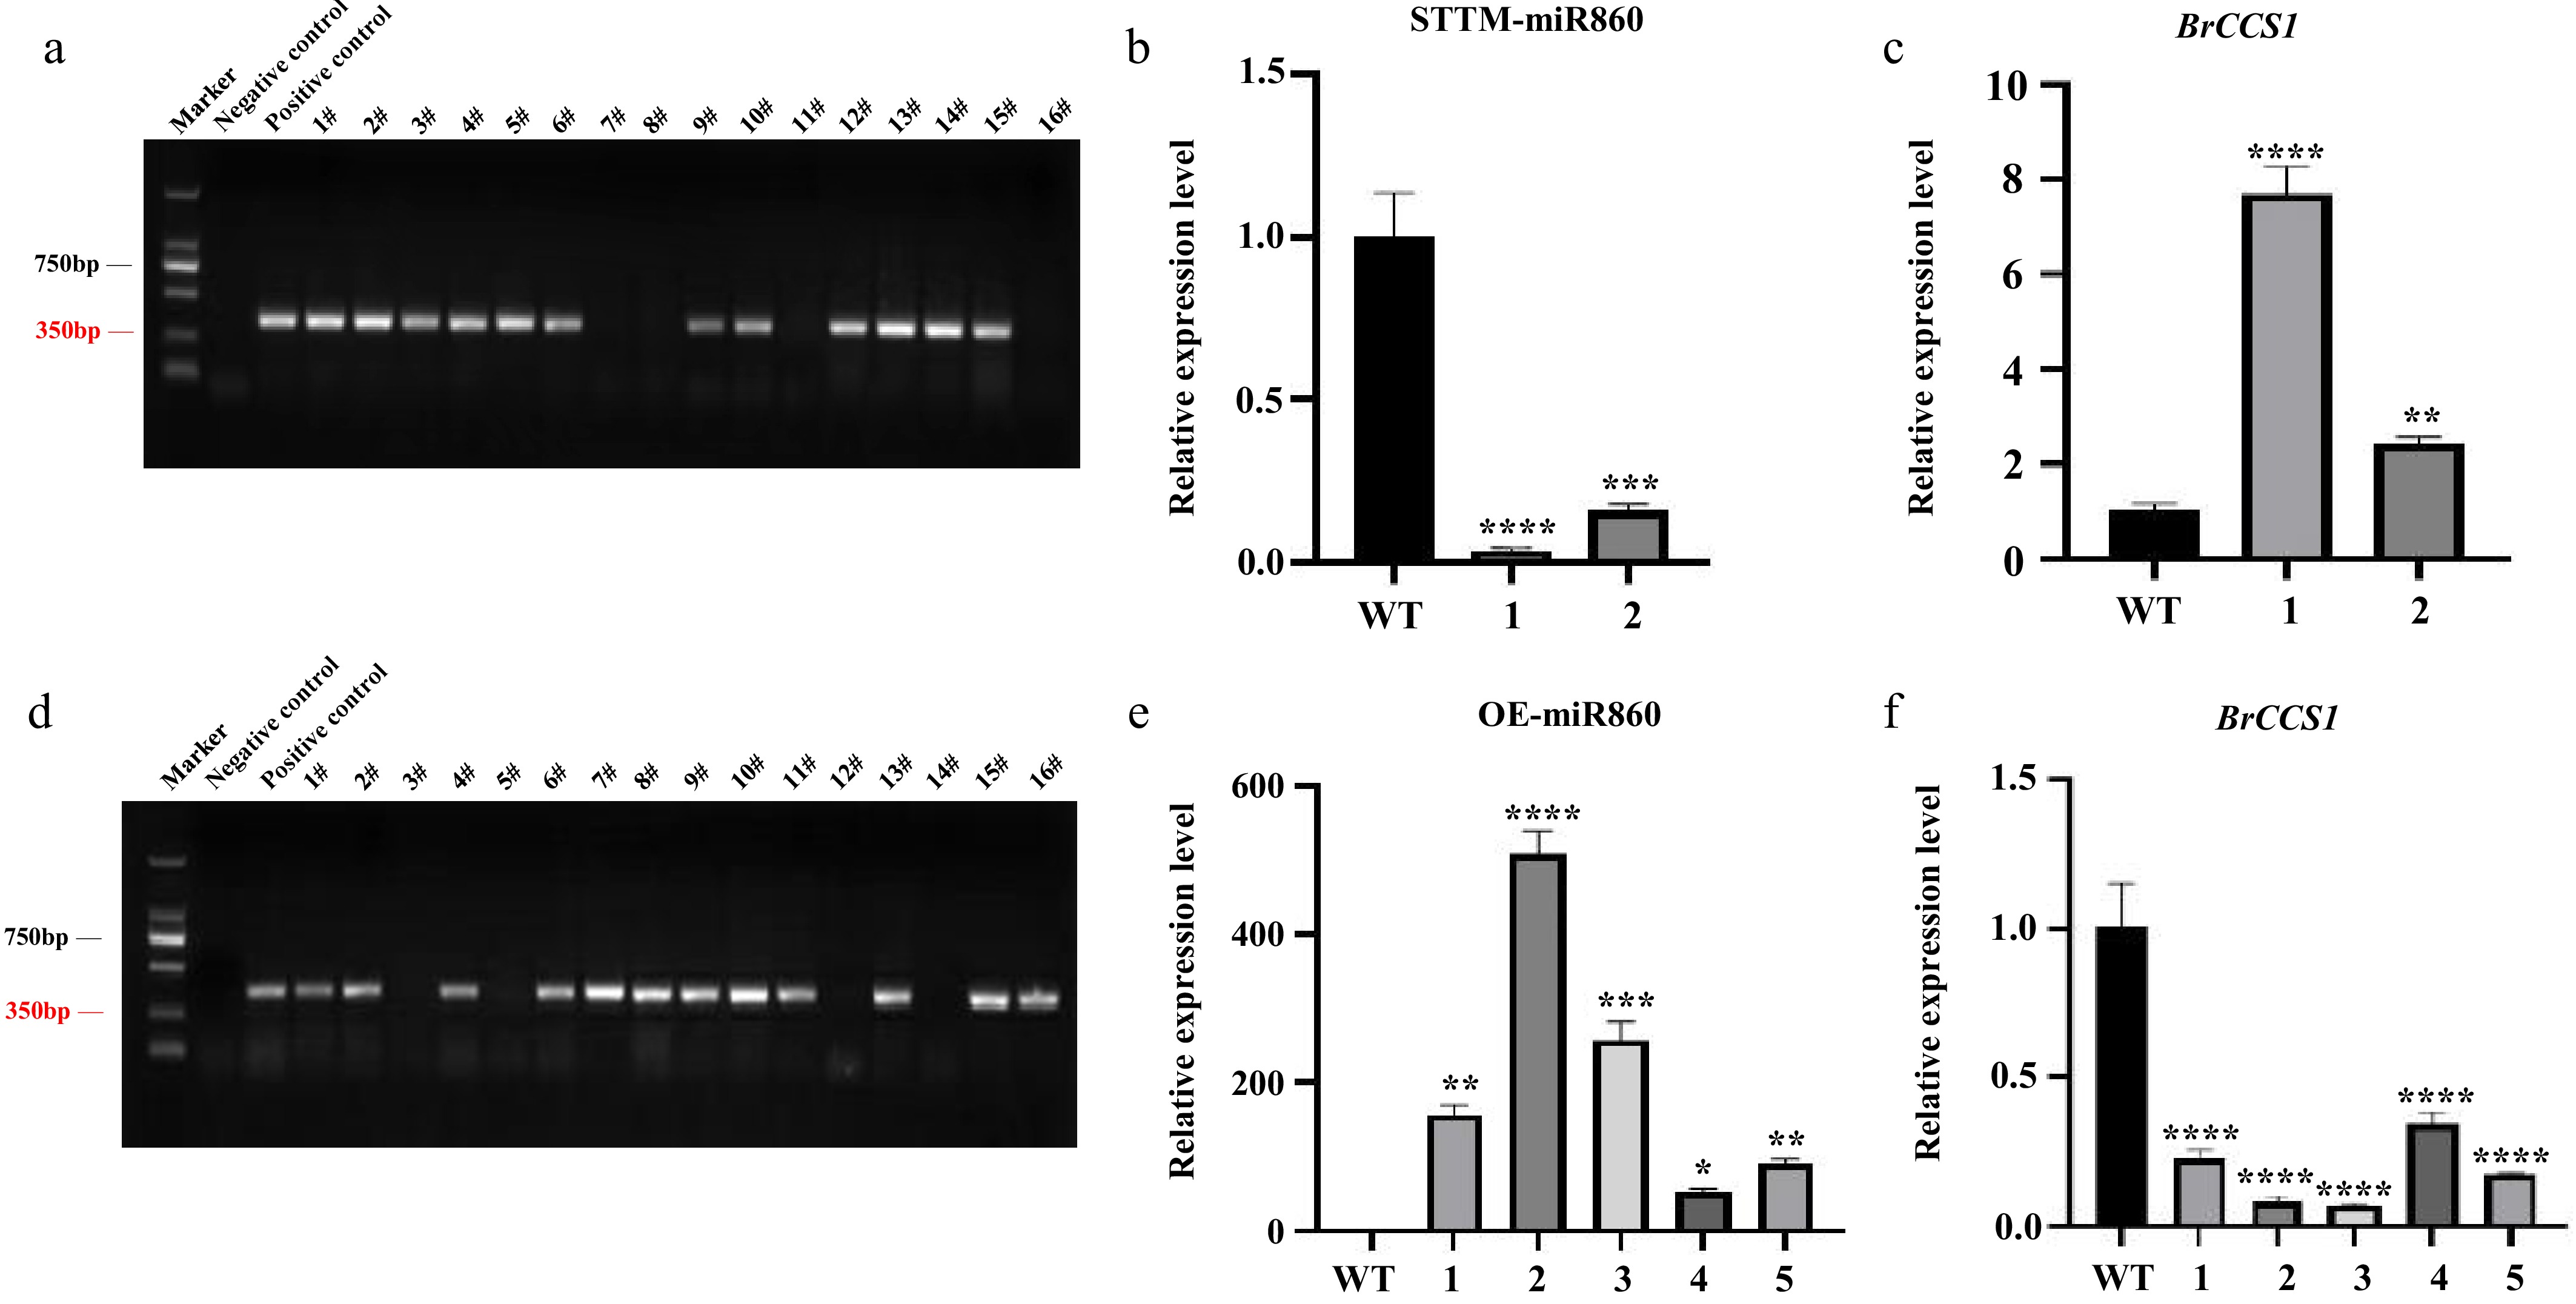
Figure 4.
Identification of transgenic Arabidopsis thaliana. (a), (d) PCR identification of T1 generation STTM-miR860 and OE-miR860 transgenic Arabidopsis. (b), (c) qRT-PCR results of miR860 and its target gene BrCCS1 in the T2 generation of STTM-miR860 transgenic Arabidopsis thaliana. (e,) (f) qRT-PCR results of miR860 and its target gene BrCCS1 in the T2 generation of OE-miR860 transgenic Arabidopsis thaliana. One-way ANOVA using multiple tests (* p < 0.05; ** p < 0.01; *** p < 0.001; **** p < 0.0001).
-
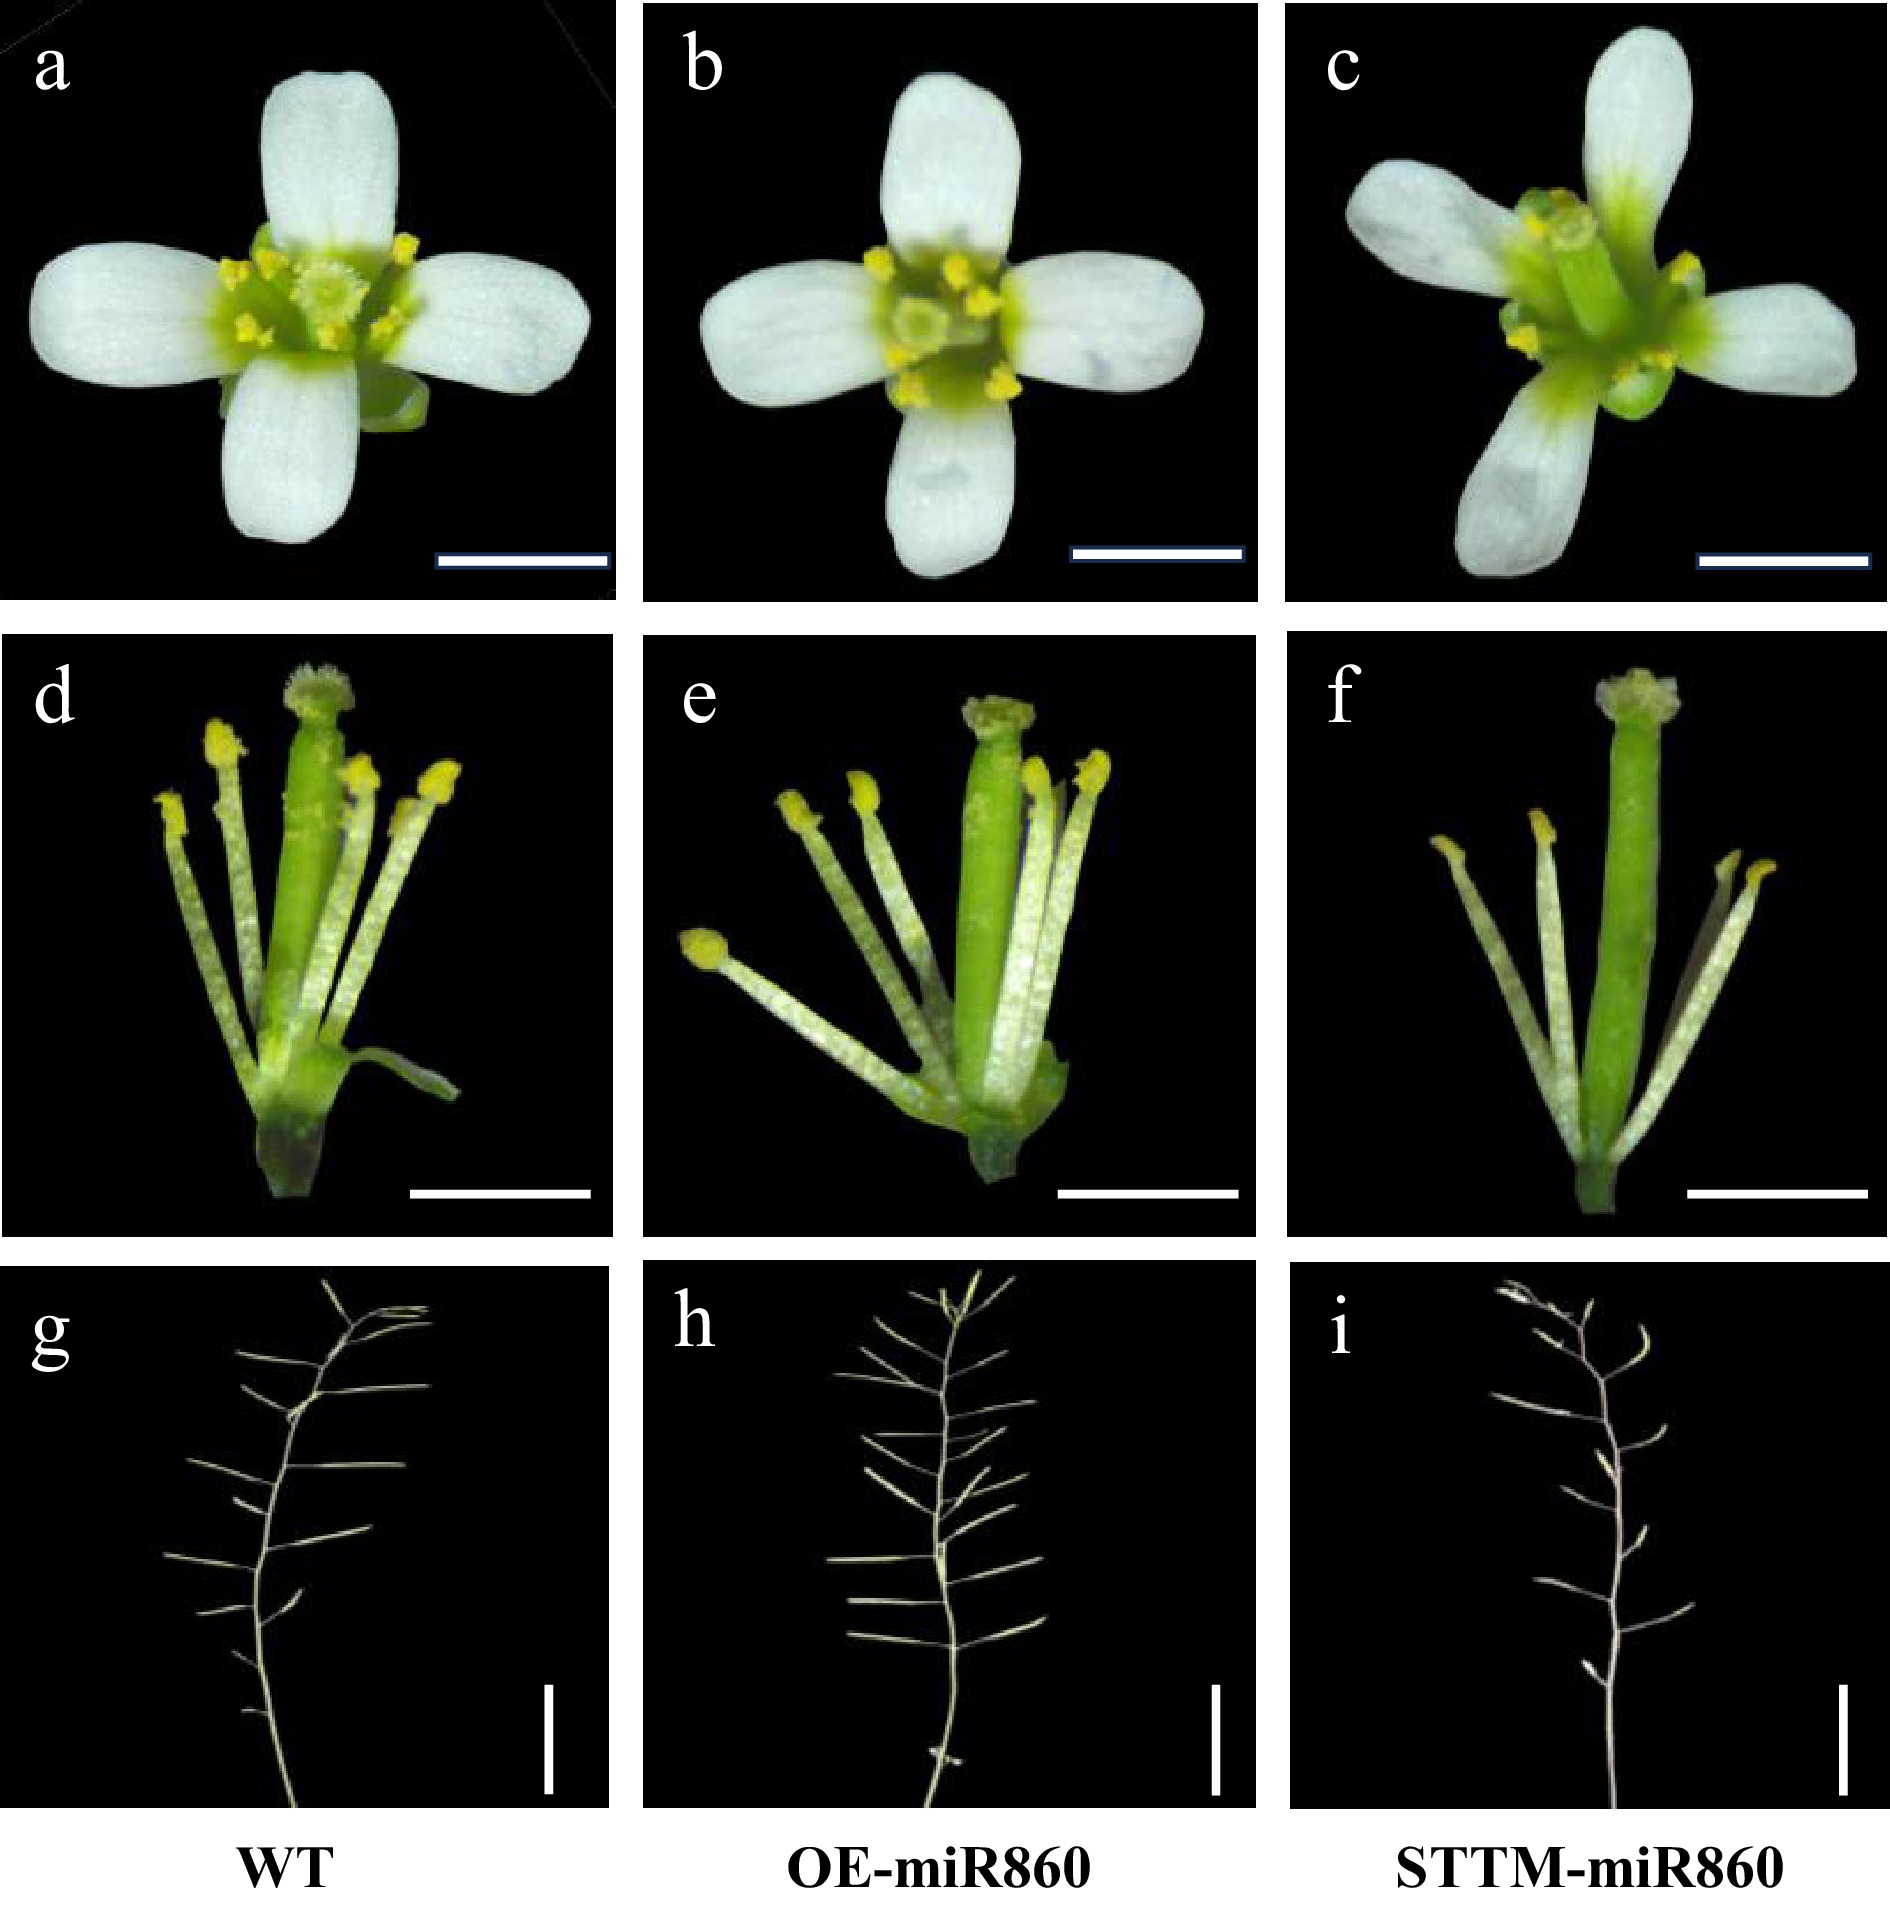
Figure 5.
Observation of the phenotypic characteristics of the wild type and miR860 mutant of T3. (a)–(c) Observation of wild-type and miR860 mutant inflorescences. (d)–(f) Observation of anthers and stigmas at anthesis of the wild type and miR860 mutants. (g), (h) Observation of wild-type and miR860 mutant siliques. Scale bars = (a)–(f) 0.5 mm, (g)–(i) 1 cm.
-
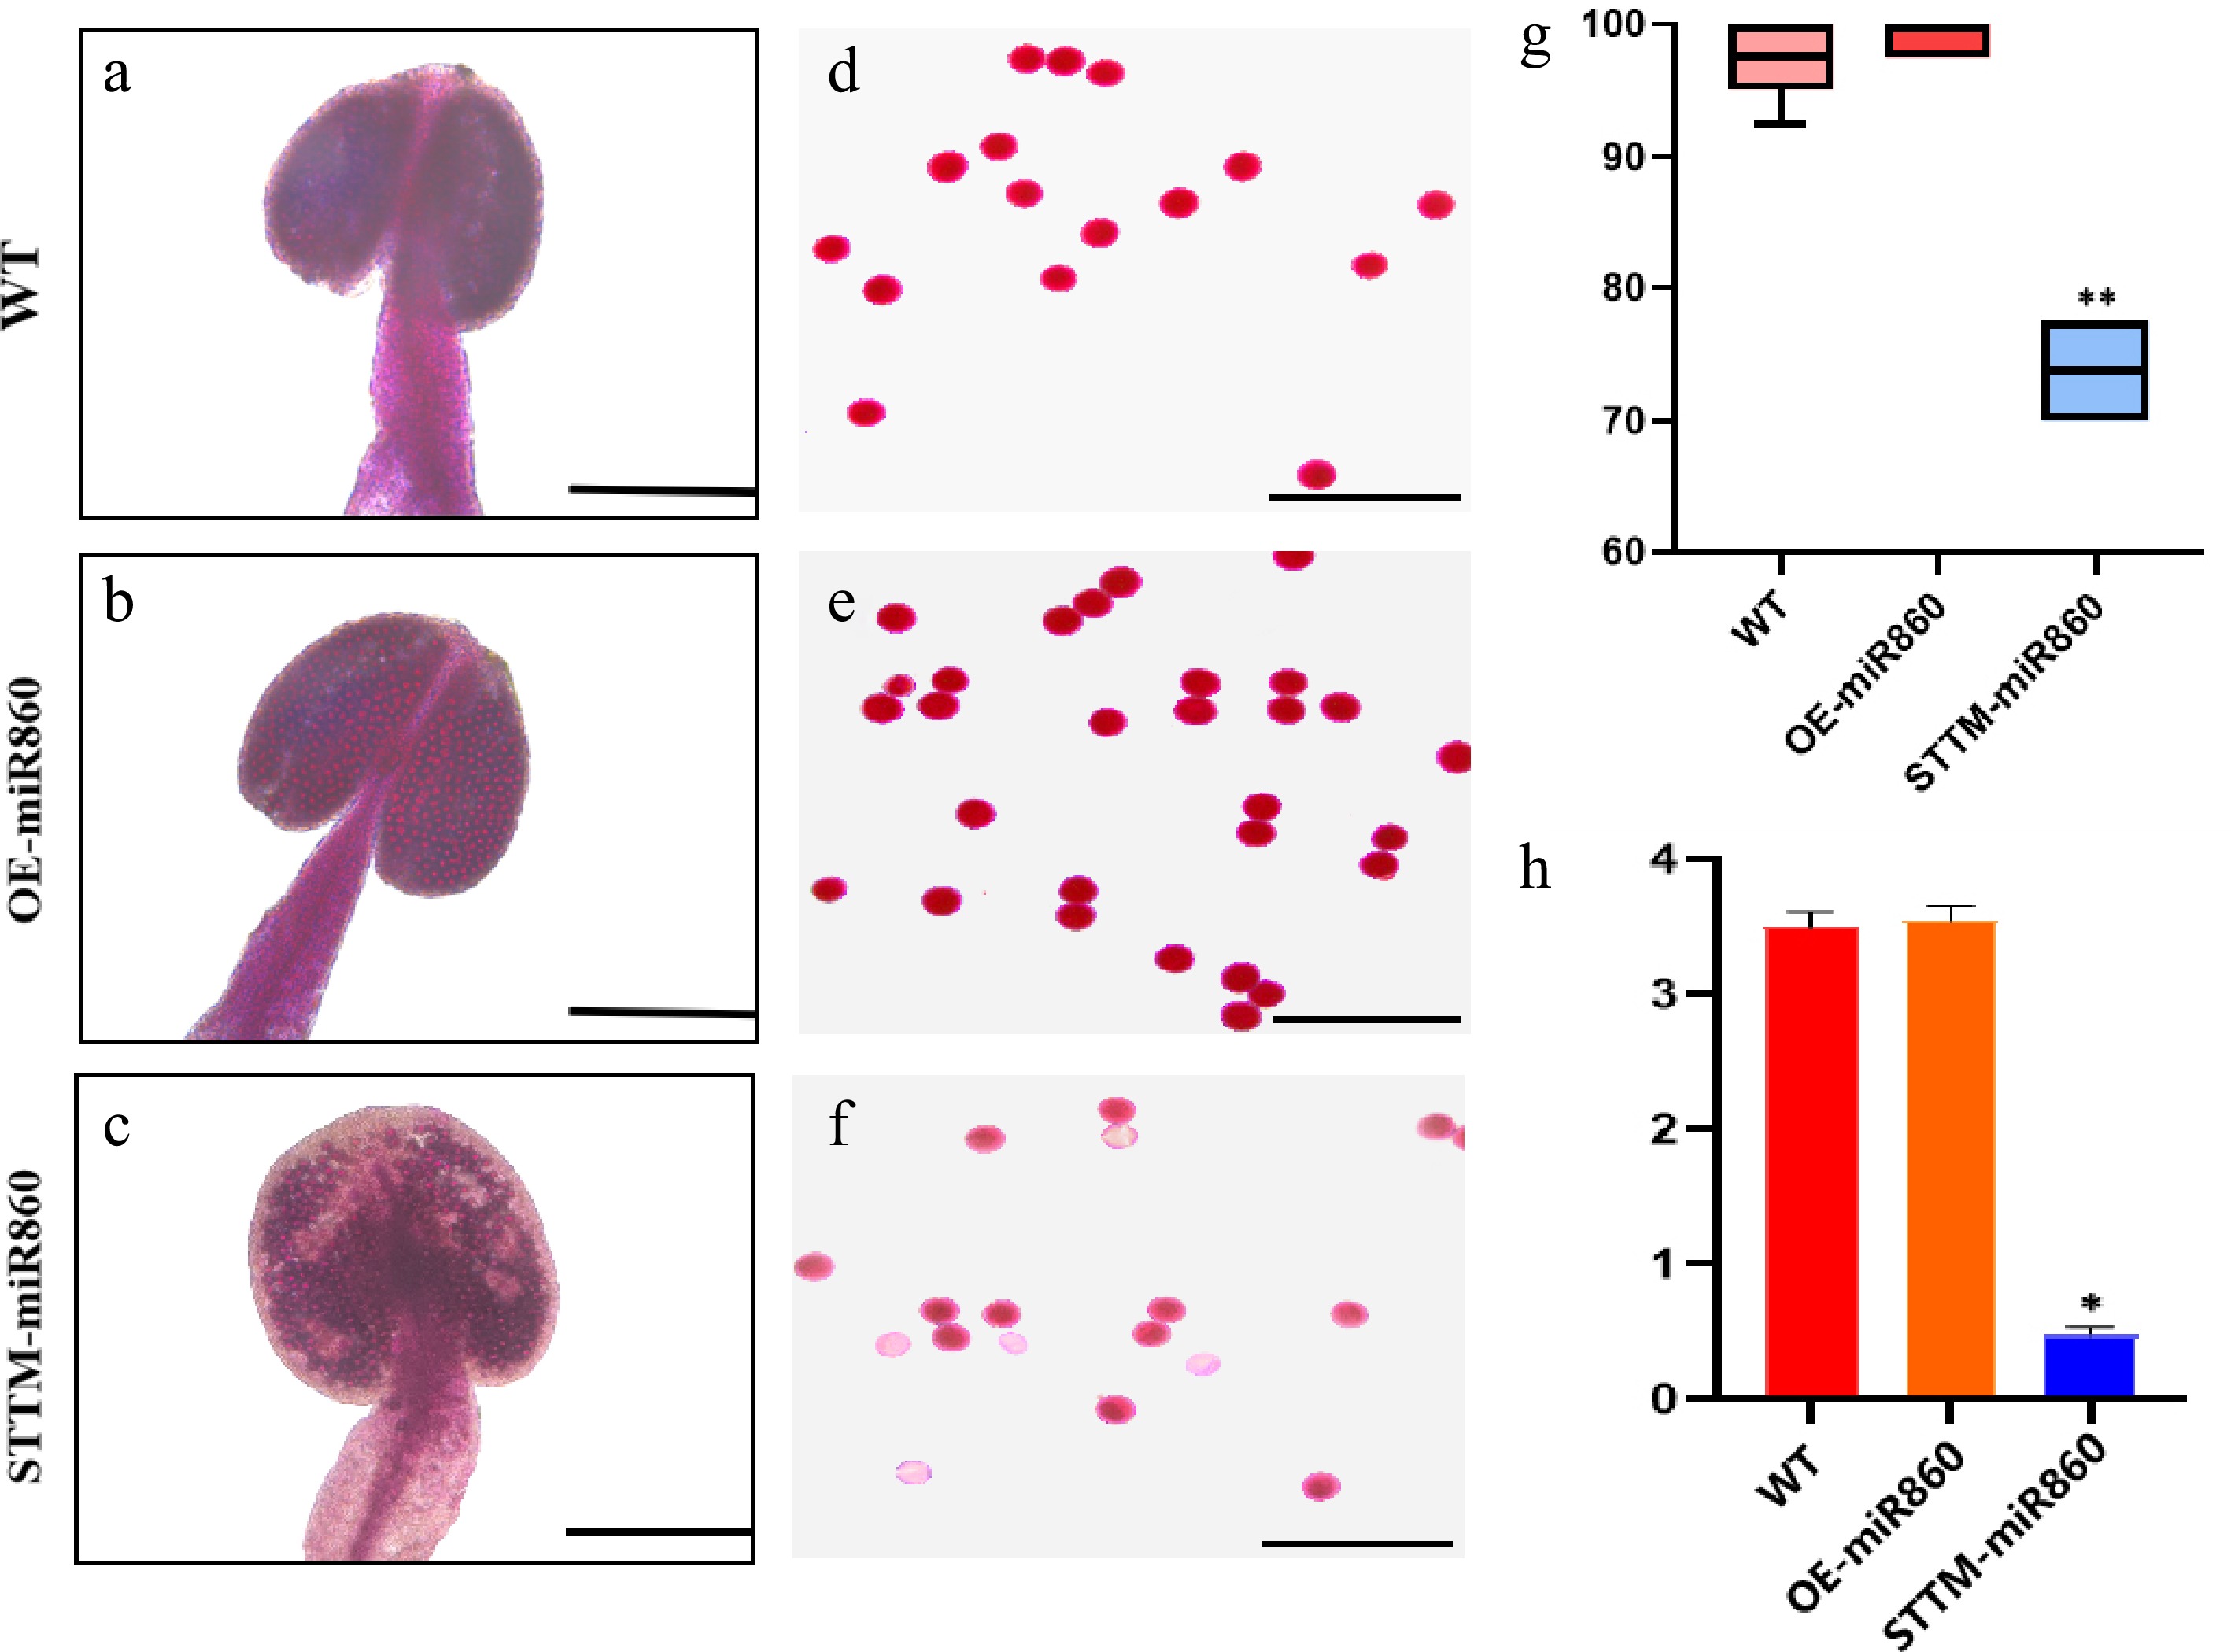
Figure 6.
Identification of pollen viability and determination of ATP content in the wild type and miR860 mutants. (a)–(c) Alexander rectification staining of anthers. Scale bar = 200 μm. (d)–(f) Alexander staining of pollen grains. Scale bar = 100 μm. (g) Stainability statistics (%). (h) ATP content determination (µmol/g). One-way ANOVA using multiple tests (* p < 0.05; ** p < 0.01).
-
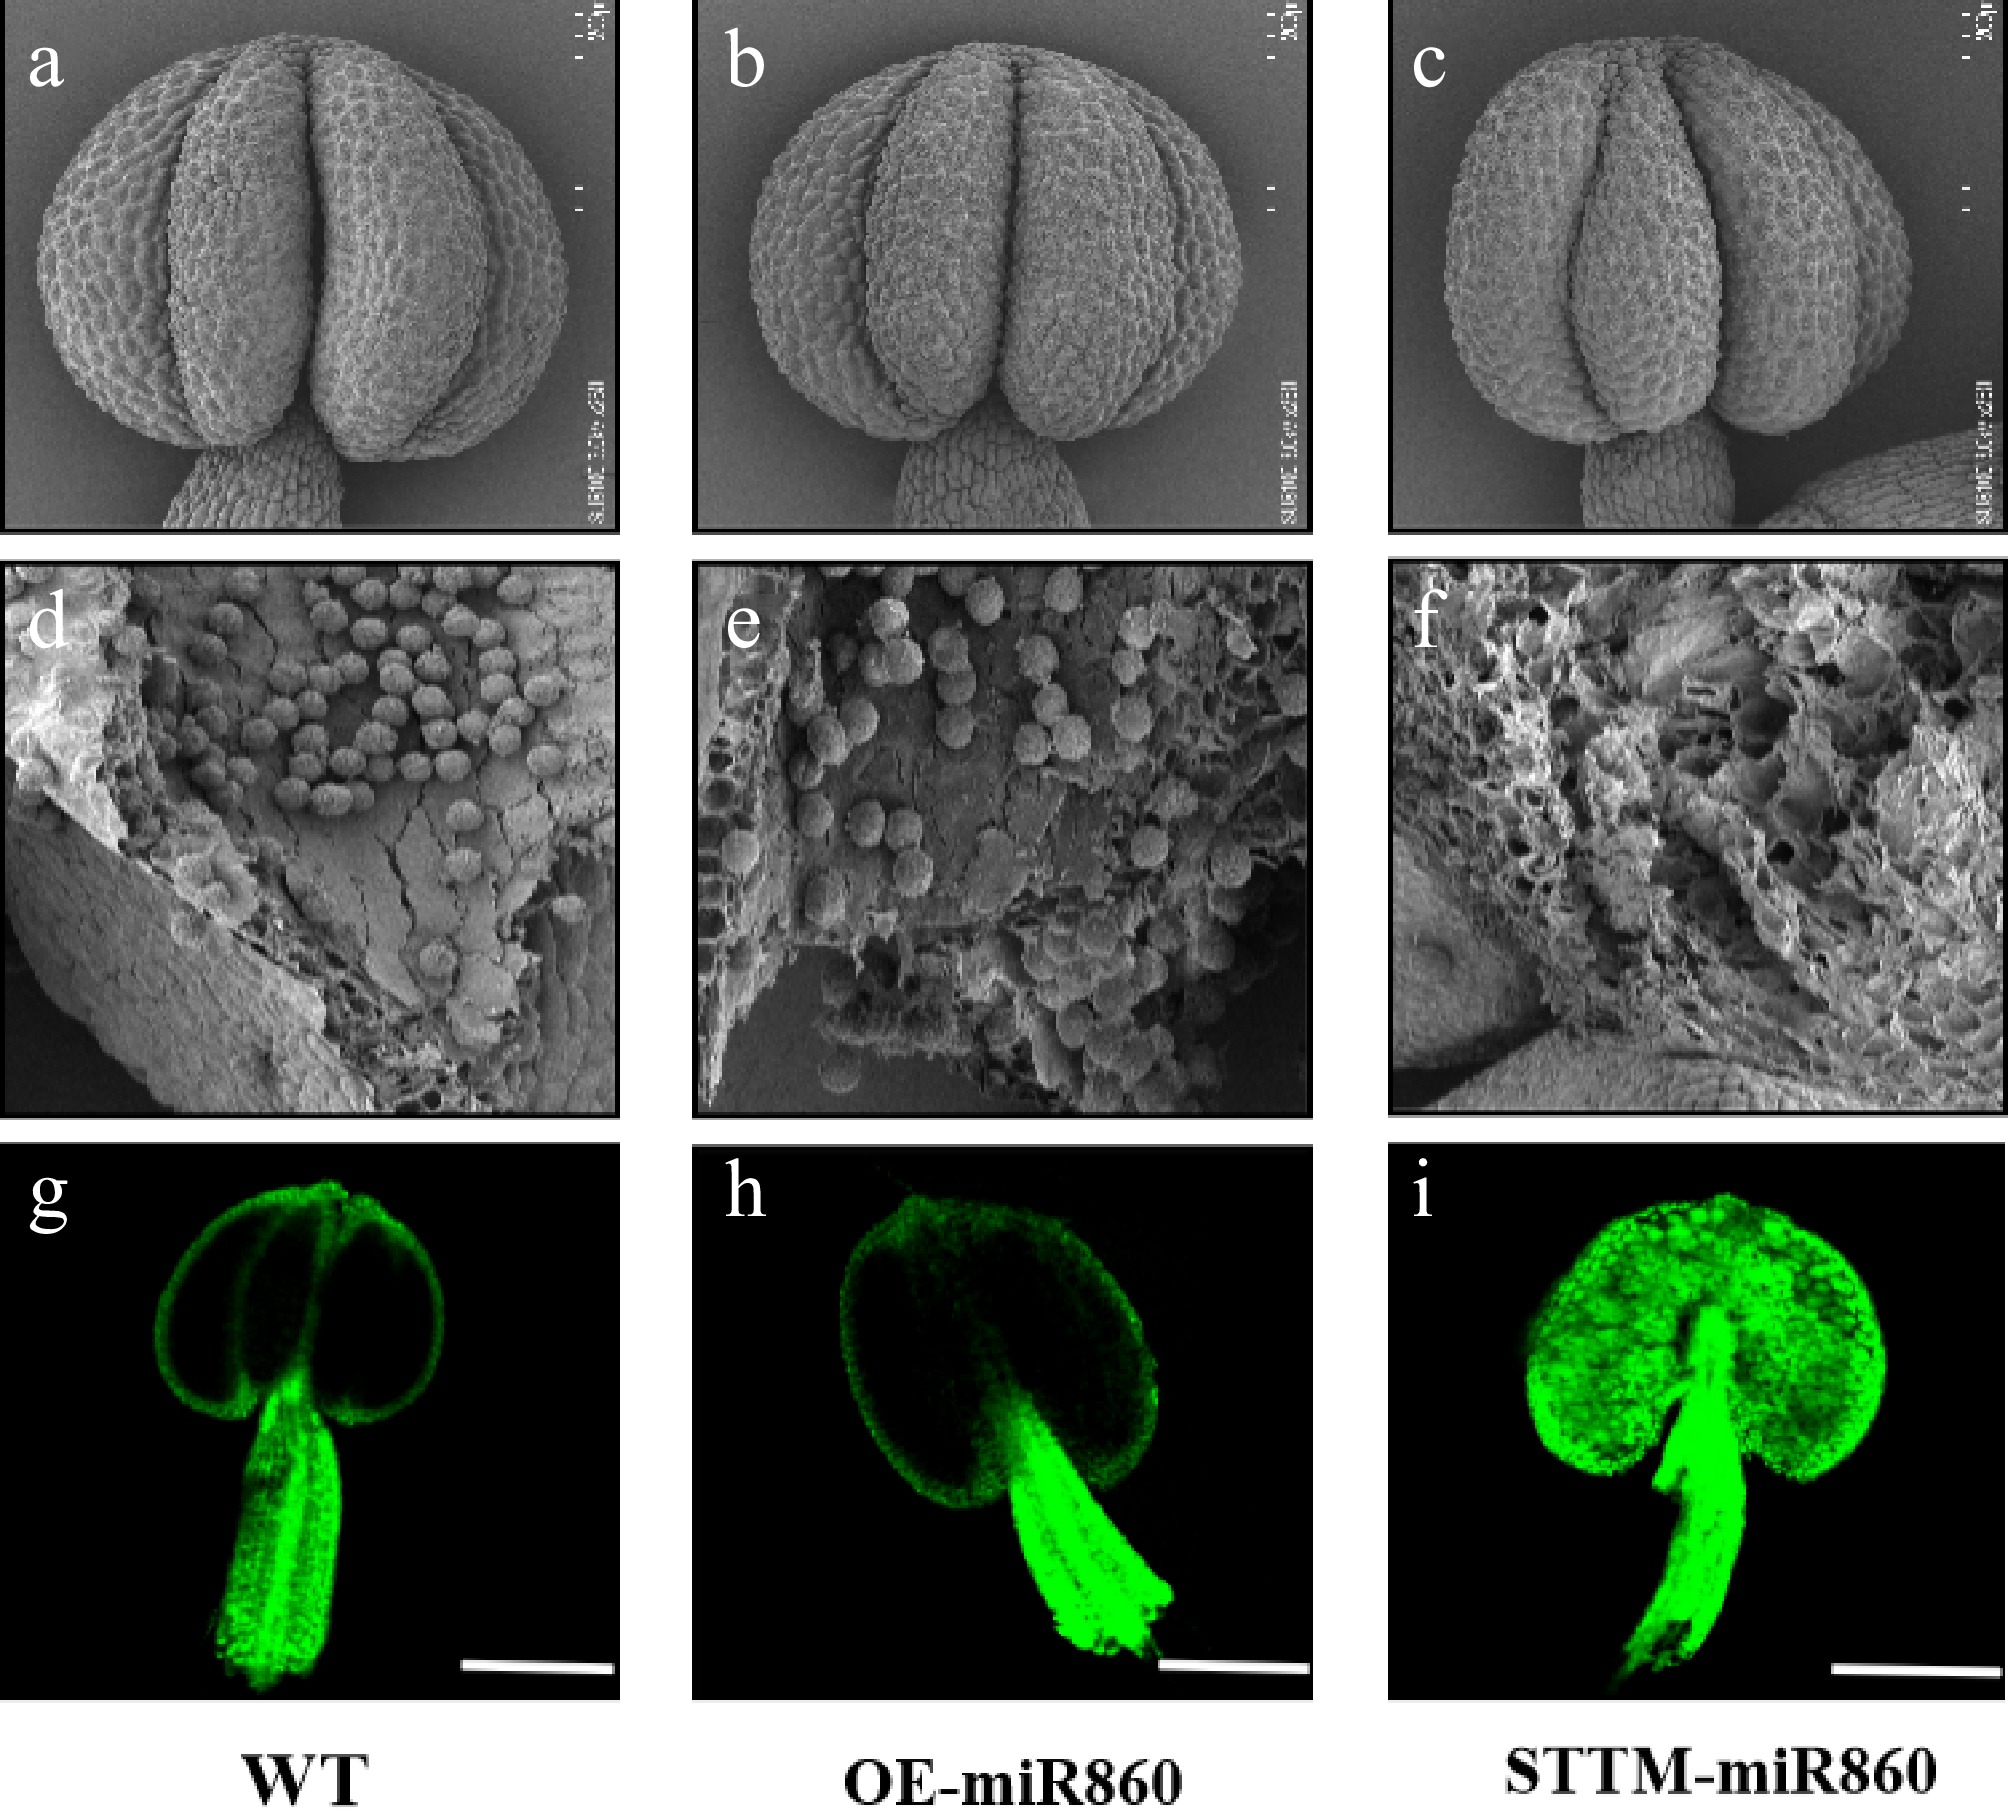
Figure 7.
Ultrastructural scanning electron microscopy observation and identification of reactive oxygen species in wild-type and miR860 mutant anthers. (a)–(c) Wild-type and miR860 mutant anthers at the unopened stage. (d), (e) Wild-type and OE-miR860 anthers with normal full pollen grains. (f) STTM-miR860 mature anthers at the unopened stage, locally enlarged to show empty chambers. Scale bars: (a)–(c) 200 μm, (d)–(f) 50 μm. (g)–(i) Confocal microscopy observation of reactive oxygen staining. Scale bar = 200 μm.
-
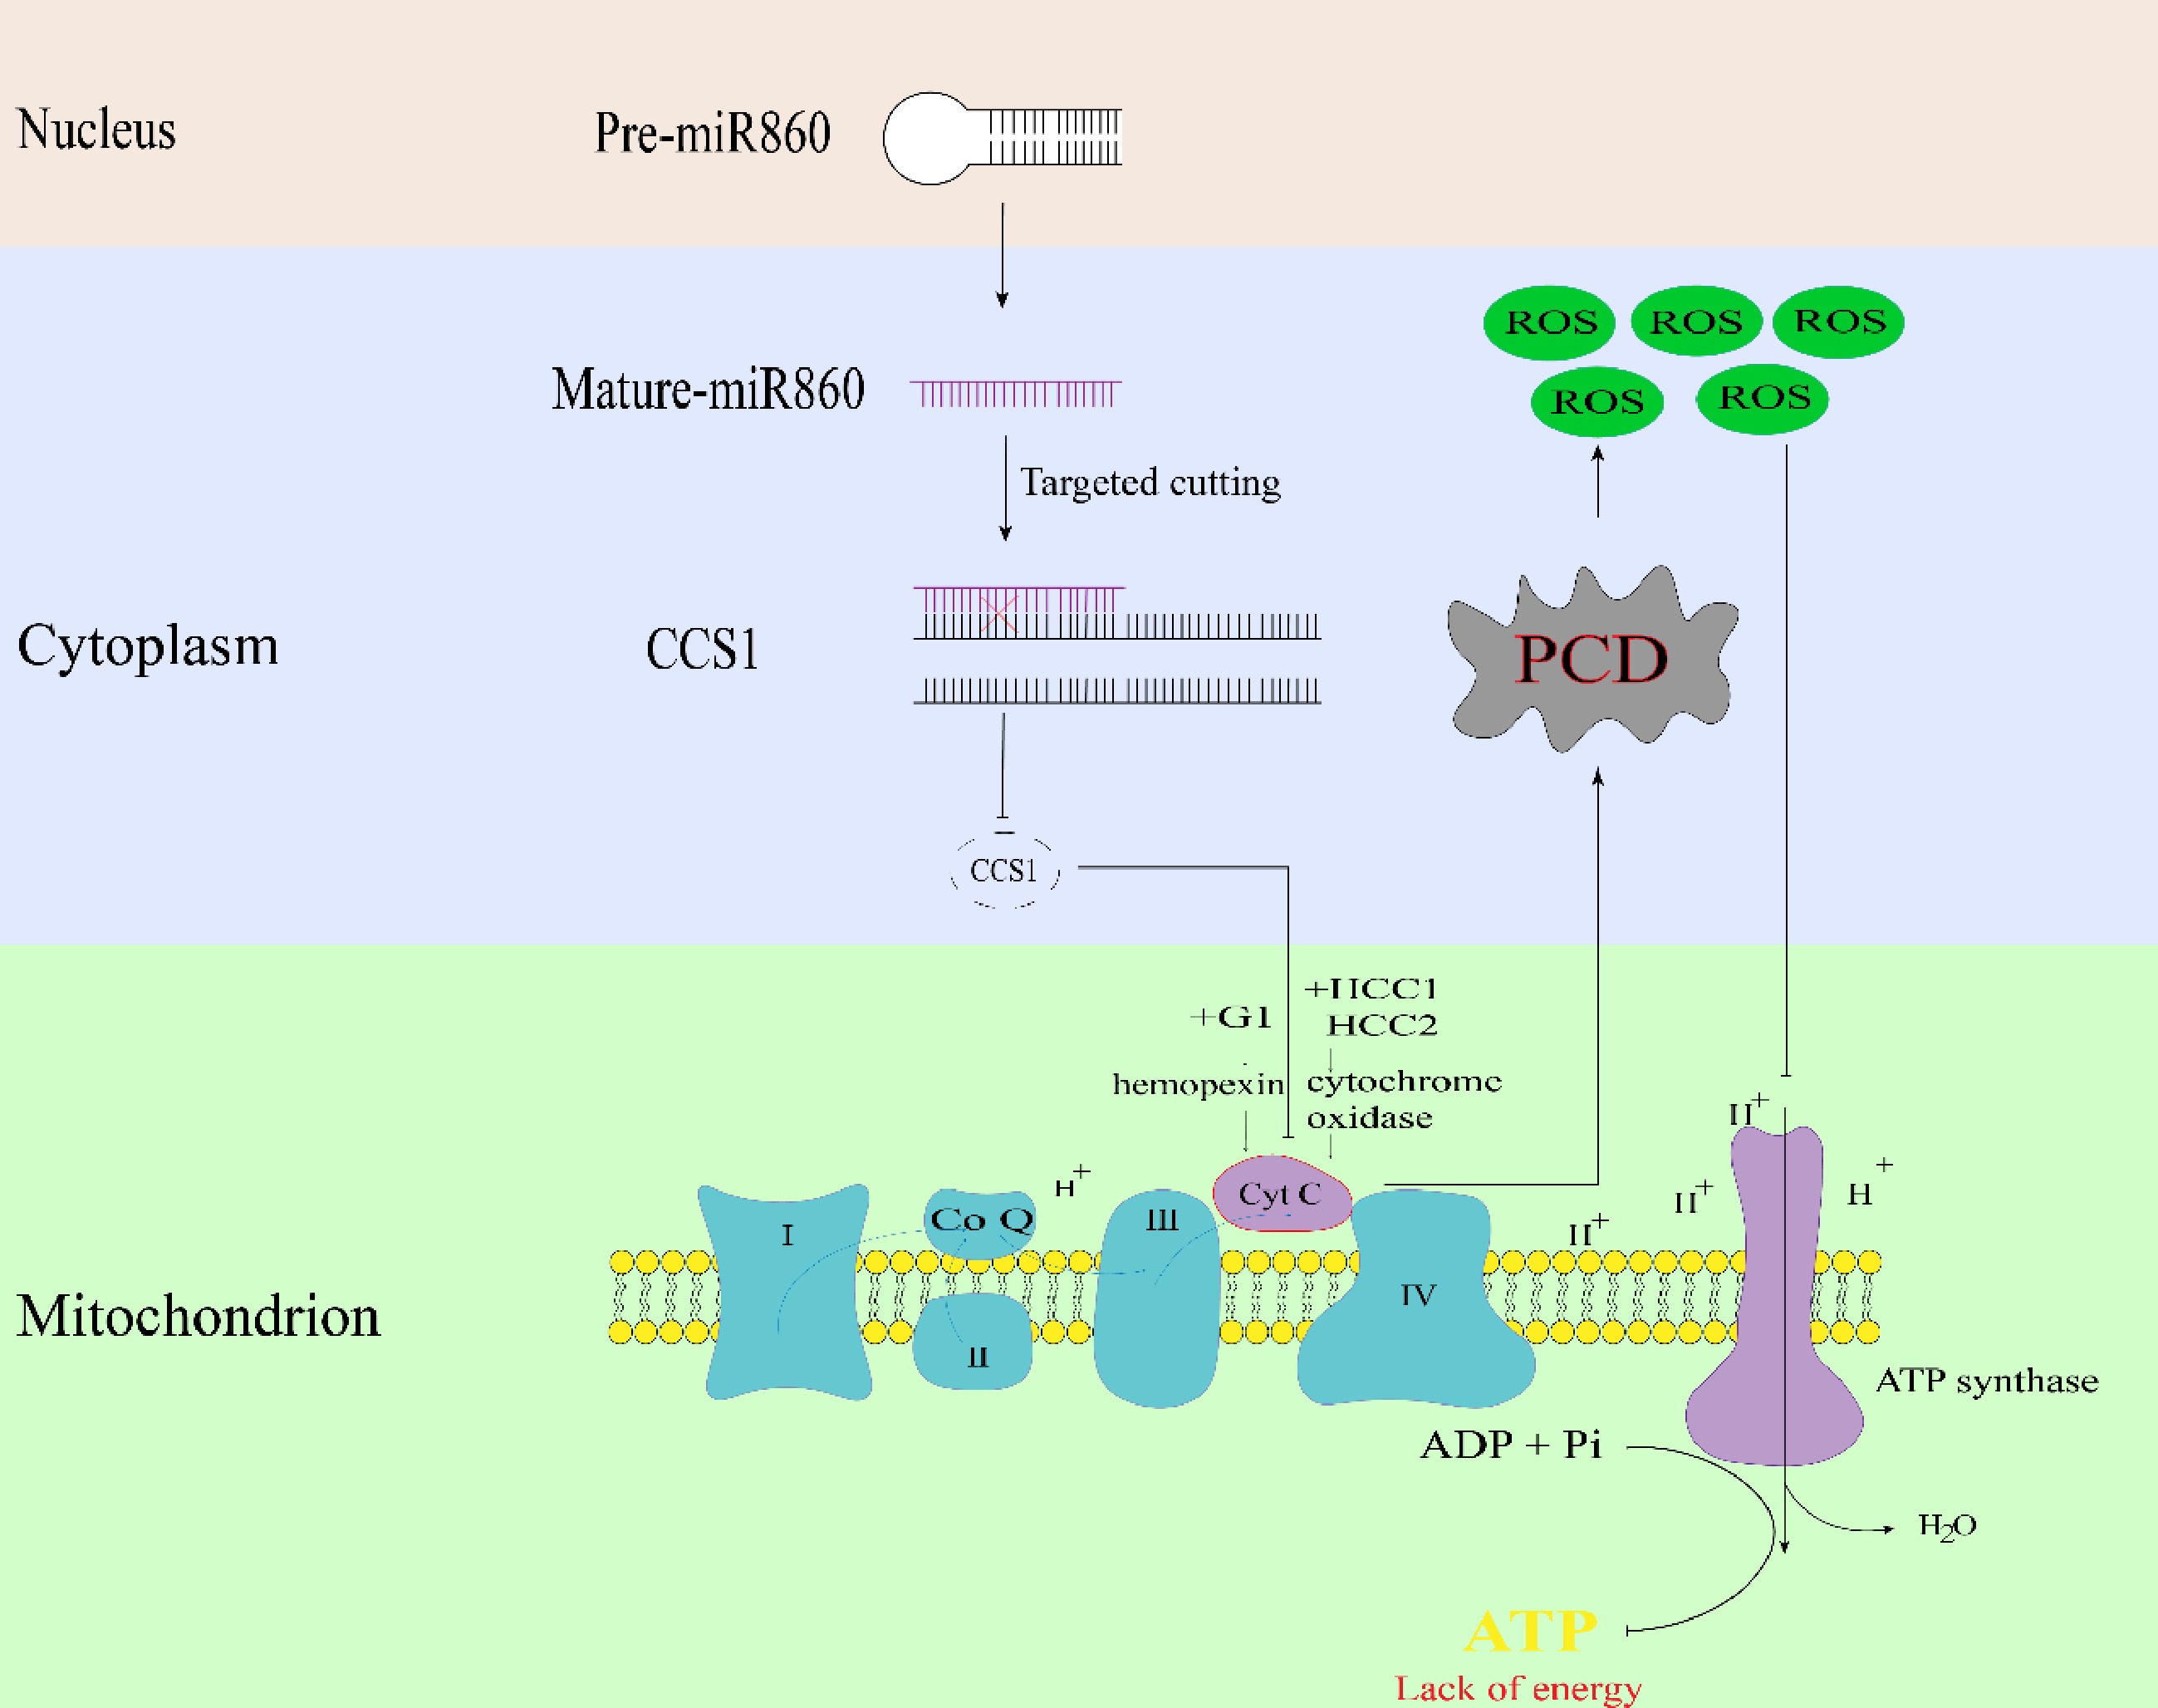
Figure 8.
Schematic diagram of miR860 target gene BrCCS1 regulating the pollen fertility pathway in Chinese cabbage.
Figures
(8)
Tables
(0)