-
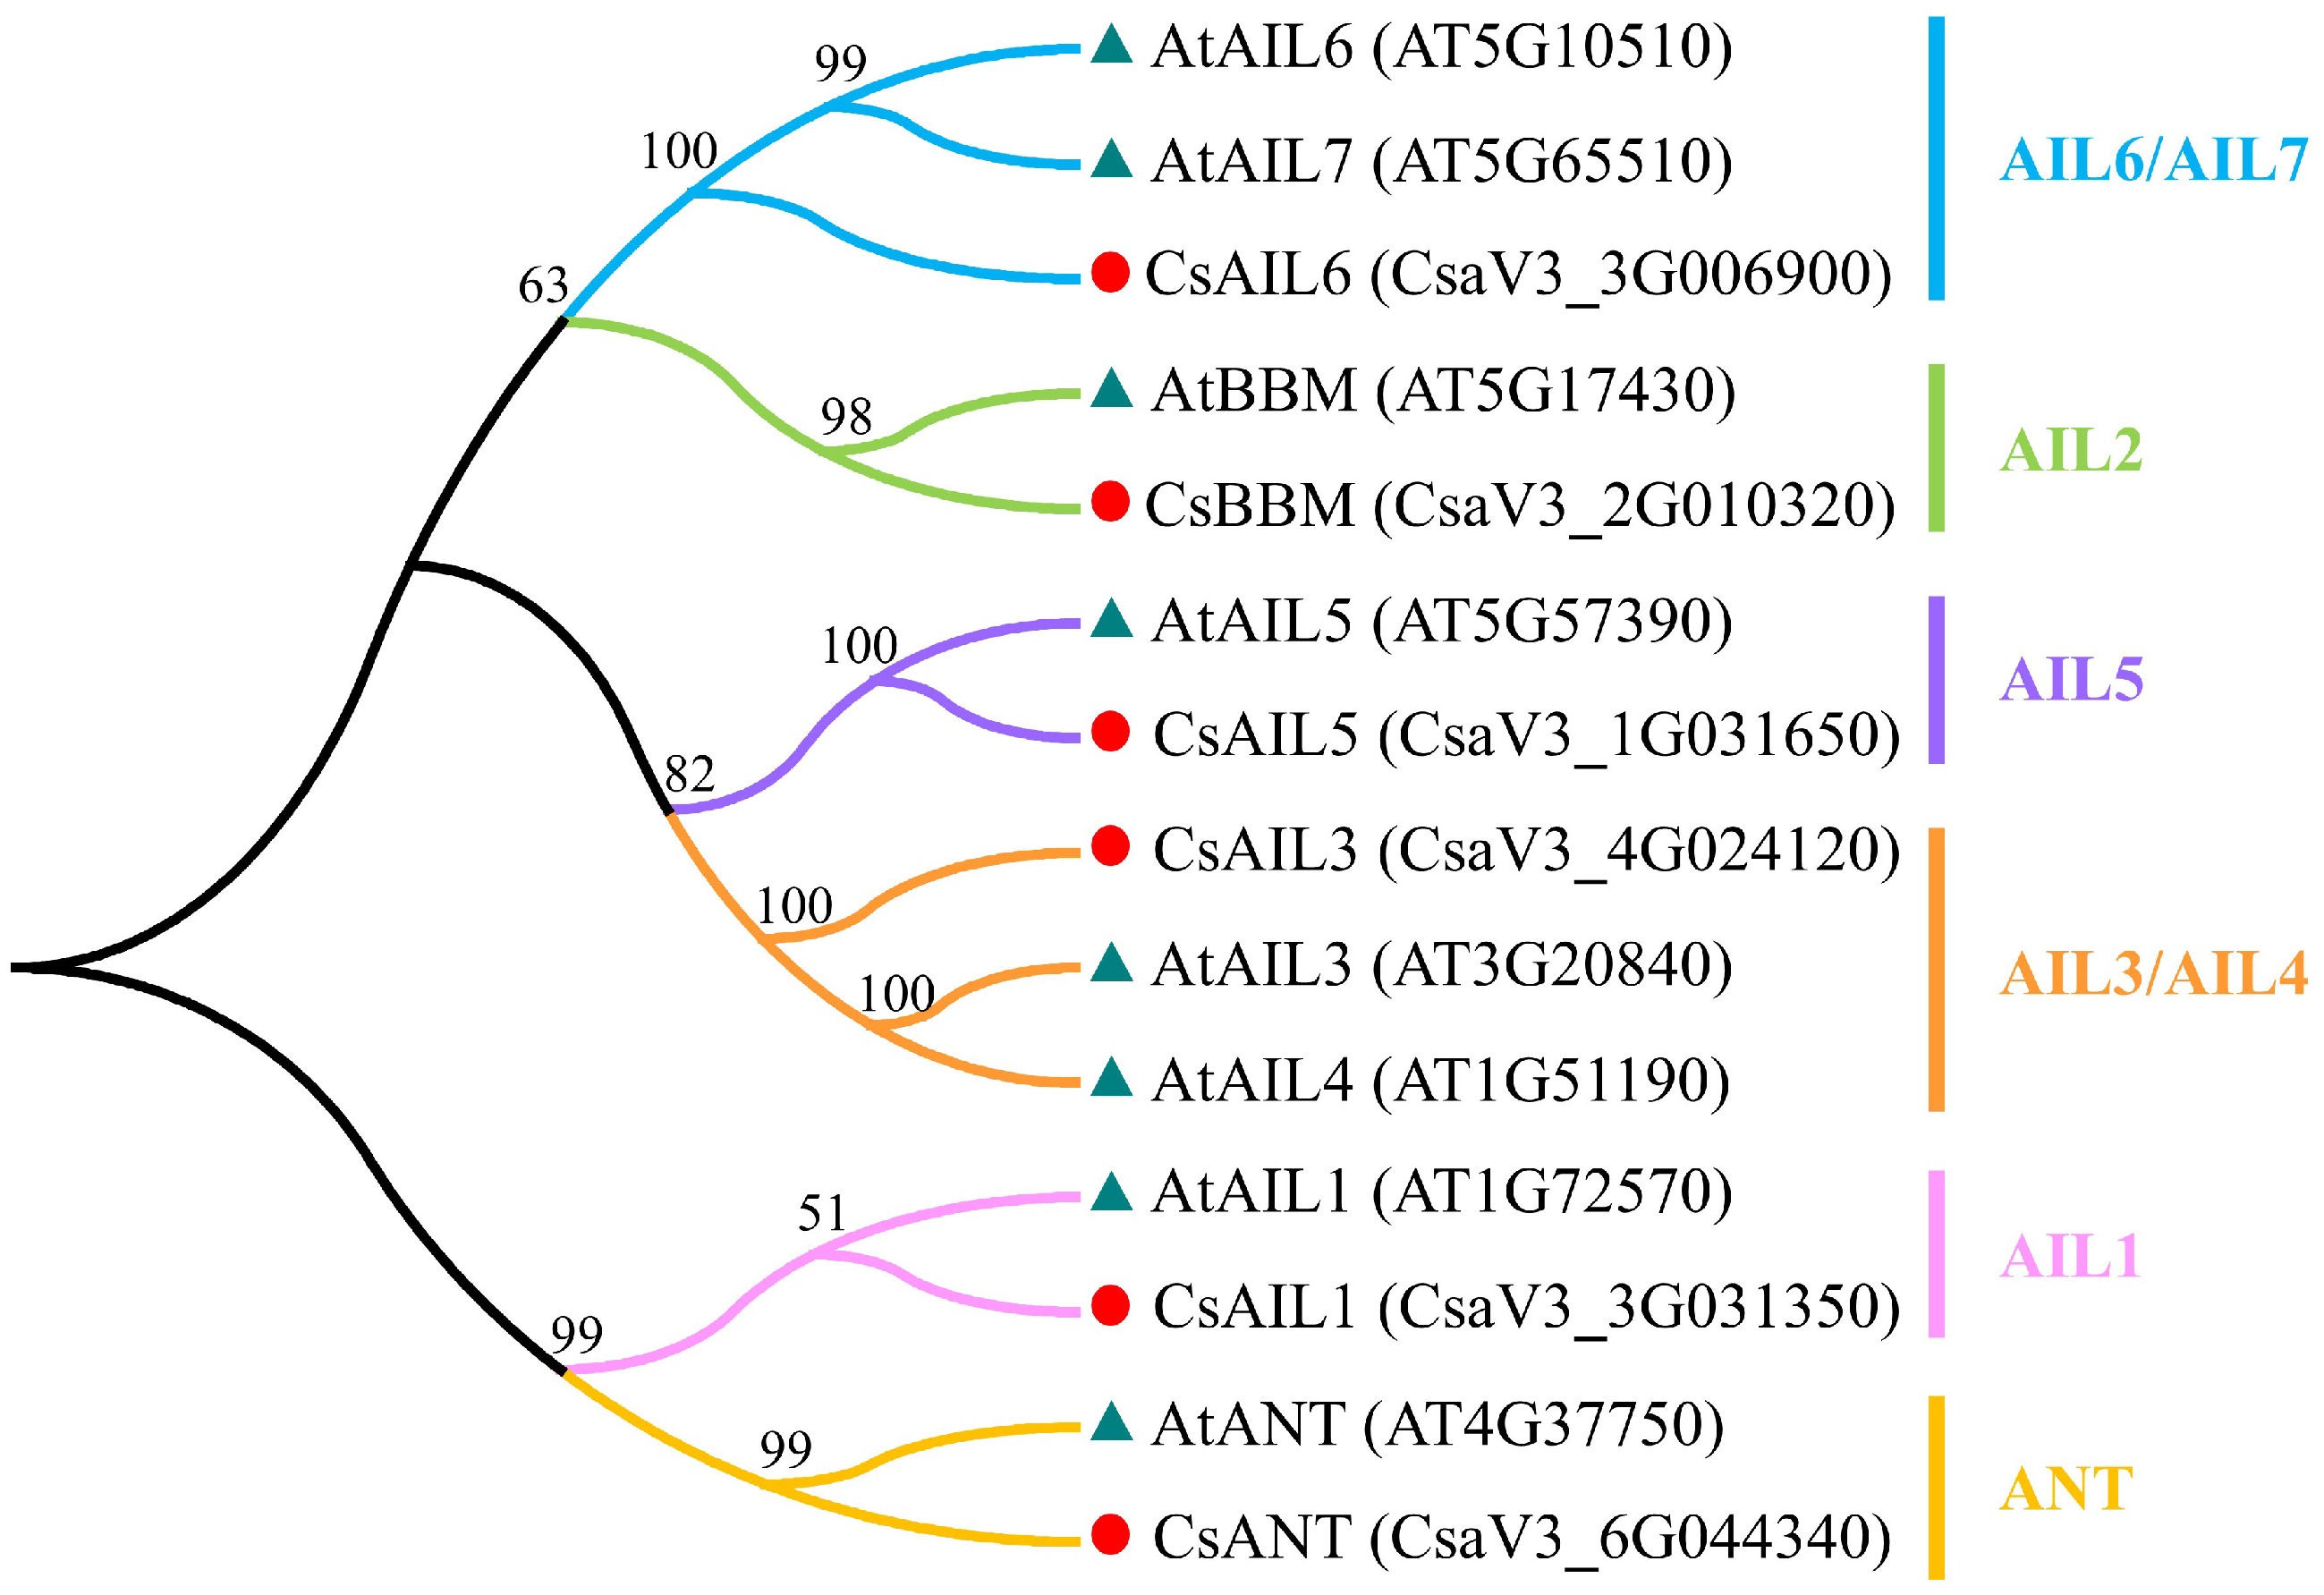
Figure 1.
Phylogenetic analysis of the AIL proteins between cucumber and Arabidopsis. Red circle and blue-grey triangle represent the AIL proteins from cucumber and Arabidopsis, respectively. Cs, cucumber; At, Arabidopsis.
-
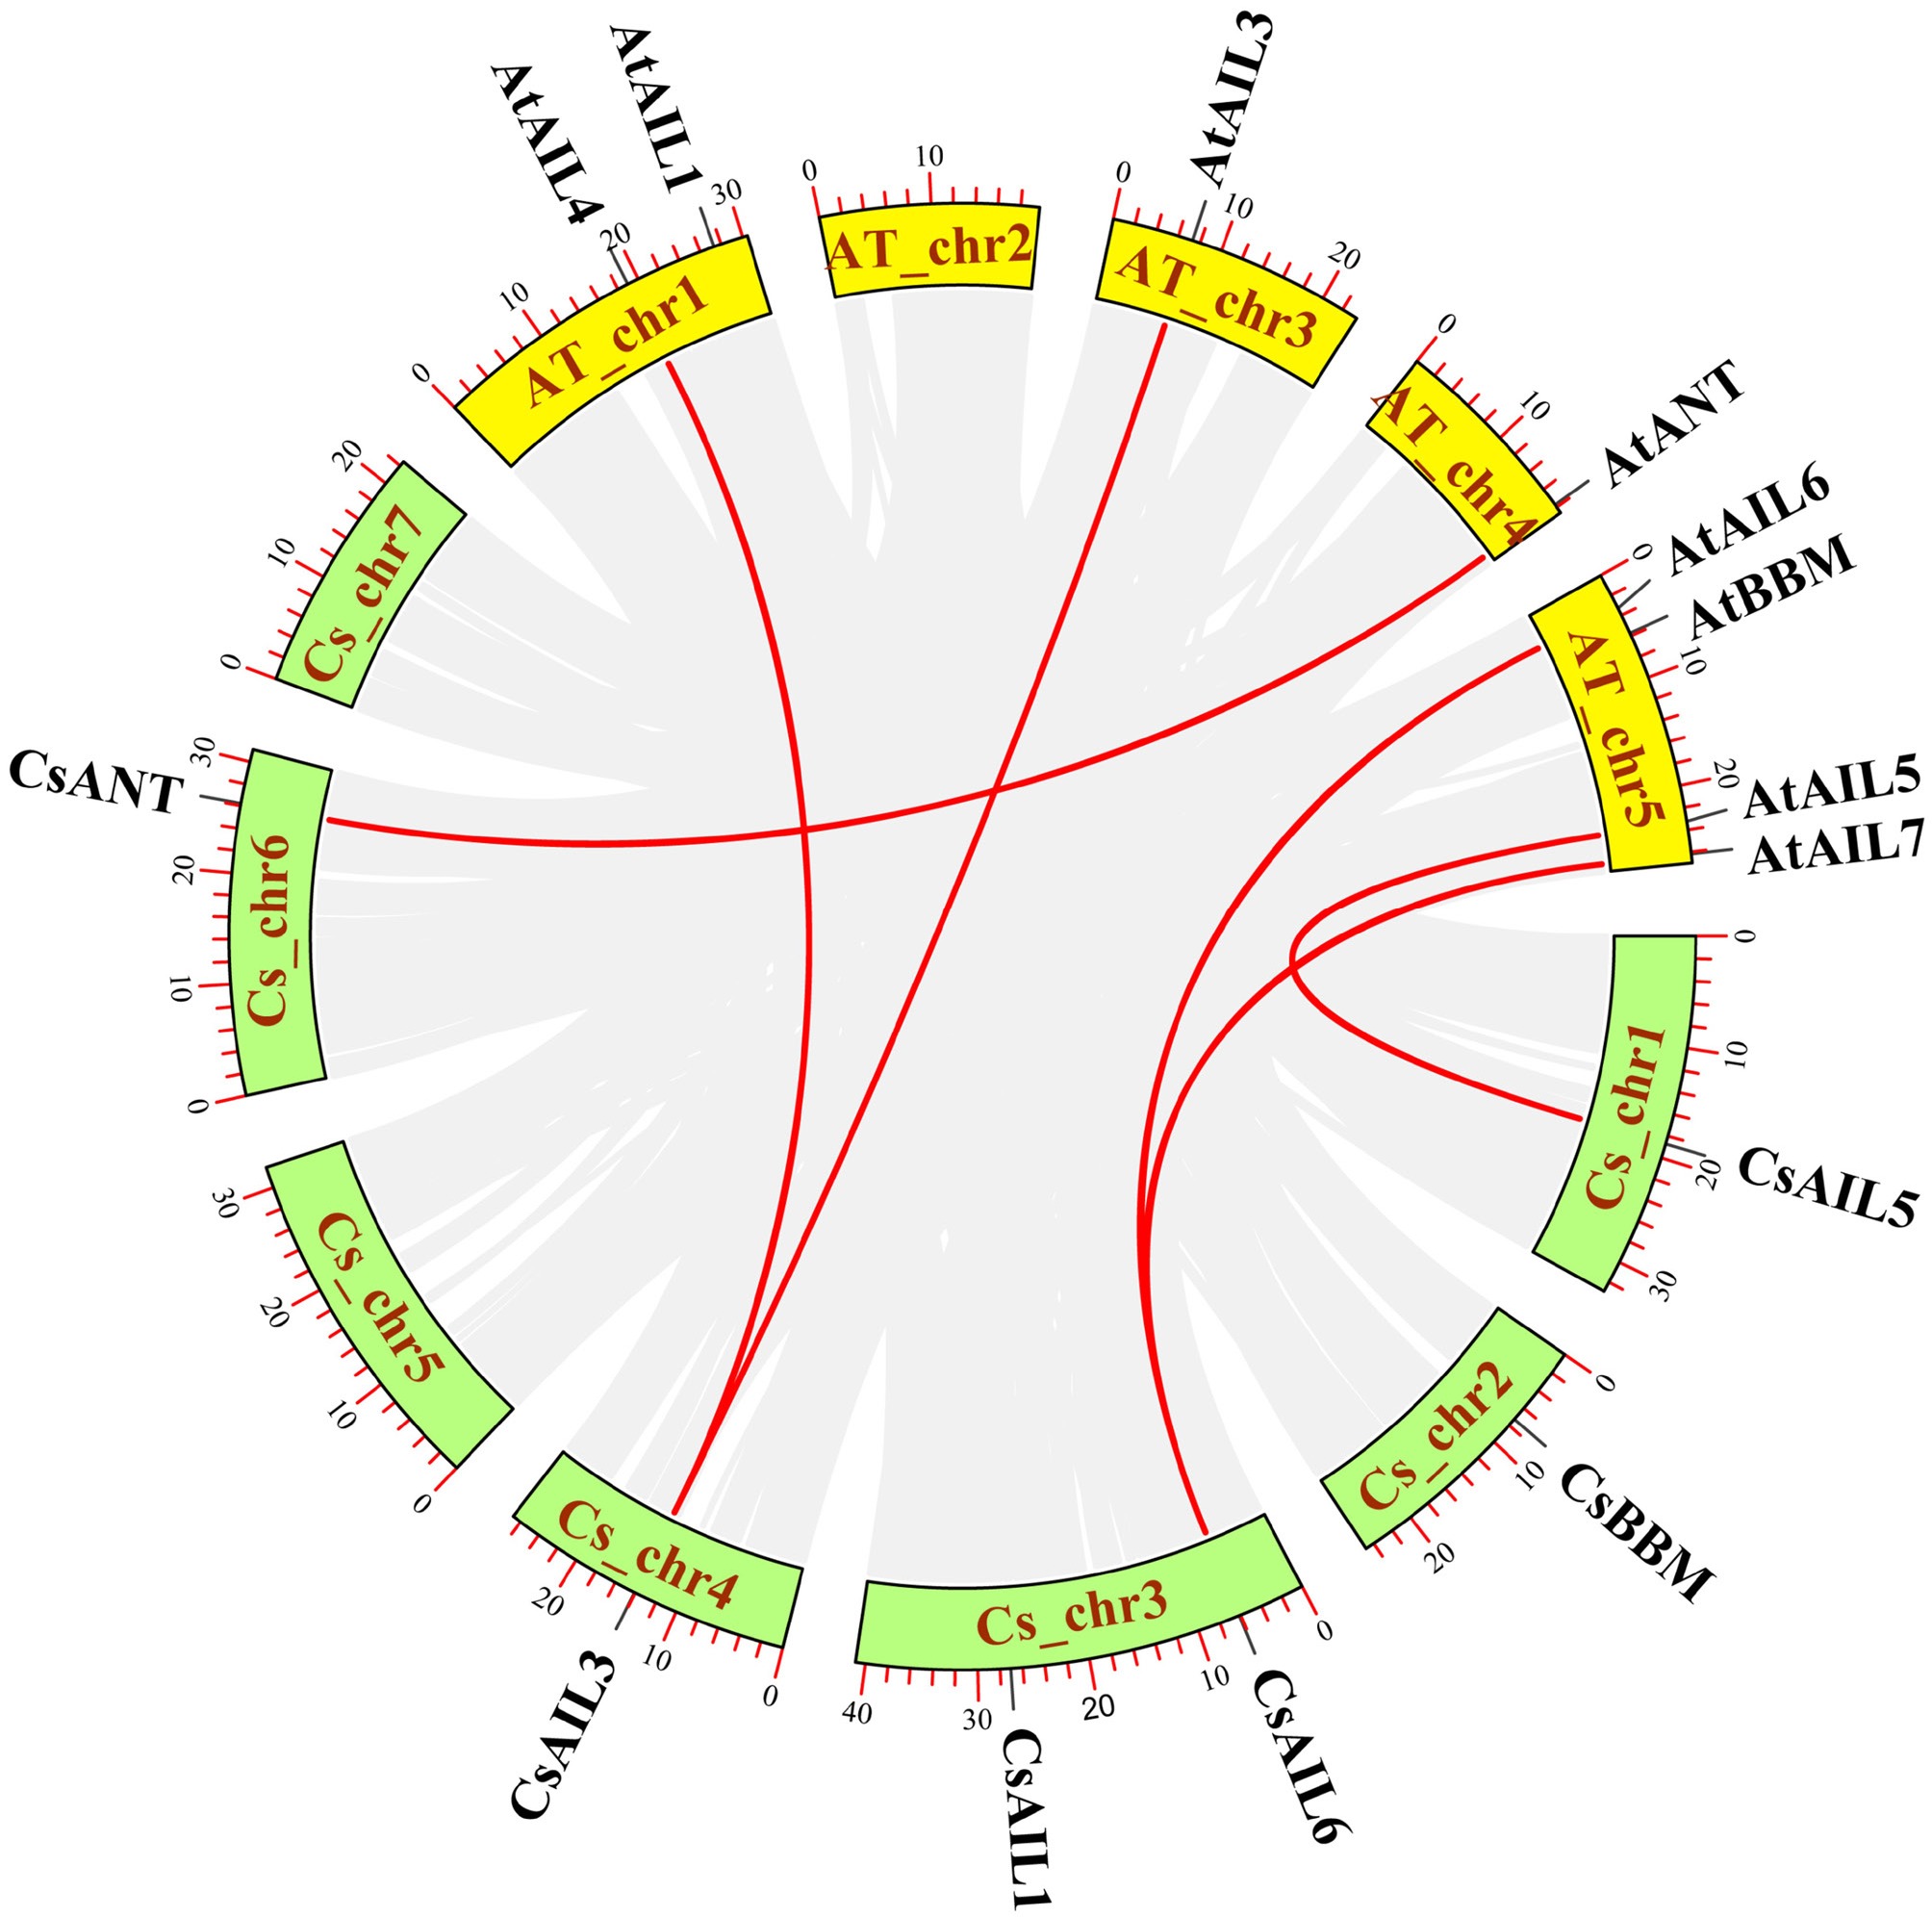
Figure 2.
Synteny analysis of AIL genes between cucumber and Arabidopsis. The synteny gene pairs are highlighted in the red lines. Cs, cucumber; At, Arabidopsis.
-
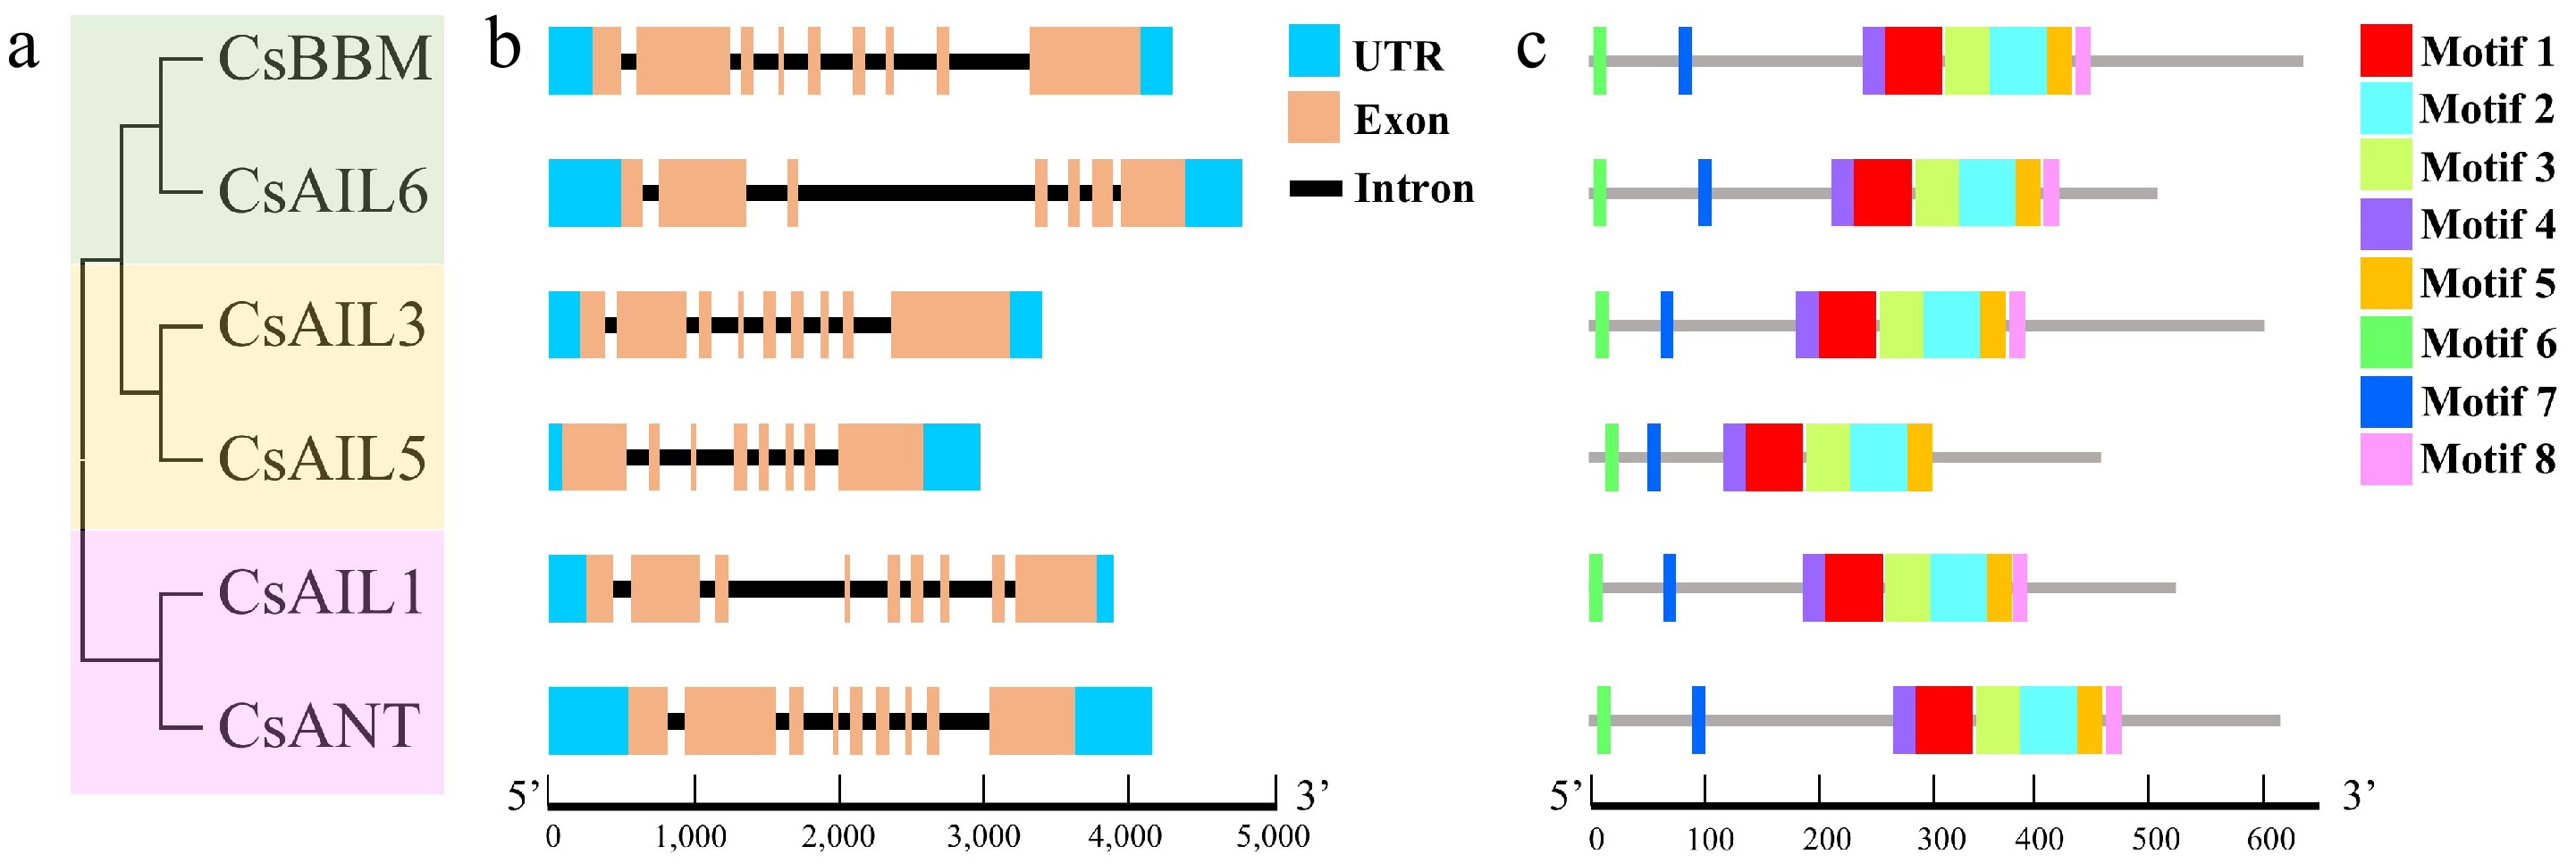
Figure 3.
Phylogenetic clustering, gene structures, and conserved motifs of CsAIL genes. (a) Unrooted phylogenetic tree of CsAIL proteins. (b) Gene structures of CsAIL genes. Untranslated regions (UTR), exons, and introns are indicated by blue boxes, light-brown boxes, and black lines, respectively. (c) Conserved motifs of CsAIL proteins. Distinct motifs are represented by different colored boxes.
-
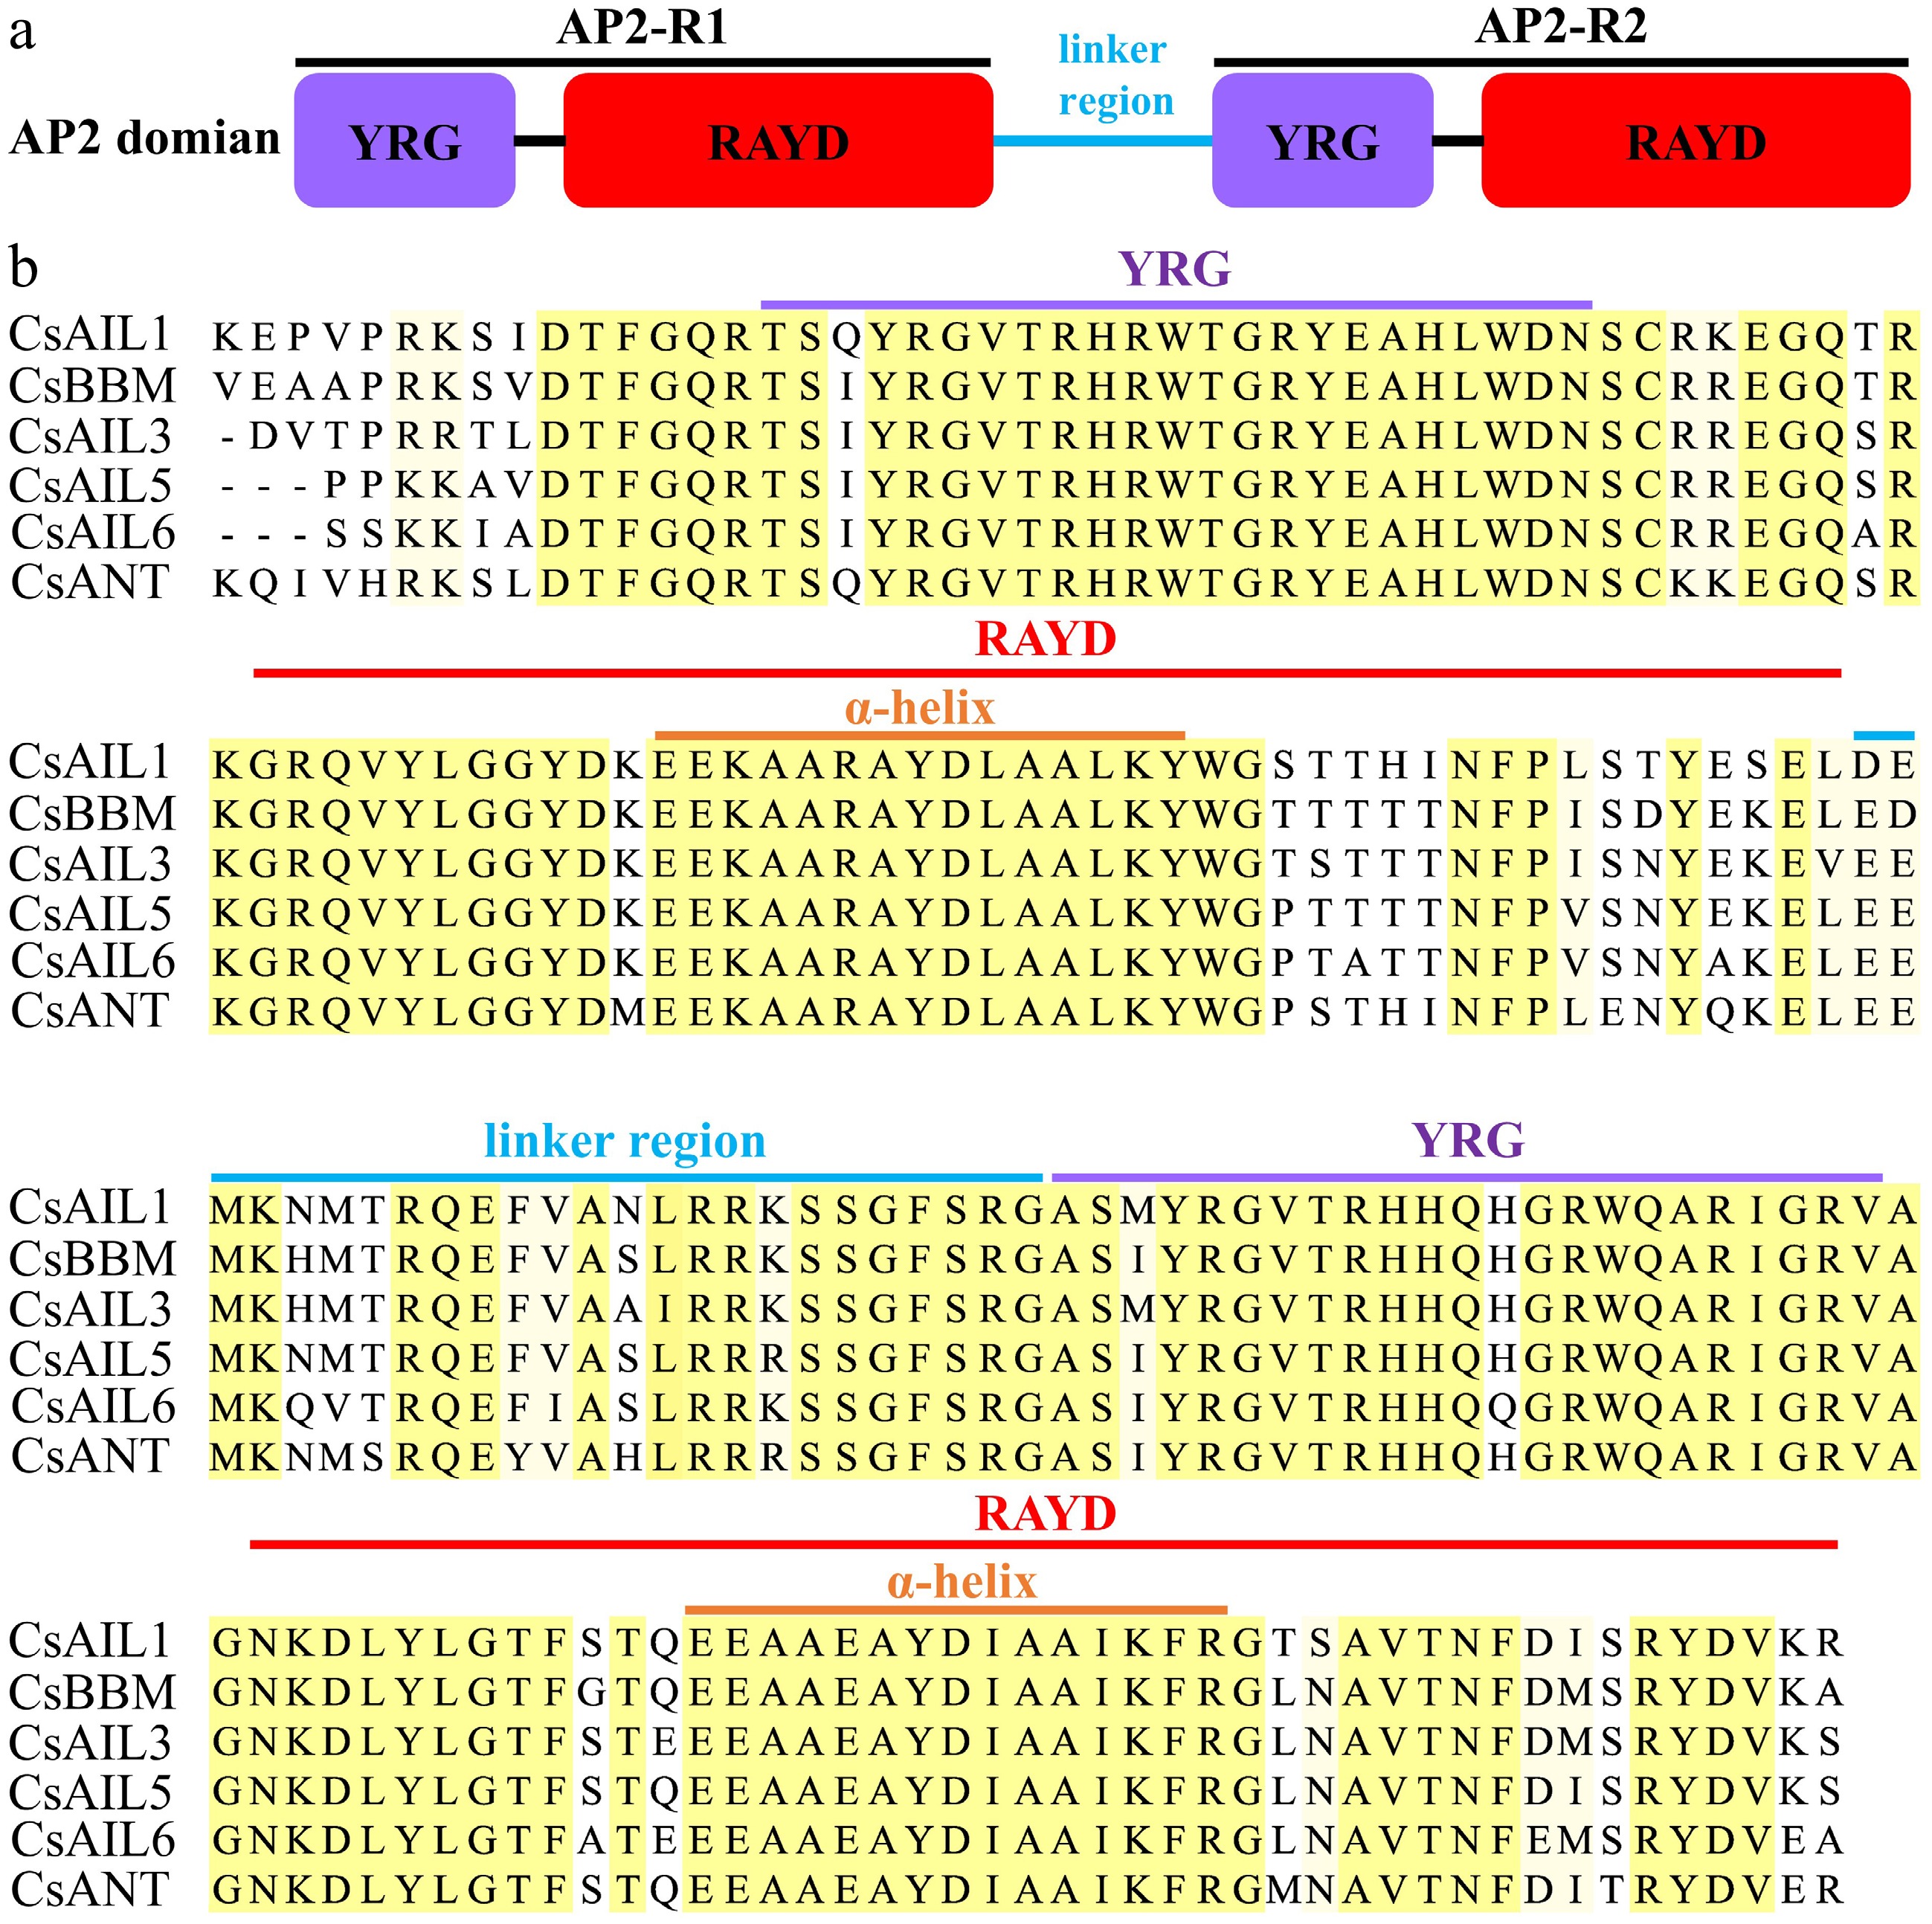
Figure 4.
The conserved AP2 domain of CsAIL proteins. (a) Model of AP2 domain. (b) Typical amino acid residues within AP2 domain.
-
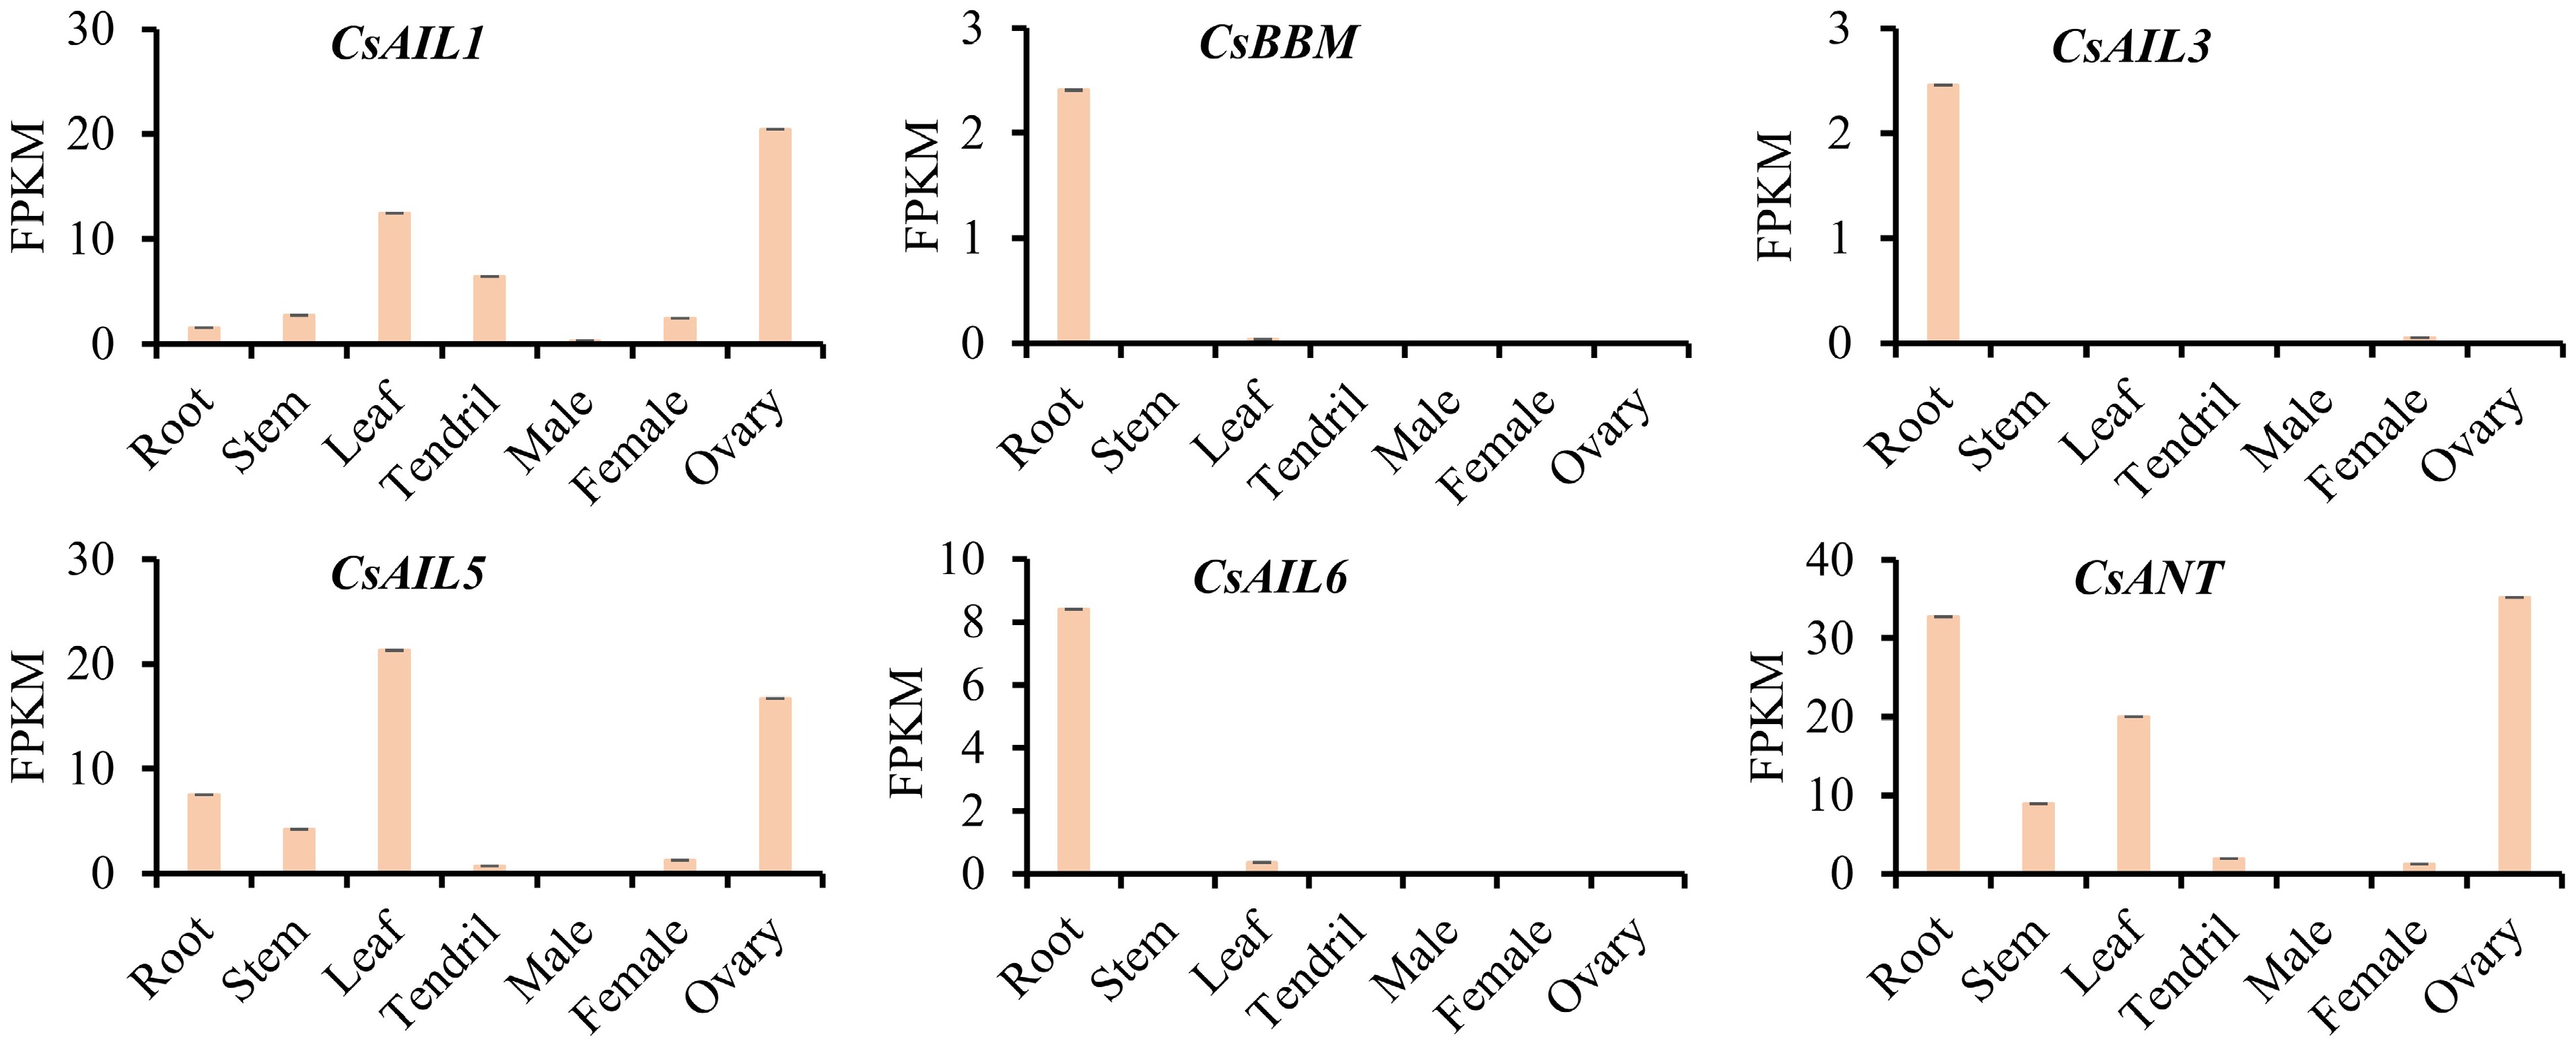
Figure 5.
Expression patterns (FPKM) of CsAIL genes in different tissues of cucumber. The expression data were derived from the PRJNA80169 transcriptome dataset.
-
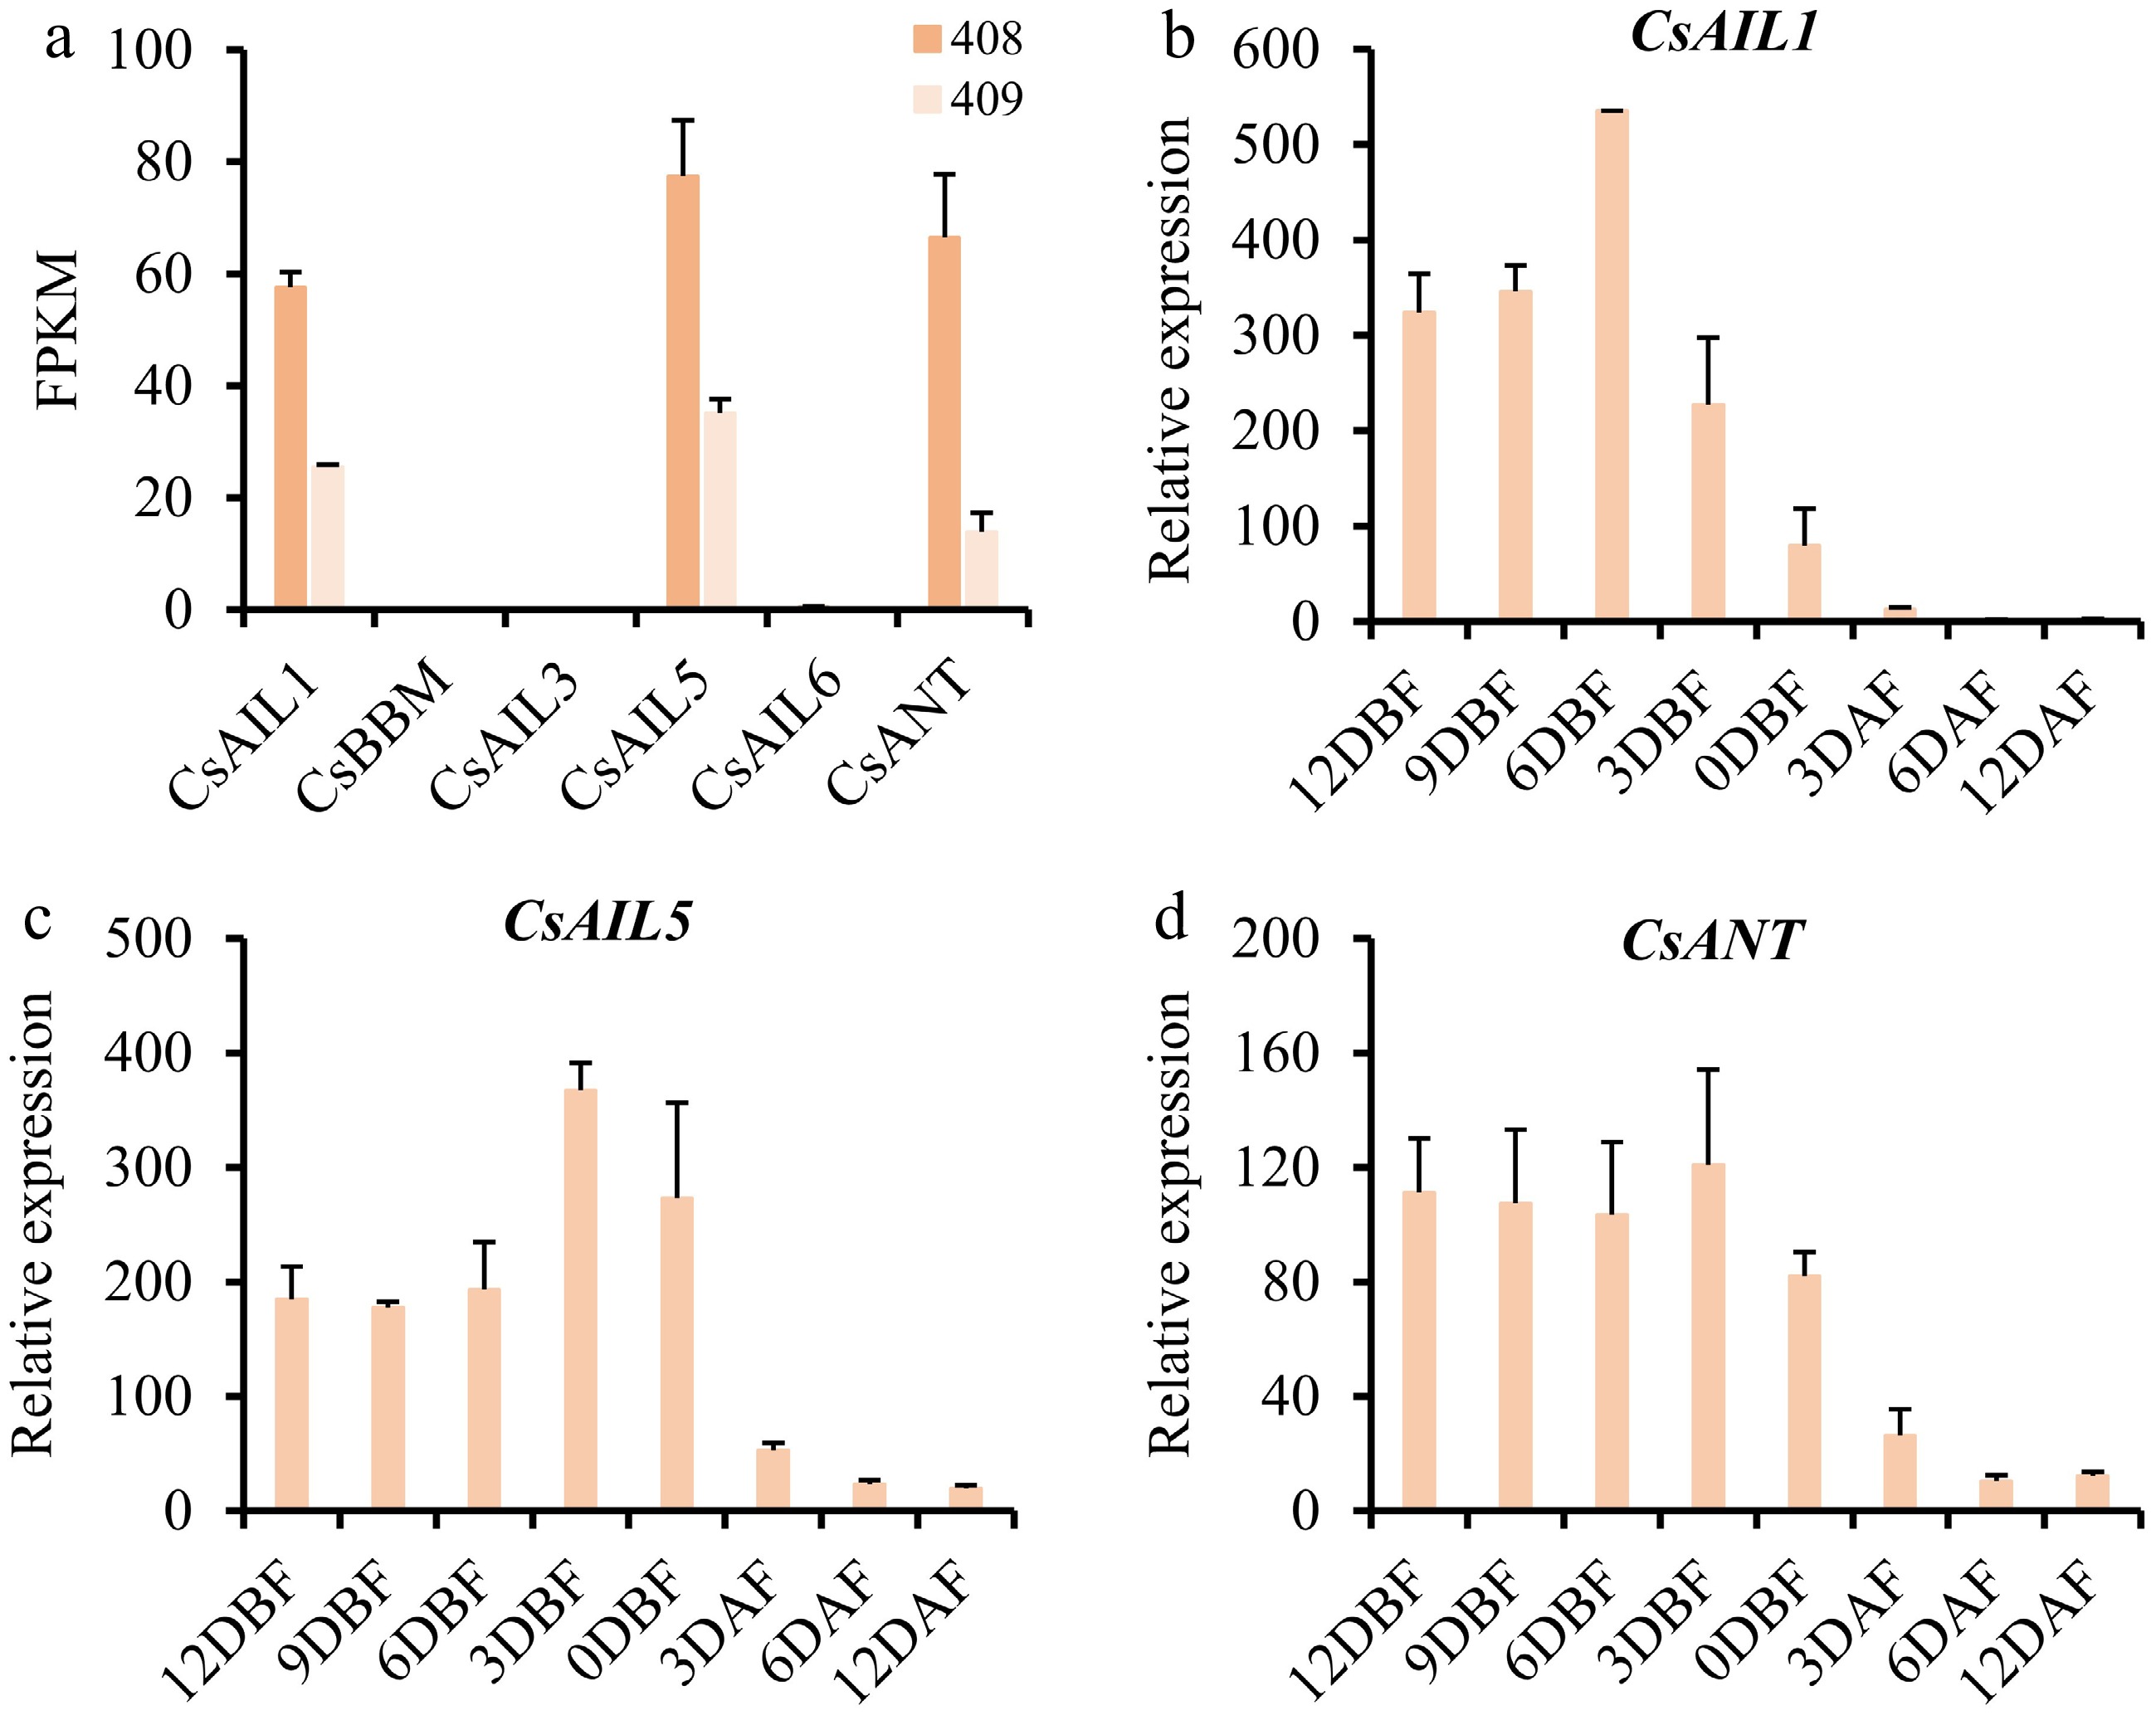
Figure 6.
Expression profiles of CsAIL genes in different stages of ovaries and fruits in cucumber. (a) Expression abundance (FPKM) of CsAILs in the ovaries from long-fruit (408), and short-fruit (409) cucumber lines. Expression data were obtained from the PRJNA258122 transcriptome dataset. (b)–(d) Relative expression levels of CsAIL1, CsAIL5, and CsANT at different developmental stages of ovaries and fruits as determined by RT-qPCR. Error bars represent the SD of three biological replicates. DBF, days before flowering; DAF, days after flowering.
-
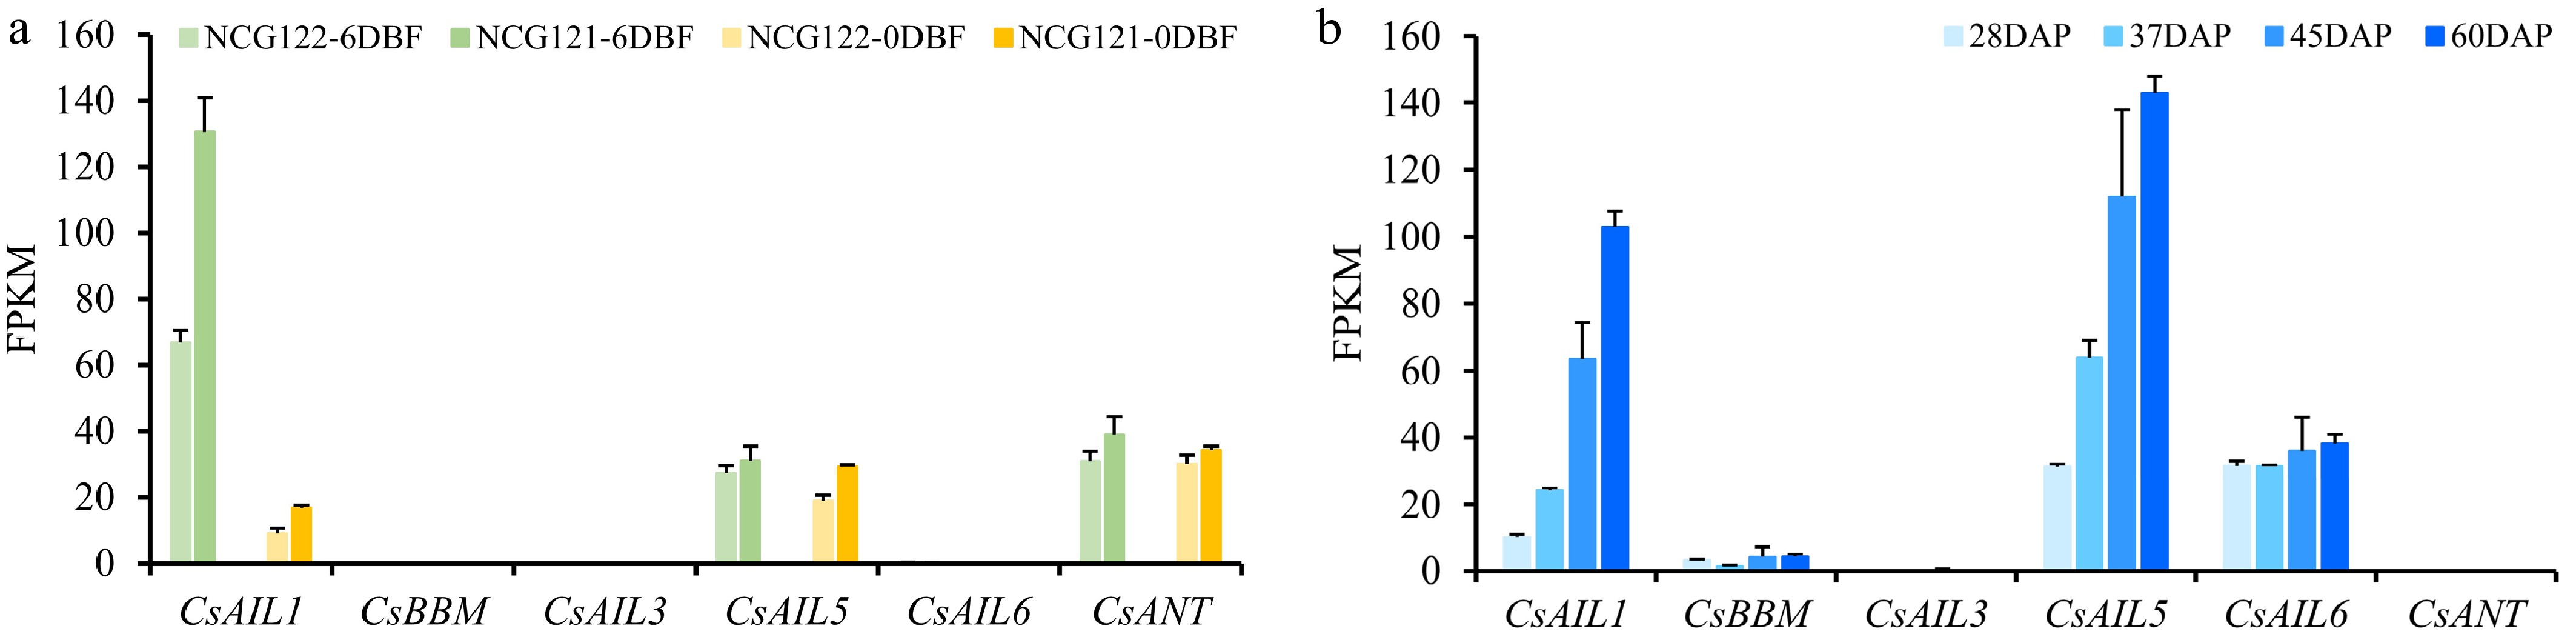
Figure 7.
Expression profiles of CsAIL genes in cucumber ovaries and seeds across developmental stages. (a) Expression levels (FPKM) of CsAILs in ovaries of the NCG121 (few fruit spines), and NCG122 (numerous fruit spines) varieties at different developmental stages. Expression data were obtained from the PRJNA431715 transcriptome dataset. (b) Expression patterns (FPKM) of CsAILs during seed development. Expression data from the PRJNA319011 transcriptome dataset were used in this analysis. Error bars indicate the SD of three biological replicates. DAP, days after pollination.
-
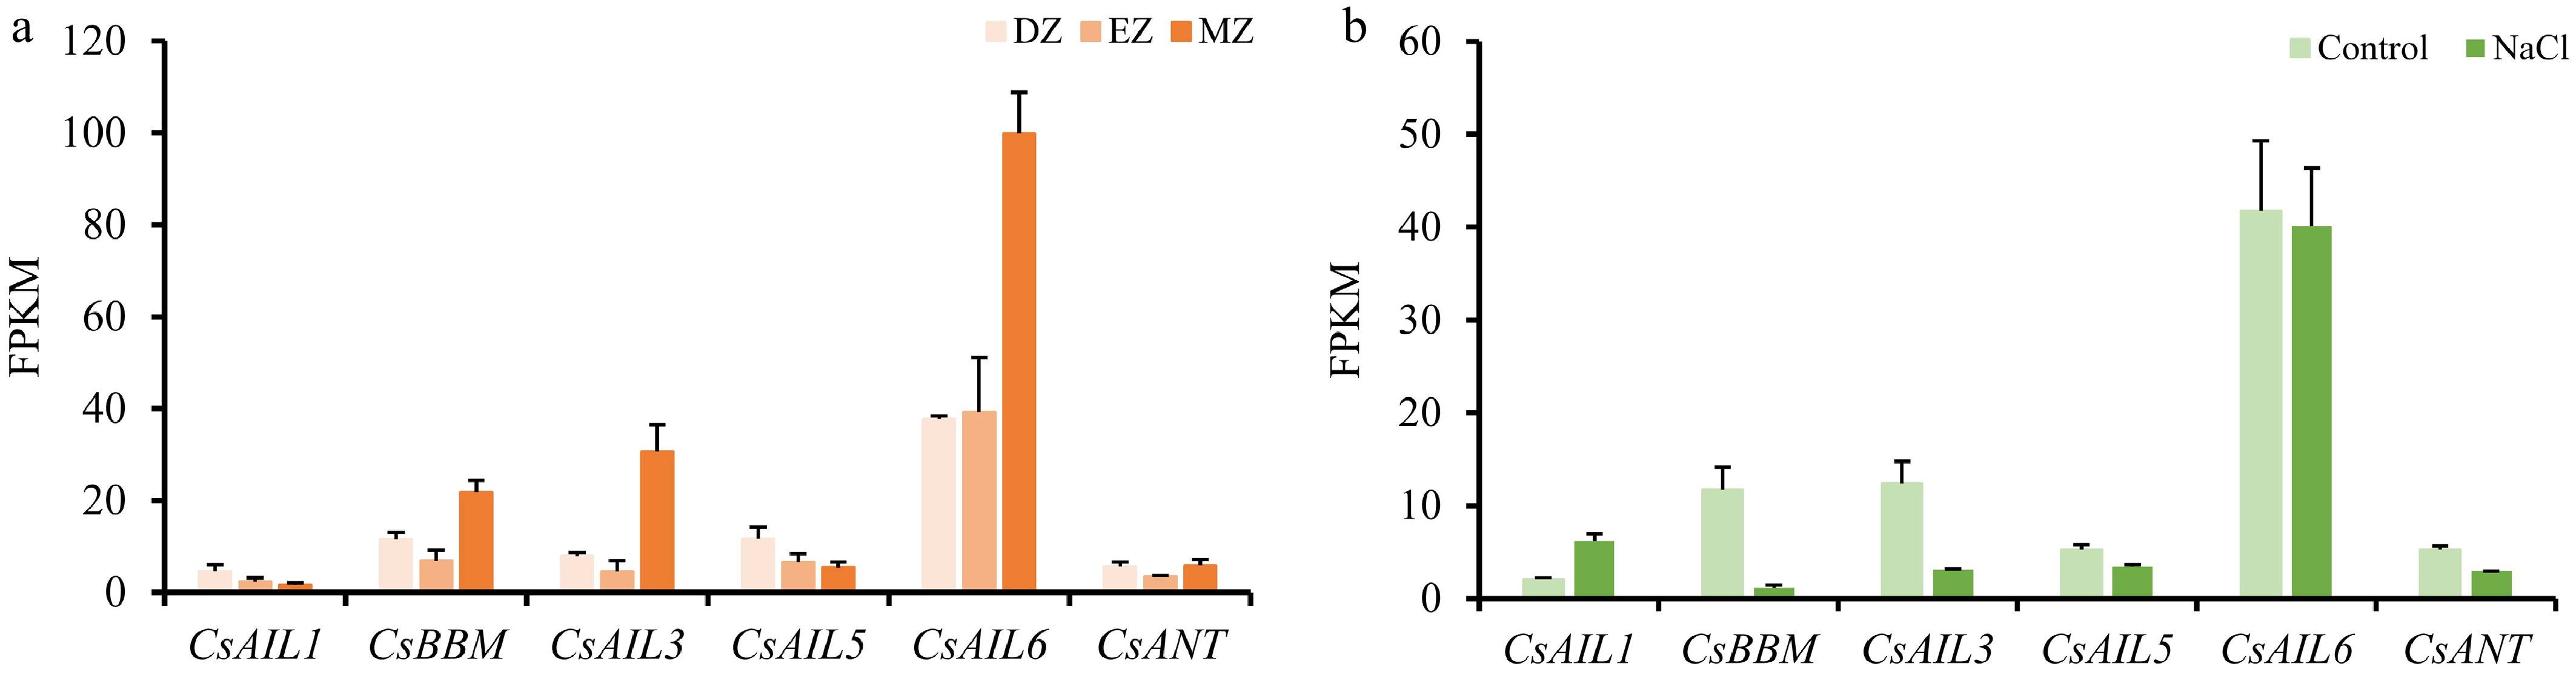
Figure 8.
Expression patterns of CsAIL genes in cucumber roots and under salt stress. (a) Expressions (FPKM) of CsAILs in different root developmental regions. Data were derived from the PRJNA271595 transcriptome dataset. DZ, differentiation zone; EZ, elongation zone; MZ, meristematic zone. (b) Expression levels (FPKM) of CsAILs in roots under control conditions and NaCl treatment. Data from the PRJNA437579 transcriptome dataset were used in this analysis. Error bars represent the SD of three biological replicates.
-
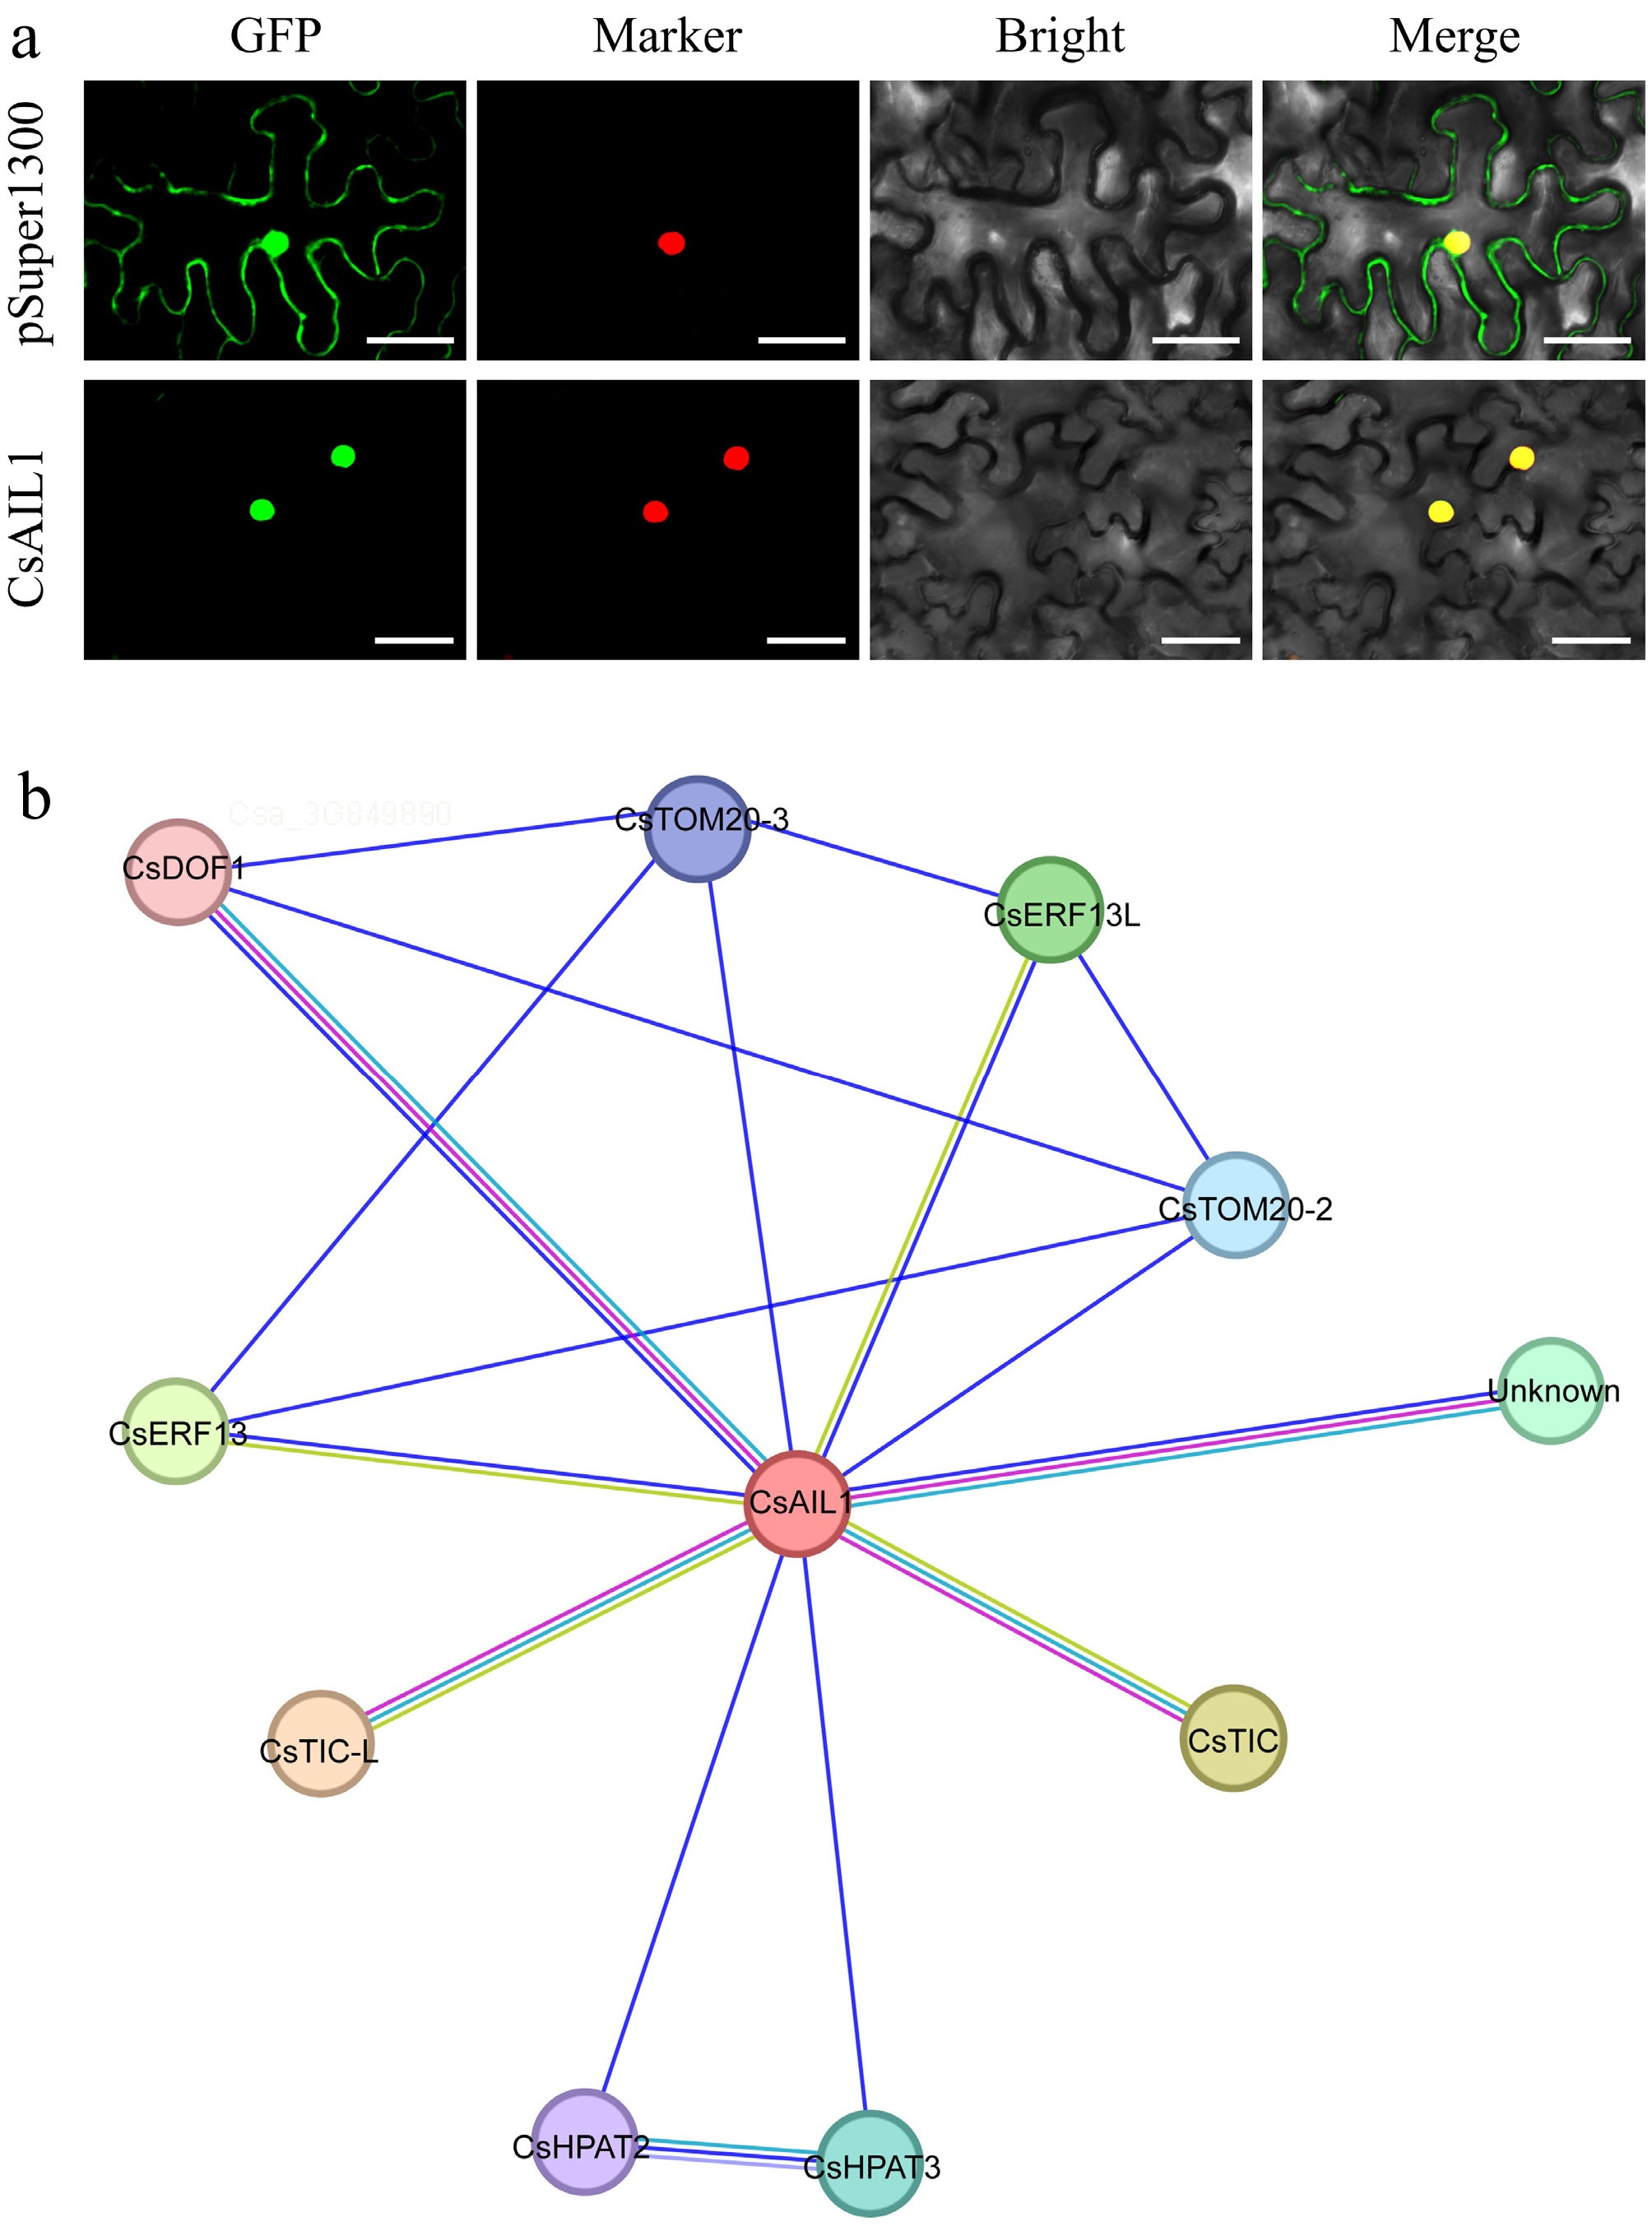
Figure 9.
Subcellular localization and interaction network of CsAIL1 protein. (a) Subcellular localization of CsAIL1 in epidermal cells of N. benthamiana leaves. Bars = 50 μm. (b) Predicted interaction network of CsAIL1 in cucumber. Data sources of predicted interactions are color-coded as follows: purple line, experimentally determined; pearl blue line, from curated databases; blue line, gene co-occurrence; light green line, textmining; light blue-violet line, protein homology.
-
Gene name Gene ID Chromosome location Amino acid length (AA) MW (kDa) pI Arabidopsis ortholog CsAIL1 CsaV3_3G031350 chr3: 27057687...27061567 (−) 533 59.07 5.88 AIL1 CsBBM CsaV3_2G010320 chr2: 7285623...7289916 (+) 650 70.01 6.23 BBM (AIL2, PLT4) CsAIL3 CsaV3_4G024120 chr4: 14070320...14073714 (−) 615 67.27 6.34 AIL3 (PLT1)/AIL4 (PLT2) CsAIL5 CsaV3_1G031650 chr1: 18716067...18719027 (+) 466 51.43 8.64 AIL5 (PLT5) CsAIL6 CsaV3_3G006900 chr3: 6134843...6139602 (−) 517 57.00 6.28 AIL6 (PLT3)/AIL7 (PLT7) CsANT CsaV3_6G044340 chr6:26200005...26204175 (+) 629 69.60 7.08 ANT Table 1.
The classification of CsAIL gene family in cucumber.
Figures
(9)
Tables
(1)