-
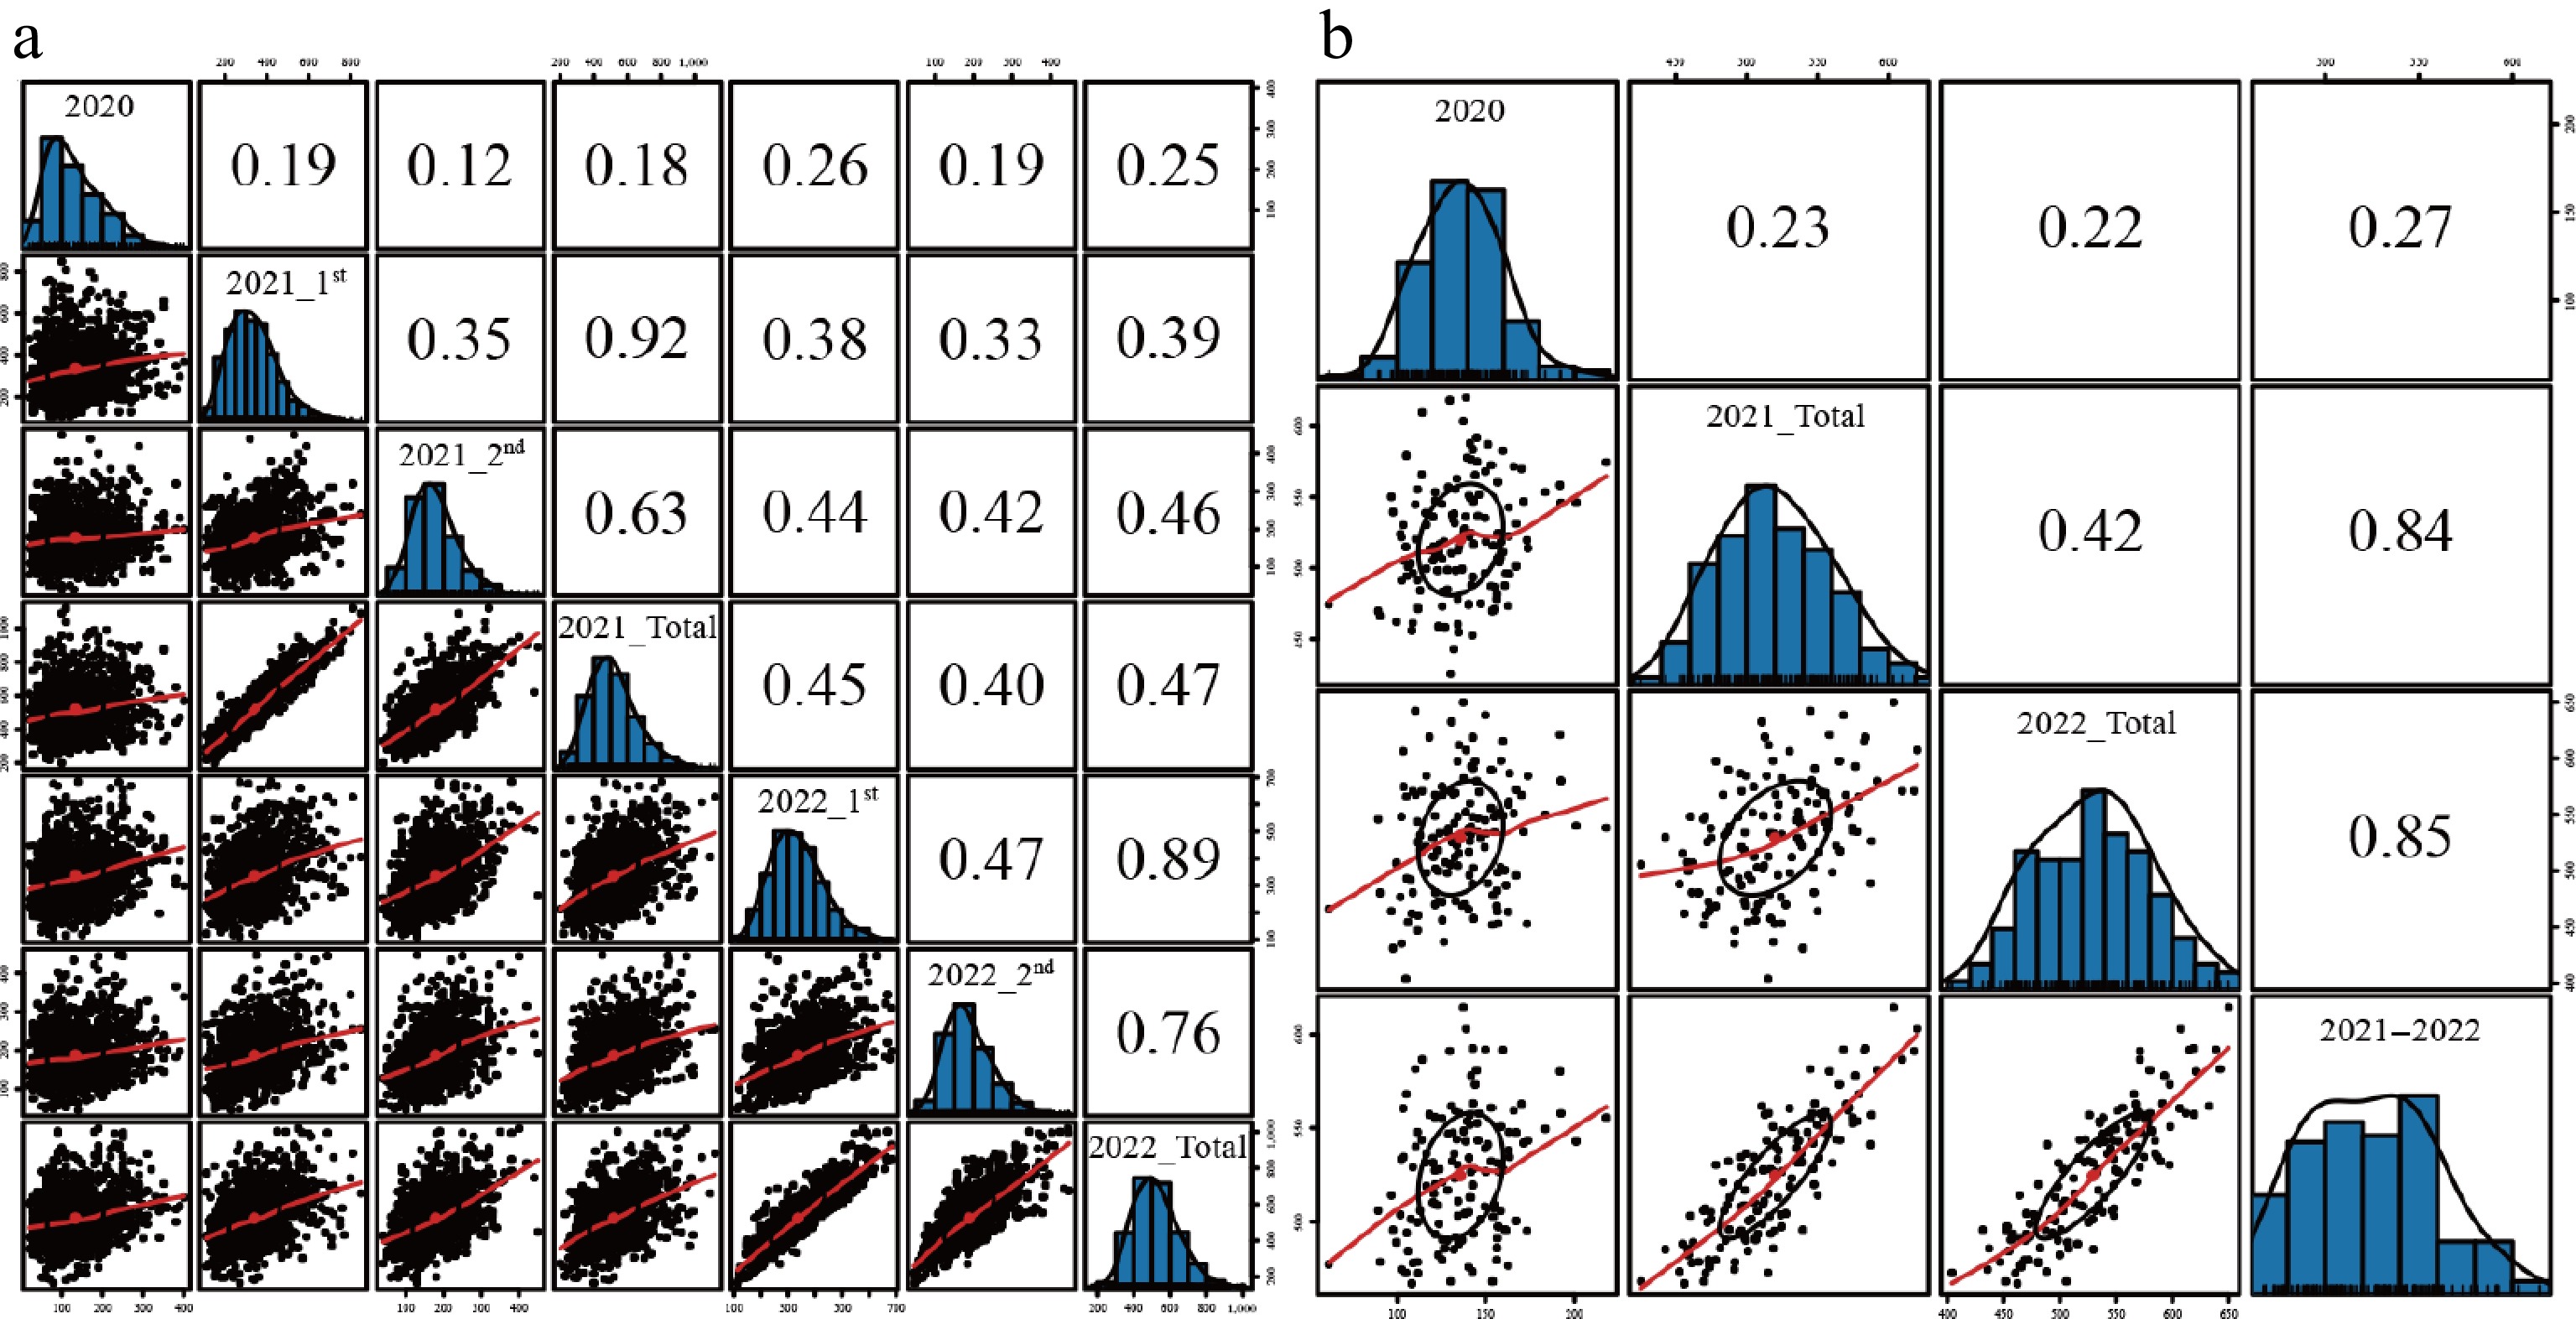
Figure 1.
The correlation of FW traits under different environments. (a) Using the original data. (b) Using the BLUP data. Note: The definition of the environment abbreviations (e.g., 2020, 2021_1st, 2022_Total) is identical to those provided in Table 1.
-
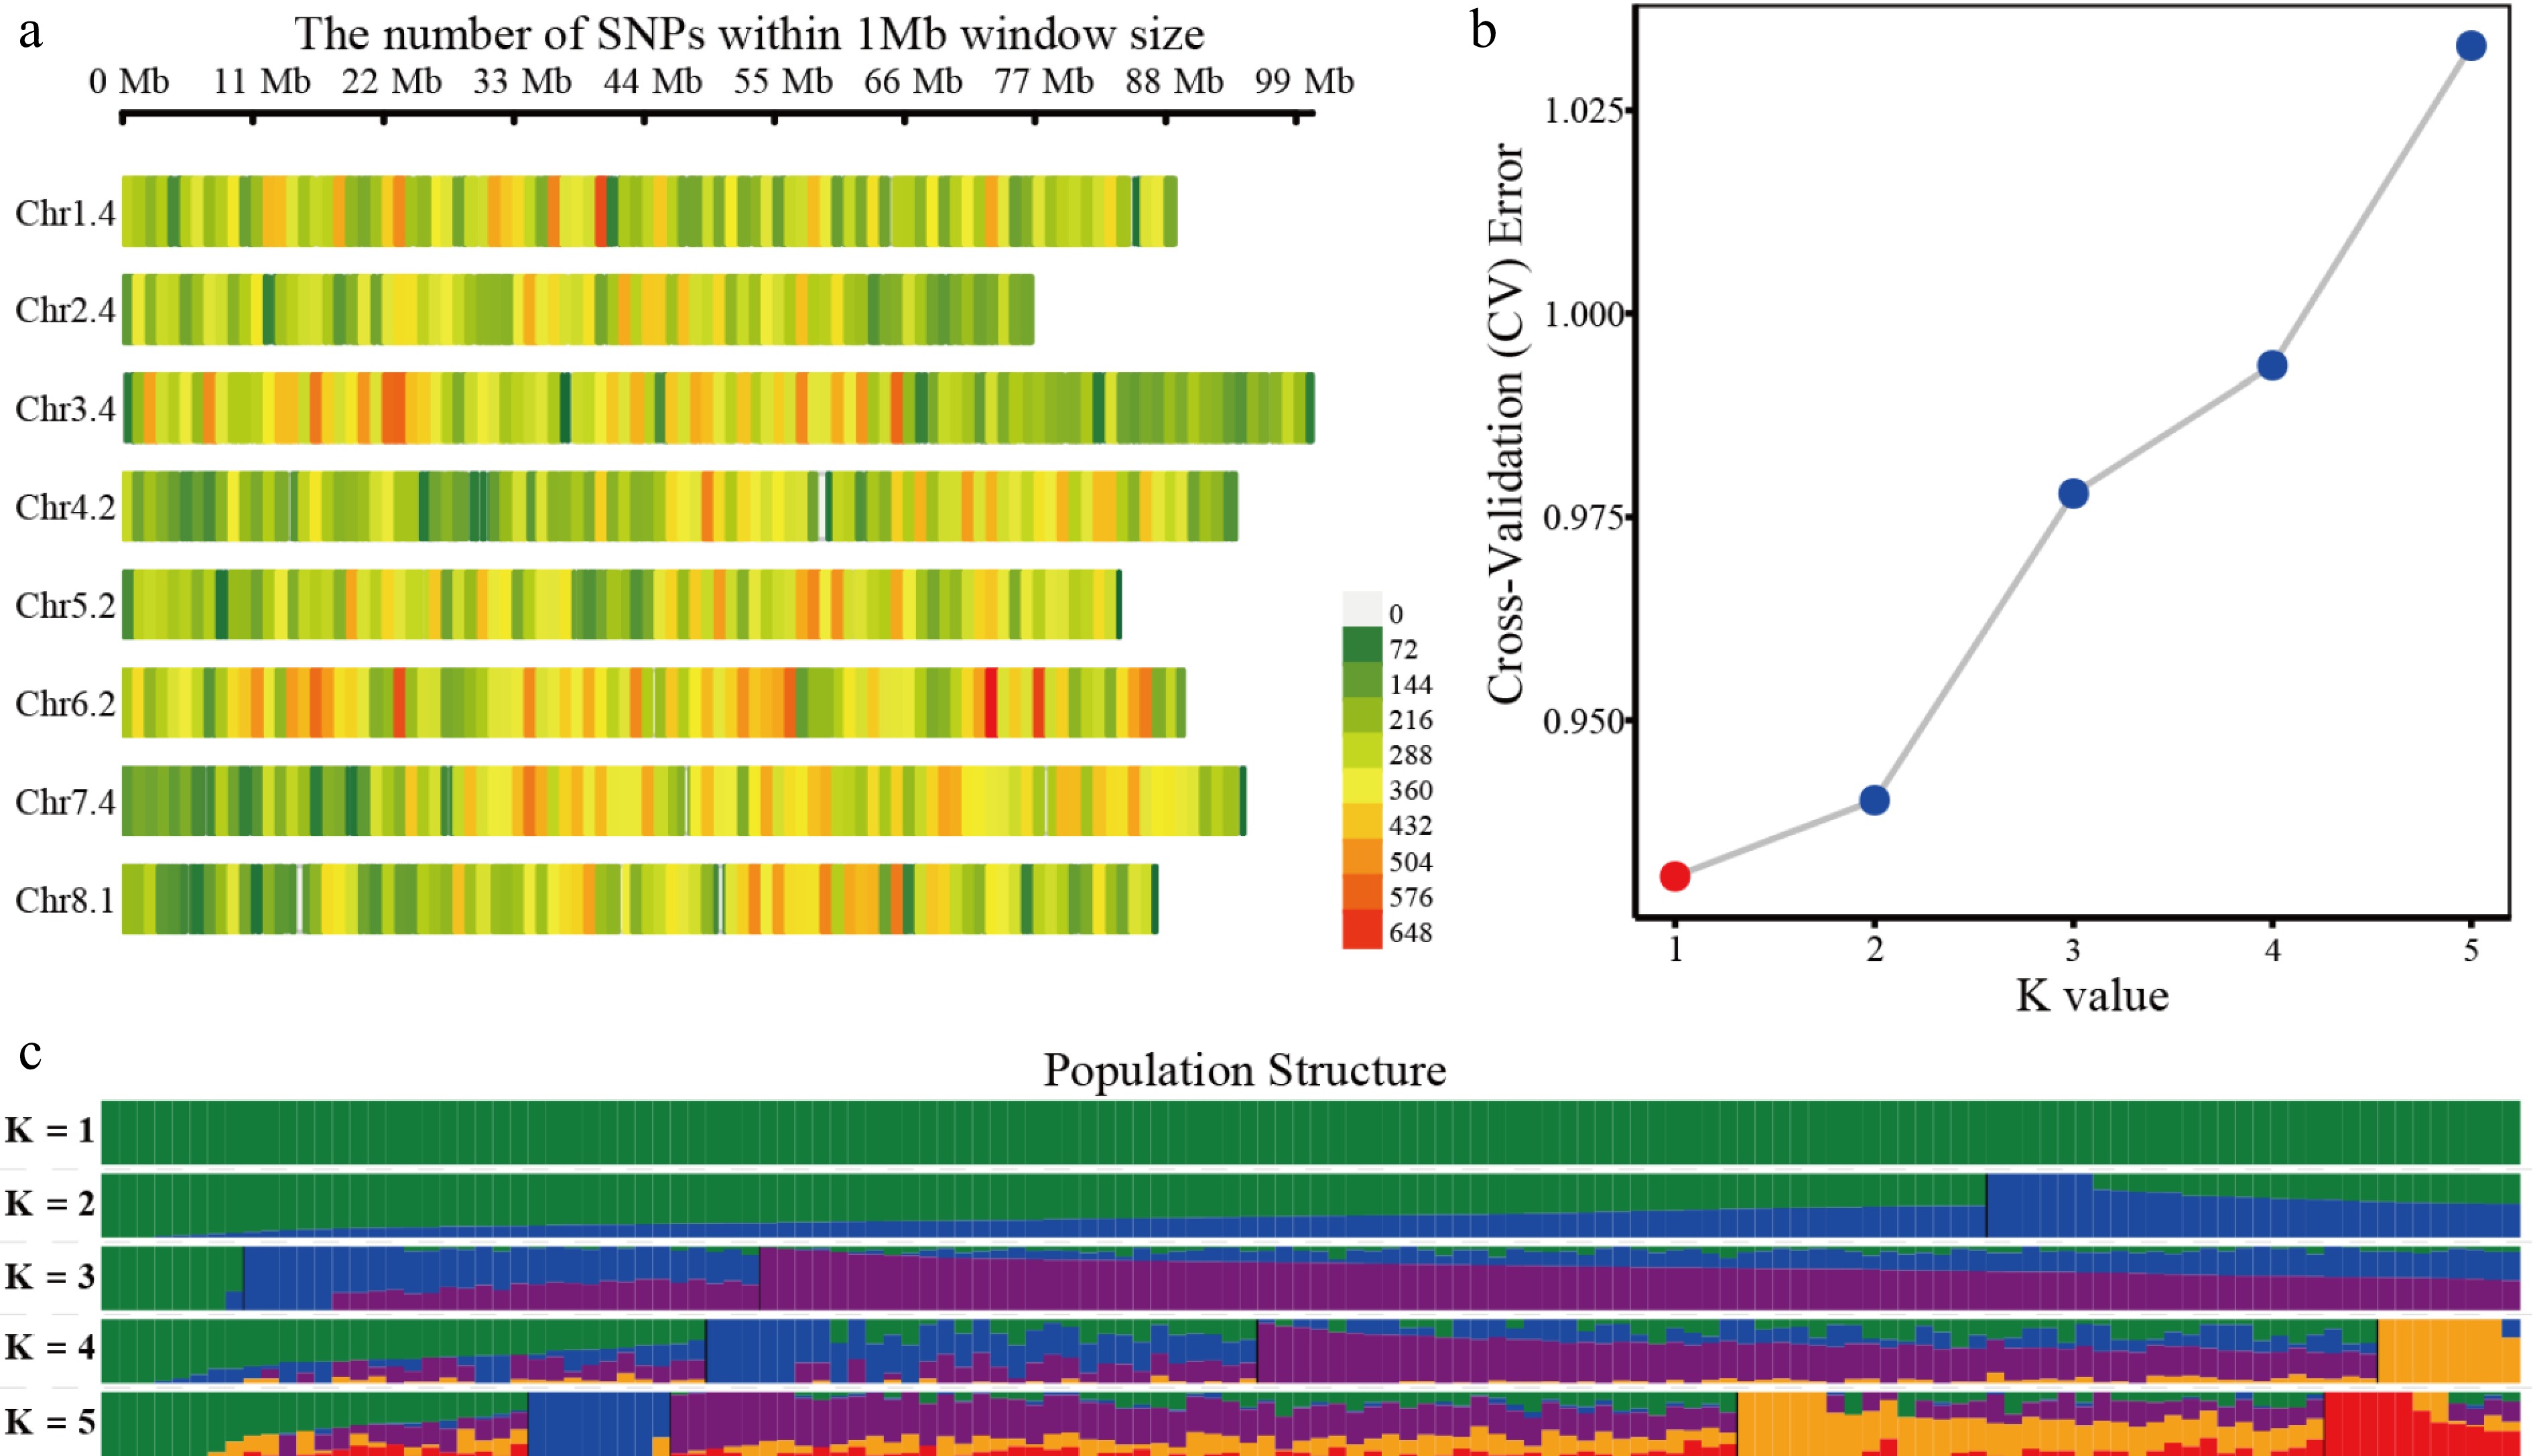
Figure 2.
Distribution of SNPs and population structure analysis of the genotypes of 136 alfalfa germplasms. (a) Distribution of SNPs on eight chromosomes. (b) Cross-validation analysis of the SNPs of half-sib families of M. sativa. (c) Population structure analysis using SNPs of half-sib families of M. sativa.
-

Figure 3.
Prediction accuracy of GS models for the FW traits using different SNP sets. (a)–(h) Represent the genomic selection (GS) results for different traits, corresponding to 2020_FW, 2021_1st_FW, 2021_2nd_FW, 2021_total_FW, 2022_1st_FW, 2022_2nd_FW, 2022_total_FW, and 2021–2022_FW, respectively. The different colors represent distinct GS models: gBLUP (red), rrBLUP (blue), BRR (green), BL (yellow), Bayes A (cyan), Bayes B (magenta), and Bayes C (purple).
-
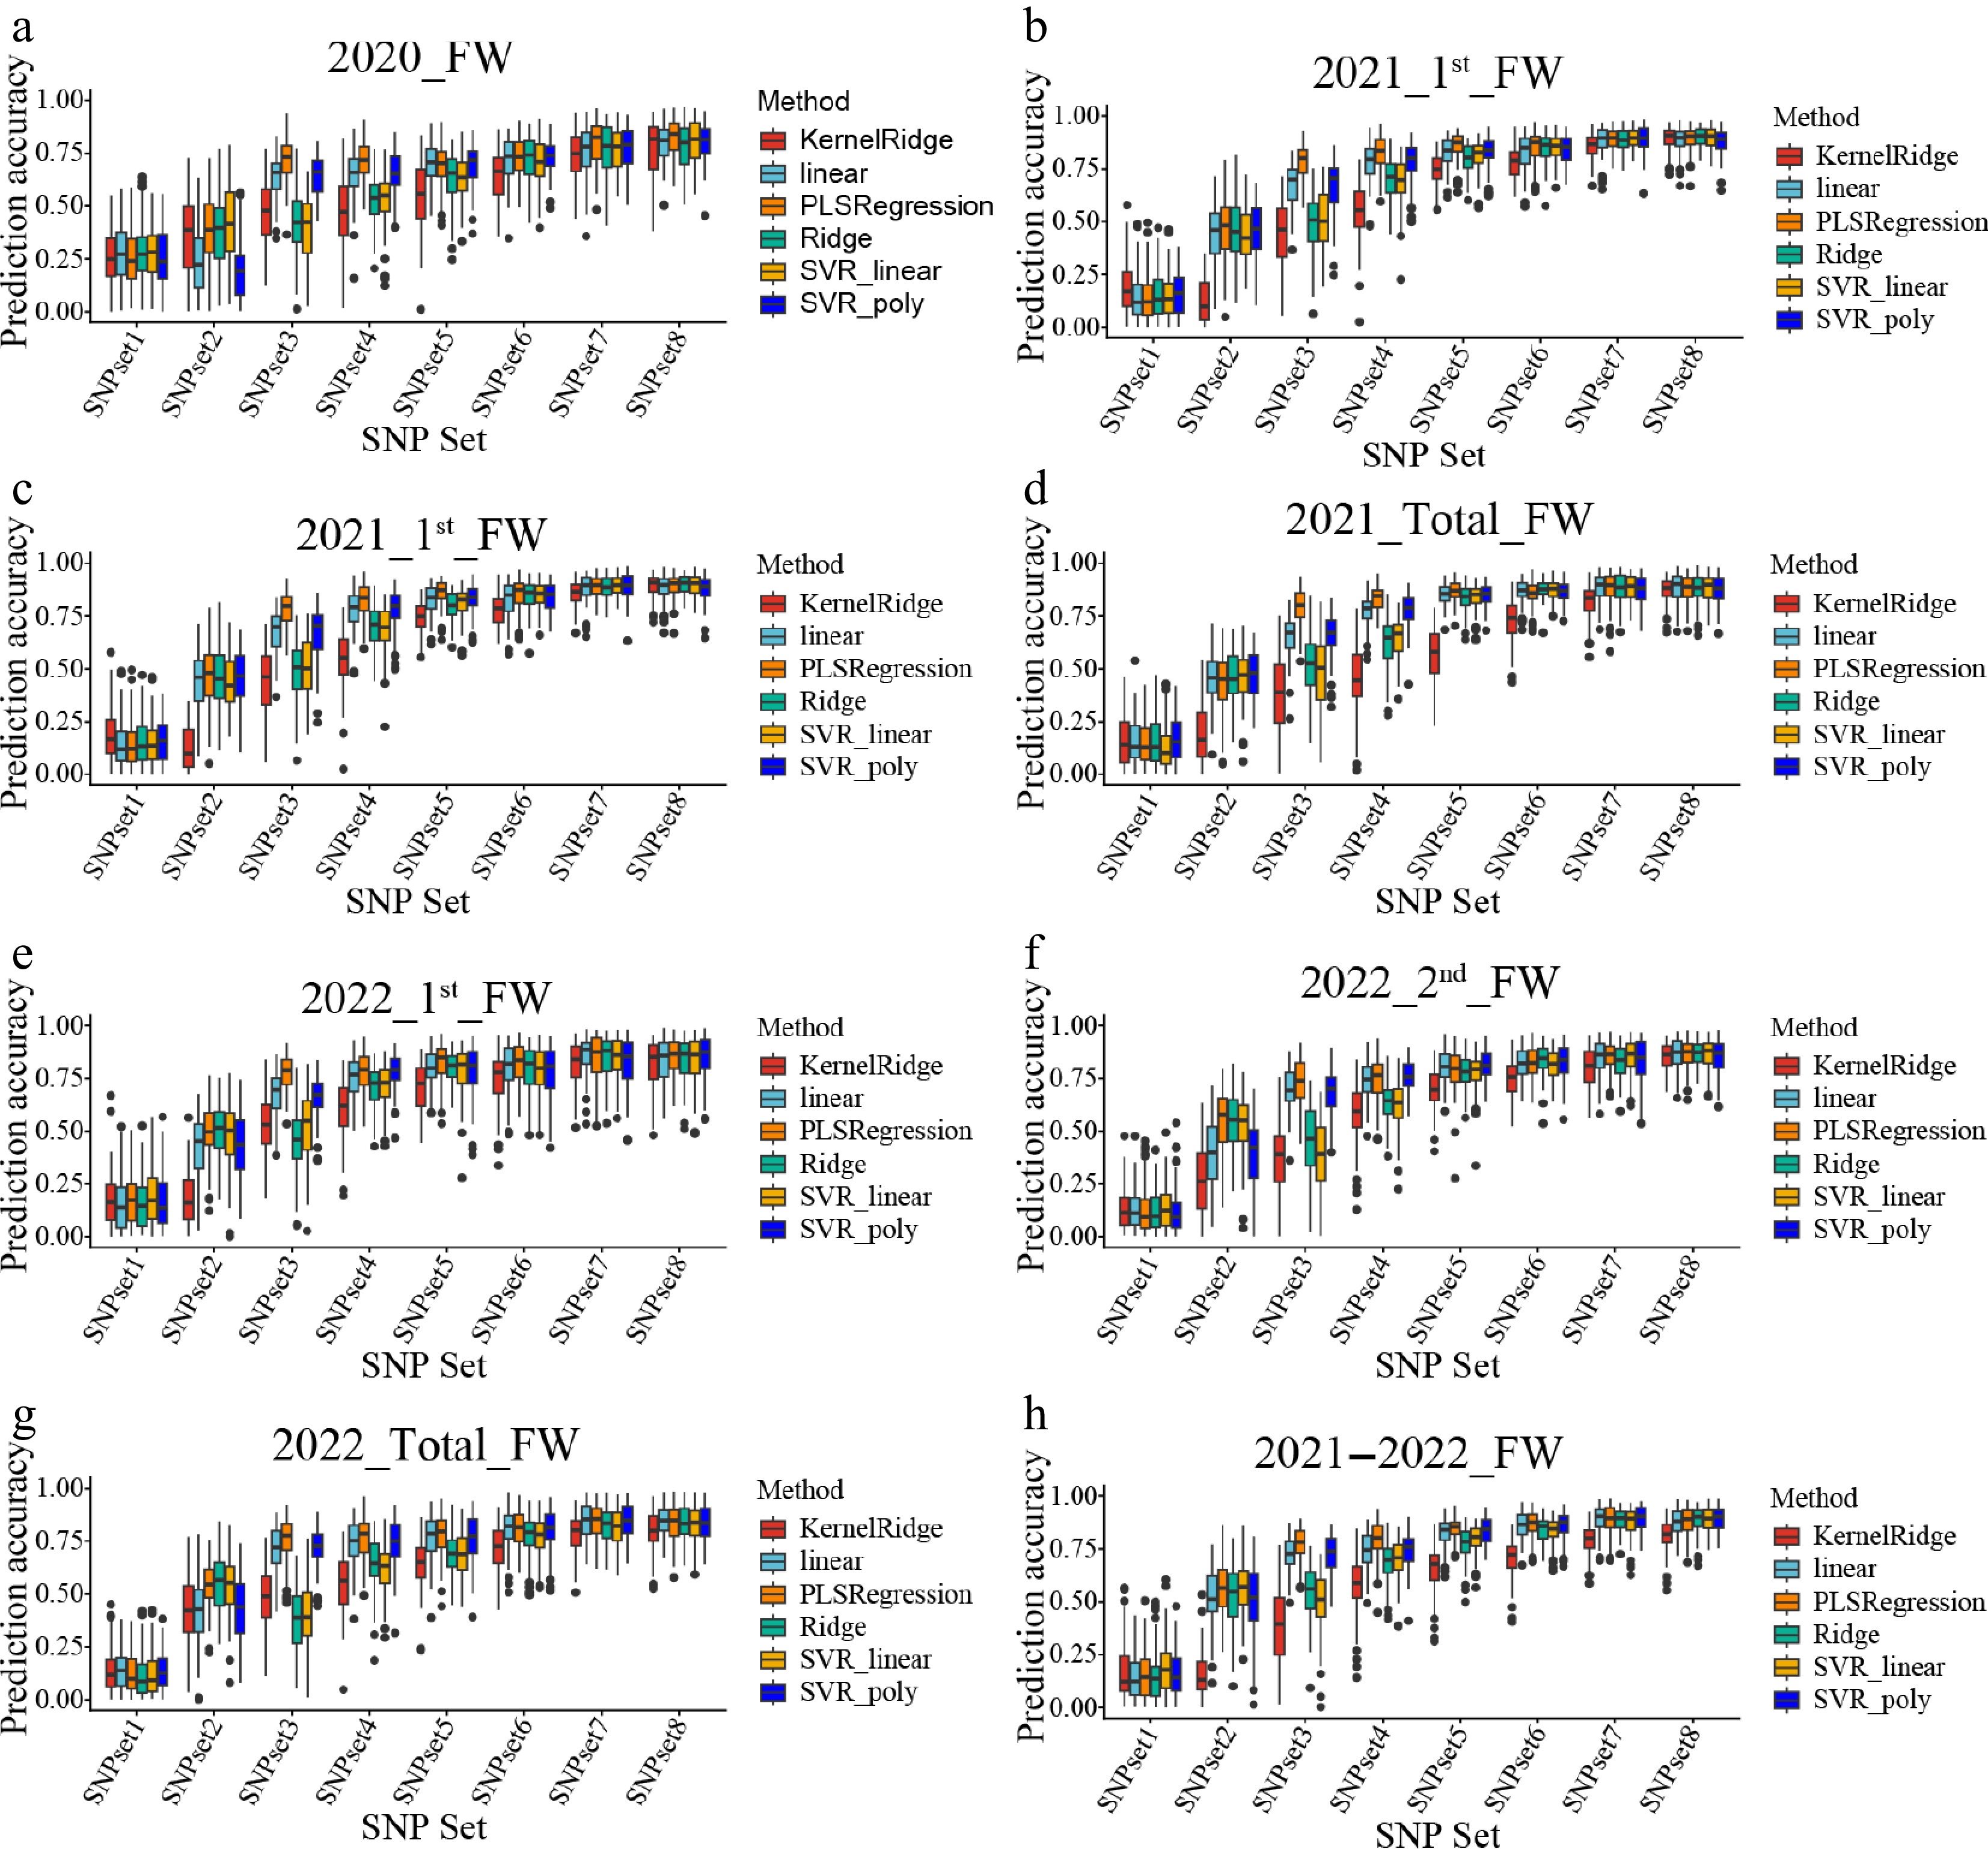
Figure 4.
The prediction accuracy of different machine learning models for the FW traits by using different SNP sets. (a)–(h) Represent the genomic selection (GS) results for different traits, corresponding to 2020_FW, 2021_1st_FW, 2021_2nd_FW, 2021_total_FW, 2022_1st_FW, 2022_2nd_FW, 2022_total_FW, and 2021–2022_FW, respectively. Different colors indicate different machine learning models: KernelRidge (red), linear (blue), PLSRegression (cyan), Ridge (yellow), SVR_linear (green), and SVR_poly (purple).
-
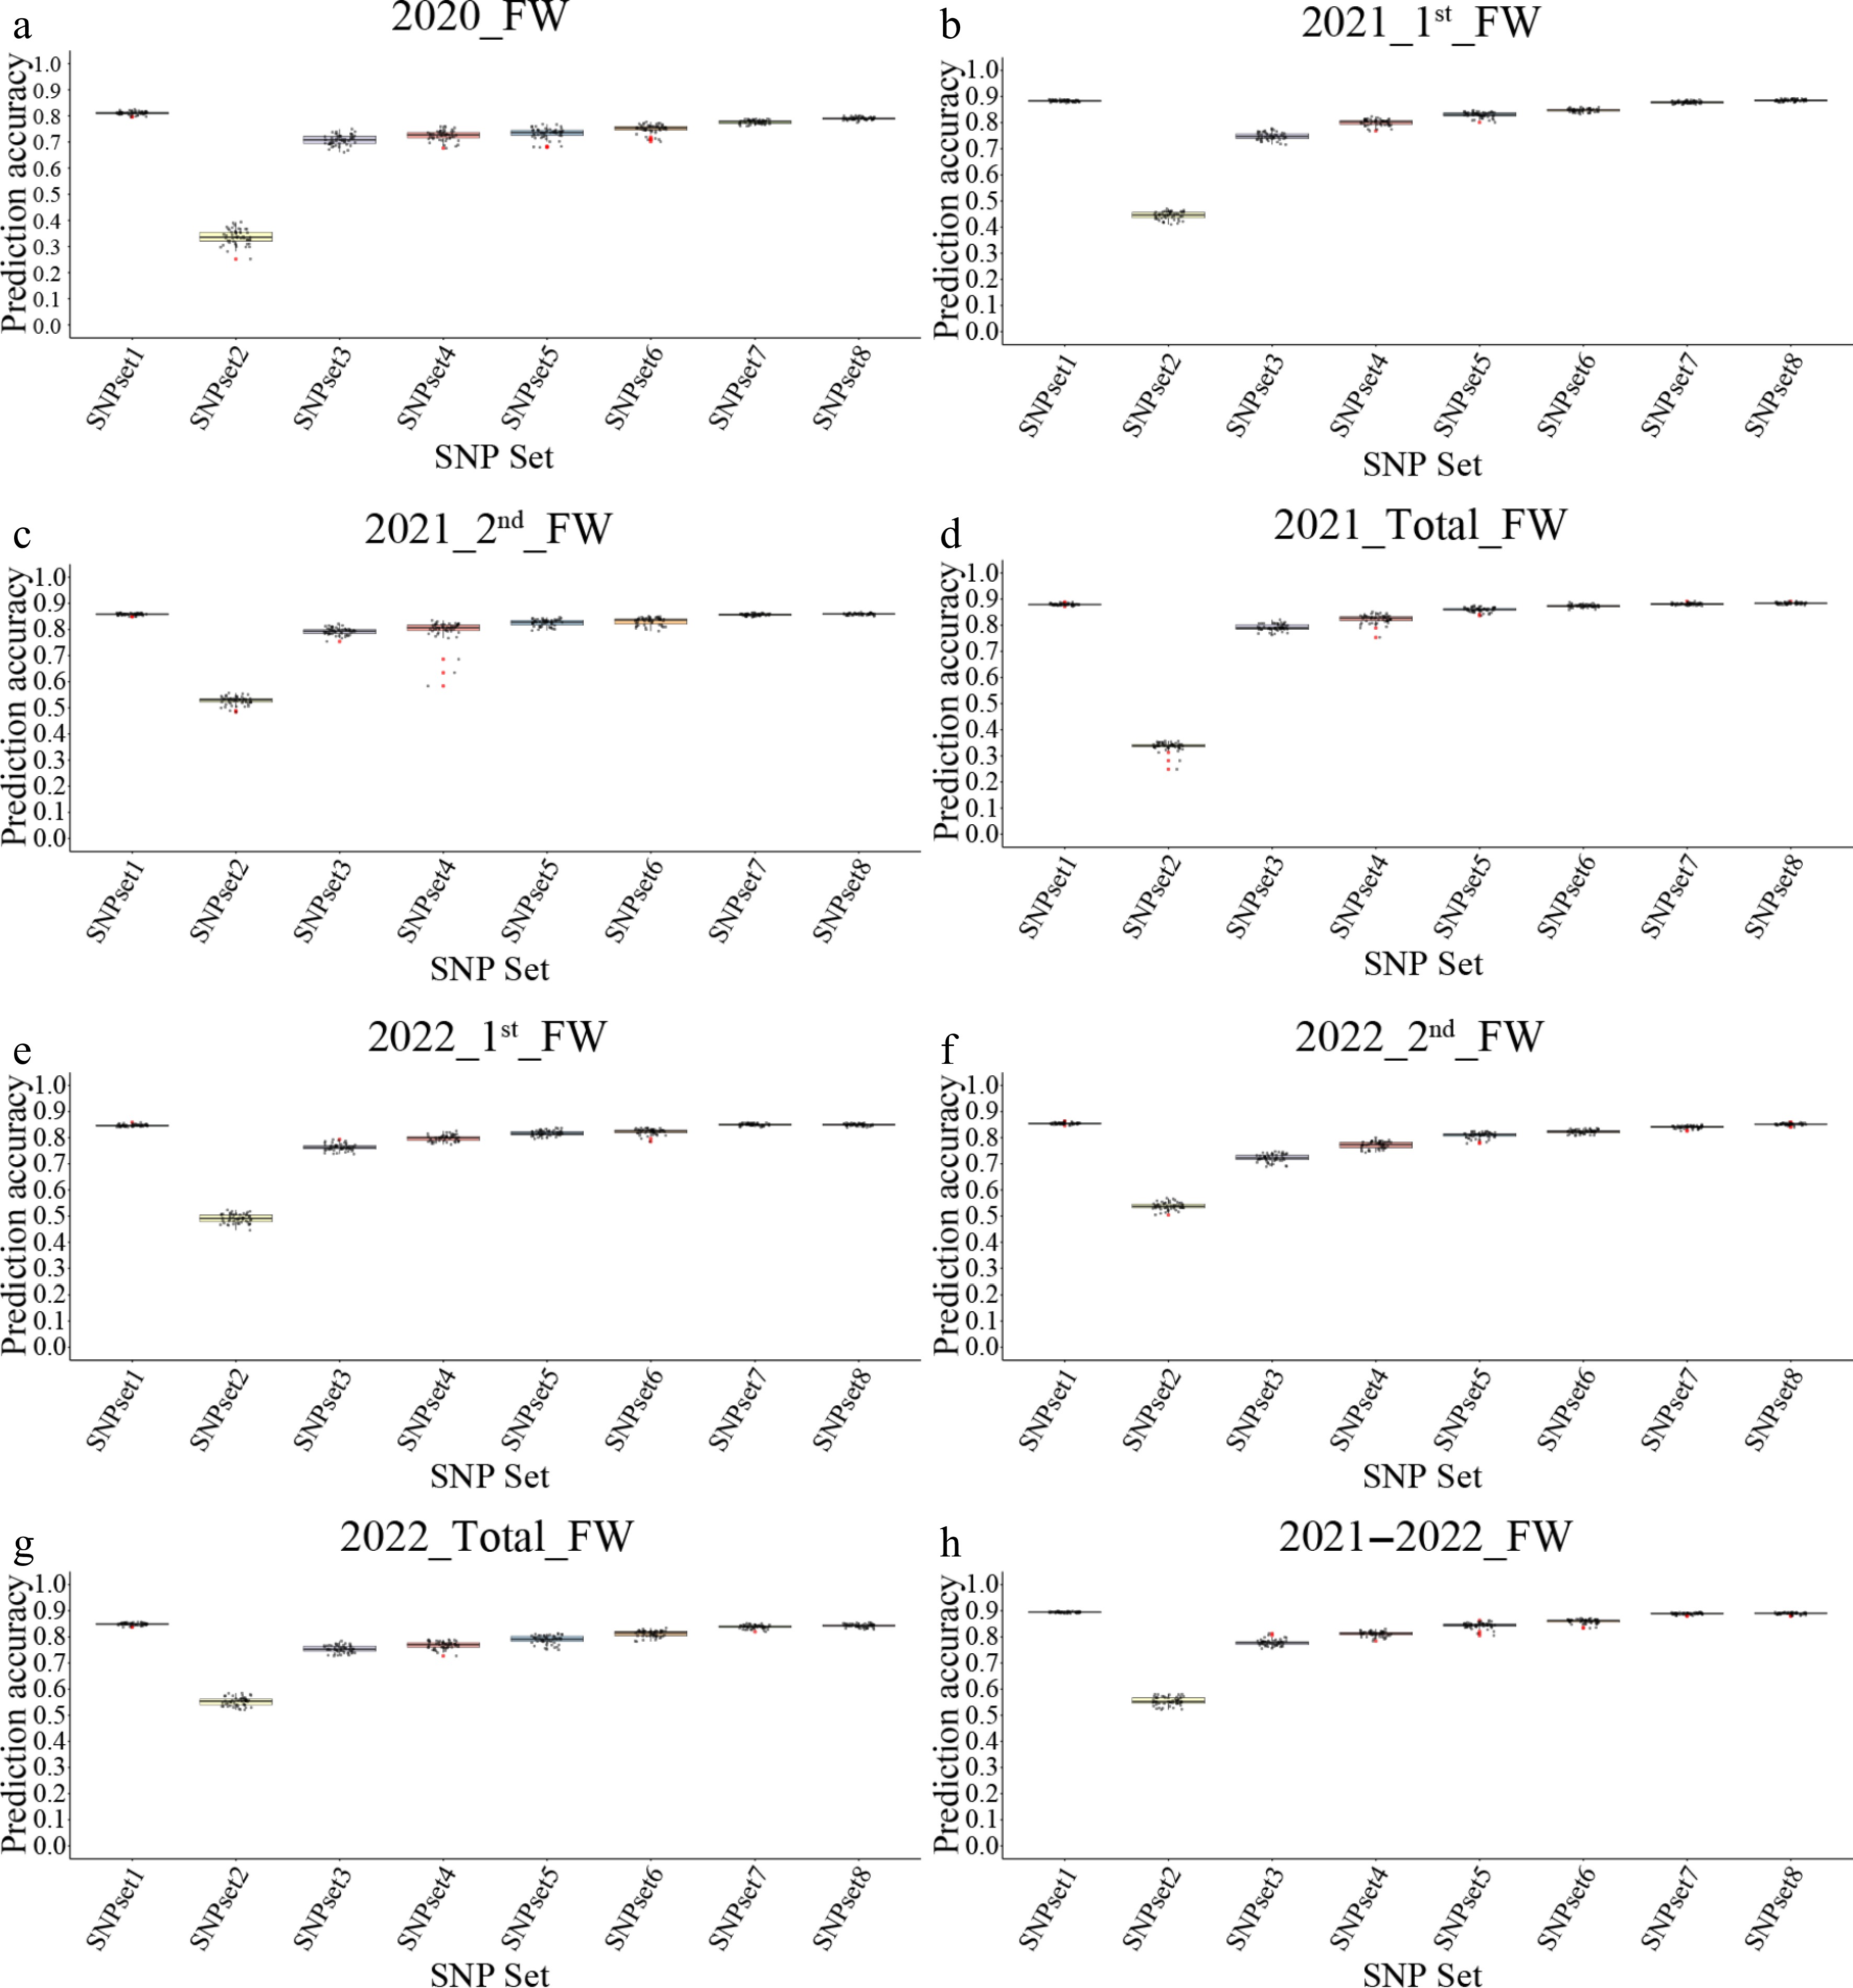
Figure 5.
The prediction accuracy of the weight-gBLUP models by using different SNP sets. (a)–(h) Represent the genomic selection (GS) results for different traits, corresponding to 2020_FW, 2021_1st_FW, 2021_2nd_FW, 2021_total_FW, 2022_1st_FW, 2022_2nd_FW, 2022_total_FW, and 2021–2022_FW, respectively.
-
Trait 2020_FW 2021_1st_FW 2021_2nd _FW 2021_Total_FW 2022_1st_FW 2022_2nd _FW 2022_Total_FW 2021-2022_FW Max 400 850 450 1,120 684 447 1,019 1,120 Min 20 110 40 200 112 46 165 165 Ave. 133.97 339.49 178.66 517.96 335.86 188.14 523.39 520.68 SE 1.98 3.46 1.74 4.14 2.83 1.85 3.82 2.82 CV (%) 51.89 35.73 34.43 27.96 29.59 34.36 25.62 26.8 σ2g 733.50 ± 115.76*** 2,028.52 ± 417.90*** 481.15 ± 106.55*** 2,731.36 ± 582.07*** 1,825.18 ± 329.27*** 856.31 ± 148.04*** 3,689.17 ± 630.95*** 2,002.36 ± 456.00*** σ2gy − − − − − − − 1211.48 ± 359.99** σ2Ɛ 1,353.99 ± 61.52 10,076.00 ± 453.81 2,789.18 ± 125.55 14,255.73 ± 643.20 6,305.04 ± 283.56 2,395.75 ± 108.47 10,448.46 ± 470.62 12,473.92 ± 398.39 H2 0.8298 0.6444 0.6082 0.6329 0.7226 0.7629 0.7606 0.6065 SE is the standard error, CV is the coefficient of variation, σ2g is the genotypic variance; σ2gs is the genotypic × cut interaction variance; σ2gy is the genotypic × year interaction variance; σ2gcy is the genotypic × cut × year interaction variance; σ2Ɛ is the environmental variance; H2 is the broad-sense heritability. 2020_FW, 2021_1st_FW, 2021_2nd_FW, 2021_Total_FW, 2022_1st_FW, 2022_2nd_FW, 2022_Total_FW, and 2021–2022_FW represent the FW data from the first cut in 2020, the first cut in 2021, the second cut in 2021, the sum of the two cuts in 2021, the first cut in 2022, the second cut in 2022, the sum of the two cuts in 2022, and the integrated value for 2021–2022, respectively. '*' shows there were significant variations among 136 half-sib families ( *** p < 0.001; ** p < 0.01; * p < 0.05). Table 1.
The genotypic variance component of the FW trait of M. sativa half-sib families at Yuzhong in 2020–2022.
-
Traits SNP number FarmCPU GLM MLM 10−5 10−4 10−3 0.05 10−5 10−4 10−3 0.05 10−5 10−4 10−3 0.05 2020_FW 2 23 251 10,554 0 10 179 10,518 0 4 162 9,973 2021_1st_FW 7 17 214 10,563 7 10 143 10,295 6 11 132 9,884 2021_2nd_FW 0 16 221 10,561 0 8 152 10,420 0 6 137 9,991 2021_Total_FW 3 27 221 10,543 0 16 146 10,276 0 16 140 10,137 2022_1st_FW 2 21 206 10,562 0 13 113 9,836 0 13 113 9,836 2022_2nd_FW 1 24 197 10,559 0 11 144 10,173 0 11 144 10,173 2022_Total_FW 3 24 182 10,549 0 14 119 10,222 0 13 120 10,161 2021–2022_FW 3 22 214 10,558 0 14 139 10,568 0 9 126 10,100 The definitions of abbreviations for each environmental trait (such as 2020_FW, 2021_1st_FW, 2022_Total_FW) are the same as those provided in Table 1. 10−5, 10−4, 10−3, and 0.05, represent that the set thresholds for p-value are 0.00001, 0.0001, 0.001, and 0.05 respectively. Table 2.
The numbers of SNP associated with yield traits by using different thresholds.
-
Models 2020_FW 2021_1st_FW 2021_2nd_FW 2021_Total_FW 2022_1st_FW 2022_2nd_FW 2022_Total_FW 2021–2022_FW Ave. gBLUP 0.28 0.13 0.11 0.14 0.19 0.14 0.16 0.14 0.16 rrBLUP 0.27 0.14 0.14 0.14 0.17 0.10 0.11 0.13 0.15 BRR 0.27 0.15 0.13 0.13 0.16 0.13 0.12 0.14 0.16 BL 0.19 0.16 0.18 0.17 0.15 0.15 0.14 0.15 0.16 BayesA 0.26 0.16 0.18 0.15 0.17 0.13 0.12 0.15 0.17 BayesB 0.27 0.15 0.16 0.13 0.19 0.10 0.12 0.15 0.16 BayesC 0.27 0.12 0.13 0.15 0.18 0.12 0.12 0.16 0.16 The definitions of abbreviations for each environmental trait (such as 2020_FW, 2021_1st_FW, 2022_Total_FW) are the same as those provided in Table 1. Table 3.
The prediction accuracy of different GS models in different cuts and years.
-
Models 2020_FW 2021_1st_FW 2021_2nd_FW 2021_Total_FW 2022_1st_FW 2022_2nd_FW 2022_Total_FW 2021−2022_FW Ave. Ridge 0.28 0.16 0.15 0.15 0.16 0.12 0.16 0.11 0.16 Kernel ridge 0.26 0.20 0.18 0.17 0.18 0.13 0.17 0.14 0.18 PLS regression 0.25 0.15 0.15 0.15 0.17 0.13 0.15 0.13 0.16 SVR_linear 0.28 0.15 0.14 0.19 0.19 0.14 0.13 0.12 0.17 SVR_poly 0.25 0.16 0.14 0.16 0.17 0.12 0.17 0.14 0.16 Linear 0.27 0.15 0.15 0.15 0.16 0.13 0.16 0.14 0.16 The definitions of abbreviations for each environmental trait (such as 2020_FW, 2021_1st_FW, 2022_Total_FW) are the same as those provided in Table 1. Table 4.
The prediction accuracy of different machine learning models in different environments.
-
Strategy SNP_Set1 SNP_Set2 SNP_Set3 SNP_Set4 SNP_Set5 SNP_Set6 SNP_Set7 SNP_Set8 3-fold 0.25 0.36 0.7 0.72 0.73 0.74 0.78 0.8 5-fold 0.26 0.37 0.71 0.73 0.73 0.75 0.79 0.8 10-fold 0.30 0.40 0.72 0.73 0.74 0.76 0.79 0.81 3-fold, 5-fold, and 10-fold denote k-fold cross-validation strategies. Table 5.
The mean prediction accuracy of seven traditional models by using different SNP sets and validation strategies for the 2020_FW trait.
Figures
(5)
Tables
(5)